Article

Classification of Electronic Devices Using a Frequency-Swept Harmonic Radar Approach

by
Handan Ilbegi
1,2,
Halil Ibrahim Turan
3,
Imam Samil Yetik
1 and
Harun Taha Hayvaci
3,*
1
Department of Electrical and Electronics Engineering, TOBB University of Economics and Technology, 06560 Ankara, Turkey
2
Department of Electrical and Electronics Engineering, Ankara University, 06830 Ankara, Turkey
3
College of Engineering and Technology, American University of the Middle East, Egaila 54200, Kuwait
*
Author to whom correspondence should be addressed.
Remote Sens. 2022, 14(12), 2953; https://doi.org/10.3390/rs14122953
Submission received: 9 April 2022 / Revised: 13 June 2022 / Accepted: 16 June 2022 / Published: 20 June 2022
(This article belongs to the Special Issue Nonlinear Junction Detection and Harmonic Radar)

Abstract

:
A new method to classify electronic devices using a Frequency-Swept Harmonic Radar (FSHR) approach is proposed in this paper. The FSHR approach enables us to utilize the frequency diversity of the harmonic responses of the electronic circuits. Unlike previous studies, a frequency-swept signal with a constant power is transmitted to Electronic Circuits Under Test (ECUTs). The harmonic response to a frequency-swept transmitted signal is found to be distinguishable for different types of ECUTs. Statistical and Fourier features of the harmonic responses are derived for classification. Later, the harmonic characteristics of the ECUTs are depicted in 3D harmonic and feature spaces for classification. Three-dimensional harmonic and feature spaces are composed of the first three harmonics of the re-radiated signal and the statistical or Fourier features, respectively. We extensively evaluate the performance of our novel method through Monte Carlo simulations in the presence of noise.

Graphical Abstract

1. Introduction

Harmonic radar, or nonlinear radar, is a radio frequency (RF) wave-based surveillance technology that exploits re-radiation of RF waves at harmonic frequencies from nonlinear targets [1,2]. Most man-made targets, such as electronic devices and mechanical metal structures, are nonlinear targets. Mechanical metal structures contain metal–metal junctions, whereas electronic devices contain nonlinear circuit components such as diodes, semiconductors, mixers, amplifiers, transistors, etc. Both metal–metal junctions and nonlinear circuit components exhibit nonlinear current–voltage (I–V) relationships that cause the re-radiation of RF waves at harmonic frequencies of the incident wave [3,4,5,6,7,8]. The re-radiated RF wave from a nonlinear target depends on the harmonic characteristics of the target, which can be utilized to detect, track, and classify this type of target using harmonic radar [9,10]. One of the significant advantages of harmonic radar is its high clutter rejection; it utilizes re-radiated RF waves at the harmonic frequencies of the transmitted frequency, while echoes and clutter are due to natural obstacles which do not result in re-radiation of RF waves at the harmonic frequencies of the transmitted signal [11,12]. In addition, harmonic radar has the potential to yield more information about the target by exploiting re-radiated RF signals at the harmonic frequencies of the transmitted signal with varying power and frequency [2,9]. On the other hand, one of the main challenges in harmonic radar is that the re-radiated signal power at the harmonic frequencies is weak, and thus the signal-to-noise ratio (SNR) on the receiver side is low [13]. In addition, highly sensitive components are used at the receiver, and thus the performance of the system is decreased in the presence of Radio Frequency Interference (RFI) [14].
Exploiting re-radiated signals at harmonic frequencies allows harmonic radar to be used in a wide variety of applications. In agriculture, harmonic radar is employed to avoid crop damage by insects [15,16,17,18,19,20,21,22]. Nonlinear compatible tags are placed on insects to track and distinguish them from clutter-rich environments using harmonic radar. In the automotive industry, nonlinear tags are mounted on automobiles and people to prevent fatal accidents by identifying high-risk targets using harmonic radar [23]. Moreover, locating buried assets is another application of harmonic radar. Water supplies and energy resources such as natural gas and refined petroleum are transported through underground pipelines. It is difficult to determine the positions of these pipelines accurately in urban areas, and thus harmonic Radio Frequency Identification (RFID) tags are used for detecting the locations of the complex underground pipeline network [24], minimizing accidental breakage of pipelines during excavation. Harmonic RFID systems are applicable in these and many other sensing applications, as they provide low self-jamming, accurate location information, and high resistance to phase noise [25]. In addition, harmonic radar has unique usage in security and military applications such as detecting hidden improvised explosive devices, weapons, and other man-made objects in clutter-rich environments [4,26,27,28].
Detecting electronic targets is one of the most popular applications of harmonic radar. The re-radiated signal from nonlinear devices is analyzed by transmitting different types of waveforms to the targets. Transmitting a single-tone waveform to the device under test and analyzing the harmonics of the fundamental frequency are commonly-used techniques in harmonic radar [9,10,11,15,16,17,18,19,29,30,31,32,33]. Another method is to transmit a two-tone signal to the targets and analyze both the harmonics and intermodulation terms of the transmitted frequencies [4,10,23,33,34]. This technique allows for use of a receiver with a narrower bandwidth [5]. Furthermore, multi-tone signals can be transmitted to targets simultaneously in order to detect and discriminate them when using a narrow-bandwidth receiver [5,11,34]. In addition, both the magnitude and phase information are exploited using intermodulation terms, which are helpful in determining the unambiguous range of the target [34]. A simultaneous-frequency harmonic radar has been demonstrated in [34,35] for distinguishing two electronic targets. Furthermore, linear frequency-modulated chirp signals [11,12,33,34,36] and stepped-frequency pulses [11,12,33,34,37,38,39] have been transmitted to targets, enabling both their detection and determination of the range to the targets. Moreover, in [40], a carrier modulation technique was exploited to detect electronic devices remotely using harmonic radar. While the radar transmits a single frequency, the nonlinear target emits intermodulation products of both the transmitted frequency and the device’s emission.
Although several studies have focused on detecting, ranging, and tracking of electronic devices, there have been only a few studies about distinguishing and classifying electronic devices using harmonic radar. For the first time in the literature, multiple electronic devices are characterized here as nonlinear targets with certain features using harmonic radar in an experimental setup where targets are moved in cross and down ranges, changing the distance to the receiving antennas [41]. Sixteen receiving antennas were used to collect the harmonic responses of these targets in order to create different realizations. Later, single-tone signals with varying power were transmitted to the electronic circuits under test (ECUT) in order to distinguish and classify different types of electronic devices. In [29], statistical features such as mean, variance, skewness, and kurtosis were introduced and exploited to distinguish electronic devices by applying power-swept input signals. Received powers at the second, third, and fourth harmonics were analyzed and the Euclidean distances of the statistical features were used to measure the performance of the distinguishing the circuits. In [30], energy levels at the low, middle, and high frequencies of the Fourier transformations of the received power curves at the second, third, and fourth harmonic frequencies were exploited for classification. In [9], the received power values at the second, third, and fourth harmonics were exploited to classify various electronic devices using their statistical and Fourier features in the presence of noise. A linear model was developed and employed in order to estimate the unknown deterministic vector of parameters to be used in distinguishing ECUTs via single-tone transmission case [31]. This newly-developed linear model represents the measurements in terms of an observation matrix and a deterministic vector of parameters in an analytical aspect. Furthermore, in [10], single-tone and two-tone incident signals were transmitted to the ECUTs in order to classify the devices using the same linear model.
Previous studies in the literature have shown that electronic devices with nonlinear circuit components such as diodes, semiconductors, mixers, amplifiers, transistors, etc. can be distinguished and classified by exploiting the harmonic characteristics of these devices, which can be obtained by a harmonic radar receiving the re-radiated wave from these targets [9,10,12,29,30,31,41]. In this study, we develop a novel method to classify various electronic devices using a frequency-swept harmonic radar (FSHR) approach to exploit frequency diversity, unlike previous studies where either power diversity or spatial diversity was exploited. The harmonic characteristics of the ECUTs are conceived using statistical features such as variance, skewness, and kurtosis. In addition, we derive the Fourier features [9] in order to characterize the ECUTs.
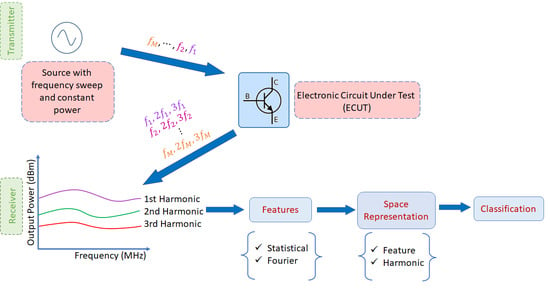
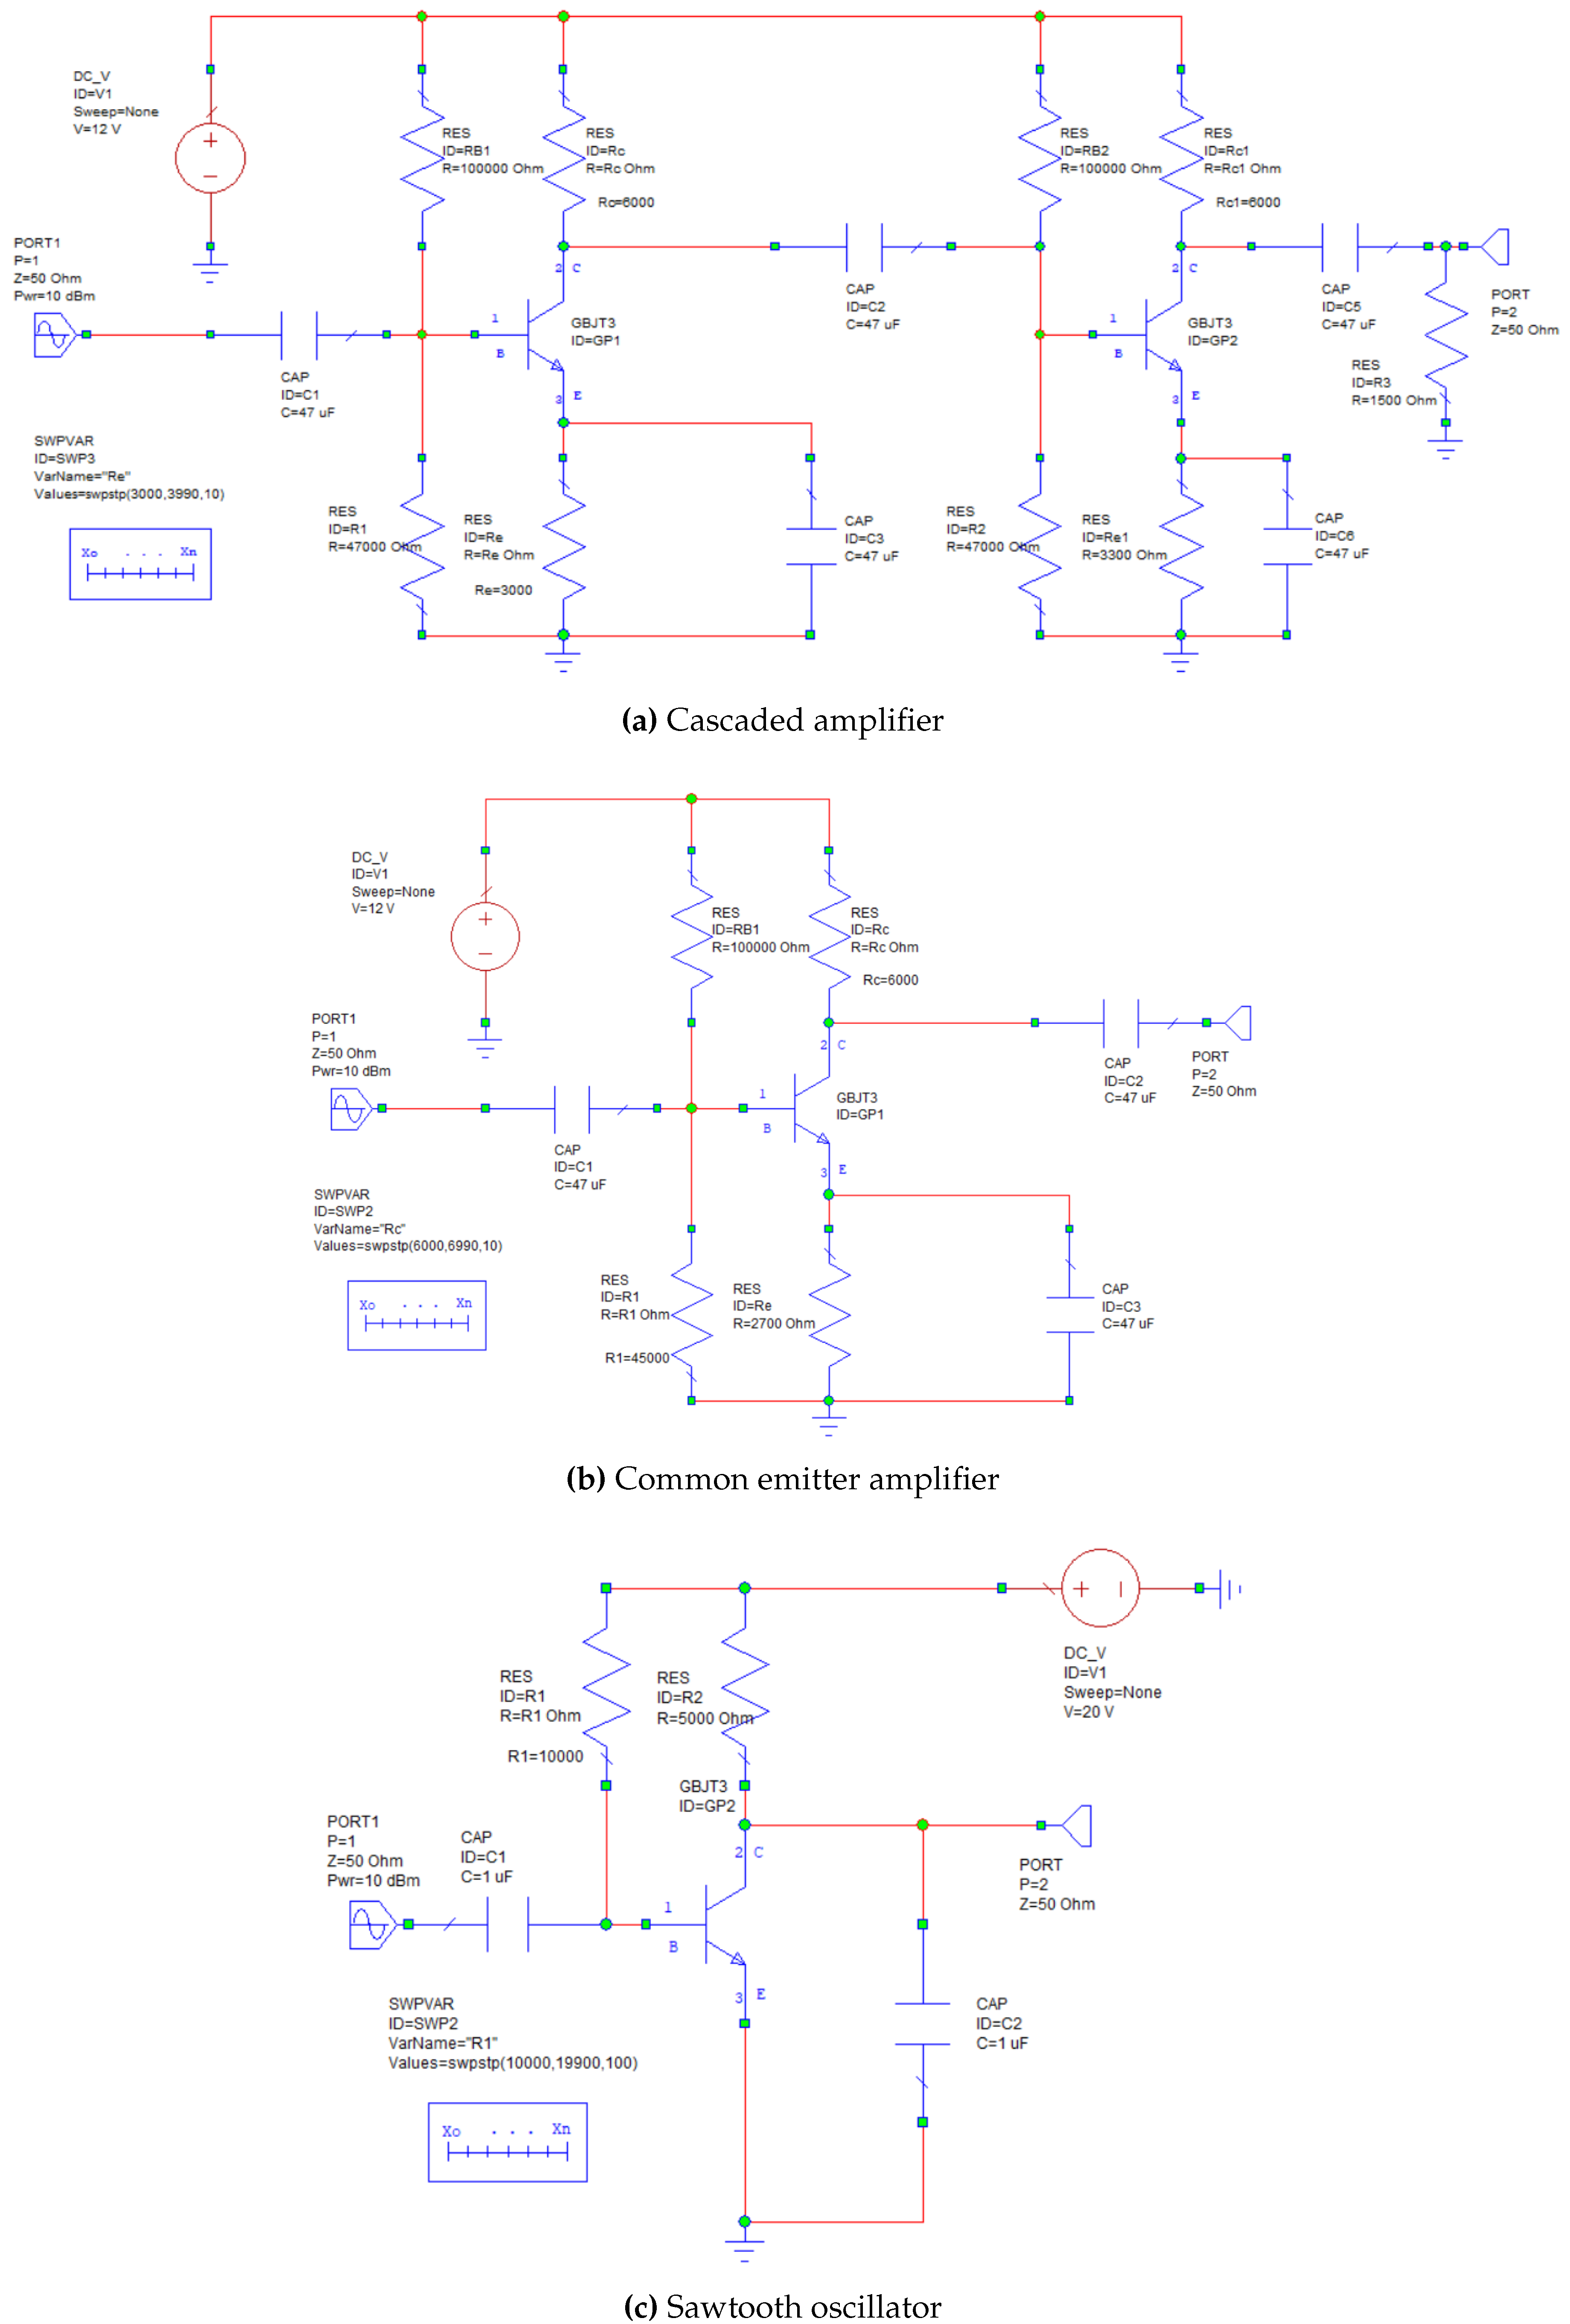
In this paper, three types of electronic devices are classified using a FSHR approach through simulation: a cascaded amplifier, a common emitter amplifier and a sawtooth oscillator. Common emitter amplifiers are one of the most commonly used configuration types in audio frequency (AF) and radio frequency (RF) applications; they both increase the signal strength and provide 180 phase shifting of the input [42,43]. Cascaded amplifiers are multi-stage systems which are used to improve the amplification and attain high gains. Audio amplifiers and RF amplifiers, which require high gain to operate properly, consist of cascaded systems [44]. Sawtooth oscillators are a commonly used oscillator type that can produce sawtooth waveforms from square waves applied to the input. Electronic systems such as control systems, automatic test equipment, and instruments use sawtooth waveforms [45]. Circuit schematics of each type are presented in Figure 1. A set of a large number of circuits was tested for each device type. A frequency-swept signal with a constant power was transmitted to ECUTs and the received signal powers at the first, second, and third harmonics were analyzed using simulations, as illustrated in 
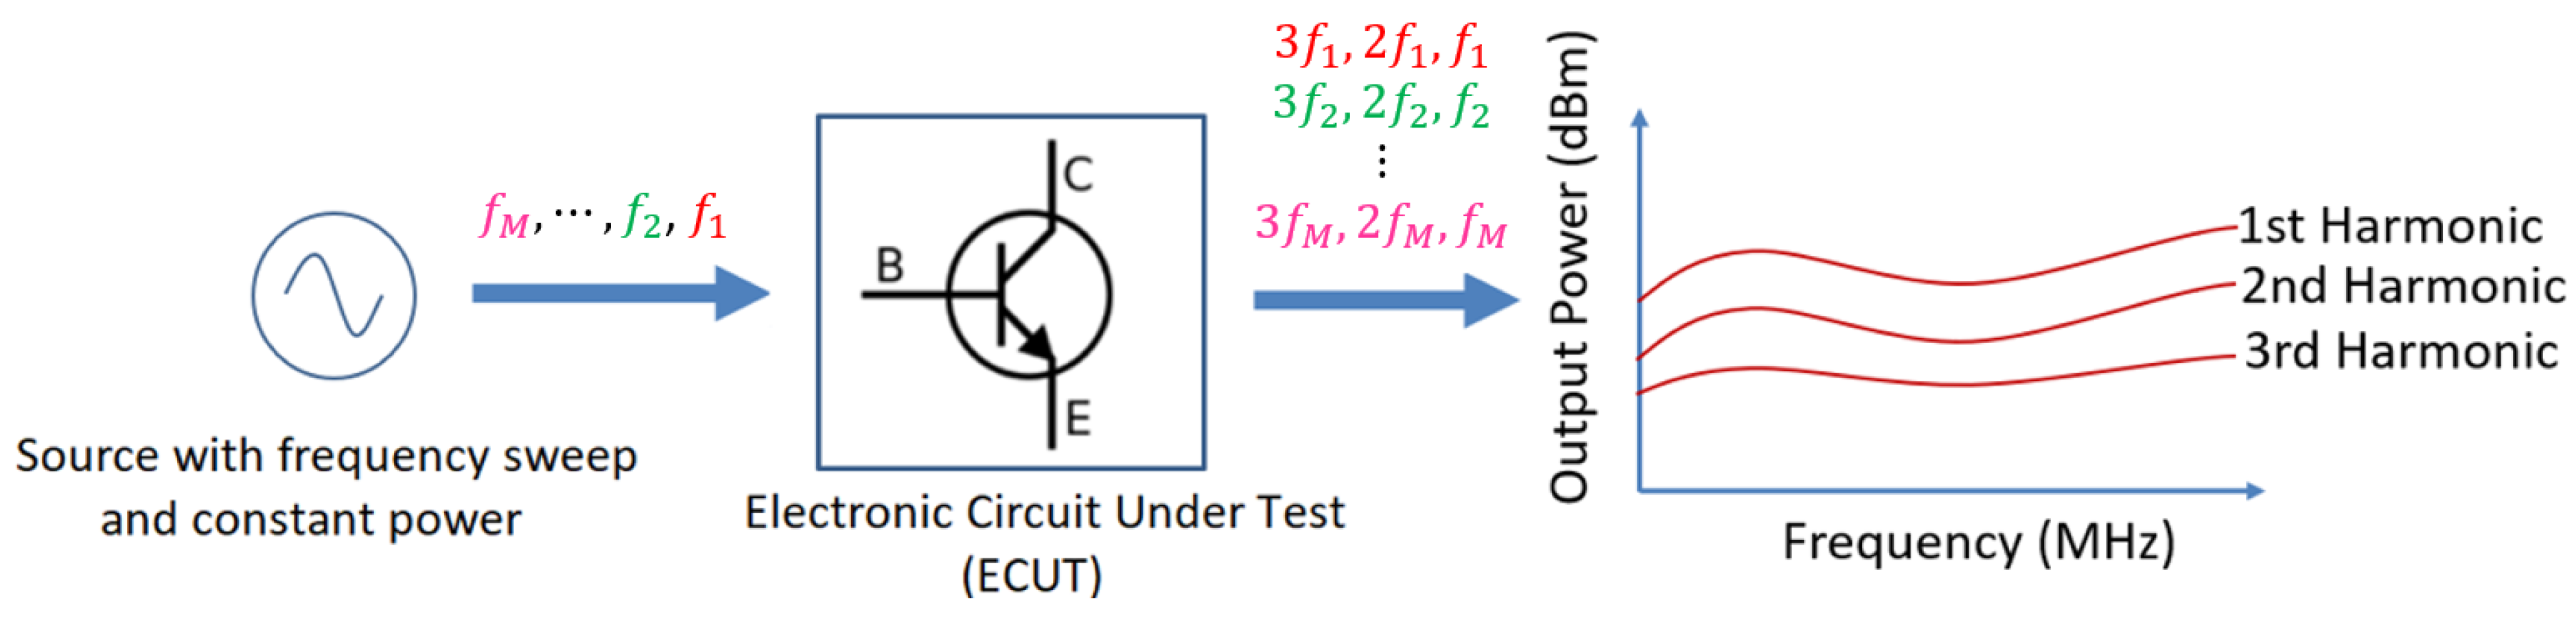
Figure 2. The frequency of the transmitted signal with a constant power value was swept across a wide bandwidth. A signal with the frequency values in this specified range was transmitted to the ECUTs sequentially. Afterward, the statistical and Fourier features of the harmonic responses were analyzed. A kNN (k-Nearest Neighbors) algorithm was utilized to classify the ECUTs. We performed realistic Monte Carlo simulations with additive noise.
The organization of this paper is as follows. In Section 2, the proposed method and background information of this study are briefly explained. In Section 3, the features that we exploited to characterize the harmonic responses of the nonlinear circuits are described. In Section 4, the simulation setup, design of the ECUTs, and their simulated harmonic responses are presented. In Section 5, the classification performance analysis and confusion matrices used to evaluate the effectiveness of the proposed method are presented. In addition, a performance comparison with other relevant studies in the literature is provided. Finally, in Section 6, concluding remarks are provided and future works addressed.

2. Frequency-Swept Harmonic Radar Approach

In harmonic radar phenomena, after a transmitted wave hits a nonlinear target, re-radiation occurs due to the currents induced over the nonlinear target at the harmonic frequencies of the incident wave. We simulate the received signals at the harmonic frequencies based on the currents induced at the harmonic frequencies of the transmitted signal. The re-radiated signal from a nonlinear target includes both the transmitted frequency and integer multiples of the fundamental frequency. On the other hand, the response of a linear target includes only the fundamental frequency components [11]. This is the main starting point for harmonic radar studies. The re-radiated signal from a nonlinear device, in other words, the harmonic response, is represented by a Taylor series model [2,3,41]:
s r r ( t ) = p = 1 a p s i n p ( t ) = a 1 s i n ( t ) + a 2 s i n 2 ( t ) + a 3 s i n 3 ( t ) +
where s r r denotes the re-radiated signal from the nonlinear target, s i n represents the incident signal to the target, the a p s are the complex power series coefficients, the linear response of the target is a 1 , and the nonlinear coefficients of the harmonics are { a 2 , a 3 , } .
In this study, the nonlinear characteristics of the circuits are captured by sweeping the frequency of the transmitted signal within a determined range which is a novel approach. Because the re-radiated signals at higher-order harmonic frequencies are weak, the resulting signals of first three harmonics are utilized to classify the ECUTs.
A frequency-swept zero-phase input signal can be expressed as
s i n ( t ) = x 0 sin w i t , i = 1 , 2 , , M
where x 0 is the magnitude of the transmitted signal and w i is the instantaneous transmitted frequency. It is important to note that M frequencies are transmitted to the targets sequentially, not simultaneously with a predetermined step size.
The re-radiated signal from the target can be obtained by substituting (2) into (1). The re-radiated signals of the first, second, and third order harmonics are approximately equal to
s r r ( t ) a 1 x 0 sin w i t + a 2 x 0 ( sin w i t ) 2 + a 3 x 0 ( sin w i t ) 3 s r r ( t ) a 1 x 0 sin w i t + a 2 x 0 2 2 a 2 x 0 2 cos 2 w i t 2 + a 3 3 x 0 3 sin w i t 4 a 3 x 0 3 sin 3 w i t 4
where i = 1 , 2 , , M .
The re-radiation of signals at the harmonics of the transmitted frequency is due to the harmonic characteristics of the target nonlinear devices. Different types of electronic devices have distinctive harmonic characteristics, whereas similar types of devices have similar harmonic characteristics. These unique characteristics of electronic devices are essential to devising descriptive features in order to classify them. Thus, exploiting the harmonics of re-radiated signals enables us to classify various electronic circuits.

3. Features Used for Target Classification

The harmonic characteristics of the ECUTs were gathered by transmitting frequency-swept signals with a constant power to each of the electronic circuits under test. The received powers at the first three harmonic frequencies were then utilized to devise statistical and Fourier features in order to classify the devices.

3.1. Statistical Features

Statistical features are one of the feature sets exploited to classify electronic circuits under test. The statistical features utilized in this study were the variance, skewness, and kurtosis of the received power curves shown in Figure 3, Figure 4 and Figure 5. These features describe the shape of the distribution of power curves and provide distinctive properties to classify various electronic circuits. Each of the received power curves at the first, second, and third harmonics, provided in Figure 3, Figure 4 and Figure 5, is represented with a data vector x = x 1 , x 2 , , x M , where M is the last frequency value within the predetermined transmitted frequency range. Here, x 1 indicates the first output power value corresponding to the first frequency value within range, x 2 shows the second output power corresponding to the second frequency transmitted within range, etc.
The respective variance, skewness, and kurtosis of data vector x are expressed below [46]:
σ 2 = 1 M 1 i = 1 M ( x i μ ) 2 ; S = 1 M i = 1 M ( x i μ ) 3 σ 3 ; K = 1 M i = 1 M ( x i μ ) 4 σ 4
where μ and σ denote the mean and standard deviations of data vector x , respectively. We measure the dispersion of the data via the variance, the asymmetry of the distribution around a sample mean via the skewness, and the peak sharpness and tail length of the data via the kurtosis. In previous studies, these statistical features have proven to be useful in characterize these kinds of data, namely, the power curves of each harmonic [9,10].
The statistical features mentioned above were used to analyze harmonic characteristics of the ECUTs in terms of the re-radiated signal power of various transmitted signal frequencies. Exploiting features which are related to the frequency content has the potential to distinguish the ECUTs [9]. We investigate the aforementioned feature set below in Section 3.2.

3.2. Fourier Features

Here, the statistical features described in Section 3.1 are utilized to depict the distribution of the re-radiated signal power due to various transmitted signal frequencies. However, the information corresponding to the frequency content of these curves is lost when using statistical features. The frequency content of the re-radiated signal power curves in Figure 3, Figure 4 and Figure 5 provides us with additional useful information about the distinctive harmonic characteristics of the ECUTs, as evidenced by the scatter plots [9]. We obtain the relevant frequency content of re-radiated signal power curves via Fourier analysis in order to characterize and classify different types of electronic circuits by analyzing the Fourier features of the received powers shown in Figure 3, Figure 4 and Figure 5. These power curves are considered as distributions. It is assumed that the re-radiated signal power values are measured at times with different incident signal frequencies. Discrete Fourier Transform (DFT) is applied to describe these distributions in the frequency domain. The DFT of the data vector x = x 1 , x 2 , , x M representing each received power curve in Figure 3, Figure 4 and Figure 5 is calculated as
X ( k ) = n = 1 M x n e j 2 π ( k 1 ) ( n 1 ) / M
where k = 1 , , M . M indicates the length of the determined frequency range.
The frequency content obtained by Fourier transform is exploited to classify the ECUTs. We sub-divide the Fourier transform of the received power curves in the low, middle, and high frequency ranges in order to calculate the energy values at each of these frequency levels. This feature indicates how much of the total energy is at the relevant frequency level, and provides a distinctive characteristic of the ECUTs.

4. Simulations

Three different classes of electronic devices, namely, a cascaded amplifier, common emitter amplifier and sawtooth oscillator, were designed in order to analyze the performance of the proposed method. The main nonlinear circuit component that causes harmonic re-radiation in these electronic circuits is the Bipolar Junction Transistor (BJT). The received signal powers at the harmonics were collected using a Harmonic Balance simulator tool in the Cadence AWR Microwave Office Program. AWR enabled us to gather harmonic responses, as would be the case in a real life scenario. Therefore, real-life issues such as the coupling between the elements of the ECUTs and other possible sources of nonlinear responses were all collectively and intrinsically present in the responses that we analyze here. Antennas and free space propagation were not considered in the simulation setup. However, the features in the proposed method do not depend on antennas or free space propagation in the proposed scheme. Although this technique is demonstrated here with certain classes of electronic circuits, it can be utilized in other classes of electronic circuits (devices) that cause harmonic re-radiation upon a transmitted signal.
Schematics of each class of electronic circuits under test are presented in Figure 1. We created a data set of 100 circuits for each 3 different circuit types using Swept Variable Control (SWPVAR) in the AWR Microwave Office Program. The values of randomly selected components were swept to create a set of different circuits for each device type. The device types and their variations were chosen randomly, as the devices to be detected and classified in real life will not be known. While the purpose here was only to collect harmonic responses from all sets of the circuits, this study can be applied to any type of nonlinear circuit.
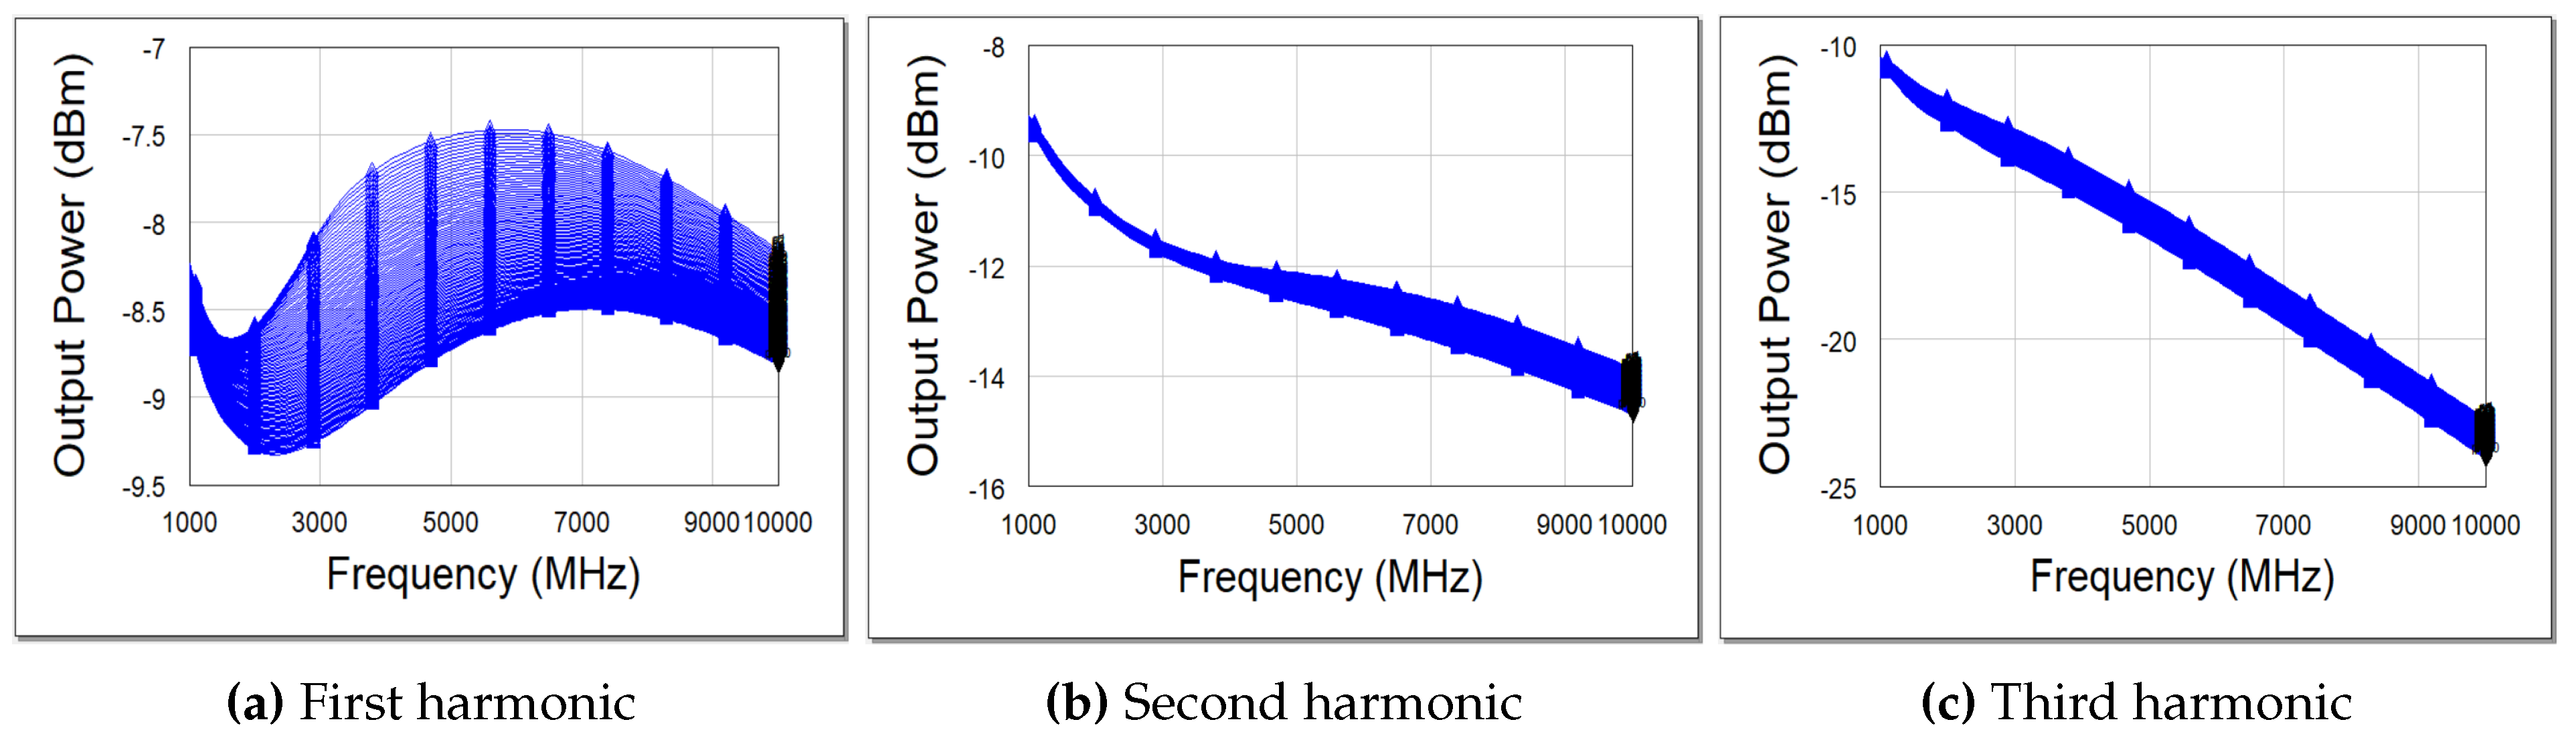
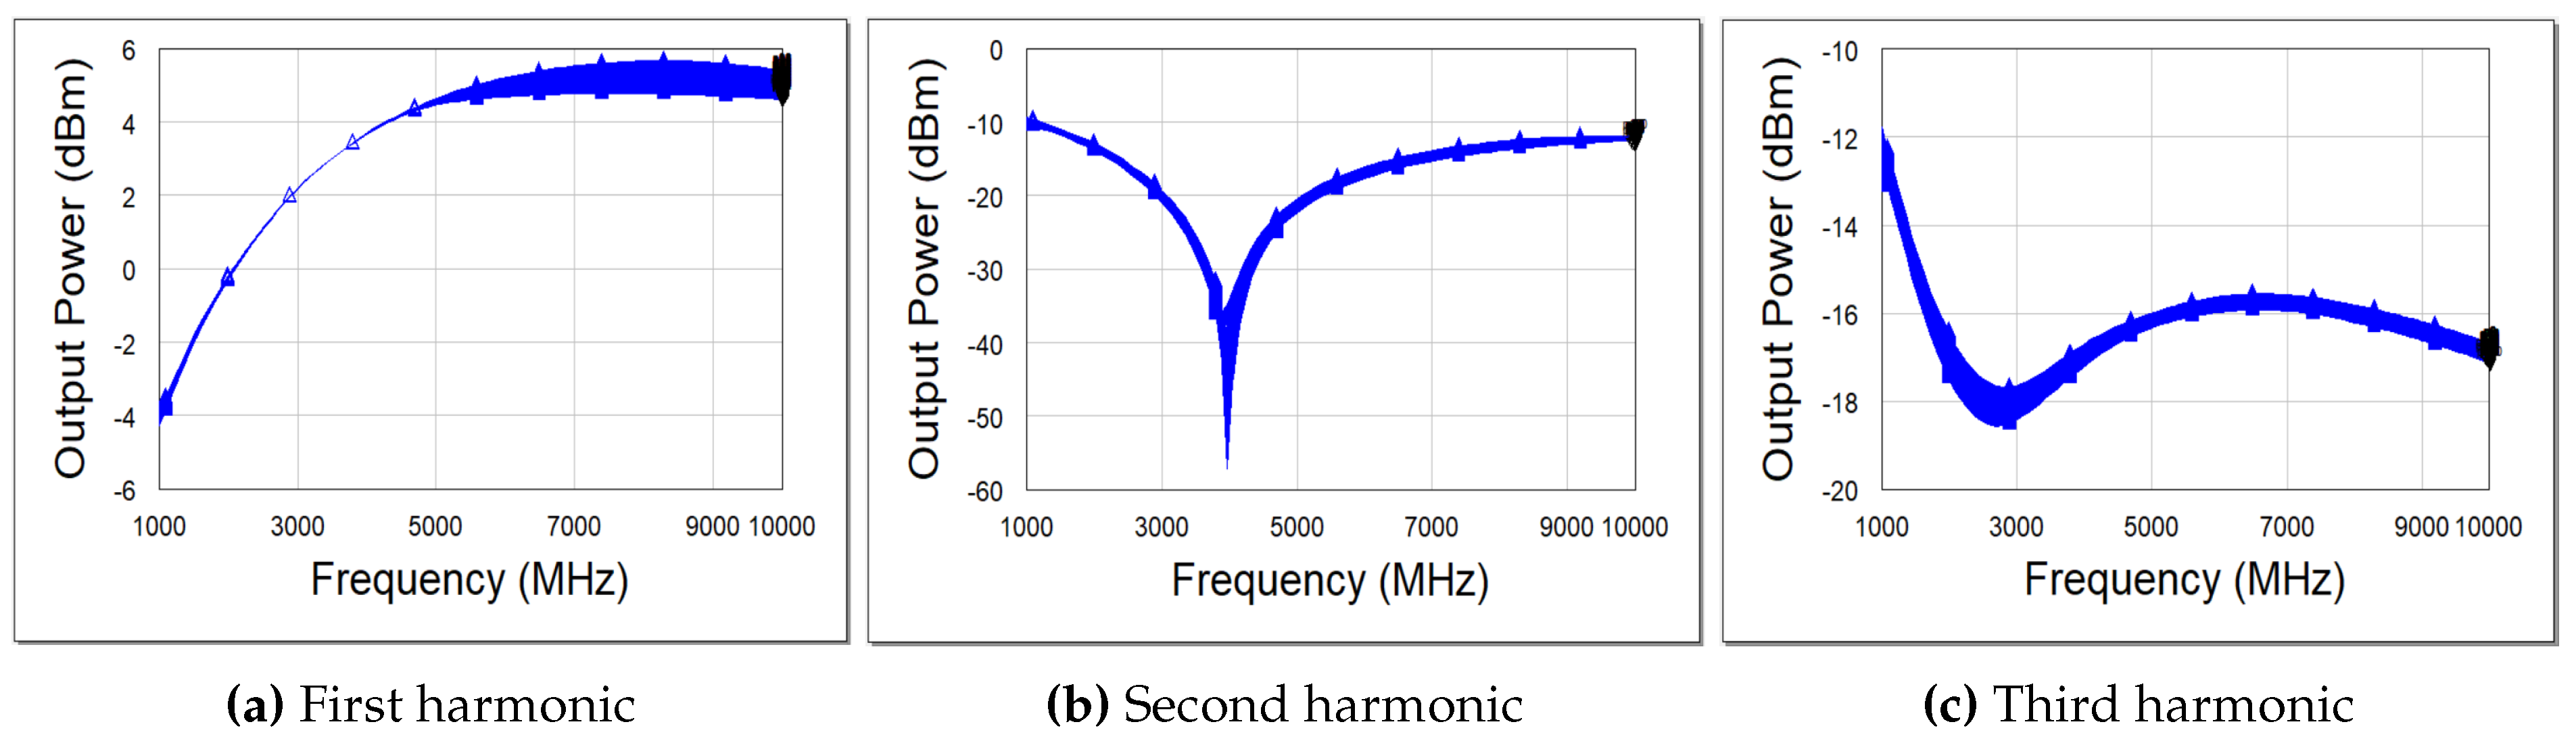
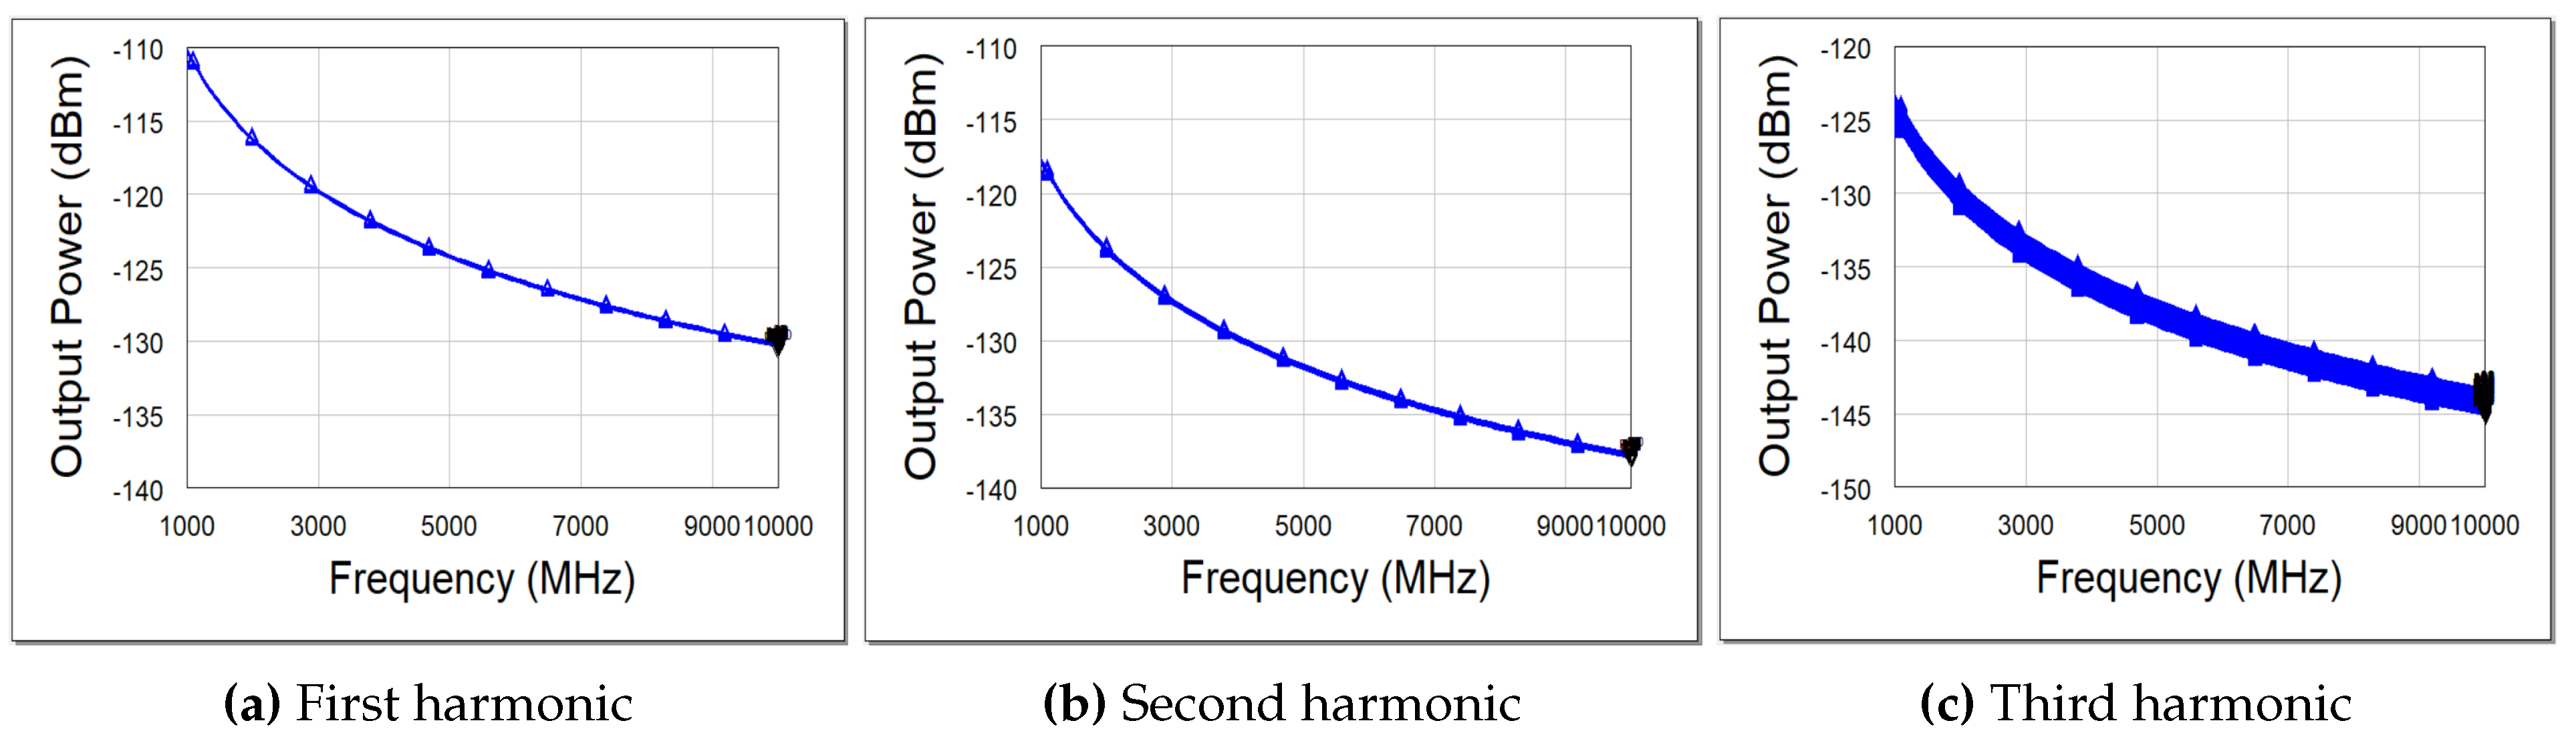
A 10 dBm of constant input power with a frequency-swept signal was transmitted to the nonlinear electronic circuits. We swept the input frequency from 1000 MHz to 10,000 MHz in 90 MHz steps to observe the nonlinear characteristics of the ECUTs. In this study, both the power of the transmitted signal and operating frequency range were arbitrarily chosen. However, the proposed method can be implemented using any input power and frequency range. The simulated received powers at the first, second, and third harmonics with respect to varying input frequency are presented in Figure 3, Figure 4 and Figure 5. The received powers in Figure 3, Figure 4 and Figure 5 are based on noise-free received harmonic signals. However, in the simulations used for performance analysis, complex white Gaussian noise (CWGN) was added to the received harmonic signals. The feature sets, which are discussed in Section 3, were extracted in order to create a data set, then exploited to classify the ECUTs based on the received harmonic signals embedded in the CWGN.

5. Simulation Results and Performance Analysis

In this section, we provide the simulation results and performance evaluation of the proposed method for classifying electronic devices. The results are analyzed in two subsections for each of the statistical and Fourier features of the received power curves at the first three harmonics. A kNN classifier was used to classify the electronic circuits in both subsections. kNN [47] is based on finding the k nearest neighbors by computing the Euclidean distances between the test and training data, which is a widely used and easily applied method in kNN algorithm. According to the shortest Euclidean distances, test data were assigned to one of the three types of electronic circuits. The received power data were collected for a total number of 300 different circuits, with 100 circuits in each device type presented in Figure 1.
Because harmonic radar has the advantage of high clutter rejection and exploits harmonic frequencies over the fundamental frequency, only a thermal noise effect is observed, rather than the more compound noise effect observed in linear radar. Accordingly, complex white Gaussian noise (CWGN) was added to the simulated received signals in order to to analyze the effectiveness of the proposed method for real life scenarios. Here, we present the performance evaluation of the proposed method with scatter plots, confusion matrices, and classification performance plots of each feature set with varying SNR values. Classification performance plots with respect to varying SNR values are presented for both the statistical and Fourier feature sets in the associated subsections. All performance evaluations were conducted through Monte Carlo simulations. The classification performances of the harmonics and features were analyzed individually in order to obtain a clearer understanding of the capability of separate harmonics by not placing all of the features in a single pool.

5.1. Statistical Feature Results

In this section, the statistical features of the received signals discussed in Section 3.1 are exploited to classify electronic targets. The variance, skewness, and kurtosis of the received signal power curves, shown in Figure 3, Figure 4 and Figure 5, are utilized as the features in a 3D harmonic space. We define the 3D harmonic space with first, second, and third order harmonics as in Figure 6 and Figure 7. The scatter plots in Figure 6 and Figure 7 present the variance, skewness, and kurtosis data of the first, second, and third harmonics of the ECUTs with noise levels of SNR = 2 dB and SNR = 14 dB, respectively. It can be seen that the data points in Figure 7 are well clustered compared to the ones in Figure 6 due to the increased SNR level.
We used the 3-nearest neighbor algorithm to classify the ECUTs, which are represented in 3D harmonic space by the variance, skewness, and kurtosis of the received signal power curves of the first three harmonics with respect to the transmitted frequency. Here, we present the classification performance via confusion matrices, which are shown in Table 1 for a noise level of SNR = 8 dB. In this manuscript, we only present confusion matrices for a noise level of SNR = 8 dB; however, it can be observed that the confusion matrices for each statistical feature show successful classification performances at various SNR levels. Thus, at various SNR levels the performance results of 3-nearest neighbor classification via statistical features (variance, skewness, and kurtosis) of the received signal power curves of first three harmonics is plotted in Figure 8. The percentage of the classification performance in Table 1 and Figure 8 are calculated by dividing the number of true positives in each circuit type to the total number of ECUTs. The variance of the harmonic power curves has the highest classification performance. It is further observed that the classification performance for skewness and kurtosis data increases with increasing SNR levels, as expected. It can be seen that the classification performance of the skewness data is better than the kurtosis data at low SNR values. However, the classification performance of the kurtosis data is better than the skewness data at high SNR values.
In addition, a 3D statistical feature space of variance, skewness, and kurtosis is shown in Figure 9. The scatter plots in Figure 9 provide the first, second, and third harmonics of the statistical features. We present scatter plots with a noise level of SNR = 2 dB, as before, for comparison purposes. It can be seen that the scattered data of different classes of ECUTs in Figure 9 are well clustered. However, it is necessary to perform classification of ECUTs through the same algorithm used above in order to assess the effectiveness of the aforementioned representation in 3D statistical feature space in a quantitative manner.
The performance assessment using the 3-nearest neighbor algorithm for the classification of the ECUTs represented in 3D statistical feature space is presented in Table 2 and Figure 10. The data for the second and third harmonics are presented in Table 2 and Figure 10, as the harmonic frequencies of the transmitted signal are of greater interest in harmonic radar phenomena. Specifically, Table 2 shows the confusion matrix results for the second and third harmonic received signals with a noise level of SNR = 8 dB. It can be seen from Table 2 that third harmonic in the variance, skewness, and kurtosis feature space yields better performance than the second harmonic. In Figure 10, the classification performance for the second and third harmonic data with varying SNR values is presented. The classification performance improves with increasing SNR, as expected. It can be observed that the classification performance of the third harmonic data is higher than that of second harmonic data. The classification performance for both second and third harmonic data is above 95% at high SNR values, i.e., above 12 dB.
It is further observed that the classification performance of the data in harmonic space, presented in Table 1 and Figure 8, is better than the performance in statistical space, presented in Table 2 and Figure 10, at both high and low SNR levels. Thus, in this study, we observe that exploiting the statistical data in 3D harmonic space provides better results compares to the statistical data of each harmonic alone when using the FSHR approach.
In addition, we compared the classification performance with existing studies in the literature. There are two main relevant studies that exploit the harmonic radar concept to classify electronic devices. First, in [41], the classification performance of five electronic devices was presented as in Table 3. In [41], received powers with respect to frequency were collected by deploying sixteen receive antennas to obtain different realizations from different angles. Statistical features such as mean, standard deviation, and the minimum and maximum values of the received signal powers were derived and a kNN algorithm was used to classify the targets.
Later, in [9], electronic circuits were classified by exploiting higher order statistical features of the received harmonic power curves of signals re-received from to single-tone power-swept transmitted signals. In [9], instead of using multiple receiver antennas, which provides spatial diversity, a single-tone power-swept signal was transmitted to the electronic devices under test in order to exploit power diversity, which is essential to characterize the I–V relation. In [9], classification performance of three types of electronic devices is presented as in Figure 11.
Unlike [9,41], in this study frequency-swept signals were transmitted to the ECUTs, and the harmonic responses were exploited based on frequency diversity, rather than spatial or power diversity as in [9,41], respectively. It can be seen that the classification performance of the statistical features, such as variance, skewness, and kurtosis, in 3D harmonic space is improved here with respect to the results in [9], particularly at low SNR values, as shown in Figure 8 and Figure 11a.

5.2. Fourier Feature Results

In this section, we present the classification performance of ECUTs based on the Fourier features defined in Section 3.2. The energy values of the Fourier transforms in terms of total energy at different frequency levels were utilized to classify the electronic circuits under test. The whole frequency range of the Fourier transform of the received power values were divided into three equally sized sub-bands. Fourier features indicating how much of the total energy of the Fourier transform was in low, middle, and high frequency levels were obtained. Scattered data at different frequency levels represented in 3D harmonic space with SNR levels of 2 dB and 14 dB, respectively, are presented in Figure 12 and Figure 13. In Figure 12 and Figure 13, it can be clearly observed that the scattered data reveal better clustering as SNR increases.
The performance assessment for the classification of ECUTs with the 3-nearest neighbor algorithm, represented via Fourier features in 3D harmonic space as in Figure 12 and Figure 13, is presented in Table 4 and Figure 14. In Table 4, the confusion matrices for SNR = 8 dB data are presented, indicating that the Fourier features at low, middle, and high frequency levels in first, second and third harmonic spaces have similar classification performance. However, it can be seen that the performance at low and middle frequencies is slightly better than at the higher frequency.
Classification performance when exploiting Fourier features of the data is presented in Figure 14 for varying SNR values. Figure 14 shows that low-frequency Fourier features yield better classification performance than other frequency levels. In addition, low and middle frequency Fourier features in the first, second, and third harmonic spaces show similar performance at higher SNR values.
Moreover, a 3D space of the Fourier features was defined with each harmonic power curve represented in this Fourier feature space in order to classify the ECUTs via the 3-nearest neighbor algorithm. The scattered data for the received signal harmonic power curves at SNR = 2 dB and SNR = 14 dB, respectively, are presented in Figure 15 and Figure 16. It is notable that in this Fourier feature space the scattered data reveal good clustering as SNR increases.
The performance analysis of ECUT classification via Fourier feature space is presented as a confusion matrix at SNR = 8 dB and a chart for varying SNR values in Table 5 and Figure 17, respectively. From Figure 17, it can be observed that performance for the second harmonic reaches a maximum of 70%, while performance for the third harmonic approaches 100% with increasing SNR values. Even though the classification performance of the third harmonic shows better results than the second harmonic in our simulations, the observed SNR value of the third harmonic might be much lower than that of the second harmonic, as weak signal return is a common drawback in harmonic radar applications; however, highly sensitive receivers can overcome this issue.
The frequency content of harmonic power curves was previously utilized to classify ECUTs in [9]. In [9], the classification performance of ECUTs with Fourier features is presented as in Figure 18. In comparison with Figure 14, in this study we found performance improvement at SNR = 2 dB for the classification of ECUTs via low, middle, and high frequency Fourier features. However, the classification performance using harmonics in Fourier feature space is better in [9].
Table 6 provides the classification performance results for harmonic and feature spaces at SNR = 8 dB. According to Table 6, statistical features show better classification performance than Fourier features in 3D harmonic space at SNR = 8 dB. In addition, the third harmonic yields better results than the second harmonic in both statistical and Fourier feature spaces at SNR = 8 dB.
In real-life scenarios, harmonic signals may occur due to either nonlinear targets or nonlinear components in the transmitter and receiver. It is critical to acquire harmonic signals only from the ECUTs in order to obtain a reliable classification. Thus, high and low pass filters should be utilized accordingly in the transmitter and receiver during any experimental study [5,11,32,41].

6. Conclusions

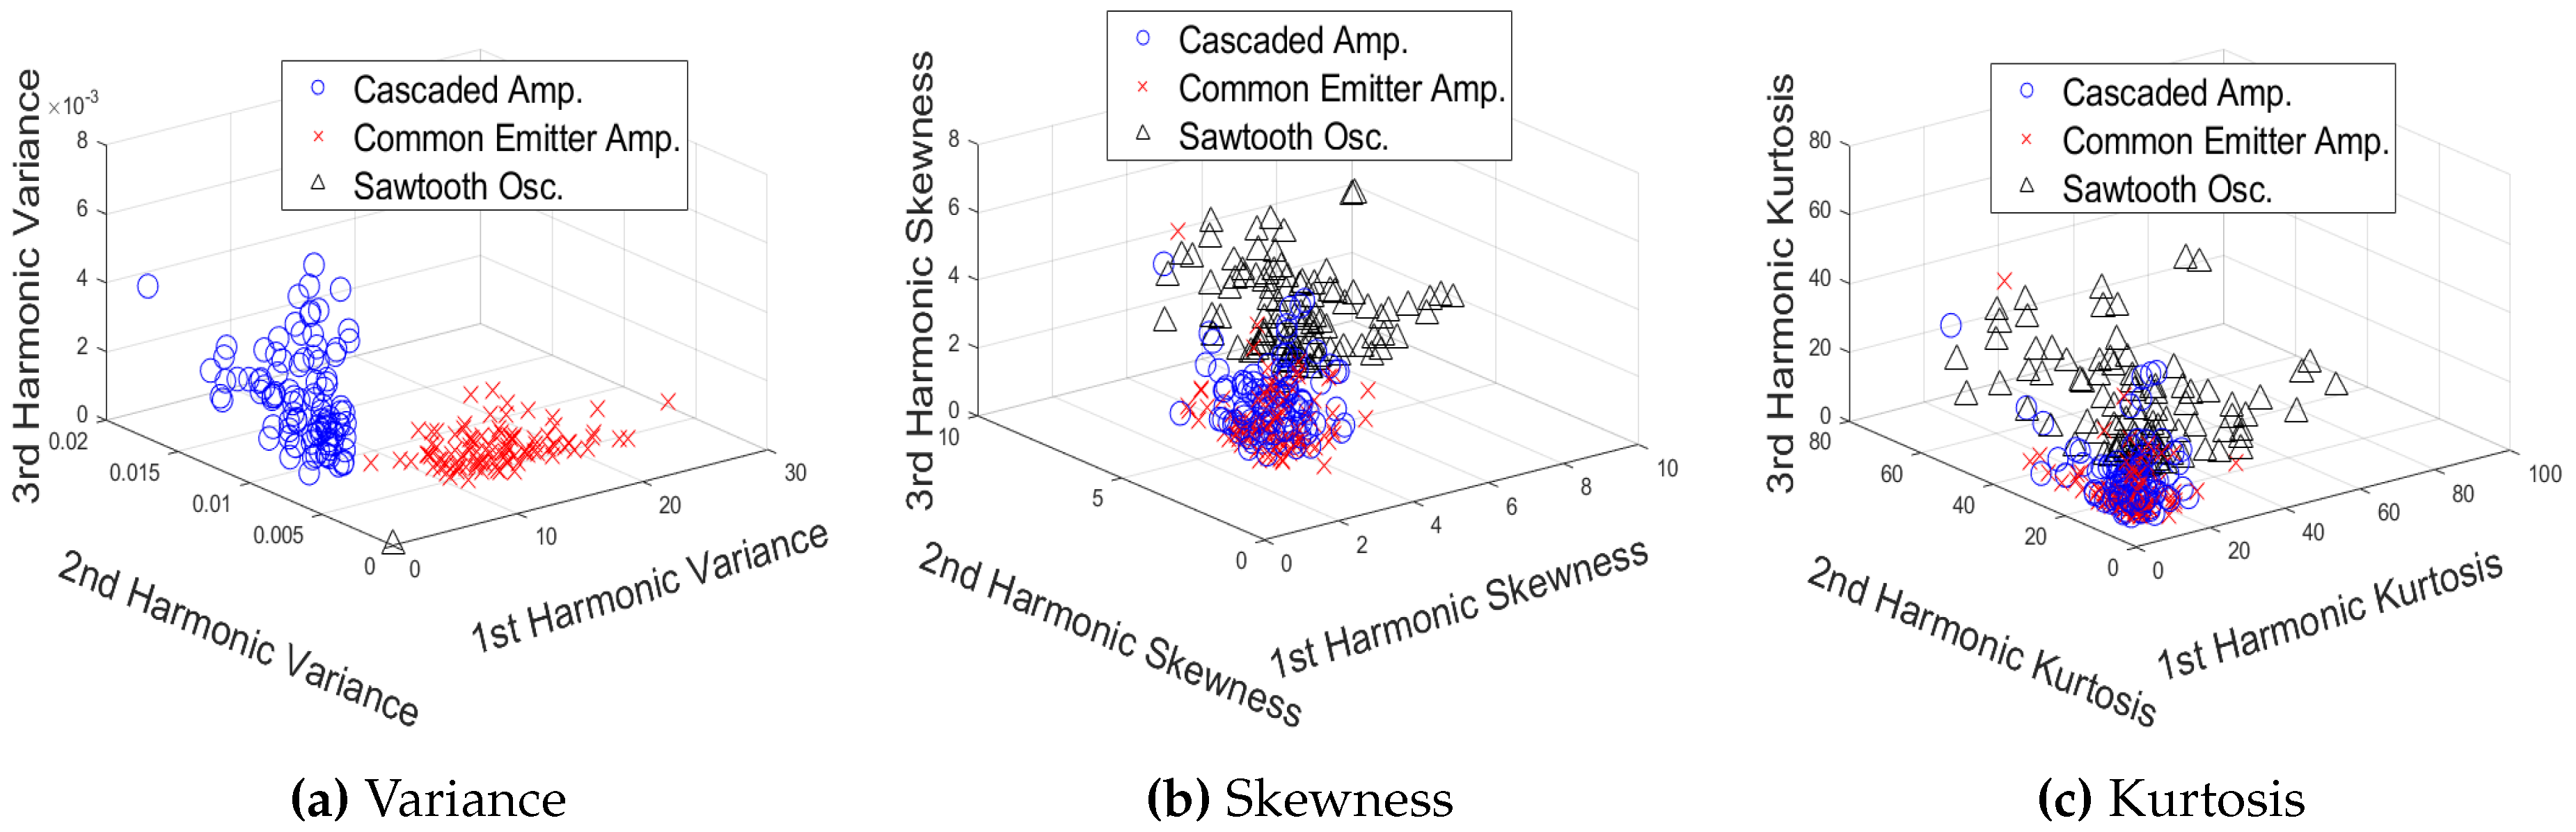
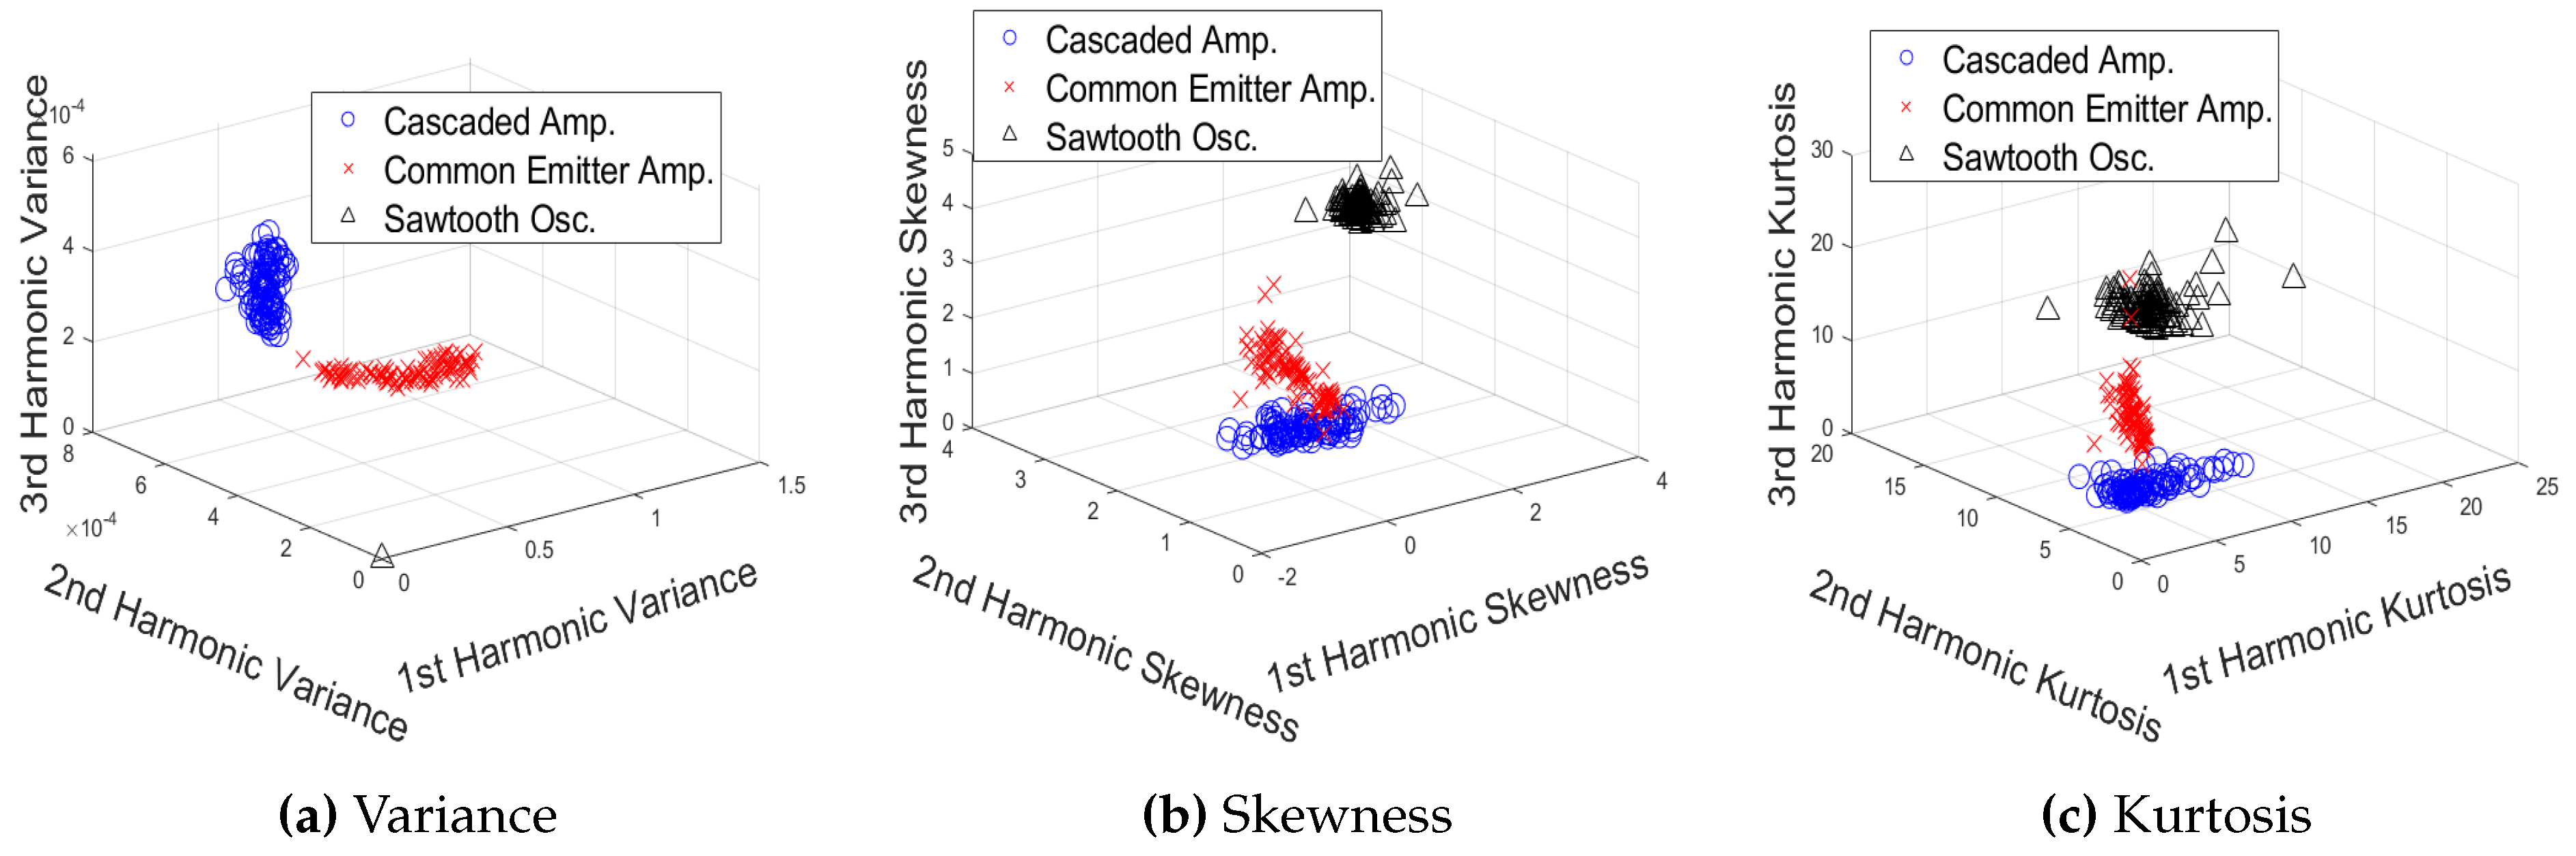
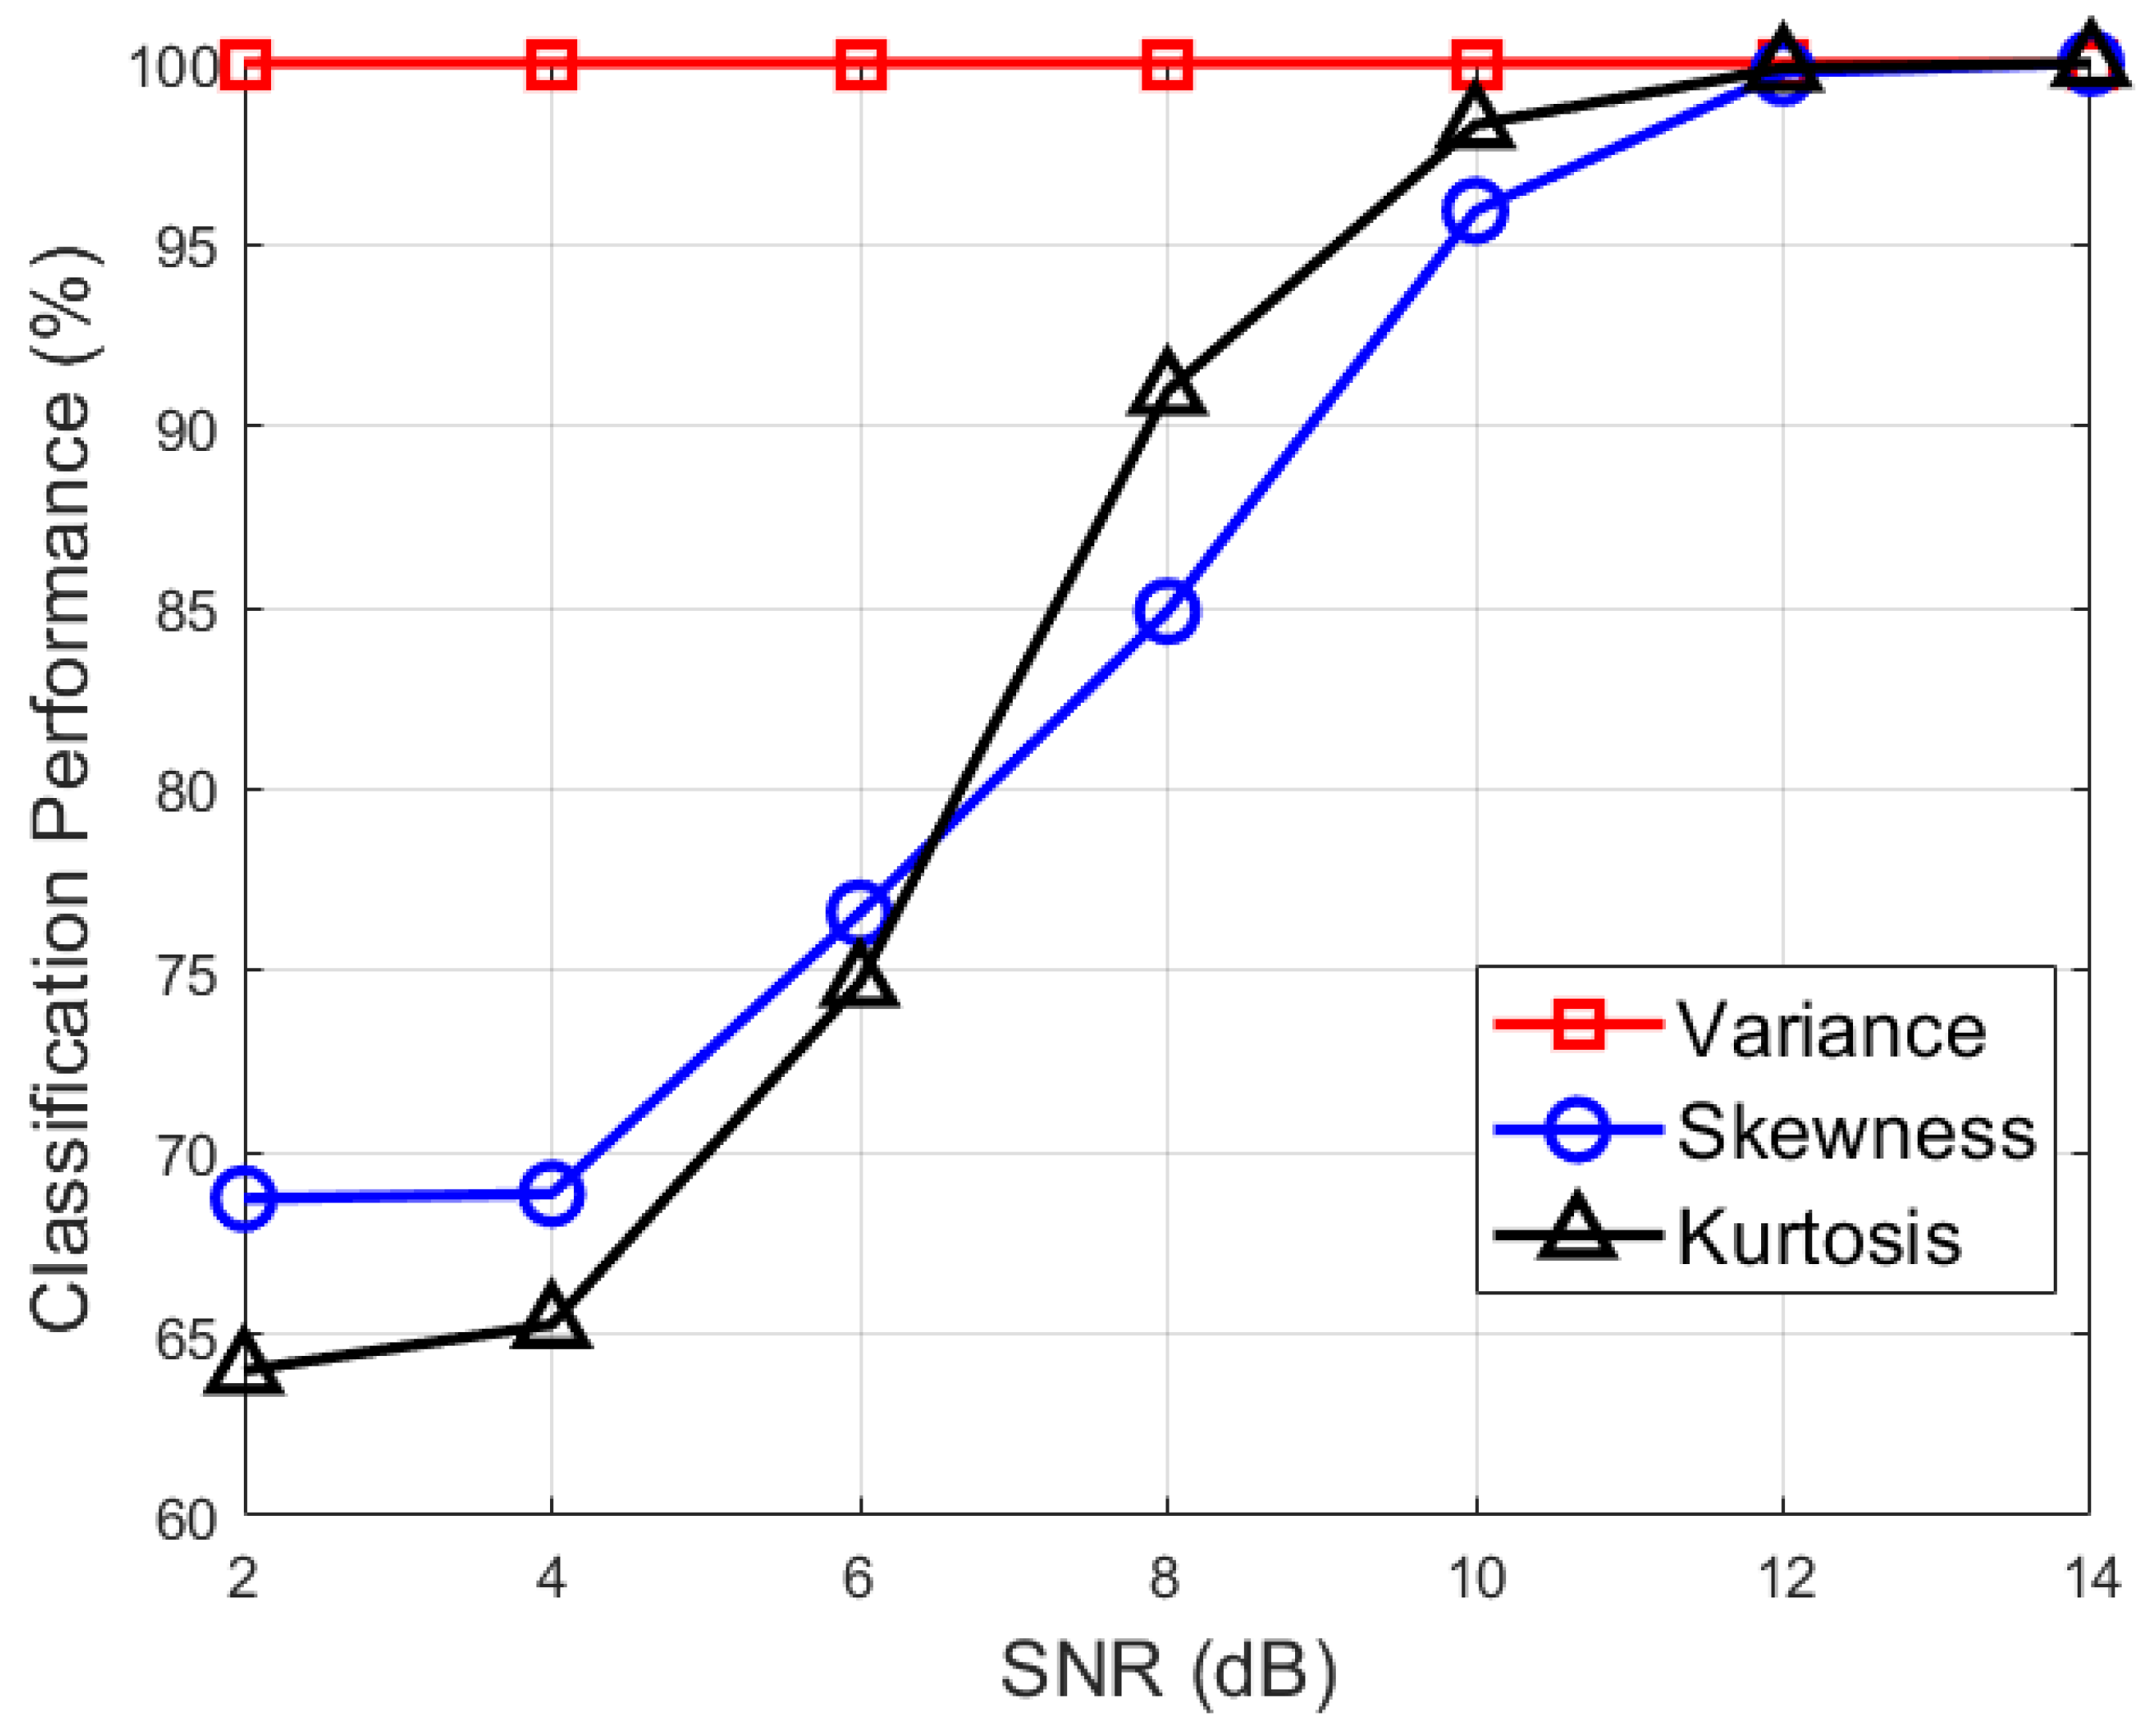
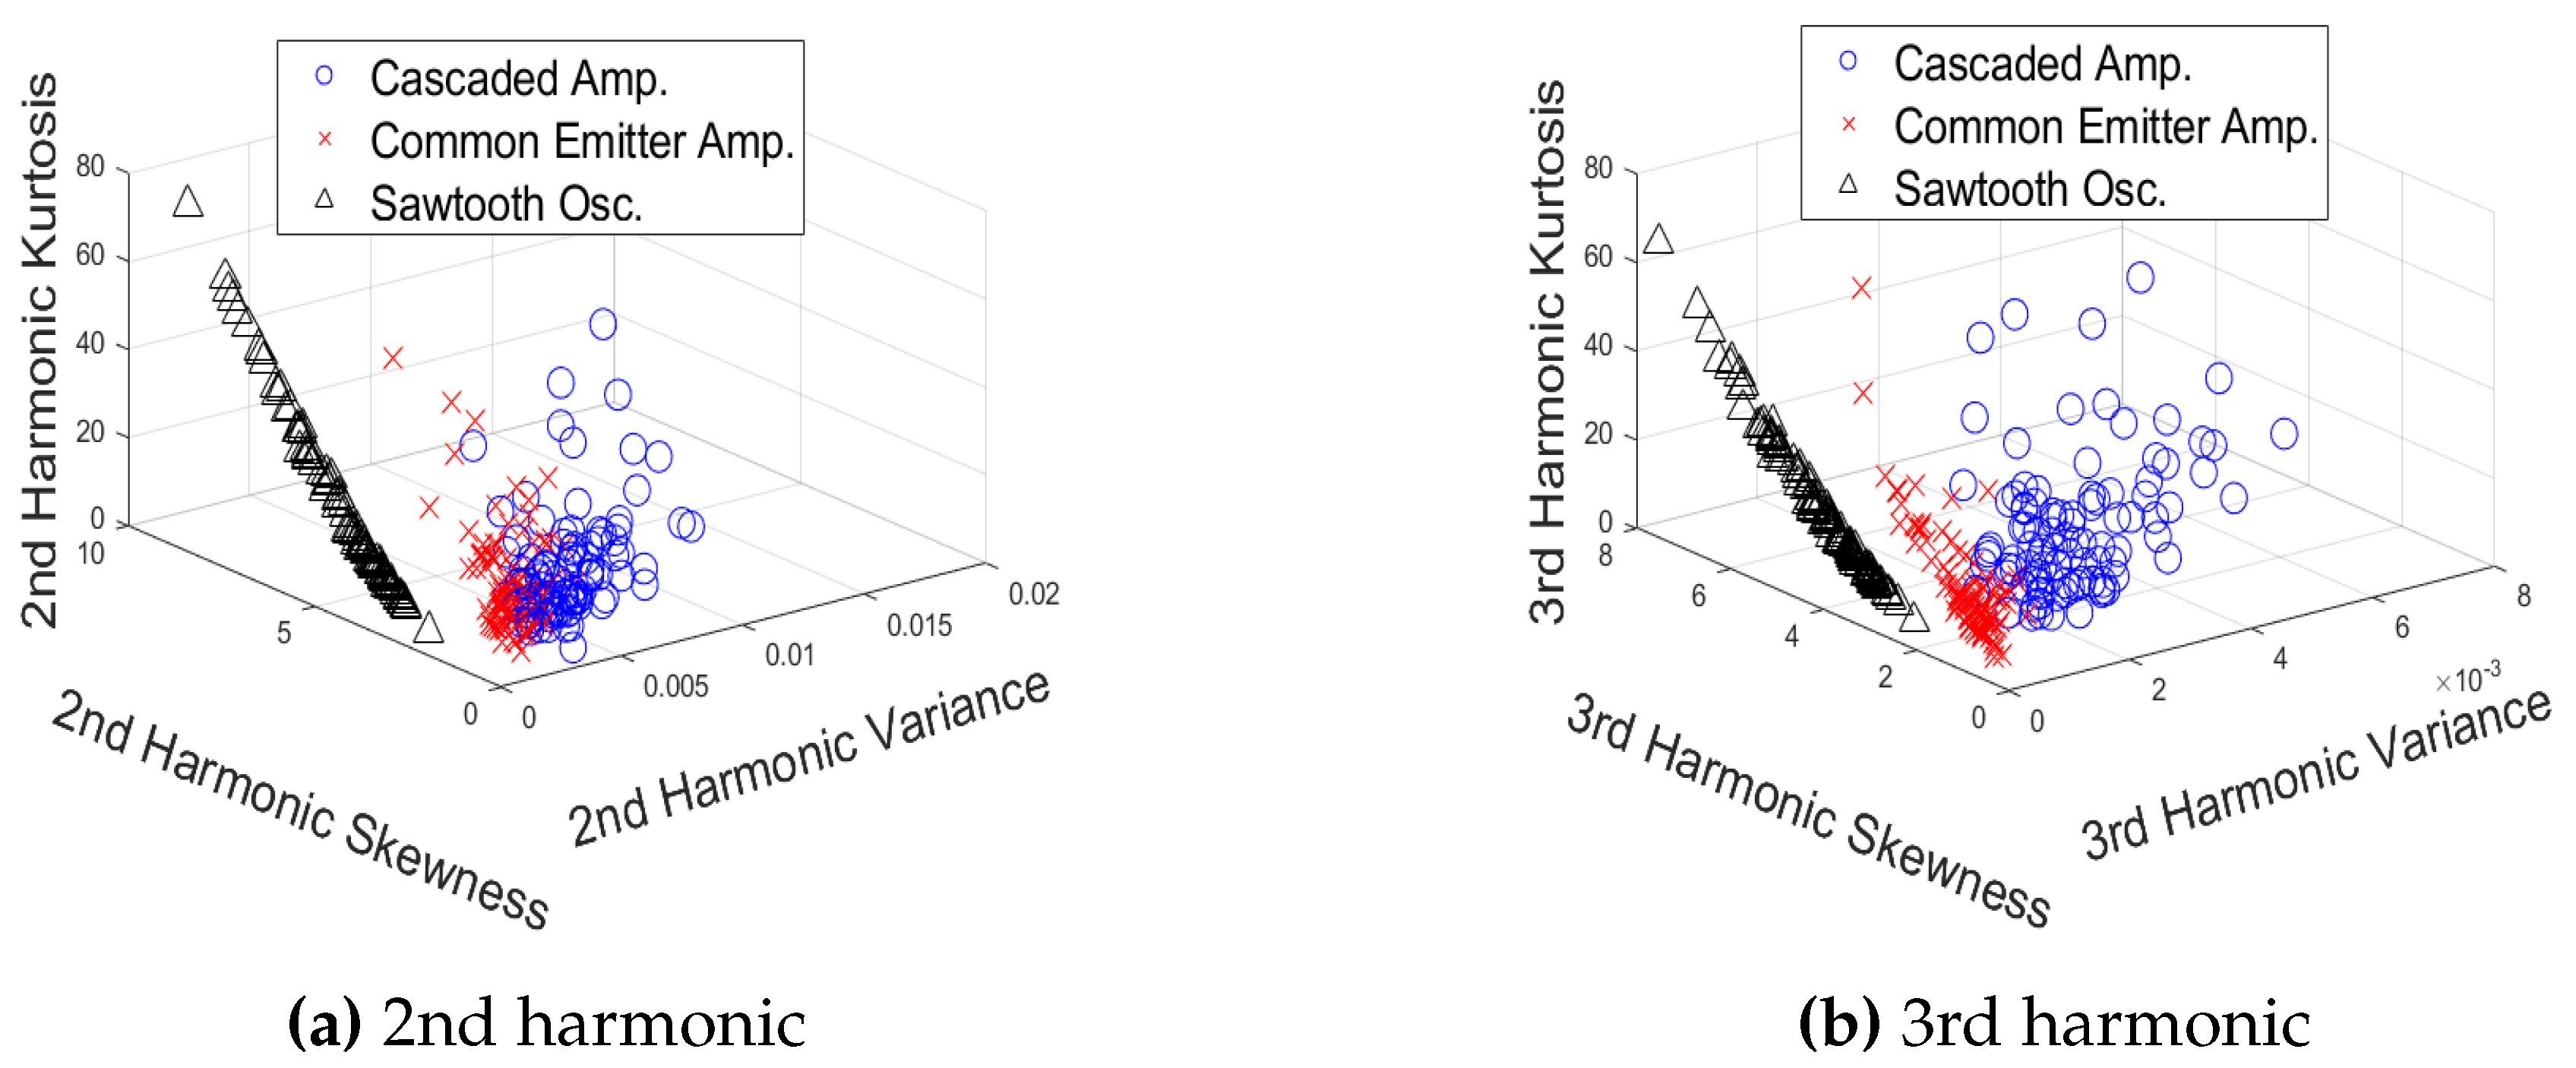
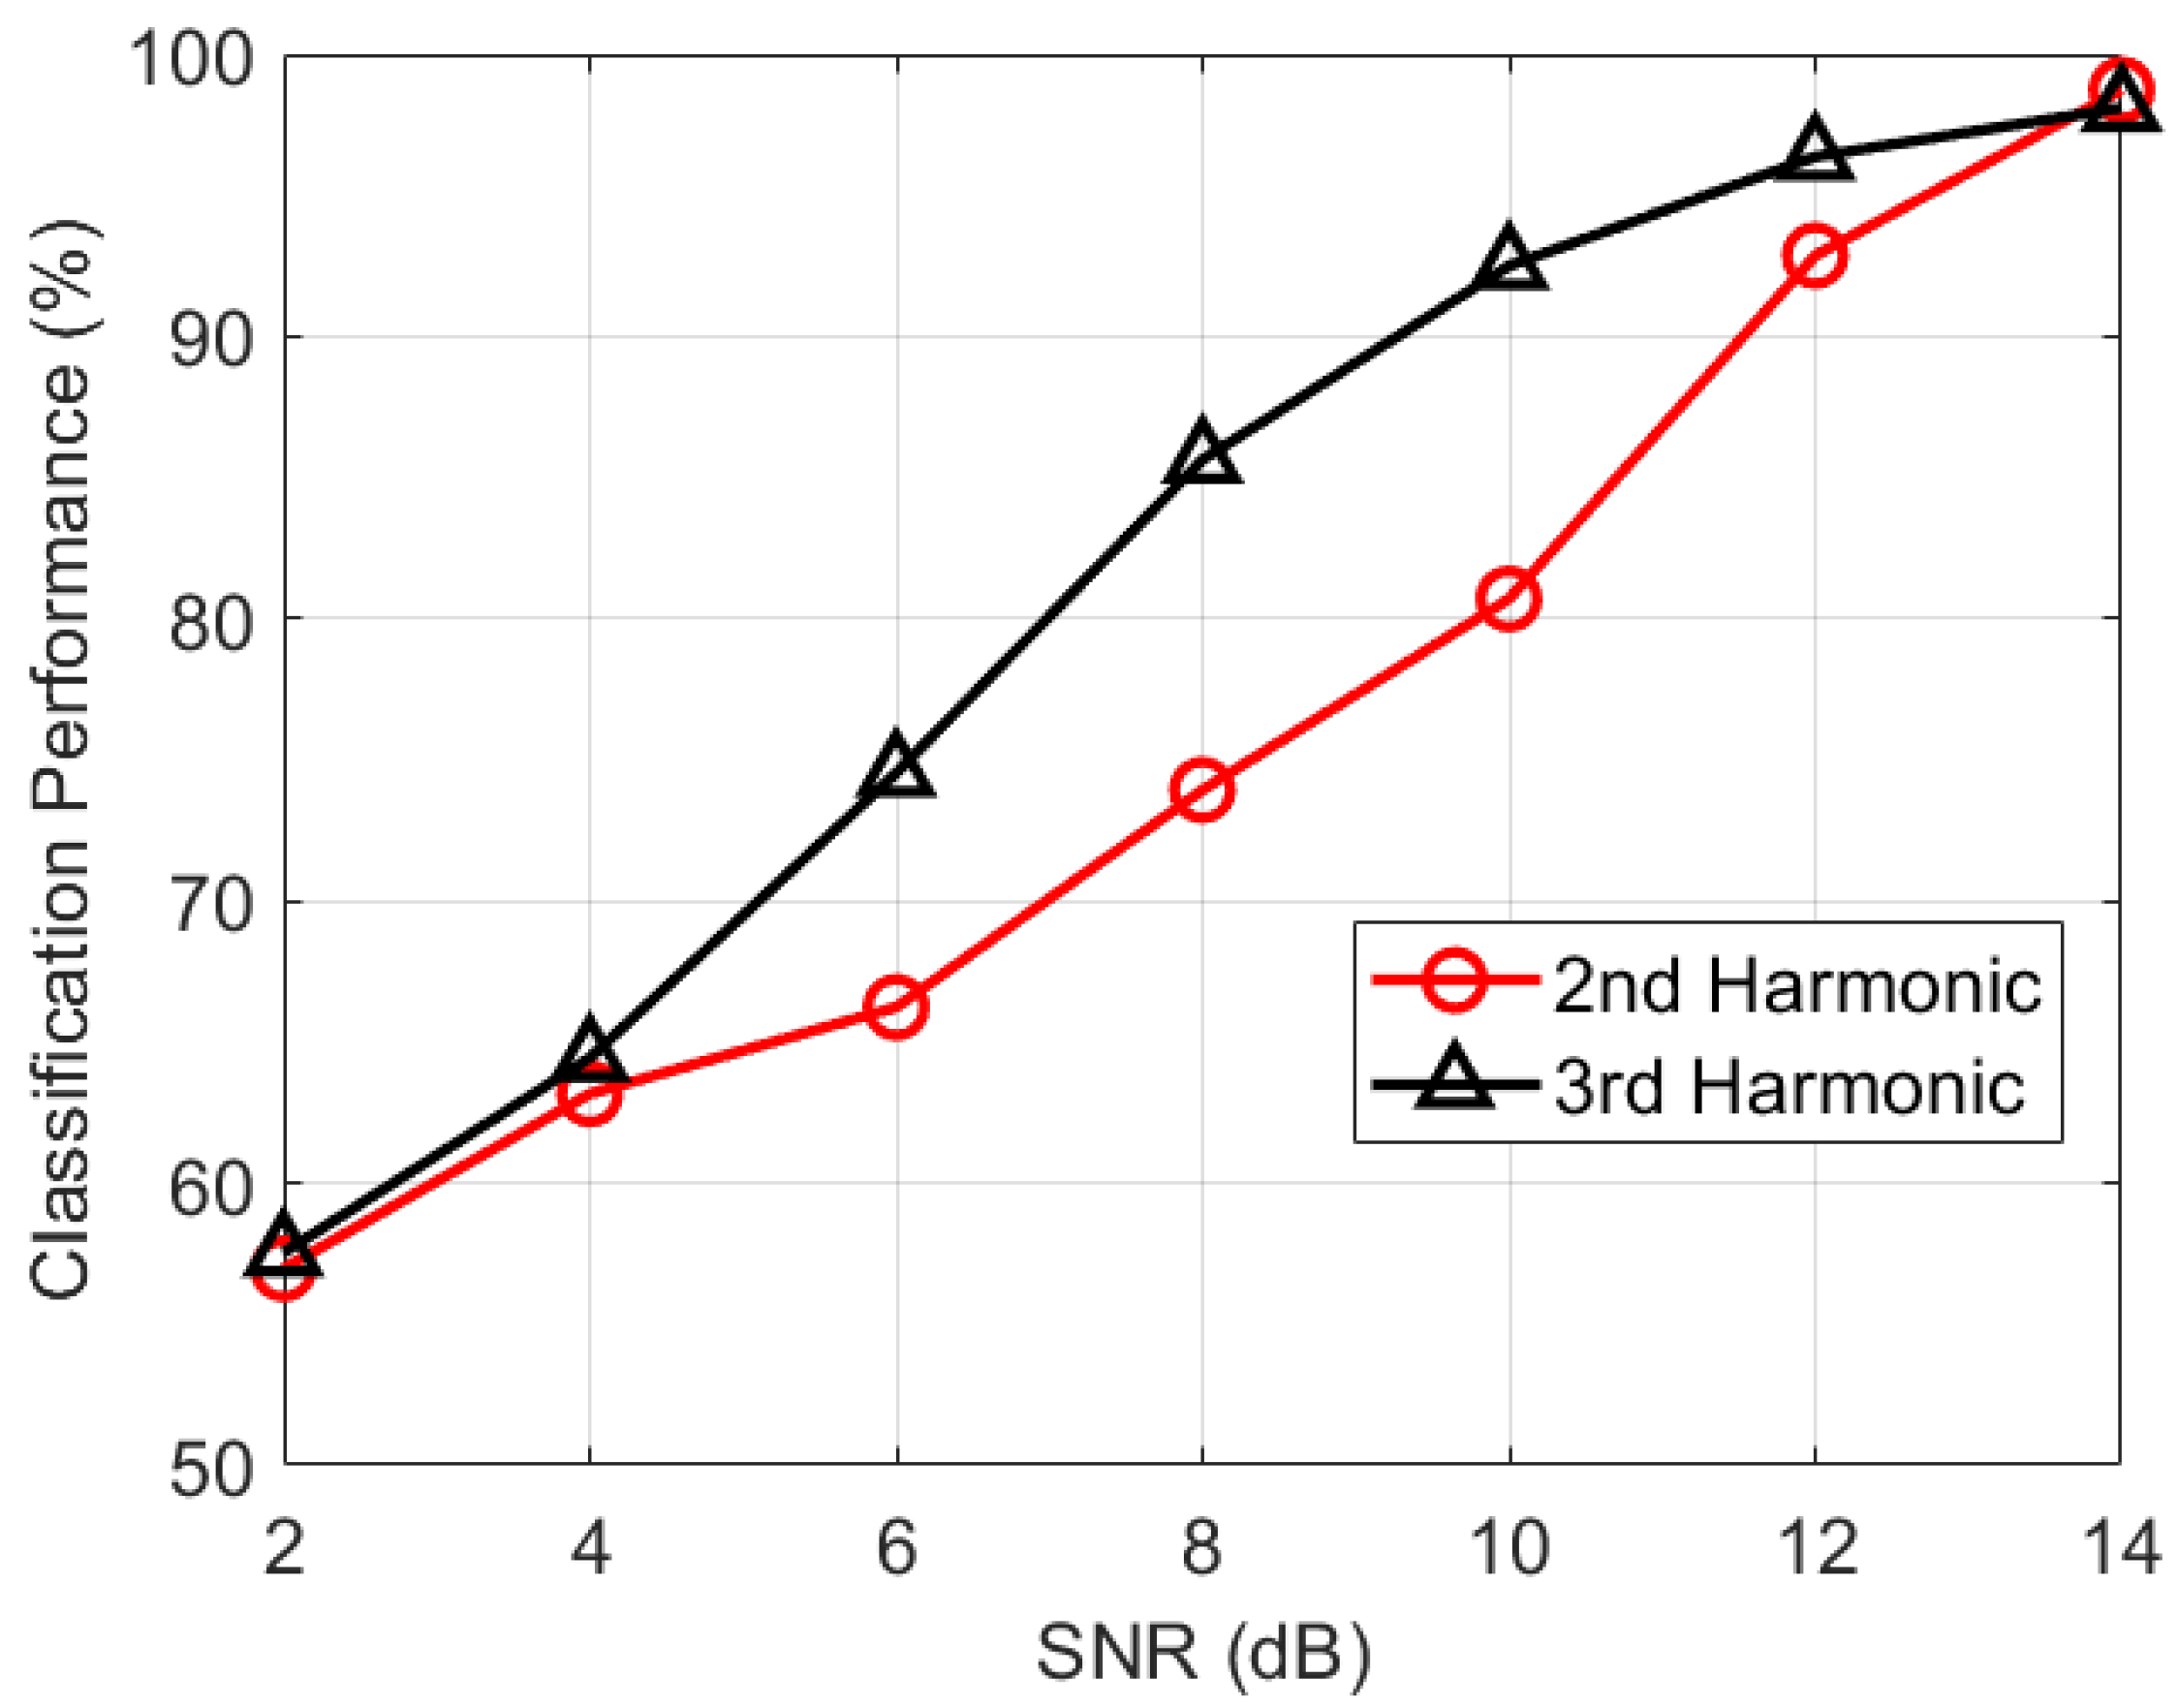
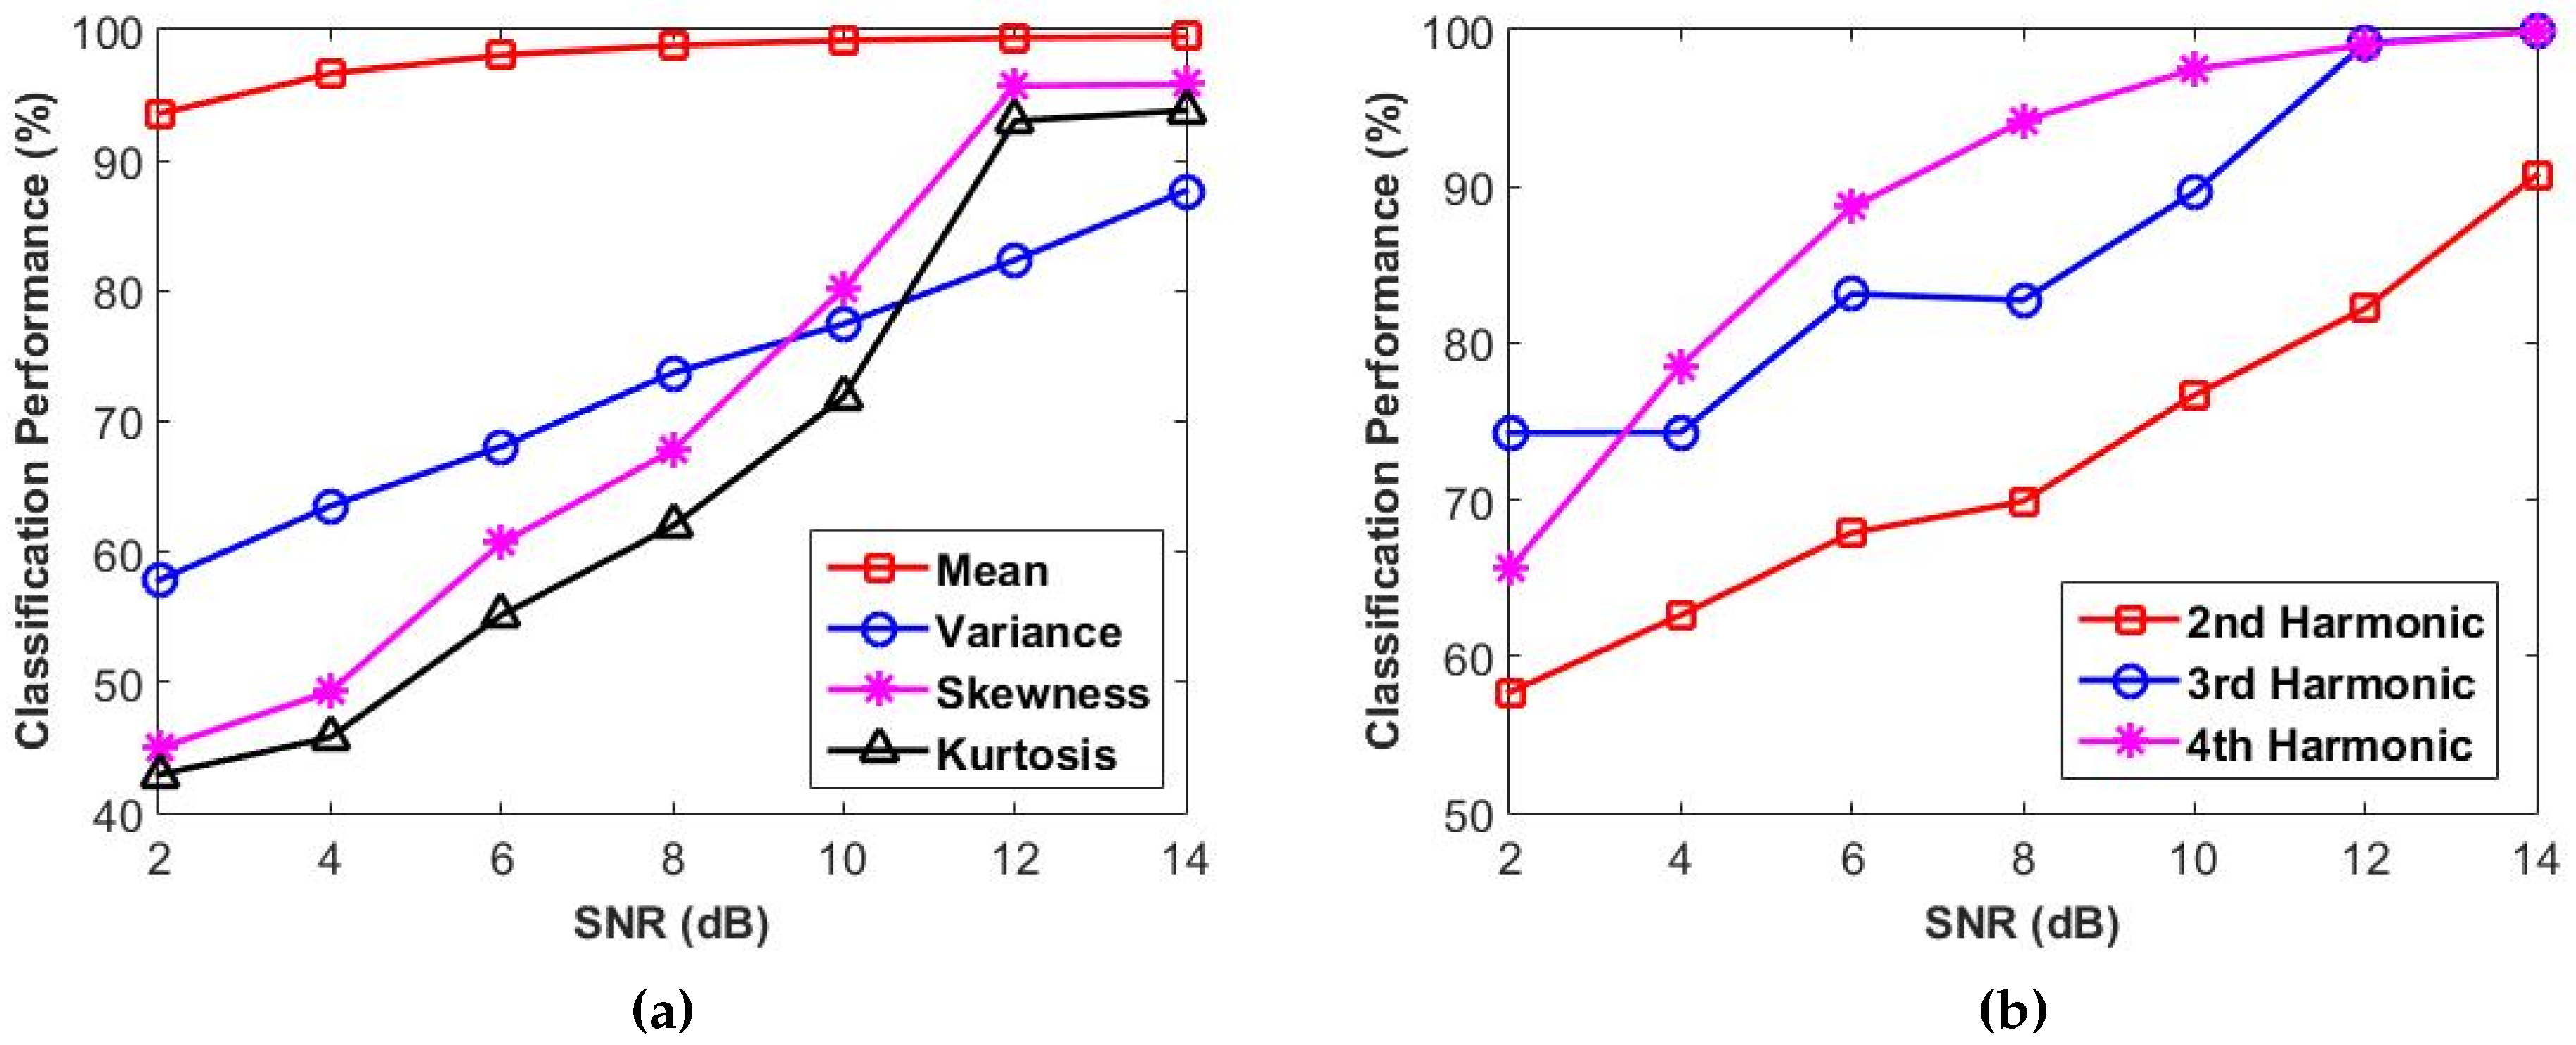
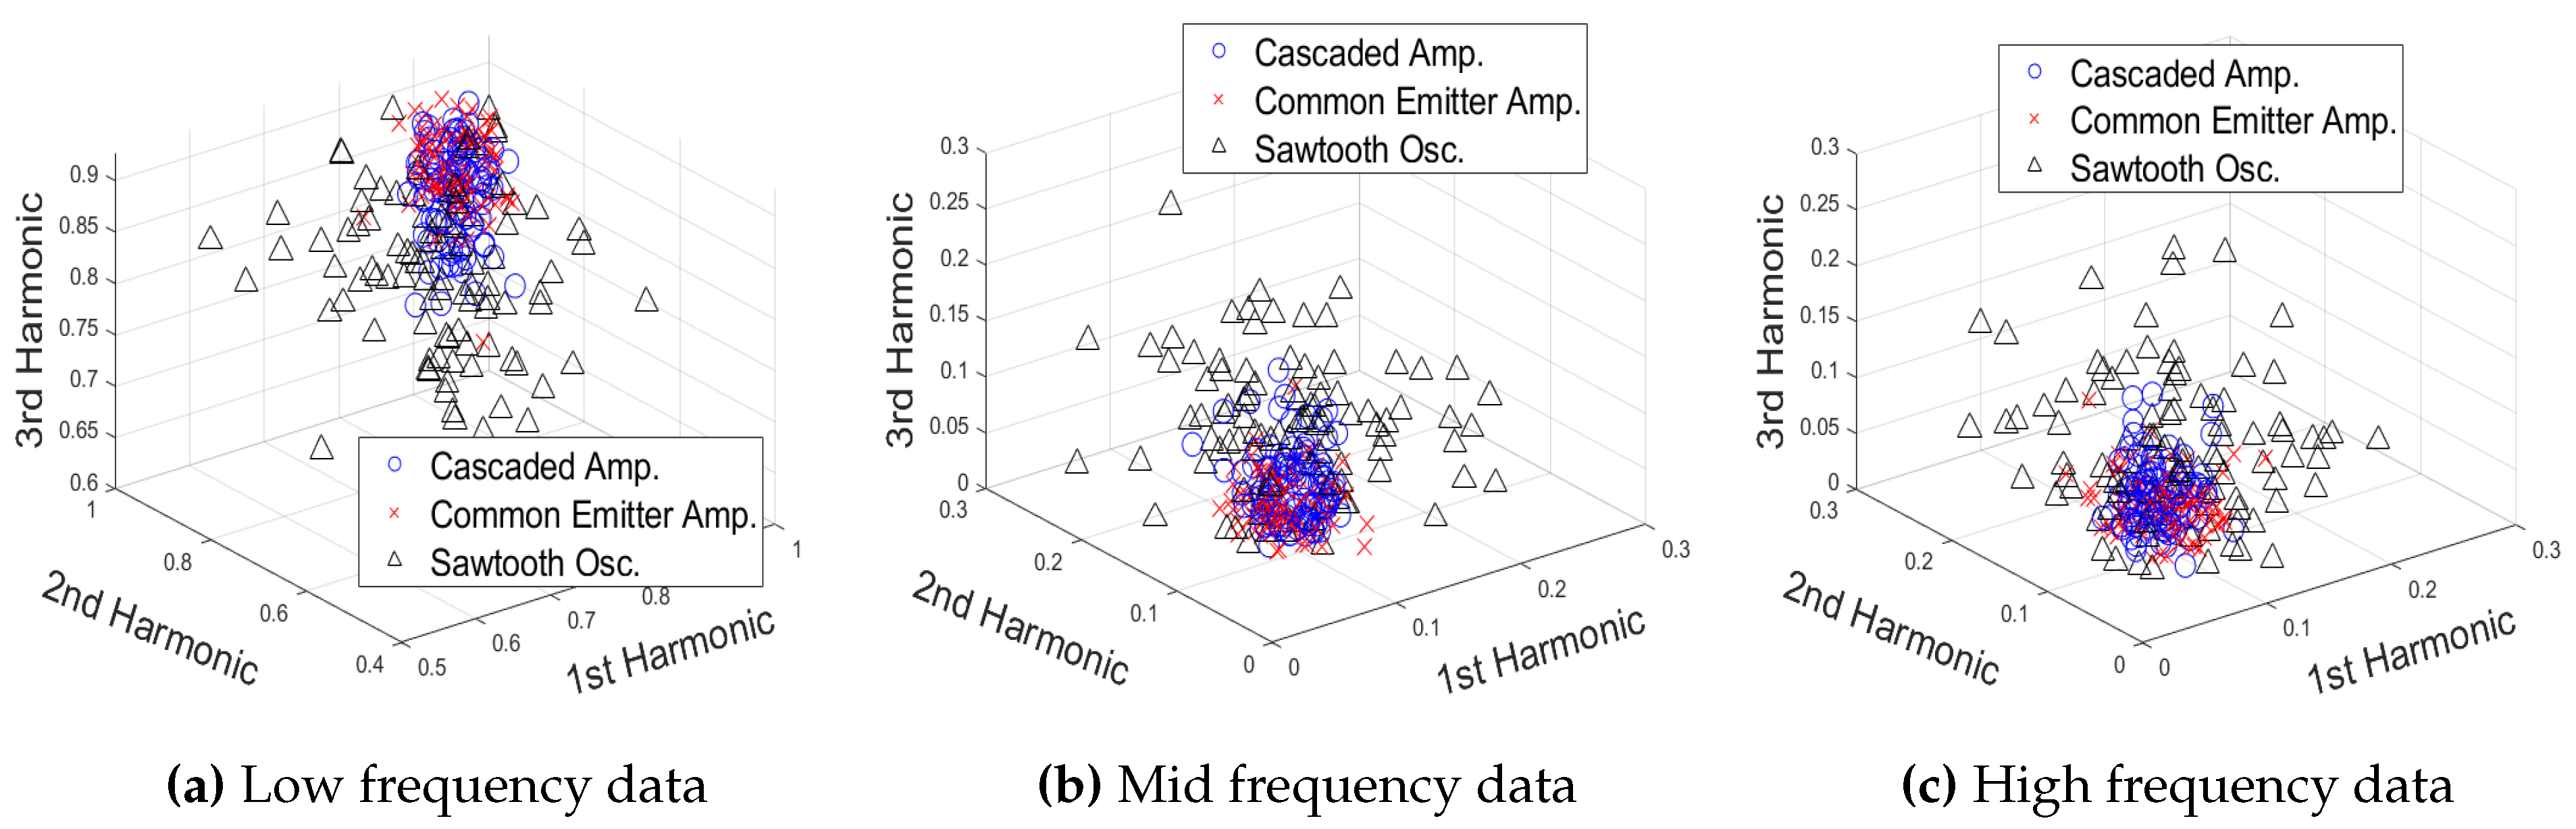
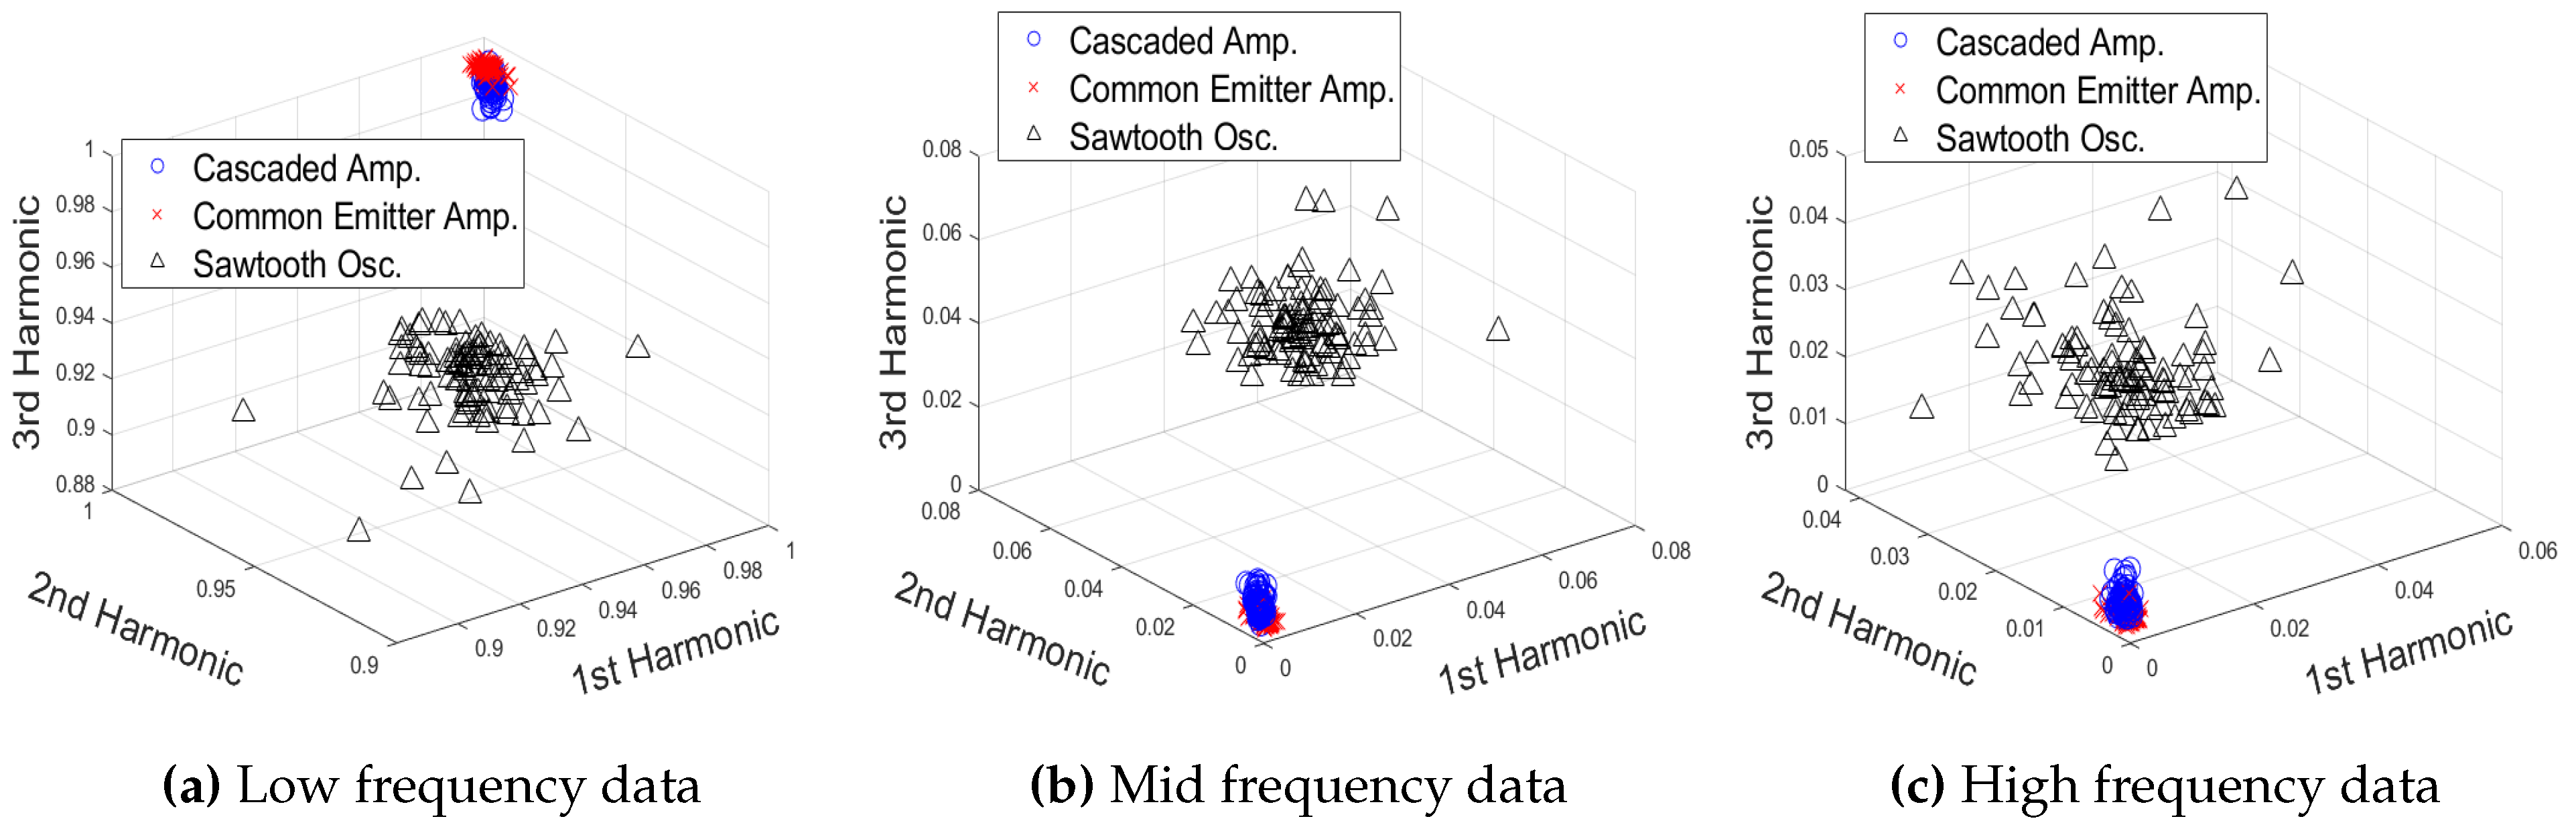
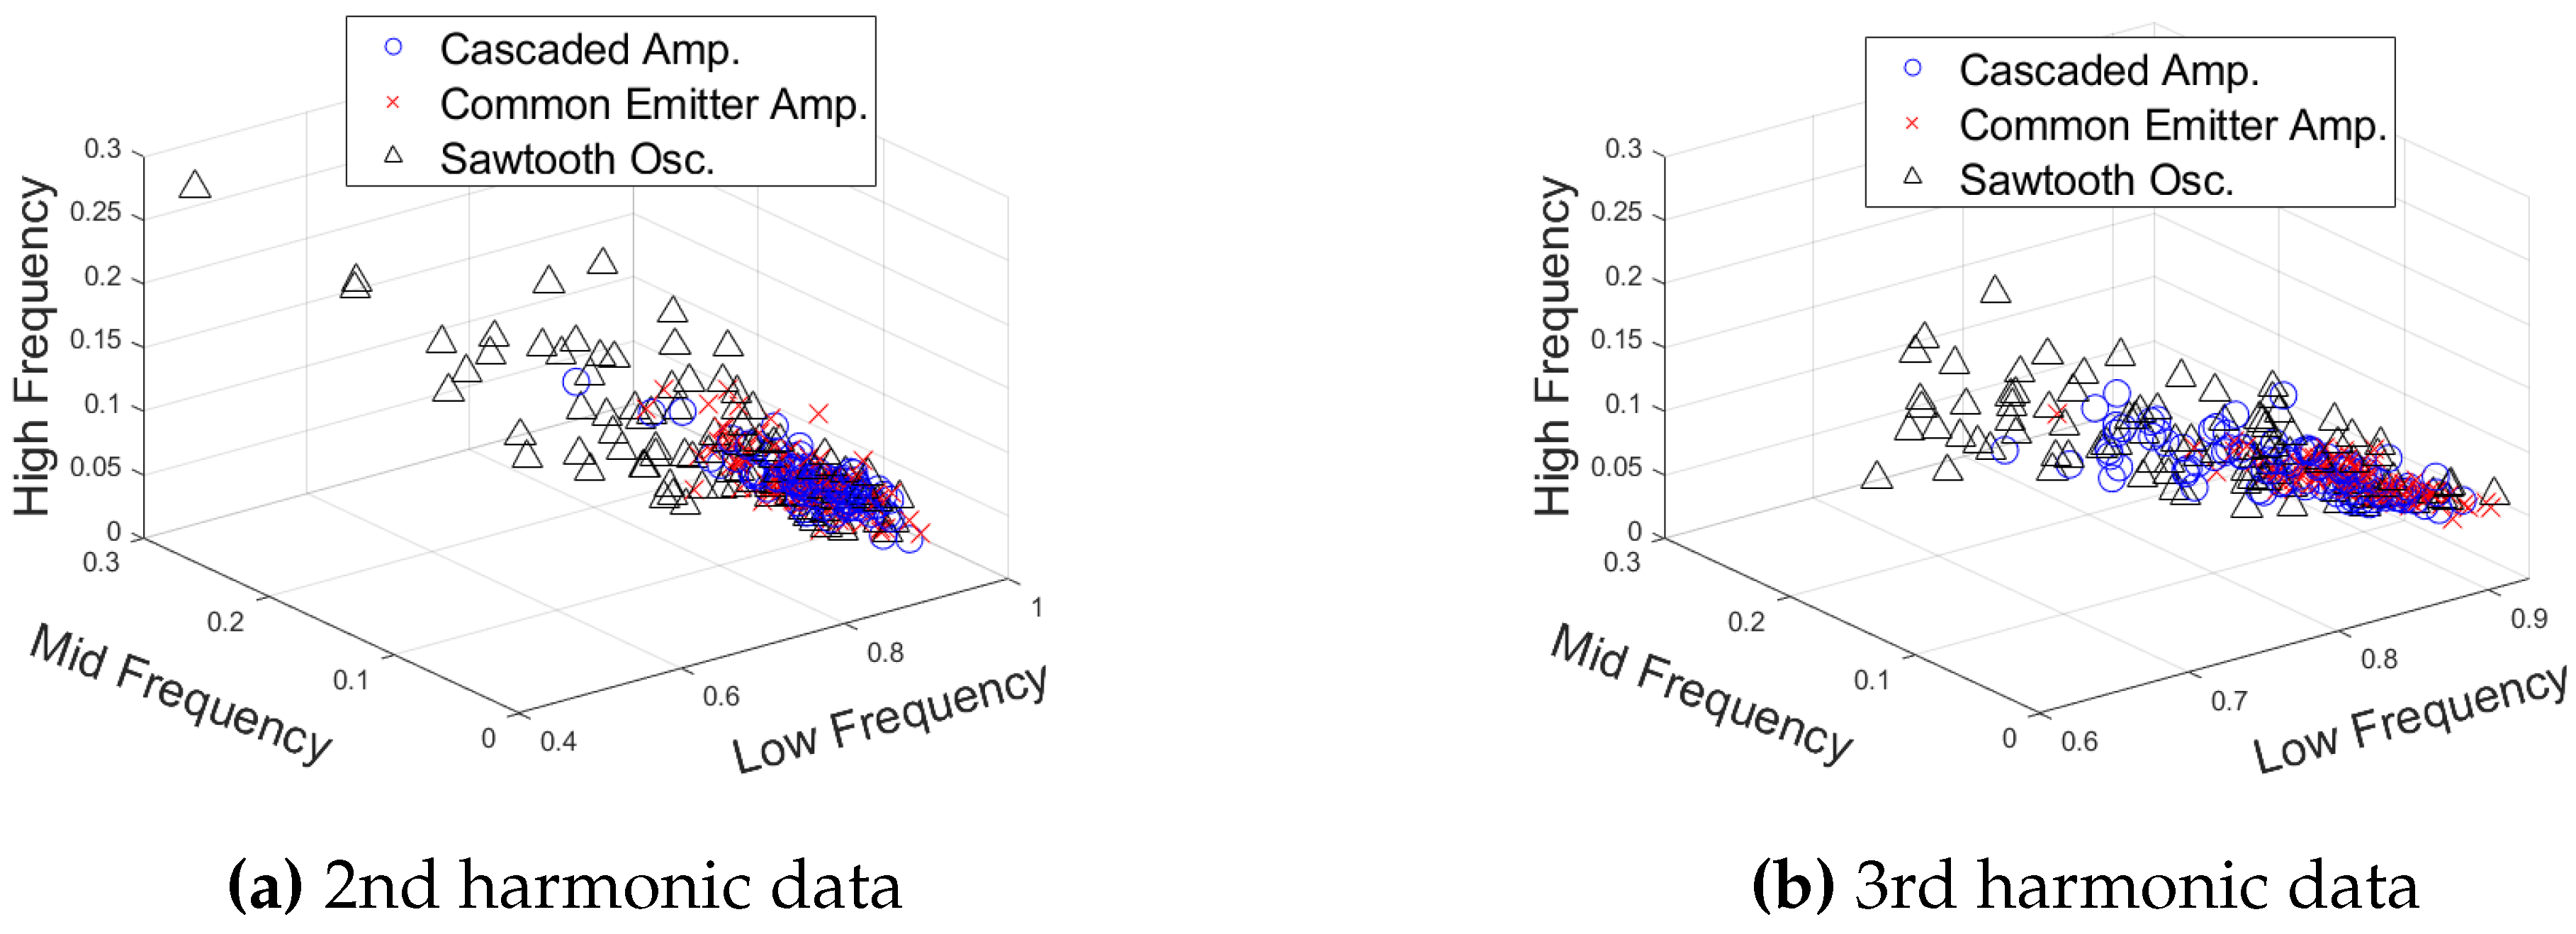
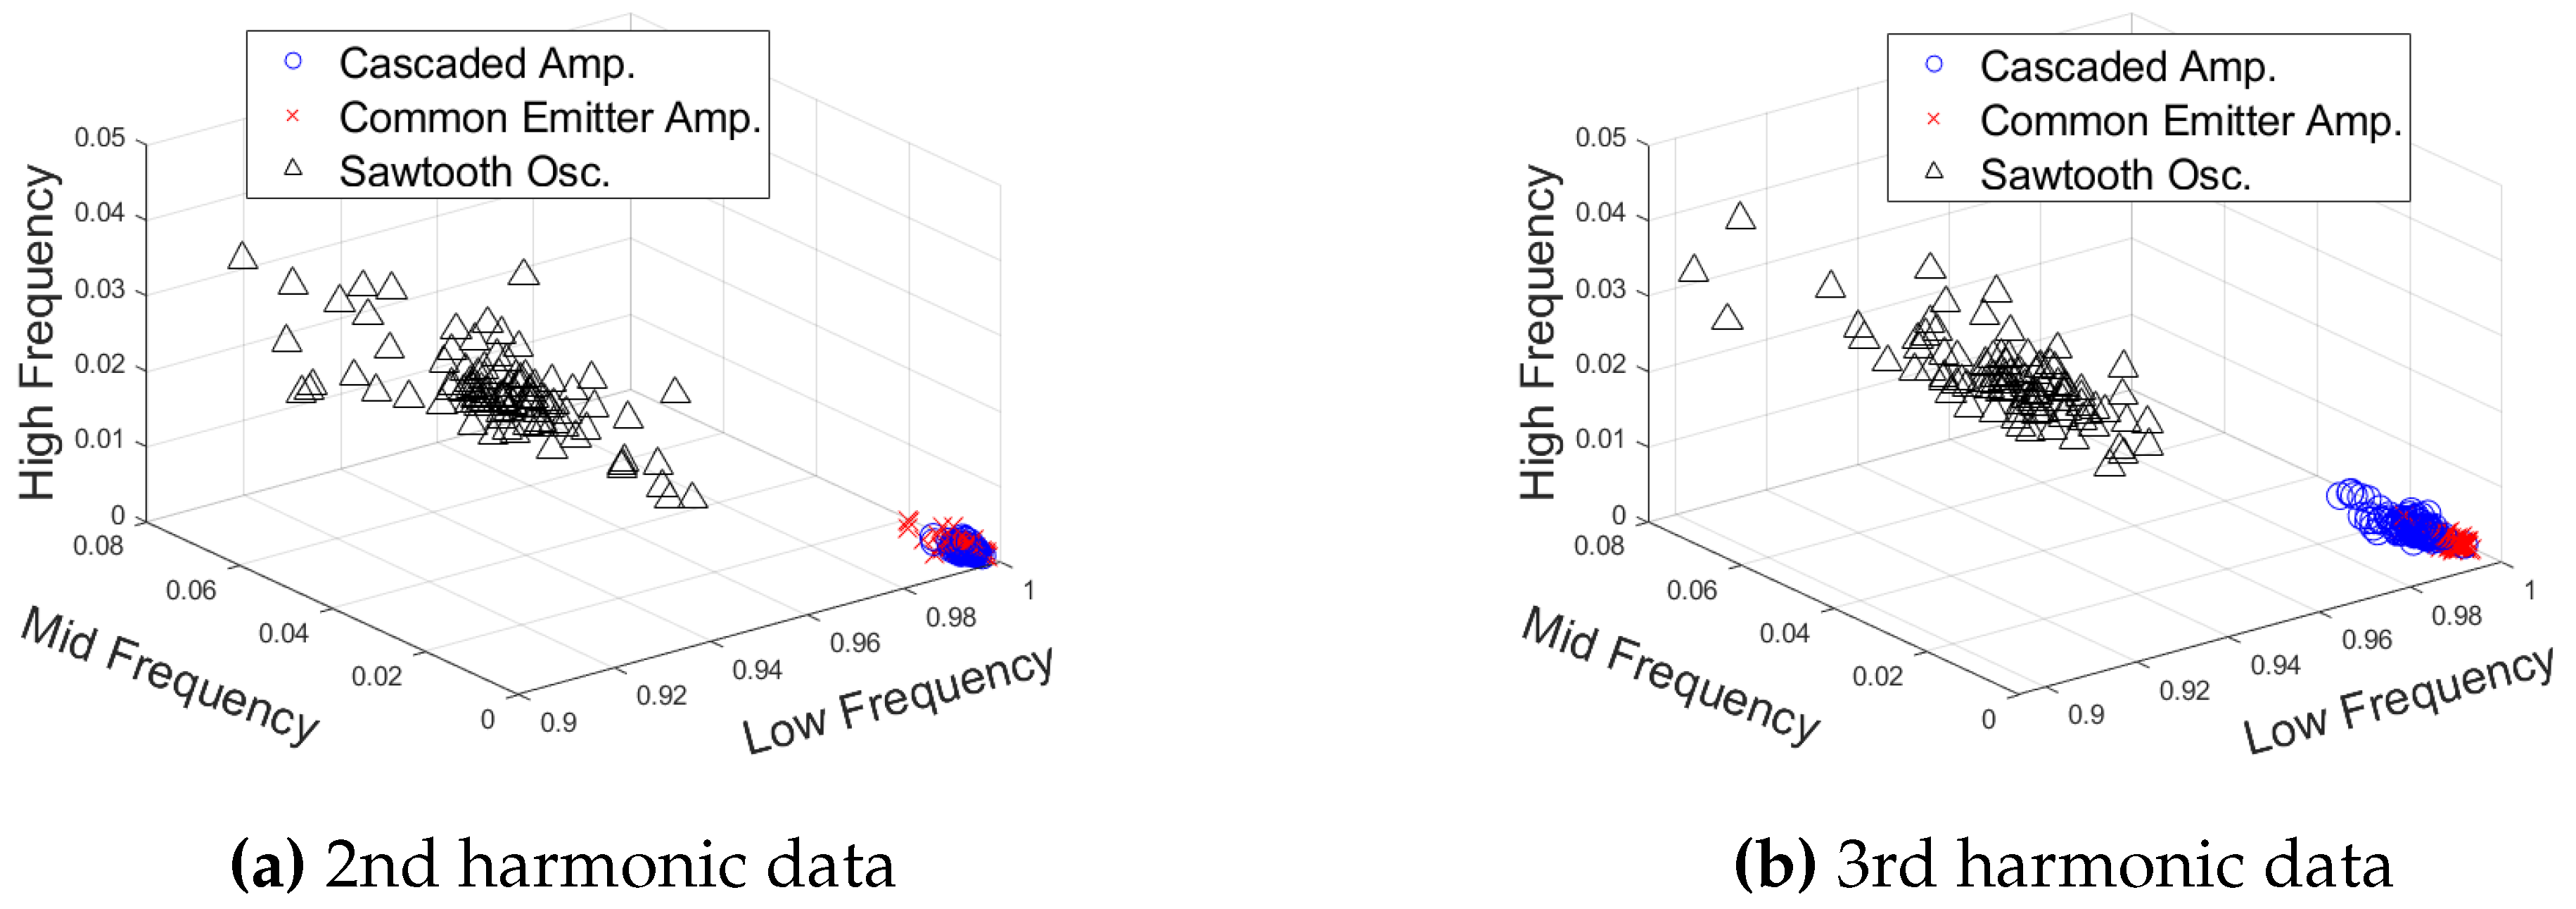
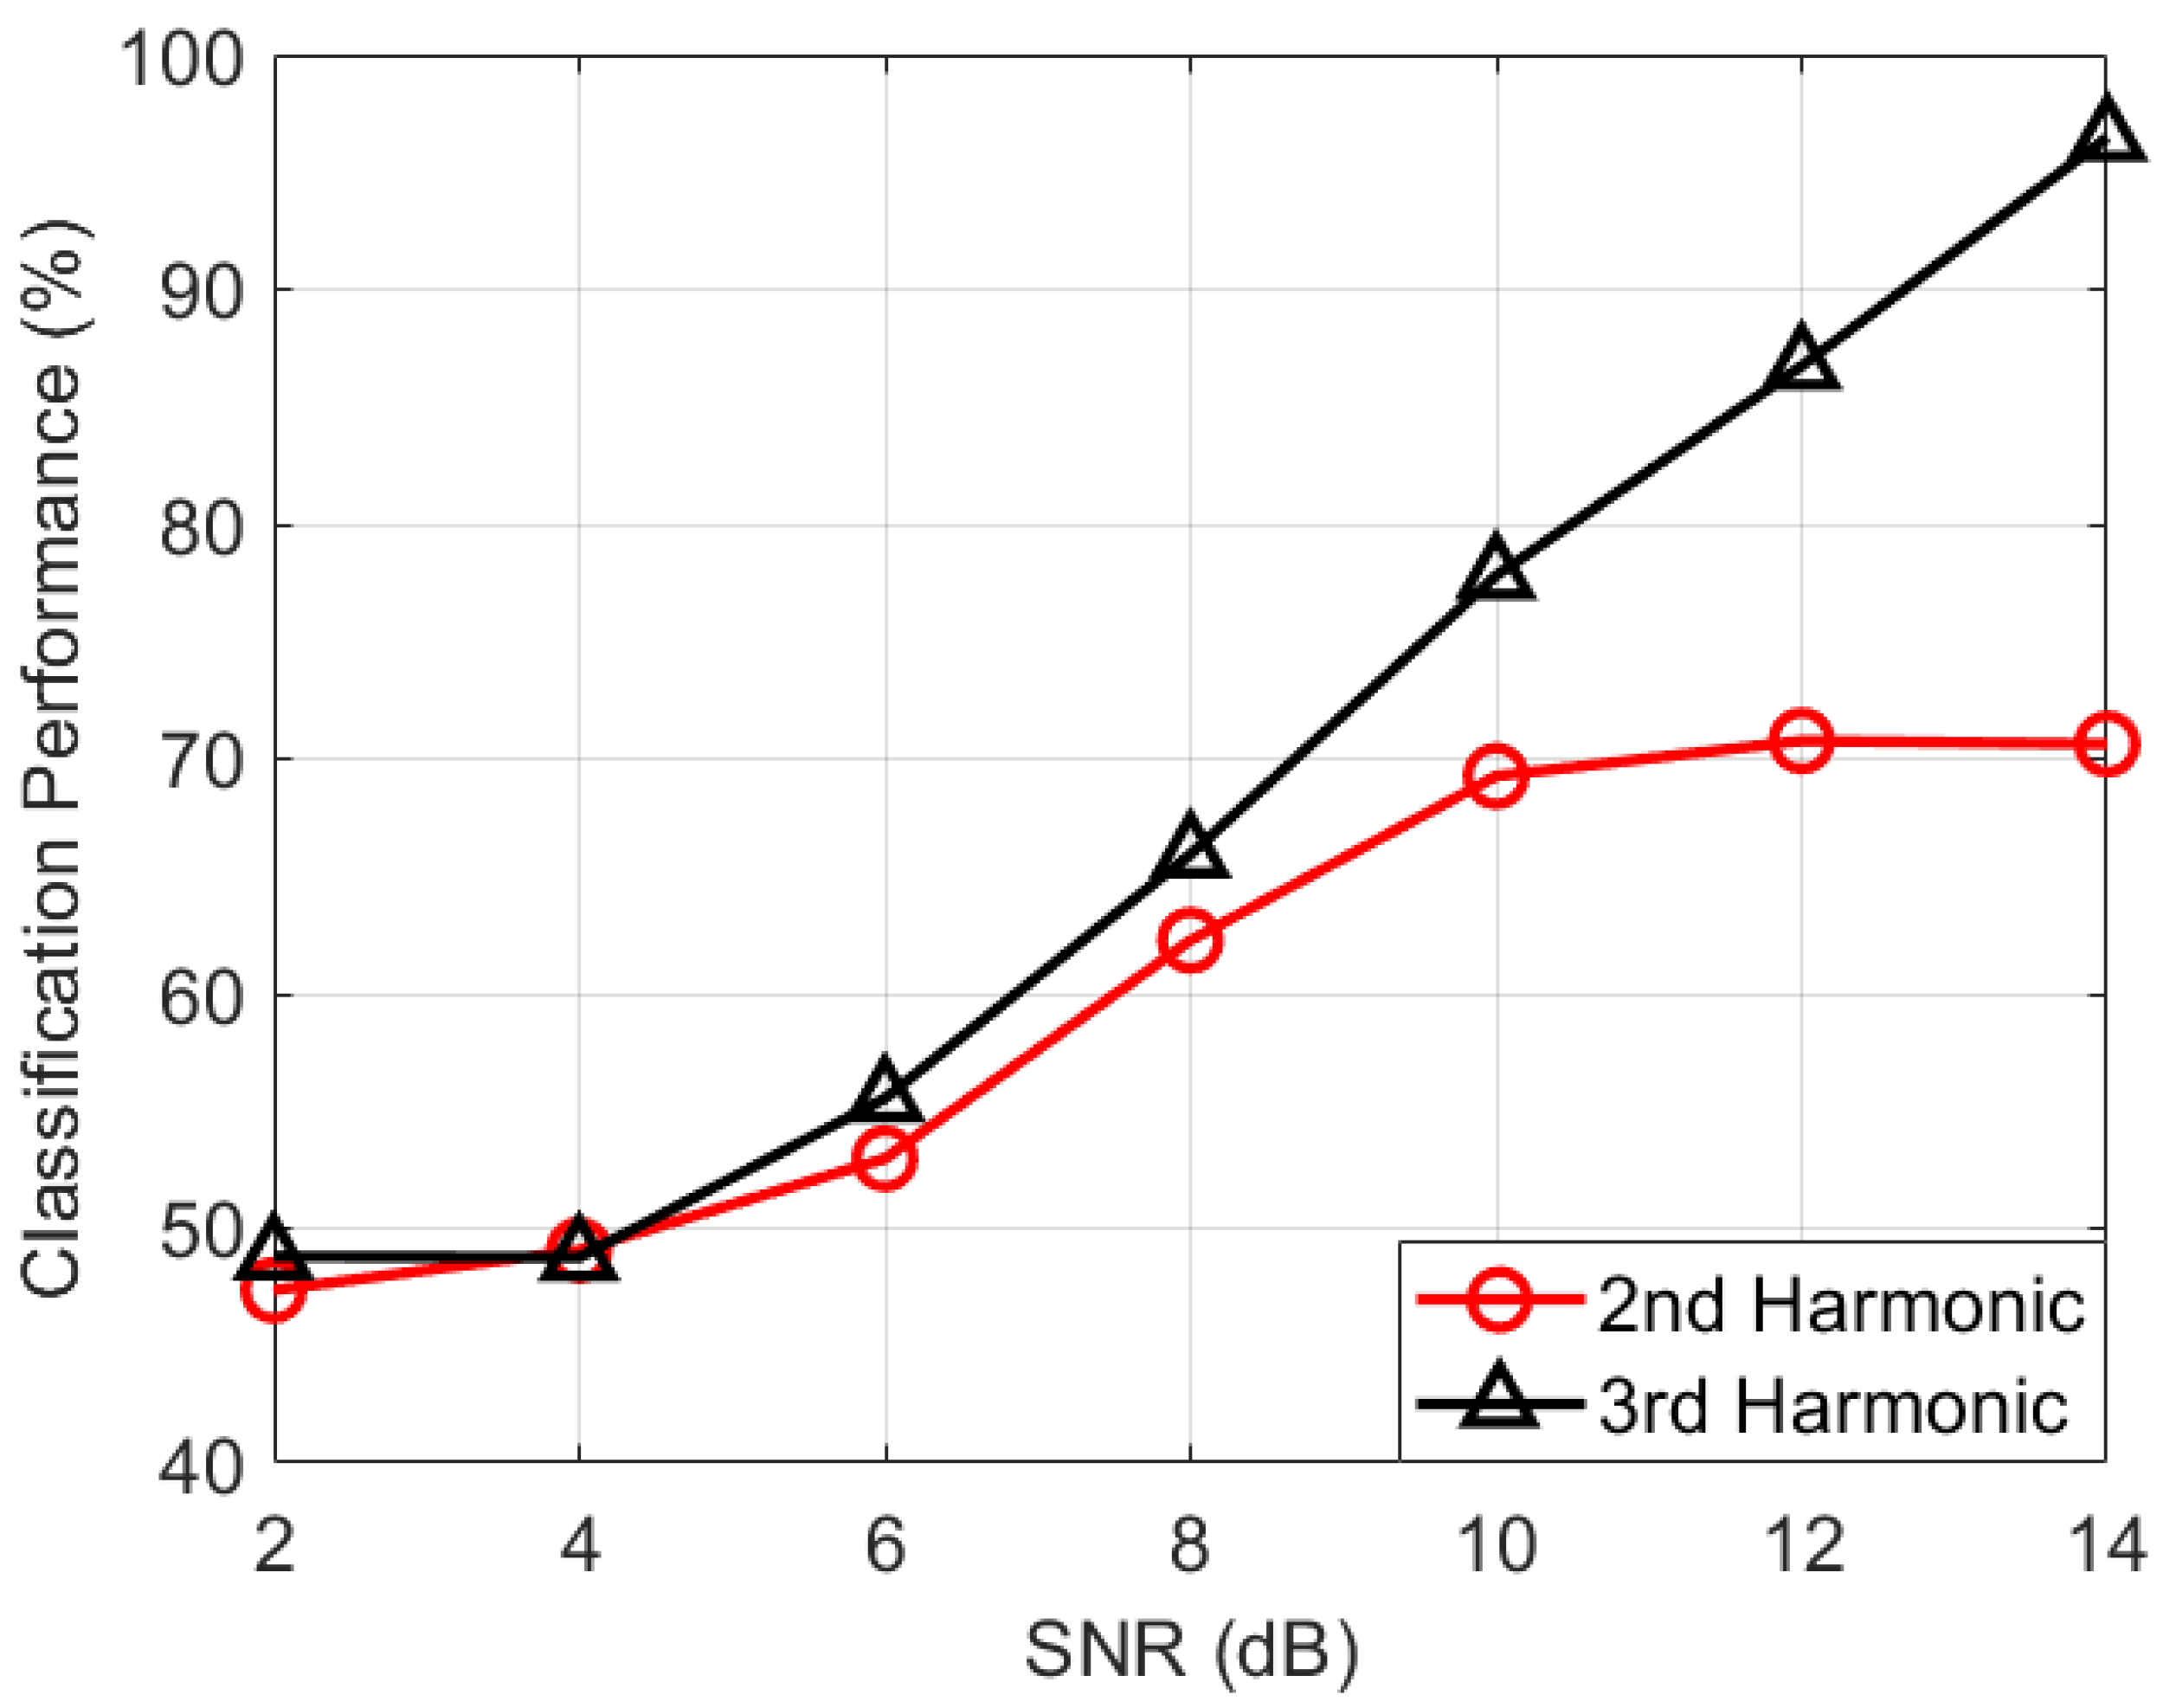
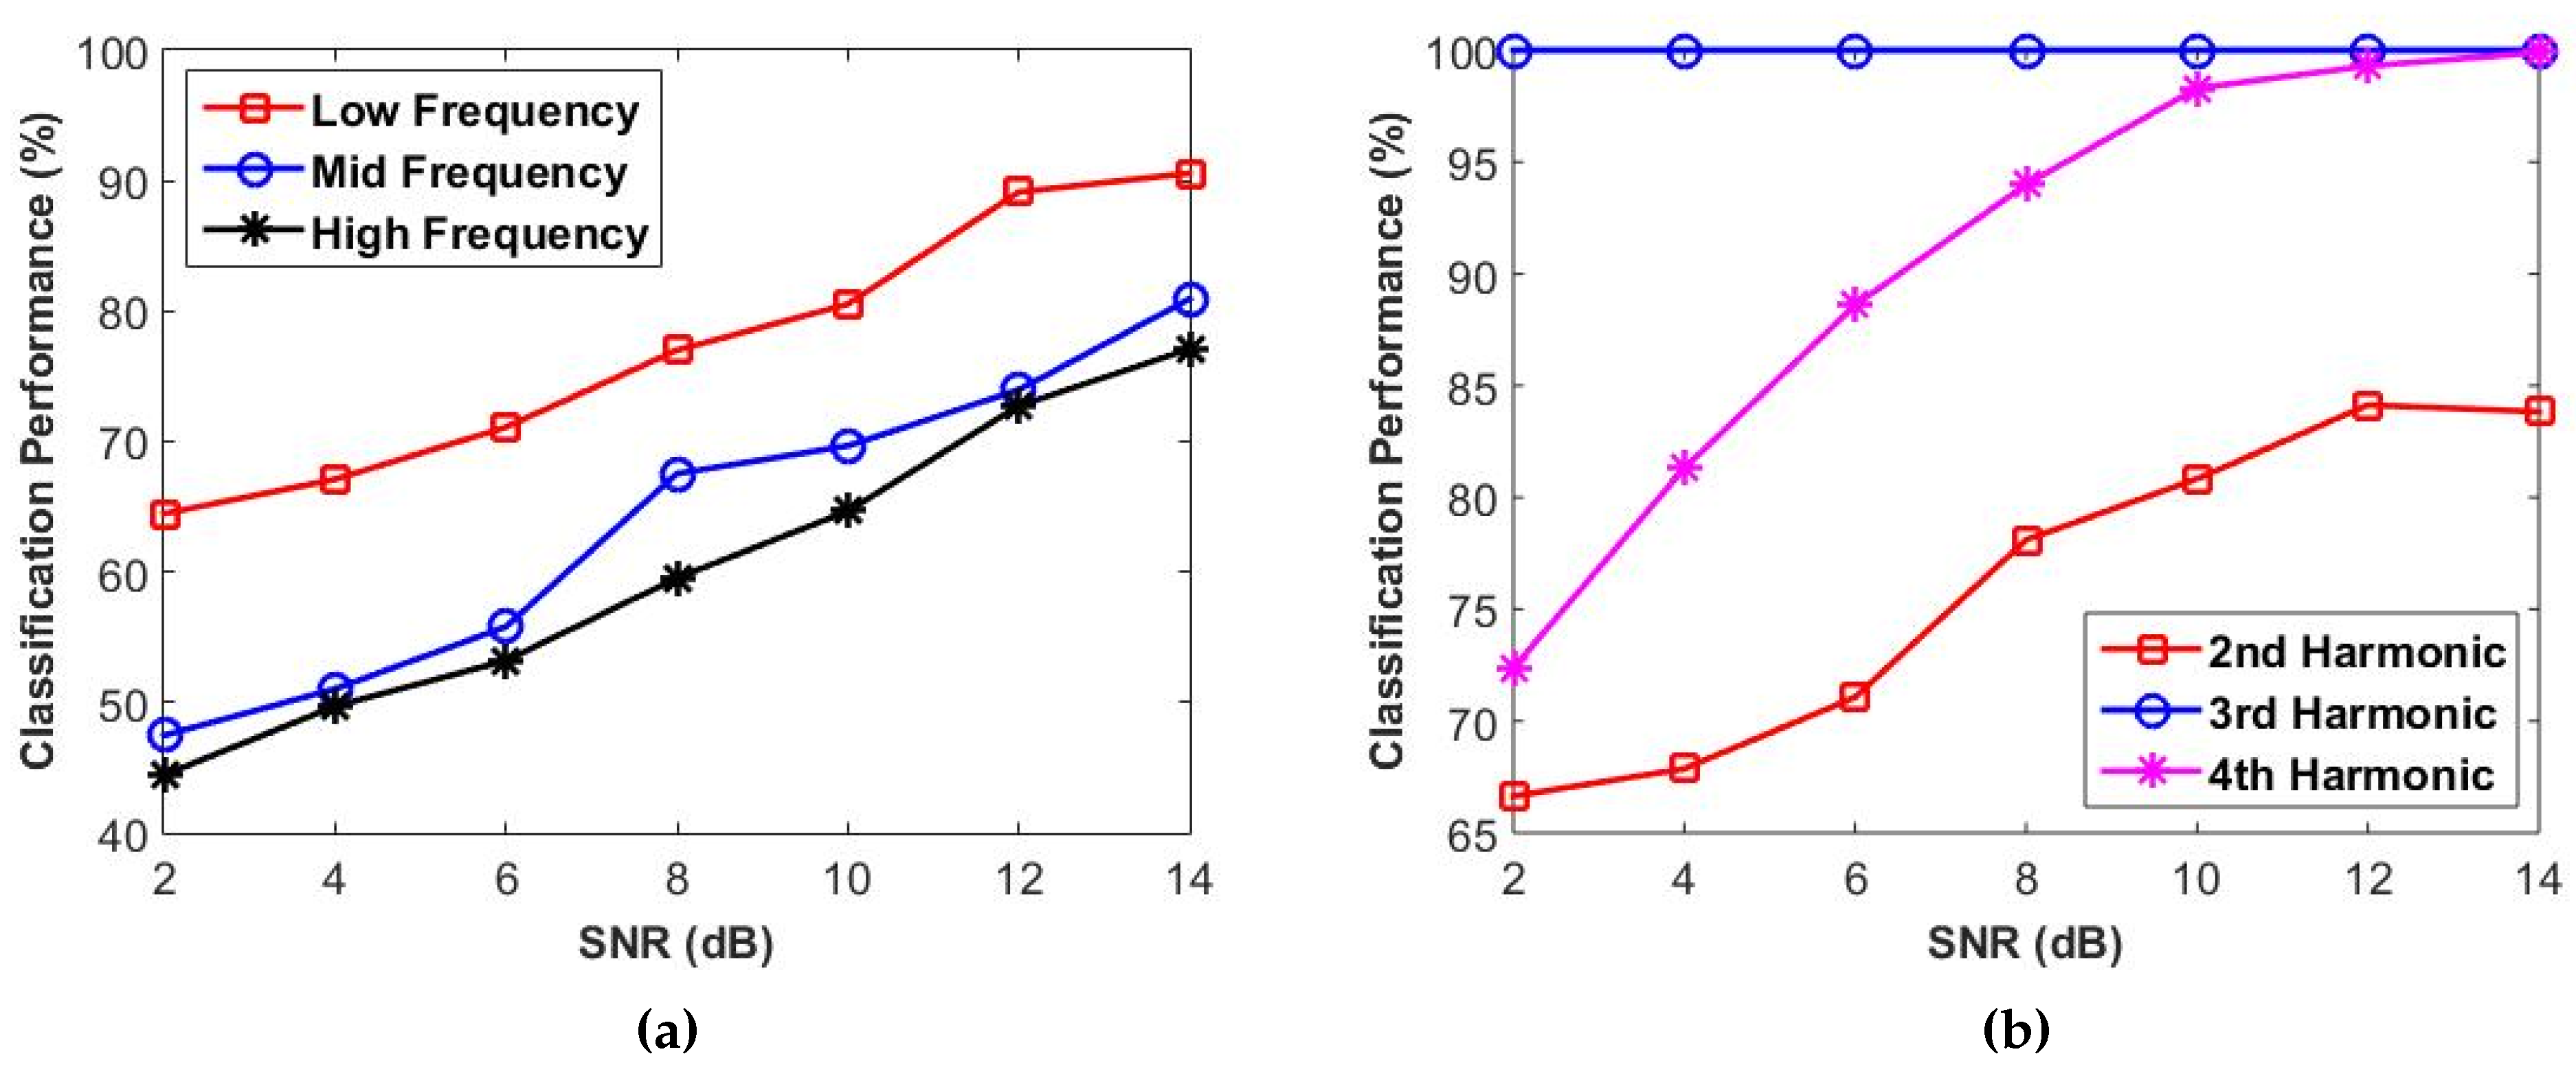
In this article, a novel method for classifying non-linear electronic circuits is presented. Various types of electronic circuits such as cascaded amplifiers, common emitter amplifiers, and sawtooth oscillators are classified using a Frequency-Swept Harmonic Radar (FSHR) approach. Unlike prior studies, signals with constant power are sequentially transmitted to the Electronic Circuits Under Test (ECUT) at frequency values which are swept across a wide range. The first, second, and third harmonic responses of the ECUTs are collected to derive statistical and Fourier features, and a k-Nearest Neighbors (kNN) algorithm is utilized to classify the ECUTs. Scatter plots of the harmonic responses are derived in both feature space and harmonic space and for different SNR values.
The nonlinear characteristics of each ECUT were captured by statistical features such as the variance, skewness, and kurtosis of the received powers at the first three harmonic frequencies. These statistical features are useful for characterizing the received signal power curves at each harmonic, which are unique for each type of ECUT. In addition, Fourier features provide the frequency content of the received powers at harmonic frequencies, and can thus be utilized to characterize the ECUTs. The energy values of the Fourier transform at different frequency levels of the received powers are assessed at the first three harmonic frequencies. Fourier features, which indicate how much of the total energy is at the relevant frequency level, are devised as distinguishing features as well.
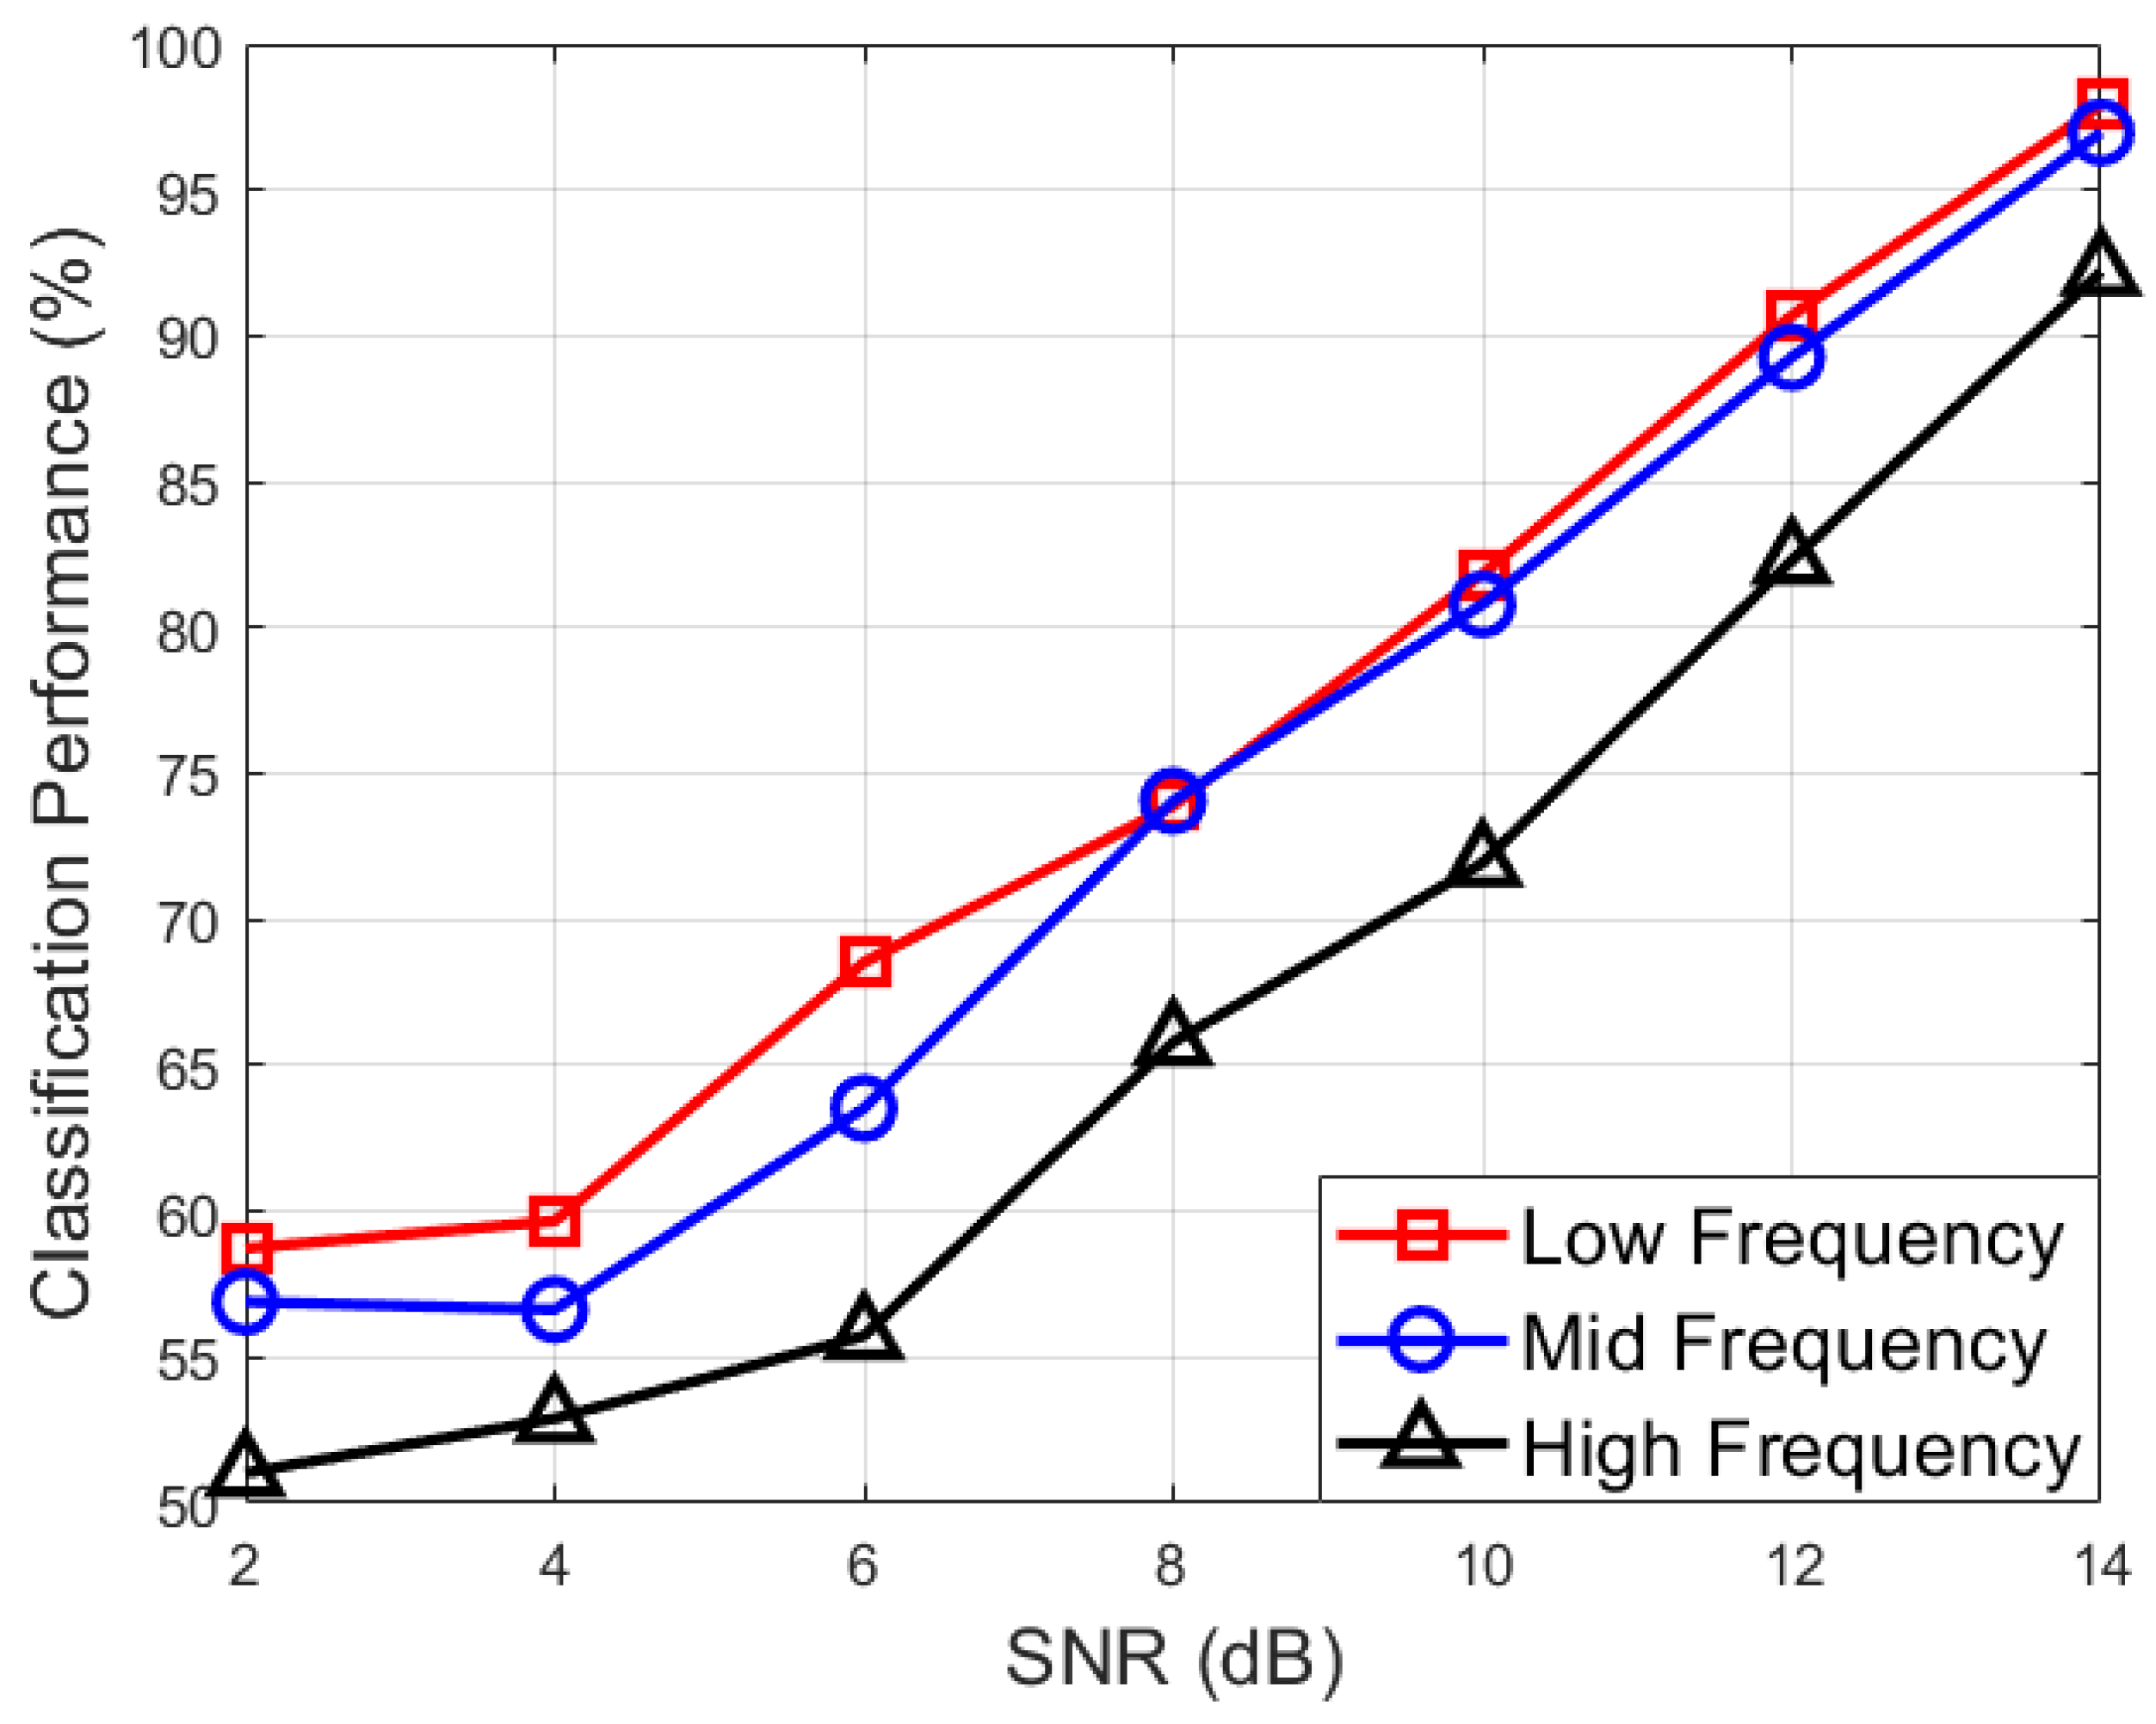
Through Monte Carlo simulations, we apply complex white Gaussian noise (CWGN) to the harmonic responses of the ECUTs for performance assessment of the FSHR approach in real life scenarios. The classification performance of both statistical and Fourier features is presented with confusion matrices and correct classification rates with varying SNR values. We observed that the proposed techniques using frequency-swept transmitted signals are promising for classifying nonlinear electronic circuits using harmonic radar. However, classification of ECUTs via harmonic radar is an emerging technique that requires broader attention in research studies. Therefore, a brief comparison between the proposed method and previous methods of nonlinear electronic circuit classification using harmonic radar found in the literature is presented in this article.
Our future work plans include transmitting different types of waveforms to the electronic circuits. In addition, our research study into acquiring the harmonic data of electronic devices using an experimental setup to test and validate our approach with real data continues. The present study can represent an inspiring reference for other researchers to further analyze the classification performance of nonlinear electronic devices with different features and classification techniques in order to enhance the classification performance in future work.

Author Contributions

Conceptualization, H.T.H.; Formal analysis, H.T.H., H.I., H.I.T. and I.S.Y.; Investigation, H.I. and H.I.T.; Methodology, H.T.H. and I.S.Y.; Project administration, H.T.H. and I.S.Y.; Software, H.I.; Supervision, H.T.H. and I.S.Y.; Validation, H.I. and H.I.T.; Visualization, H.I. and H.I.T.; Writing—original draft, H.T.H., H.I. and H.I.T.; Writing—review & editing, H.T.H. and I.S.Y. All authors have read and agreed to the published version of the manuscript.

Funding

This research received no external funding.

Conflicts of Interest

The authors declare no conflict of interest.

References

  1. Powers, E.; Hong, J.; Kim, Y. Cross sections and radar equation for nonlinear scatterers. IEEE Trans. Aerosp. Electron. Syst. 1981, AES-17, 602–605. [Google Scholar] [CrossRef]
  2. Rong, L.; Hai-yong, W. The re-radiation characteristics of nonlinear target in harmonic radar detection. In Proceedings of the 2008 China-Japan Joint Microwave Conference, Shanghai, China, 10–12 September 2008; IEEE: Piscataway, NJ, USA, 2008; pp. 661–664. [Google Scholar]
  3. Maas, S.A. Nonlinear Microwave and RF Circuits; Artech House: Norwood, MA, USA, 2003. [Google Scholar]
  4. Jablonski, D.G.; Ko, H.W.; Oursler, D.A.; Smith, D.G.; White, D.M. System and Method of Radar Detection of Non-Linear Interfaces. U.S. Patent 6,765,527, 20 July 2004. [Google Scholar]
  5. Mazzaro, G.J.; Martone, A.F.; McNamara, D.M. Detection of RF electronics by multitone harmonic radar. IEEE Trans. Aerosp. Electron. Syst. 2014, 50, 477–490. [Google Scholar] [CrossRef]
  6. Aniktar, H.; Baran, D.; Karav, E.; Akkaya, E.; Birecik, Y.S.; Sezgin, M. Getting the bugs out: A portable harmonic radar system for electronic countersurveillance applications. IEEE Microw. Mag. 2015, 16, 40–52. [Google Scholar] [CrossRef]
  7. Arazm, F.; Benson, F.A. Nonlinearities in metal contacts at microwave frequencies. IEEE Trans. Electromagn. Compat. 1980, EMC-22, 142–149. [Google Scholar] [CrossRef]
  8. Vicente, C.; Hartnagel, H.L. Passive-intermodulation analysis between rough rectangular waveguide flanges. IEEE Trans. Microw. Theory Tech. 2005, 53, 2515–2525. [Google Scholar] [CrossRef]
  9. Hayvaci, H.T.; Ilbegi, H.; Yetik, I.S. Classification of Electronic Devices With Power-Swept Signals Using Harmonic Radar. IEEE Trans. Aerosp. Electron. Syst. 2019, 56, 2292–2301. [Google Scholar] [CrossRef]
  10. Hayvaci, H.T.; Shahi, M.; Ilbegi, H.; Yetik, I.S. A Linear Model for Classification of Electronic Devices Using Harmonic Radar. IEEE Trans. Aerosp. Electron. Syst. 2021, 57, 3614–3622. [Google Scholar] [CrossRef]
  11. Mazzaro, G.J.; Sherbondy, K.D. Combined Linear and Nonlinear Radar: Waveform Generation and Capture; Technical Report; Army Research Lab Adelphi MD Sensors and Electron Devices Directorate: Adelphi, MD, USA, 2013. [Google Scholar]
  12. Mazzaro, G.J.; Gallagher, K.A.; Sherbondy, K.D.; Martone, A.F. Nonlinear radar: A historical overview and a summary of recent advancements. In Proceedings of the Radar Sensor Technology XXIV, Online, 27 April–8 May 2020; Volume 11408, p. 114080E. [Google Scholar]
  13. Kosinski, J.A.; Palmer, W.D.; Steer, M.B. Unified understanding of RF remote probing. IEEE Sens. J. 2011, 11, 3055–3063. [Google Scholar] [CrossRef]
  14. Martone, A.F.; Ranney, K.I.; Sherbondy, K.D.; Gallagher, K.A.; Mazzaro, G.J.; Narayanan, R.M. An overview of spectrum sensing for harmonic radar. In Proceedings of the 2016 International Symposium on Fundamentals of Electrical Engineering (ISFEE), Bucharest, Romania, 30 June–2 July 2016; IEEE: Piscataway, NJ, USA, 2016; pp. 1–5. [Google Scholar]
  15. O’Neal, M.E.; Landis, D.; Rothwell, E.; Kempel, L.; Reinhard, D. Tracking insects with harmonic radar: A case study. Am. Entomol. 2004, 50, 212–218. [Google Scholar] [CrossRef] [Green Version]
  16. Colpitts, B.G.; Boiteau, G. Harmonic radar transceiver design: Miniature tags for insect tracking. IEEE Trans. Antennas Propag. 2004, 52, 2825–2832. [Google Scholar] [CrossRef]
  17. Psychoudakis, D.; Moulder, W.; Chen, C.C.; Zhu, H.; Volakis, J.L. A portable low-power harmonic radar system and conformal tag for insect tracking. IEEE Antennas Wirel. Propag. Lett. 2008, 7, 444–447. [Google Scholar] [CrossRef]
  18. Tahir, N.; Brooker, G. Toward the development of millimeter wave harmonic sensors for tracking small insects. IEEE Sens. J. 2015, 15, 5669–5676. [Google Scholar] [CrossRef]
  19. Milanesio, D.; Bottigliero, S.; Saccani, M.; Maggiora, R.; Viscardi, A.; Gallesi, M.M. An harmonic radar prototype for insect tracking in harsh environments. In Proceedings of the 2020 IEEE International Radar Conference (RADAR), Washington, DC, USA, 28–30 April 2020; IEEE: Piscataway, NJ, USA, 2020; pp. 648–653. [Google Scholar]
  20. Storz, G.; Lavrenko, A. Compact low-cost FMCW harmonic radar for short range insect tracking. In Proceedings of the 2020 IEEE International Radar Conference (RADAR), Washington, DC, USA, 28–30 April 2020; IEEE: Piscataway, NJ, USA, 2020; pp. 642–647. [Google Scholar]
  21. Lavrenko, A.; Litchfield, B.; Woodward, G.; Pawson, S. Design and evaluation of a compact harmonic transponder for insect tracking. IEEE Microw. Wirel. Components Lett. 2020, 30, 445–448. [Google Scholar] [CrossRef]
  22. Bottigliero, S.; Milanesio, D.; Saccani, M.; Maggiora, R.; Viscardi, A.; Gallesi, M.M. An innovative harmonic radar prototype for miniaturized lightweight passive tags tracking. In Proceedings of the 2019 IEEE Radar Conference (RadarConf), Boston, MA, USA, 22–26 April 2019; IEEE: Piscataway, NJ, USA, 2019; pp. 1–6. [Google Scholar]
  23. Saebboe, J.; Viikari, V.; Varpula, T.; Seppä, H.; Cheng, S.; Al-Nuaimi, M.; Hallbjörner, P.; Rydberg, A. Harmonic automotive radar for VRU classification. In Proceedings of the 2009 International Radar Conference “Surveillance for a Safer World” (RADAR 2009), Bordeaux, France, 12–16 October 2009; IEEE: Piscataway, NJ, USA, 2009; pp. 1–5. [Google Scholar]
  24. Abdelnour, A.; Lazaro, A.; Villarino, R.; Kaddour, D.; Tedjini, S.; Girbau, D. Passive harmonic RFID system for buried assets localization. Sensors 2018, 18, 3635. [Google Scholar] [CrossRef] [PubMed] [Green Version]
  25. Mondal, S.; Kumar, D.; Chahal, P. Recent Advances and Applications of Passive Harmonic RFID Systems: A Review. Micromachines 2021, 12, 420. [Google Scholar] [CrossRef] [PubMed]
  26. Keller, W.J. Active Improvised Explosive Device (IED) Electronic Signature Detection. U.S. Patent 8,063,813, 22 November 2011. [Google Scholar]
  27. Holly, S.; Harrington, D.E. Multi-Band Receiver Using Harmonic Synchronous Detection. U.S. Patent 8,903,669, 8 November 2011. [Google Scholar]
  28. Lehtola, G.E. RF Receiver Sensing by Harmonic Generation. U.S. Patent 7,864,107, 4 January 2011. [Google Scholar]
  29. Ilbegi, H.; Hayvaci, H.T.; Yetik, I.S.; Yilmaz, A.E. Distinguishing electronic devices using harmonic radar. In Proceedings of the 2017 IEEE Radar Conference (RadarConf), Seattle, WA, USA, 8–12 May 2017; IEEE: Piscataway, NJ, USA, 2017; pp. 1527–1530. [Google Scholar]
  30. Ilbegi, H.; Hayvaci, H.; Yetik, I. Distinguishing electronic devices using Fourier features derived from harmonic radar. In Proceedings of the 2017 International Conference on Electromagnetics in Advanced Applications (ICEAA), Verona, Italy, 11–15 September 2017; IEEE: Piscataway, NJ, USA, 2017; pp. 1502–1505. [Google Scholar]
  31. Shahi, M.; Ilbegi, H.; Yetik, I.S.; Hayvaci, H.T. Distinguishing Electronic Devices Using Harmonic Radar Based on a Linear Model. In Proceedings of the 2019 International Conference on Electromagnetics in Advanced Applications (ICEAA), Granada, Spain, 9–13 September 2019; IEEE: Piscataway, NJ, USA, 2019; pp. 1260–1263. [Google Scholar]
  32. Mazzaro, G.J.; Sherbondy, K.D. Harmonic nonlinear radar: From benchtop experimentation to short-range wireless data collection. In Proceedings of the Radar Sensor Technology XXIII, Baltimore, MD, USA, 15–17 April 2019; Volume 11003, p. 110030F. [Google Scholar]
  33. Mazzaro, G.J.; Martone, A.F.; Ranney, K.I.; Narayanan, R.M. Nonlinear radar for finding RF electronics: System design and recent advancements. IEEE Trans. Microw. Theory Tech. 2017, 65, 1716–1726. [Google Scholar] [CrossRef]
  34. Mazzaro, G.J.; Ranney, K.I.; Gallagher, K.A.; Martone, A.F. Multitone Radar with Range Determination and Method of Use. U.S. Patent 10,203,405, 12 February 2019. [Google Scholar]
  35. Mazzaro, G.J.; Ranney, K.I.; Gallagher, K.A.; McGowan, S.F.; Martone, A.F. Simultaneous-Frequency Nonlinear Radar: Hardware Simulation; Technical Report; Army Research Lab Sensors and Electron Devices Directorate: Adelphi, MD, USA, 2015. [Google Scholar]
  36. Berger, T.; Hamran, S.E. Harmonic synthetic aperture radar processing. IEEE Geosci. Remote Sens. Lett. 2015, 12, 2066–2069. [Google Scholar] [CrossRef]
  37. Mazzaro, G.J.; Gallagher, K.A.; Martone, A.F.; Narayanan, R.M. Stepped-frequency nonlinear radar simulation. In Proceedings of the Radar Sensor Technology XVIII, Baltimore, MD, USA, 29 May 2014; Volume 9077, p. 90770U. [Google Scholar]
  38. Ranney, K.; Gallagher, K.; Martone, A.; Mazzaro, G.; Sherbondy, K.; Narayanan, R. Instantaneous, stepped-frequency, nonlinear radar. In Proceedings of the Radar Sensor Technology XIX and Active and Passive Signatures VI, Baltimore, MD, USA, 20–23 April 2015; Volume 9461, p. 946122. [Google Scholar]
  39. McGowan, S.F.; Mazzaro, G.J.; Sherbondy, K.D.; Narayanan, R.M. Harmonic Phase Response of Nonlinear Radar Targets; Technical Report; Army Research Lab Sensors and Electron Devices Directorate: Adelphi, MD, USA, 2015. [Google Scholar]
  40. Mazzaro, G.J. Detection of Radio-Frequency Electronics by Stimulated Emission of Carrier Modulation. IEEE Trans. Aerosp. Electron. Syst. 2021, 58, 1021–1028. [Google Scholar] [CrossRef]
  41. Gallagher, K. Harmonic Radar: Theory and Applications to Nonlinear Target Detection, Tracking, Imaging and Classification. Ph.D. Thesis, Pennsylvania State University, University Park, PA, USA, 2015. [Google Scholar]
  42. Boylestad, R.L.; Nashelsky, L. Electronic Devices and Circuit Theory; Pearson Educación: Essex, UK, 2002. [Google Scholar]
  43. Tooley, M. Electronic Circuits-Fundamentals & Applications; Routledge: London, UK, 2007. [Google Scholar]
  44. Allen, B.W. Analogue Electronics for Higher Studies; Macmillan International Higher Education: London, UK, 1995. [Google Scholar]
  45. Floyd, T.L. Electronics Fundamentals: Circuits, Devices and Applications (Floyd Electronics Fundamentals Series); Prentice-Hall Inc.: Essex, UK, 2006. [Google Scholar]
  46. Joanes, D.; Gill, C. Comparing measures of sample skewness and kurtosis. J. R. Stat. Soc. Ser. D (Stat.) 1998, 47, 183–189. [Google Scholar] [CrossRef]
  47. Duda, R.O.; Hart, P.E.; Stork, D.G. Pattern Classification; John Wiley & Sons: Hoboken, NJ, USA, 2012. [Google Scholar]
Figure 1. Schematics of the ECUTs.
Remotesensing 14 02953 g001
Figure 2. Illustration of the Frequency-Swept Harmonic Radar (FSHR) approach.
Remotesensing 14 02953 g002
Figure 3. Received powers at first three harmonics of the cascaded amplifier circuits.
Remotesensing 14 02953 g003
Figure 4. Received powers at first three harmonics of the common emitter amplifier circuits.
Remotesensing 14 02953 g004
Figure 5. Received powers at first three harmonics of the sawtooth oscillator circuits.
Remotesensing 14 02953 g005
Figure 6. Scatter plots of variance, skewness, and kurtosis data in 3D harmonic space, SNR = 2 dB.
Remotesensing 14 02953 g006
Figure 7. Scatter plots of variance, skewness, and kurtosis data in 3D harmonic space, SNR = 14 dB.
Remotesensing 14 02953 g007
Figure 8. Classification performance of the statistical features for varying SNR values.
Remotesensing 14 02953 g008
Figure 9. Statistical feature space representation of second and third harmonics data, SNR = 2 dB.
Remotesensing 14 02953 g009
Figure 10. Classification performance of the harmonics in statistical feature space for varying SNR values.
Remotesensing 14 02953 g010
Figure 11. Classification performance presented in [9]: (a) Classification performance via statistical features [9] and (b) classification performance via each harmonic [9].
Remotesensing 14 02953 g011
Figure 12. Scatter plots of Fourier features in 3D harmonic space, SNR = 2 dB.
Remotesensing 14 02953 g012
Figure 13. Scatter plots of Fourier features in 3D harmonic space, SNR = 14 dB.
Remotesensing 14 02953 g013
Figure 14. Classification performance of the Fourier features in harmonic space for varying SNR values.
Remotesensing 14 02953 g014
Figure 15. Fourier feature space representation of second and third harmonics data, SNR = 2 dB.
Remotesensing 14 02953 g015
Figure 16. Fourier feature space representation of second and third harmonics data, SNR = 14 dB.
Remotesensing 14 02953 g016
Figure 17. Classification performance of the harmonics in Fourier feature space for varying SNR values.
Remotesensing 14 02953 g017
Figure 18. Classification performance via Fourier features in [9]: (a) classification performance via Fourier features for each frequency level in harmonic space [9] and (b) classification performance via Fourier features for each harmonic [9].
Remotesensing 14 02953 g018
Table 1. Confusion matrices for statistical features in first, second, and third harmonic space for SNR = 8 dB.
SNR = 8 dB
Variance Device 1Device 2Device 3
Device 1100%0%0%
Device 20%100%0%
Device 30%0%100%
Skewness Device 1Device 2Device 3
Device 174%25.8%0.2%
Device 219.1%80.7%0.2%
Device 30%0%100%
Kurtosis Device 1Device 2Device 3
Device 188.7%9.8%1.5%
Device 213.8%84.3%1.9%
Device 30.1%0%99.9%
Table 2. Confusion matrices for each harmonic in 3D statistical space for SNR = 8 dB.
SNR = 8 dB
2nd Harmonic Device 1Device 2Device 3
Device 154.8%40.2%5%
Device 231.3%67.8%0.9%
Device 30.5%0.3%99.2%
3rd Harmonic Device 1Device 2Device 3
Device 183.3%15.5%1.2%
Device 214.6%77.2%8.2%
Device 30.7%2.9%96.4%
Table 3. Classification performance of five electronic targets in [41].
Device12345
Mean100%99.4%88.7%99%89.6%
Std. Dev.0%1.1%4.6%1.4%4.8%
Min100%95.2%73.8%92.9%71.4%
Max100%100%100%100%100%
Table 4. Confusion matrices for Fourier features in first, second, and third harmonic spaces for SNR = 8 dB.
SNR = 8 dB
Low Frequency Device 1Device 2Device 3
Device 163.6%36.2%0.2%
Device 240.5%59.3%0.2%
Device 31%0.2%98.8%
Mid Frequency Device 1Device 2Device 3
Device 163.4%36.3%0.3%
Device 239%60.3%0.7%
Device 31.1%0.4%98.5%
High Frequency Device 1Device 2Device 3
Device 160.1%36.9%3%
Device 244.5%52.4%3.1%
Device 39.3%5.8%84.9%
Table 5. Confusion matrices for the harmonics in the Fourier feature space for SNR = 8 dB.
SNR = 8 dB
2nd Harmonic Device 1Device 2Device 3
Device 150.8%47.3%1.9%
Device 247.5%47.8%4.7%
Device 34.7%7.1%88.2%
3rd Harmonic Device 1Device 2Device 3
Device 148.5%39.9%11.6%
Device 236.3%61.4%2.3%
Device 39.4%2.7%87.9%
Table 6. Comparison table for all classification performances at SNR = 8 dB.
SNR = 8 dB
Harmonic Space
Variance100%
Skewness84.90%
Kurtosis90.97%
Low Frequency73.90%
Mid Frequency74.07%
High Frequency65.80%
Statistical Feature SpaceFourier Feature Space
2nd Harmonic73.93%62.27%
3rd Harmonic85.63%65.93%
Publisher’s Note: MDPI stays neutral with regard to jurisdictional claims in published maps and institutional affiliations.

