
Spatial and Temporal Variability of Key Bio-Temperature Indicators and Their Effects on Vegetation Dynamics in the Great Lakes Region of Central Asia

Abstract
:
1. Introduction
2. Data and Methods
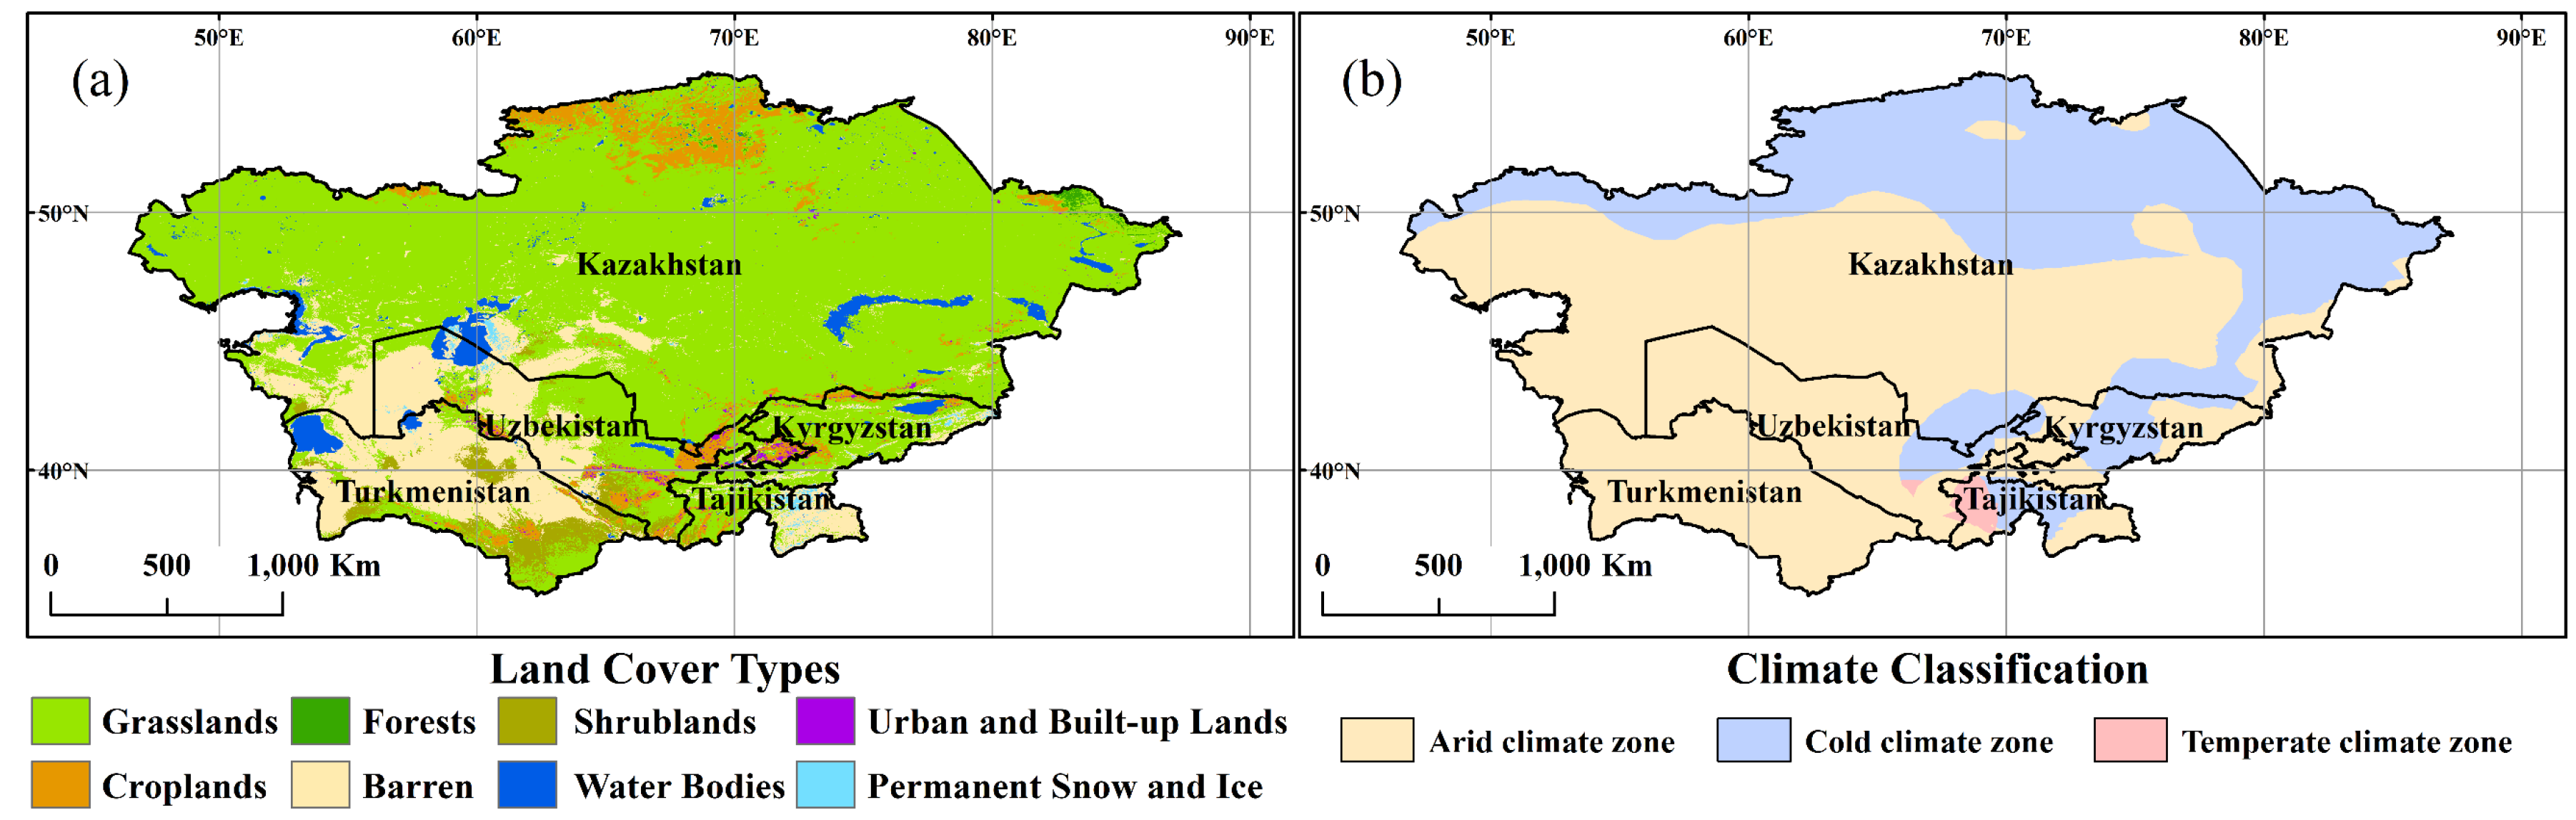
2.1. Study Azrea
2.2. Data
2.2.1. NDVI Data
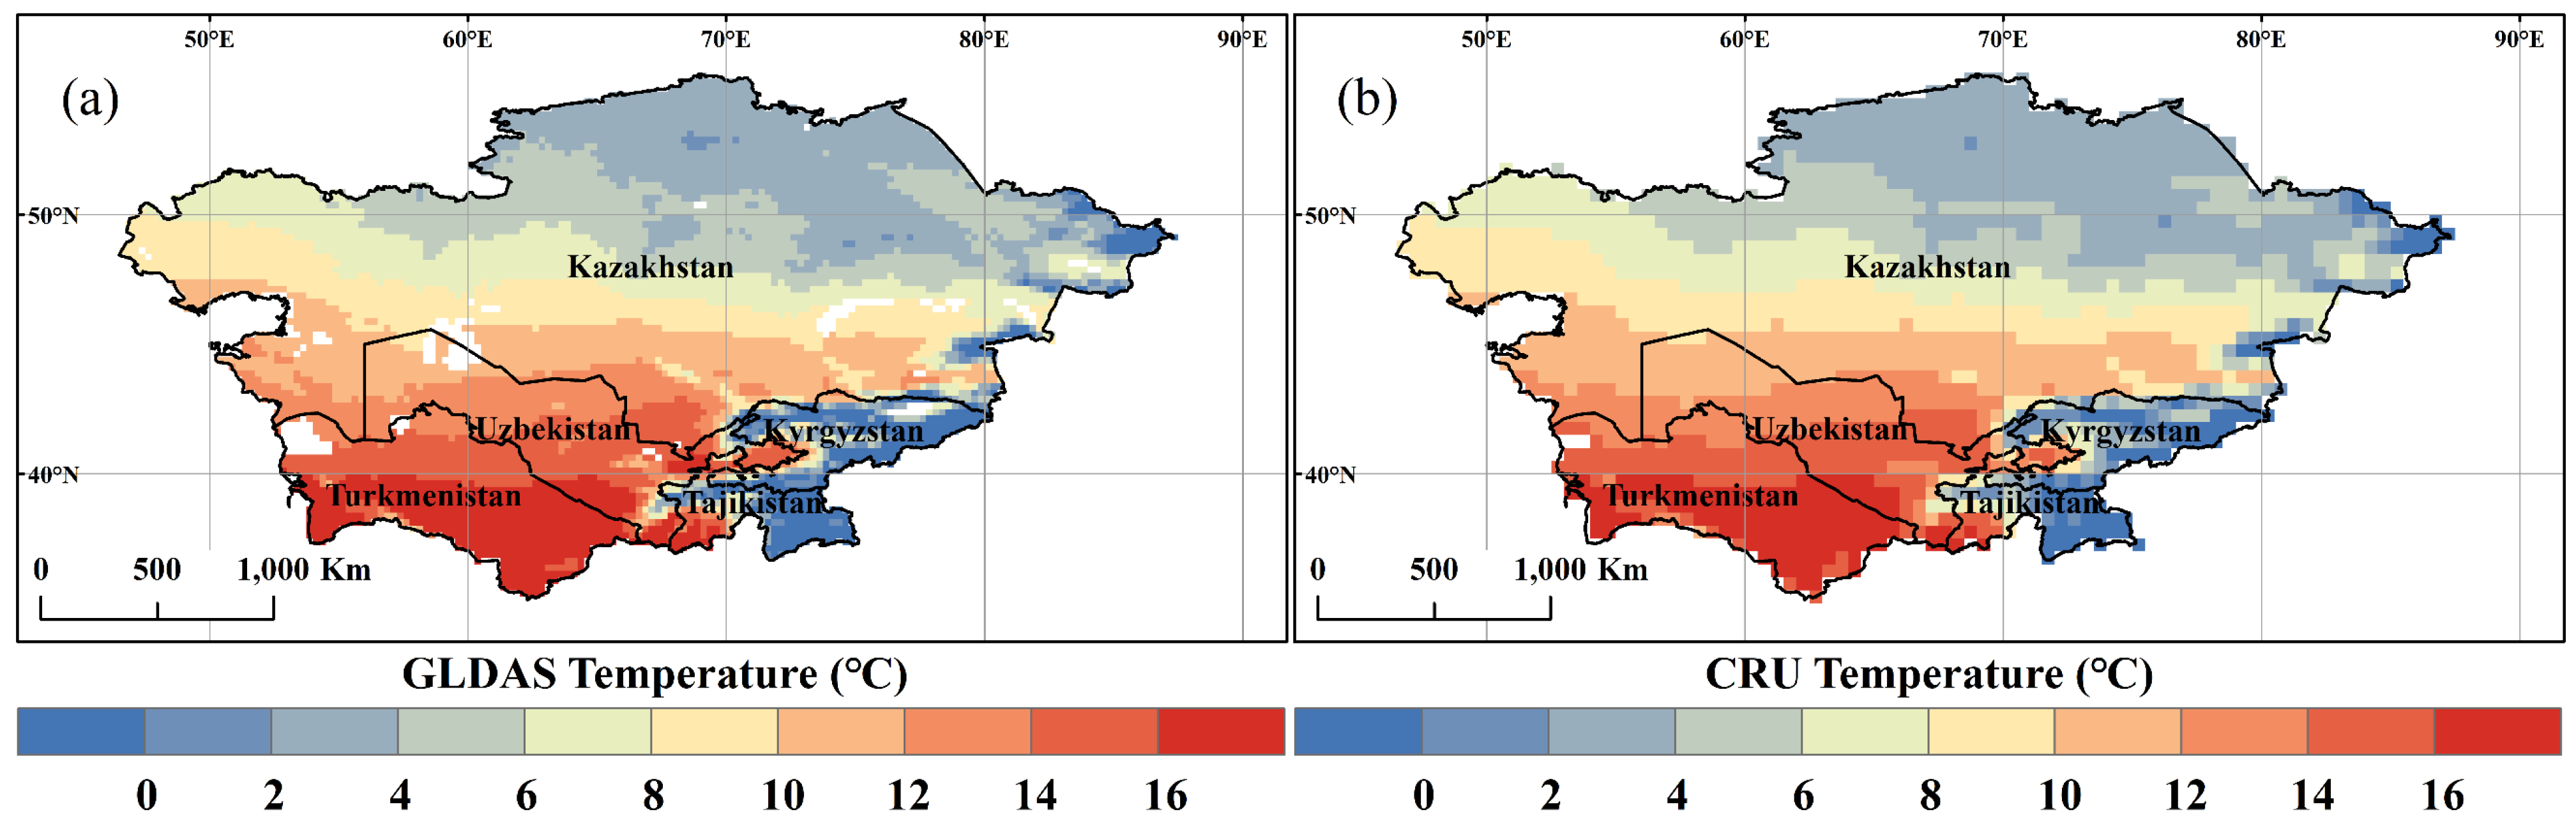
2.2.2. Climate Data
2.3. Methods
2.3.1. Bio-Temperature Indicators
2.3.2. Correlation Analysis
2.3.3. Trend Analysis and Significance Test
3. Results
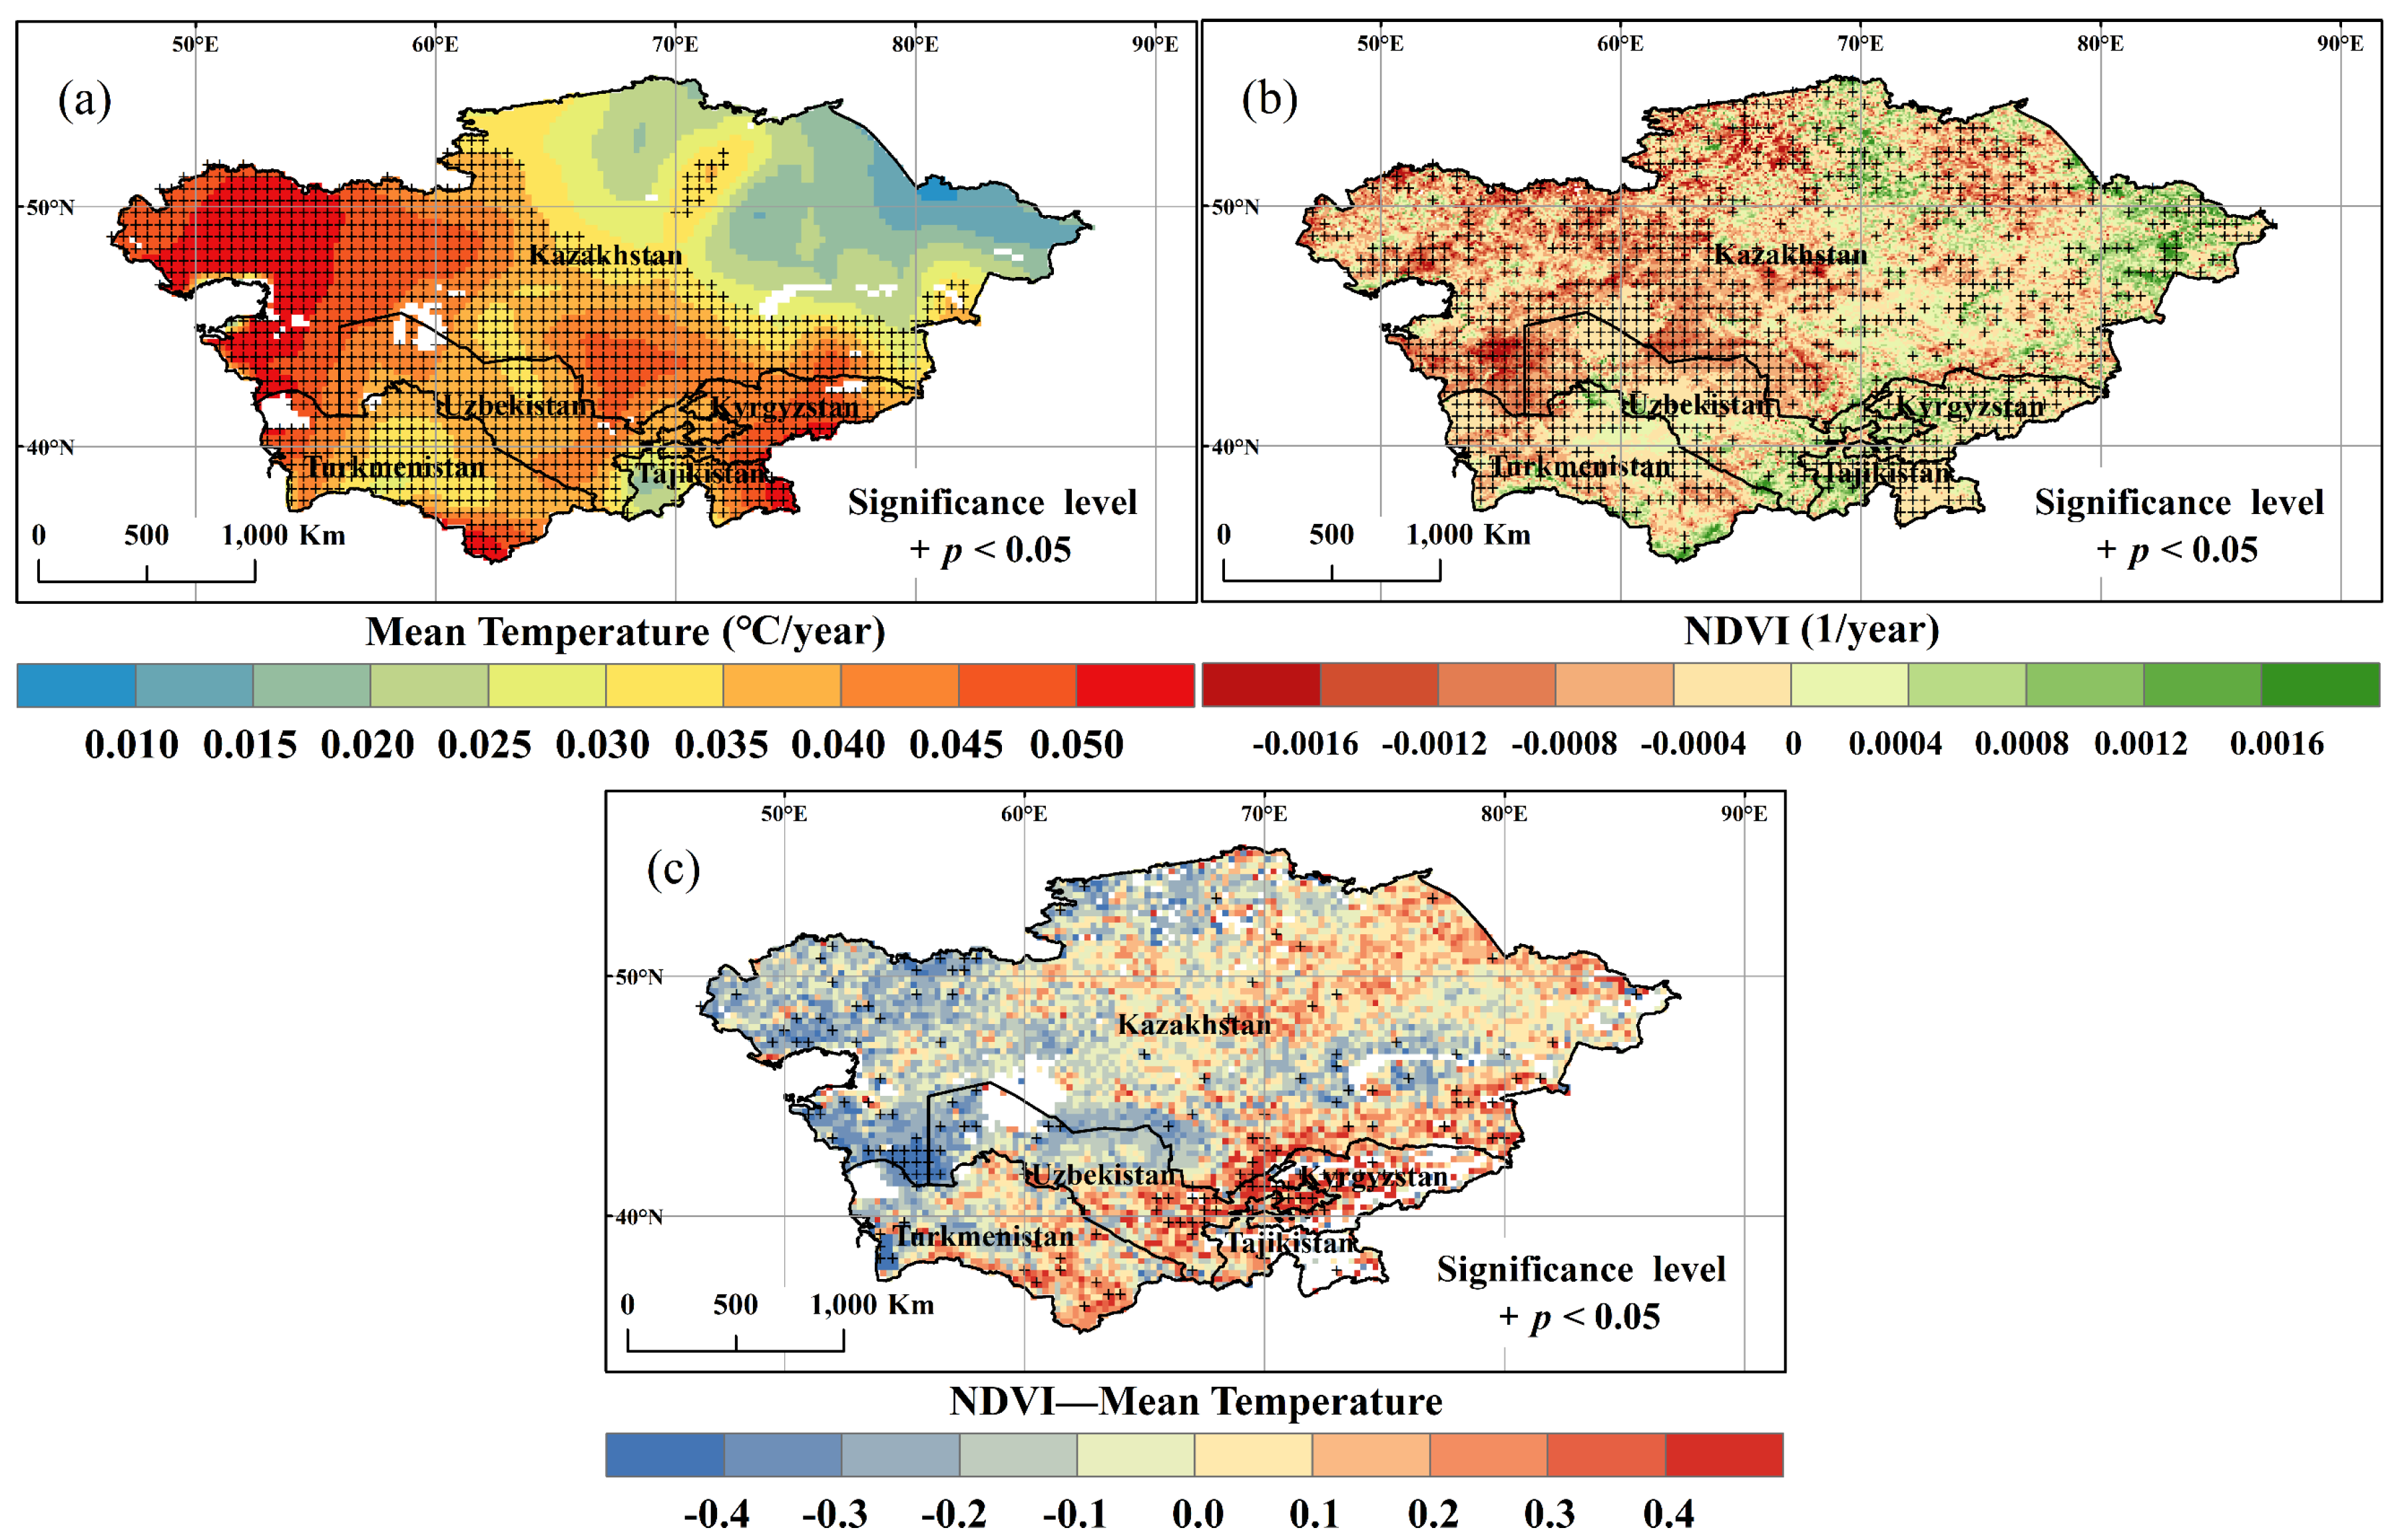
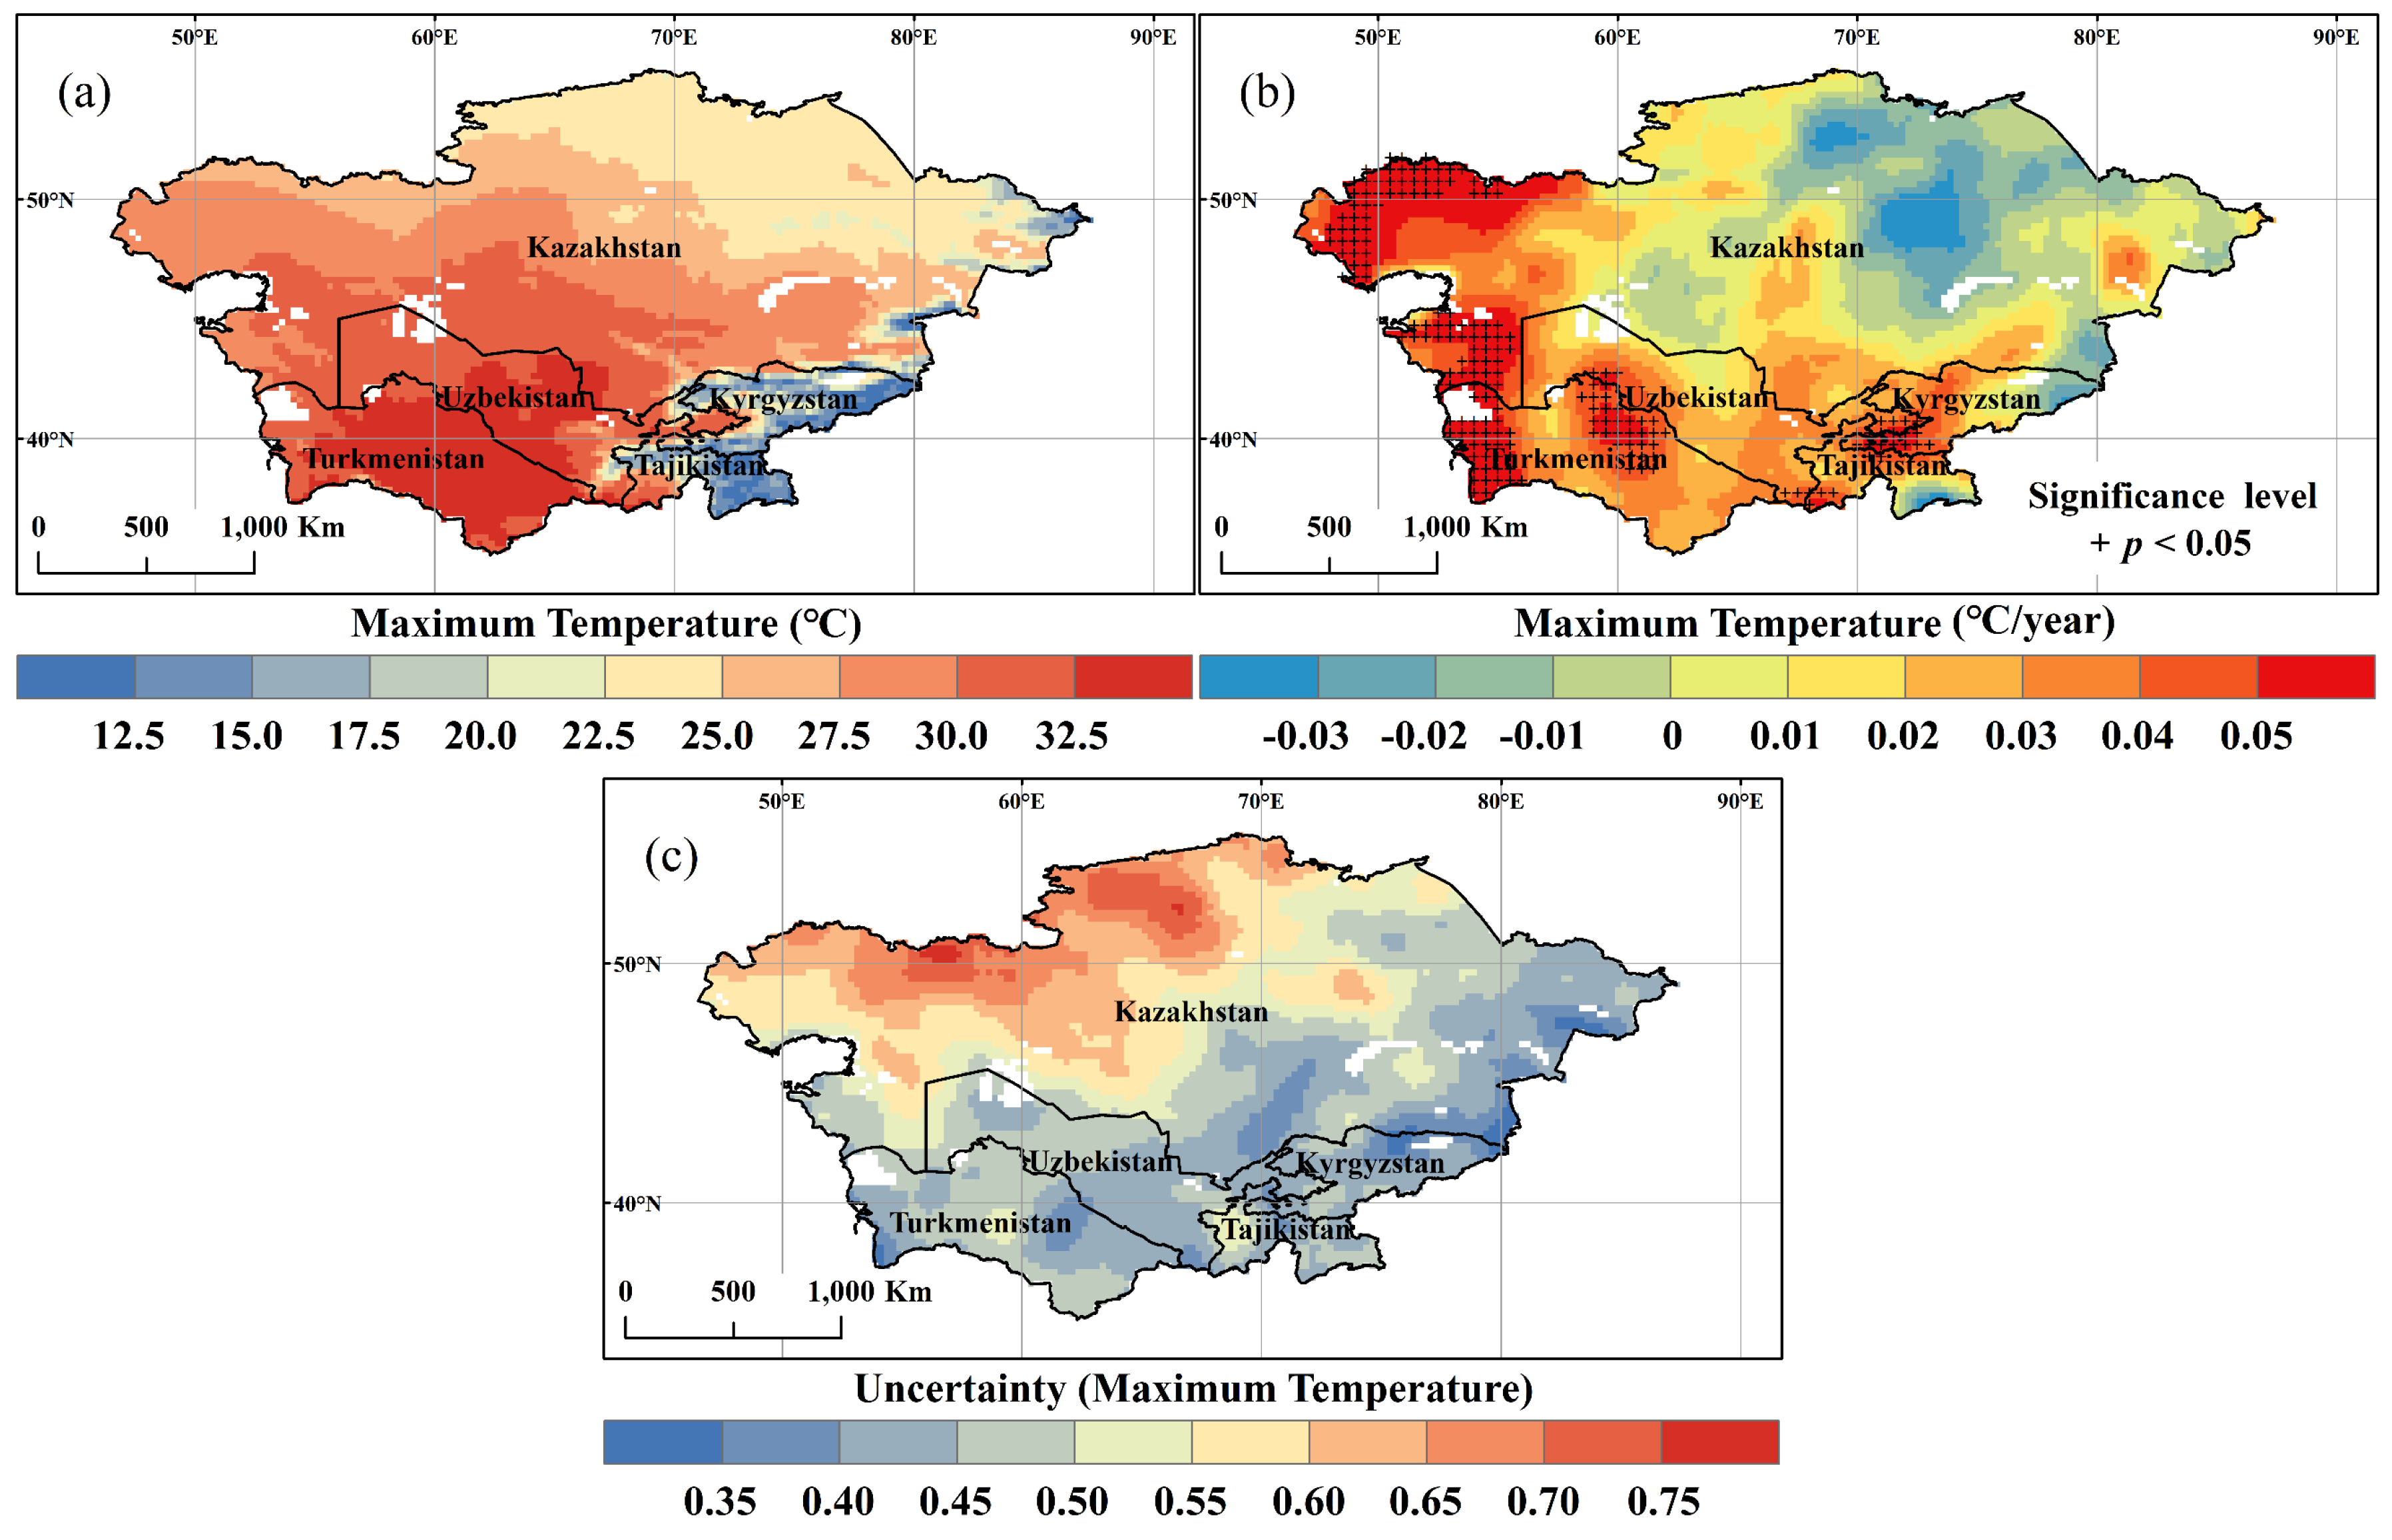
3.1. Spatial and Temporal Variation of Temperature and NDVI
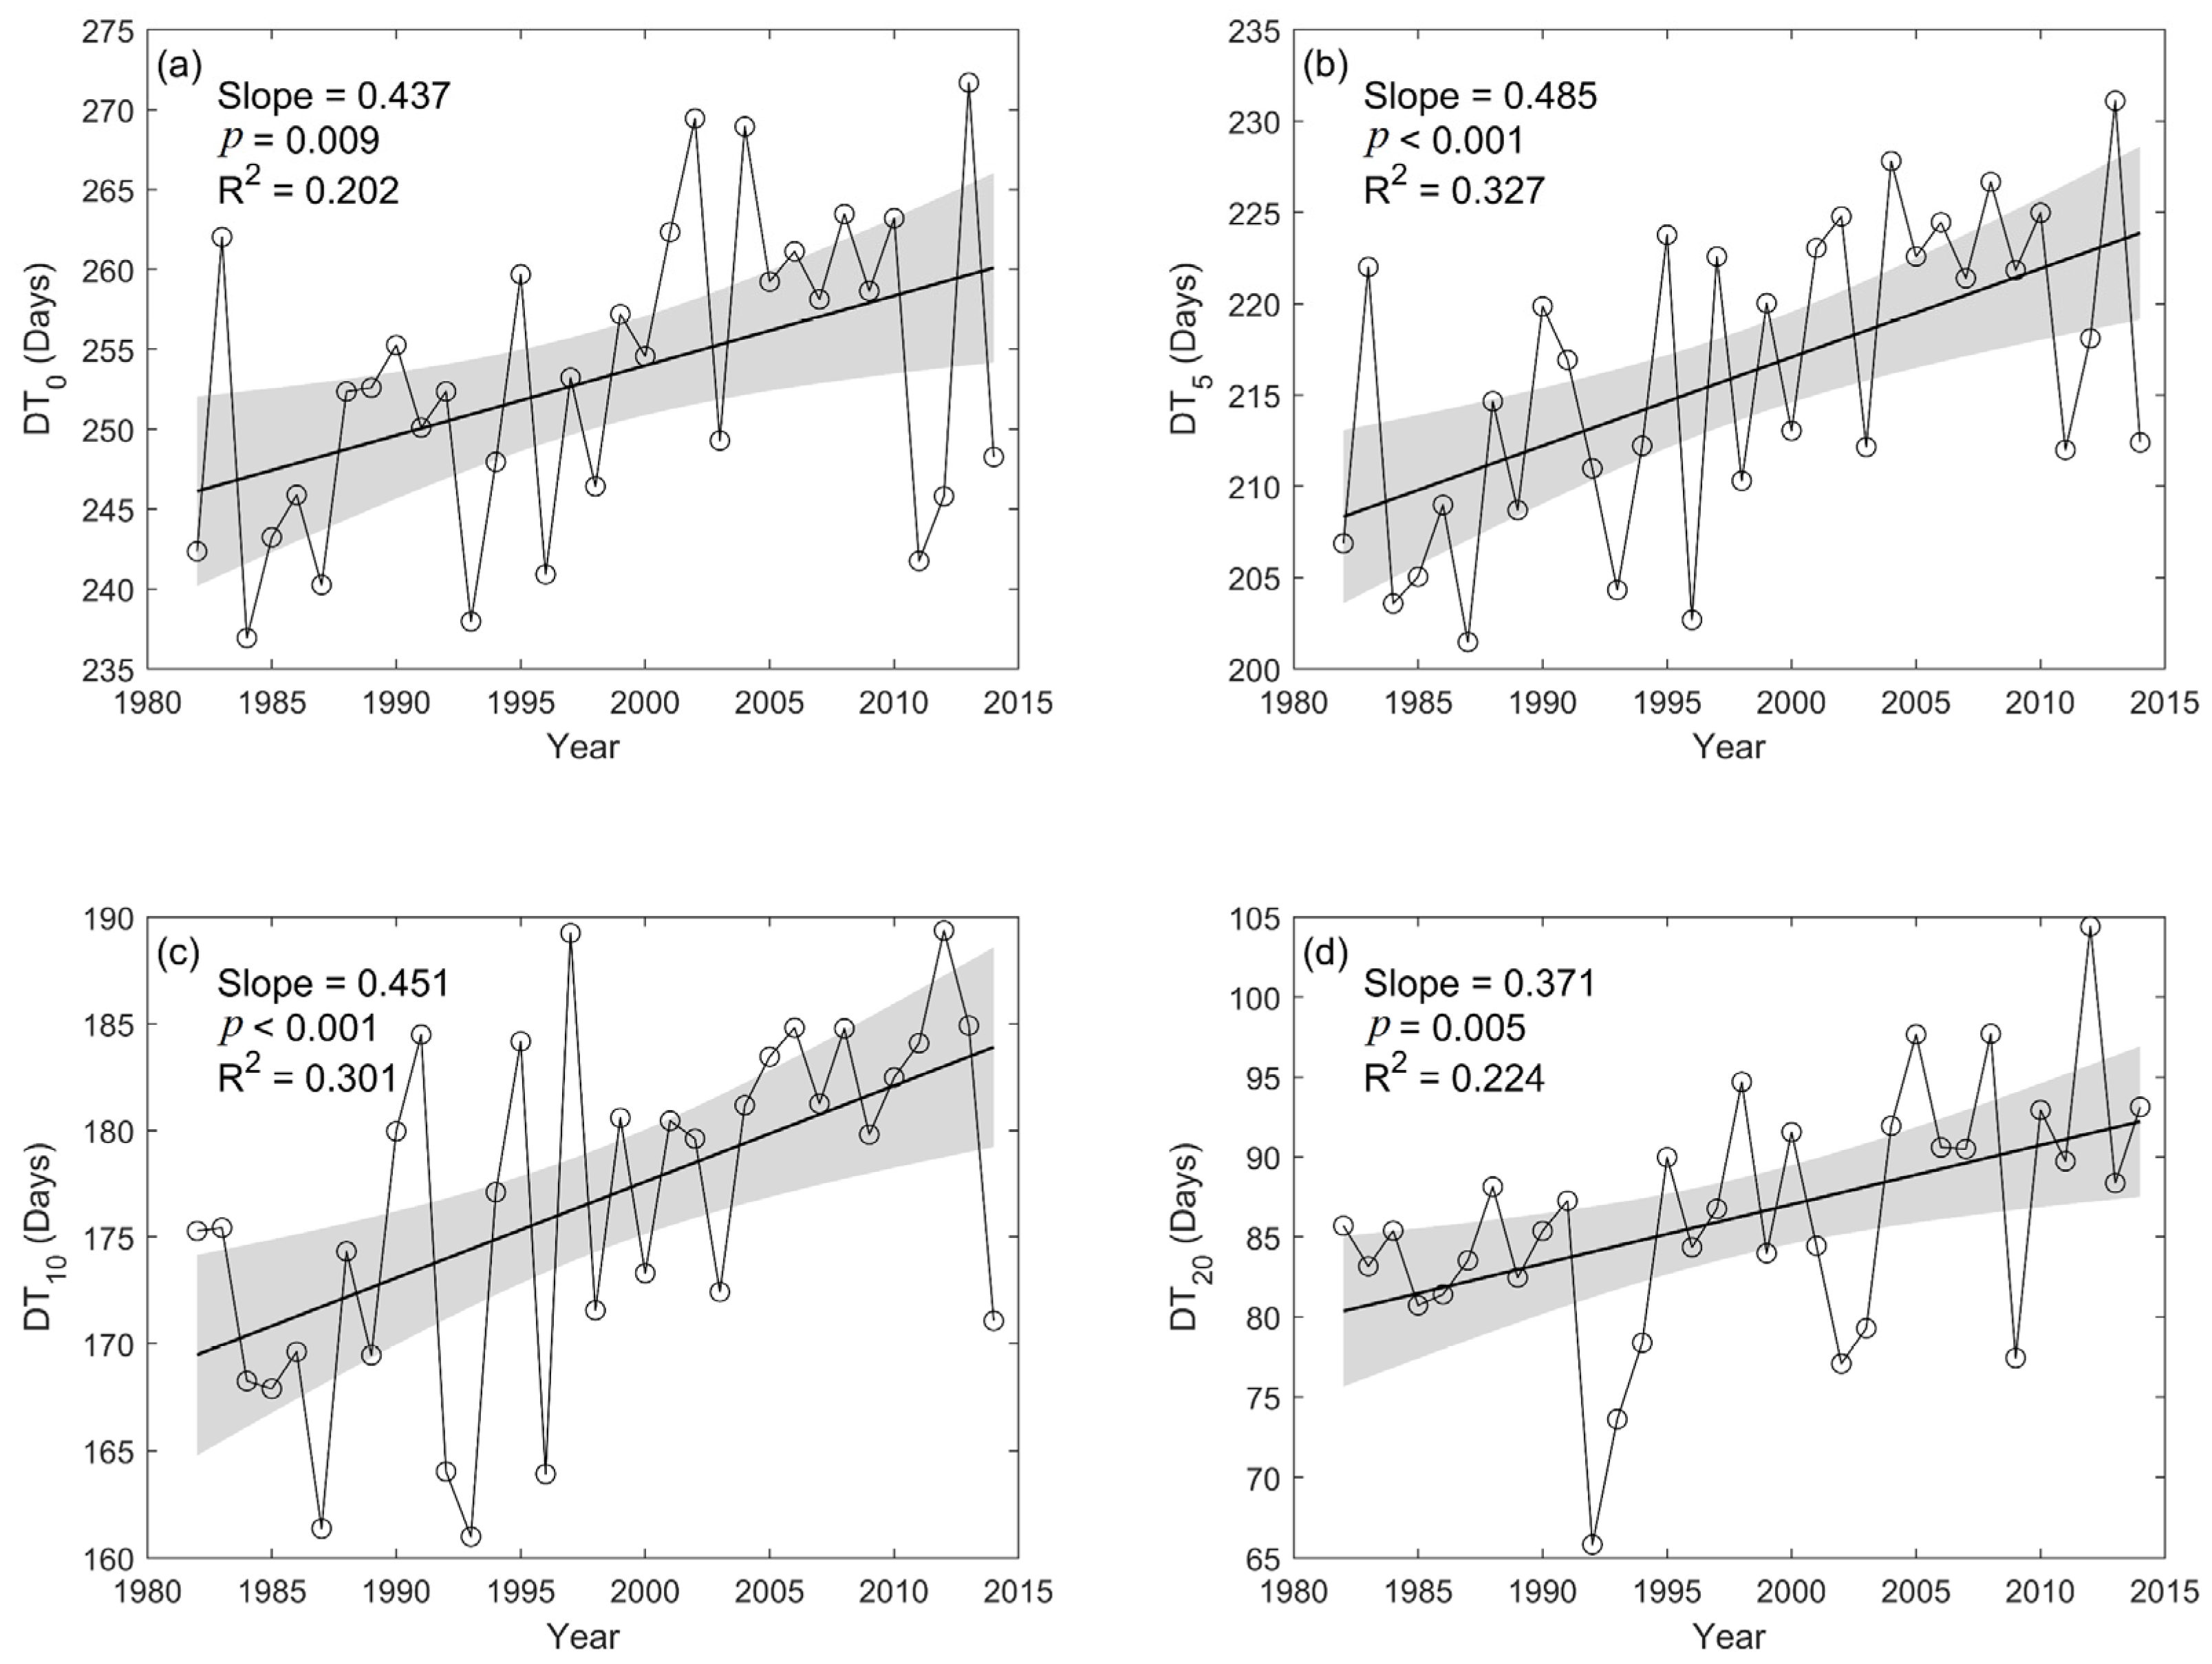
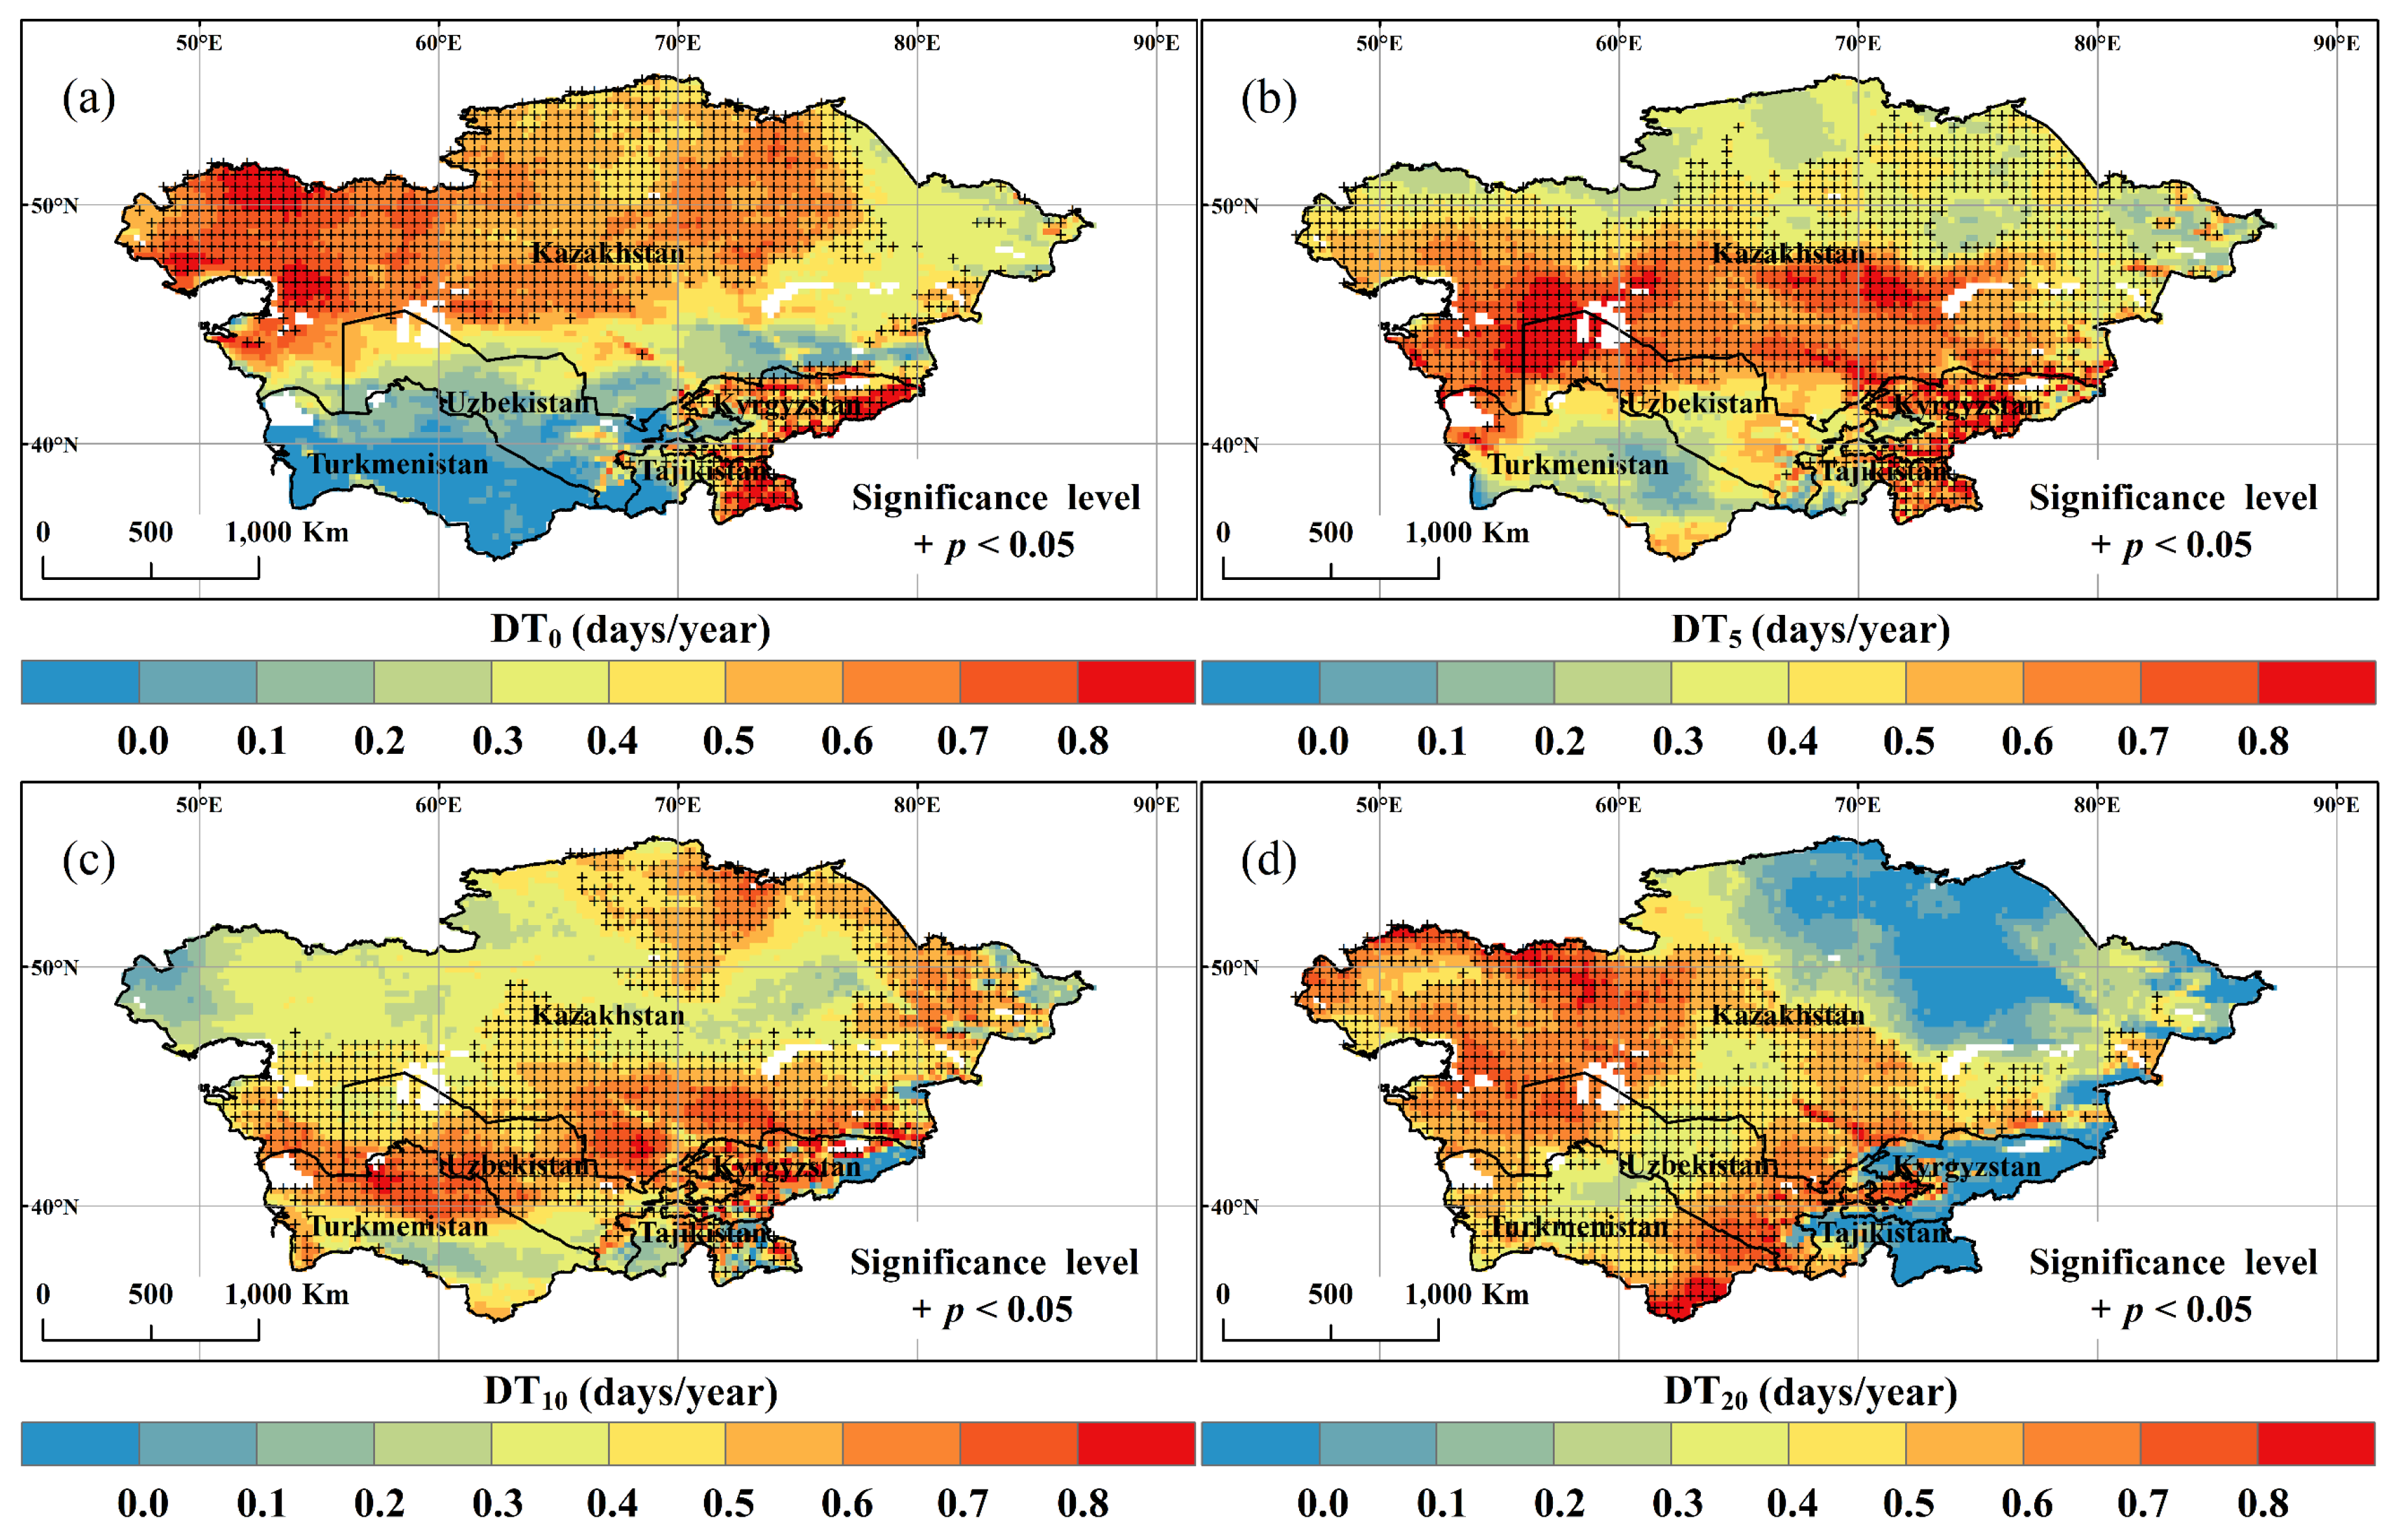
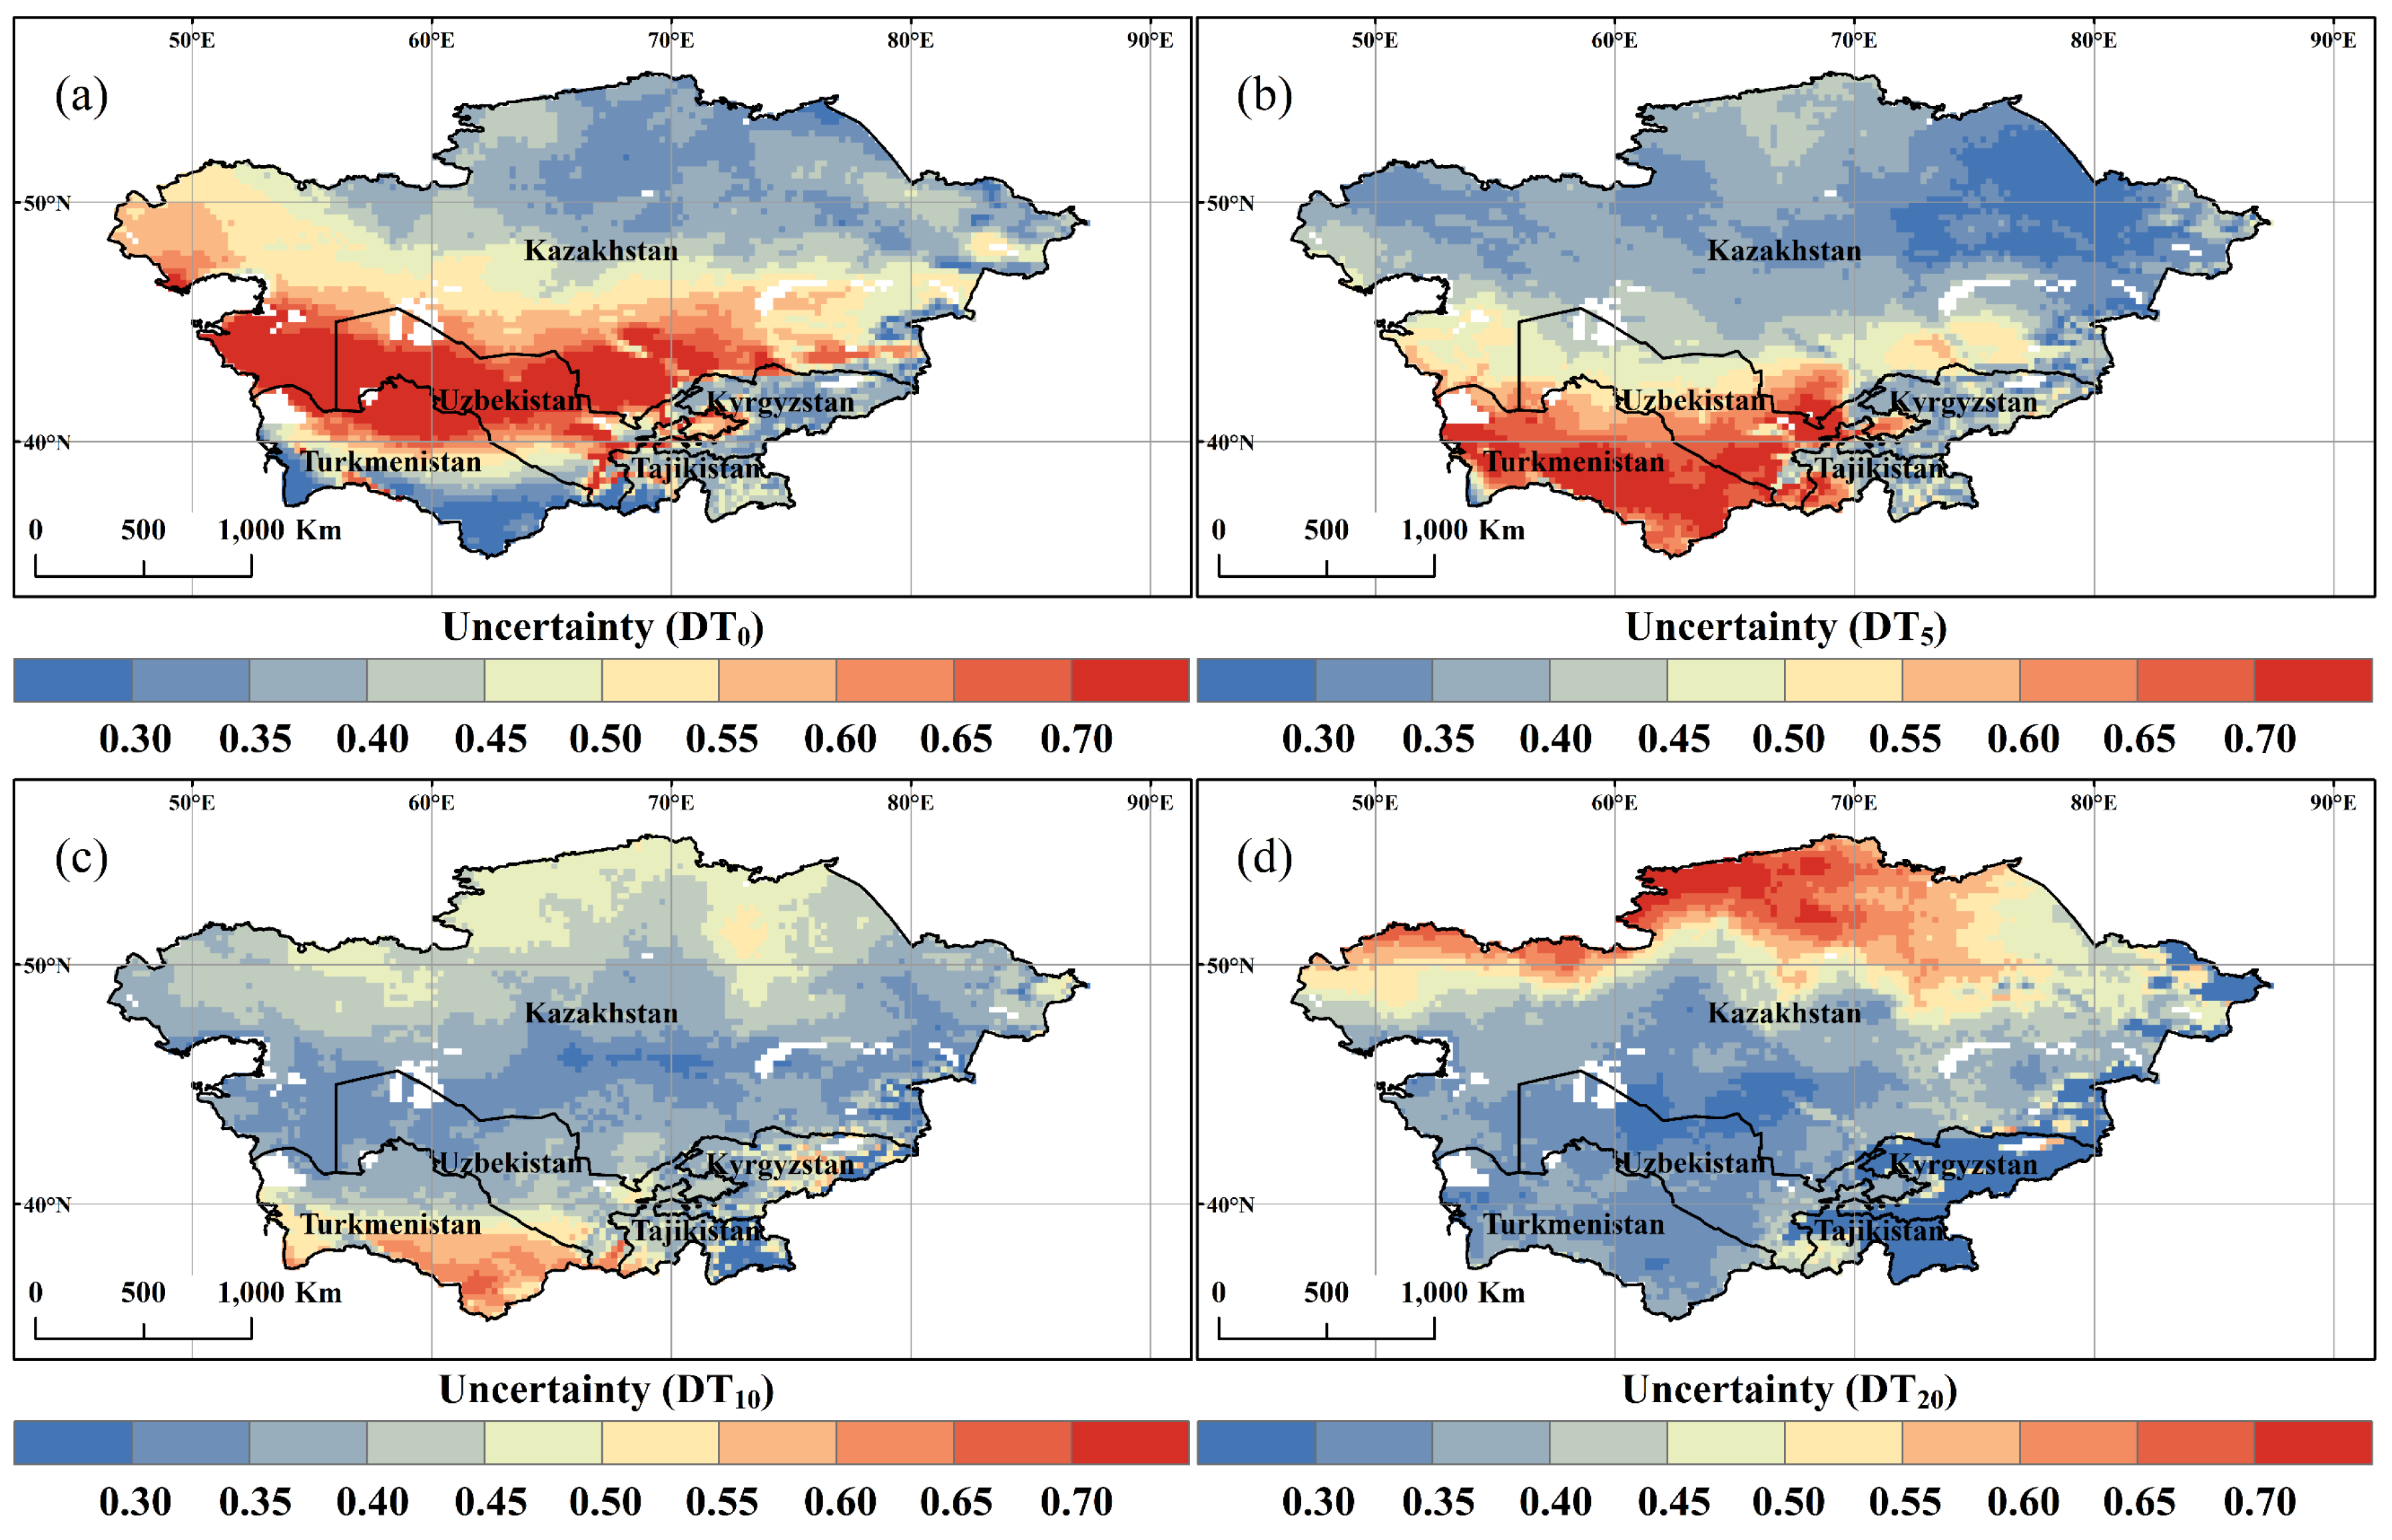
3.2. Spatial and Temporal Variation of DT0, DT5, DT10, and DT20
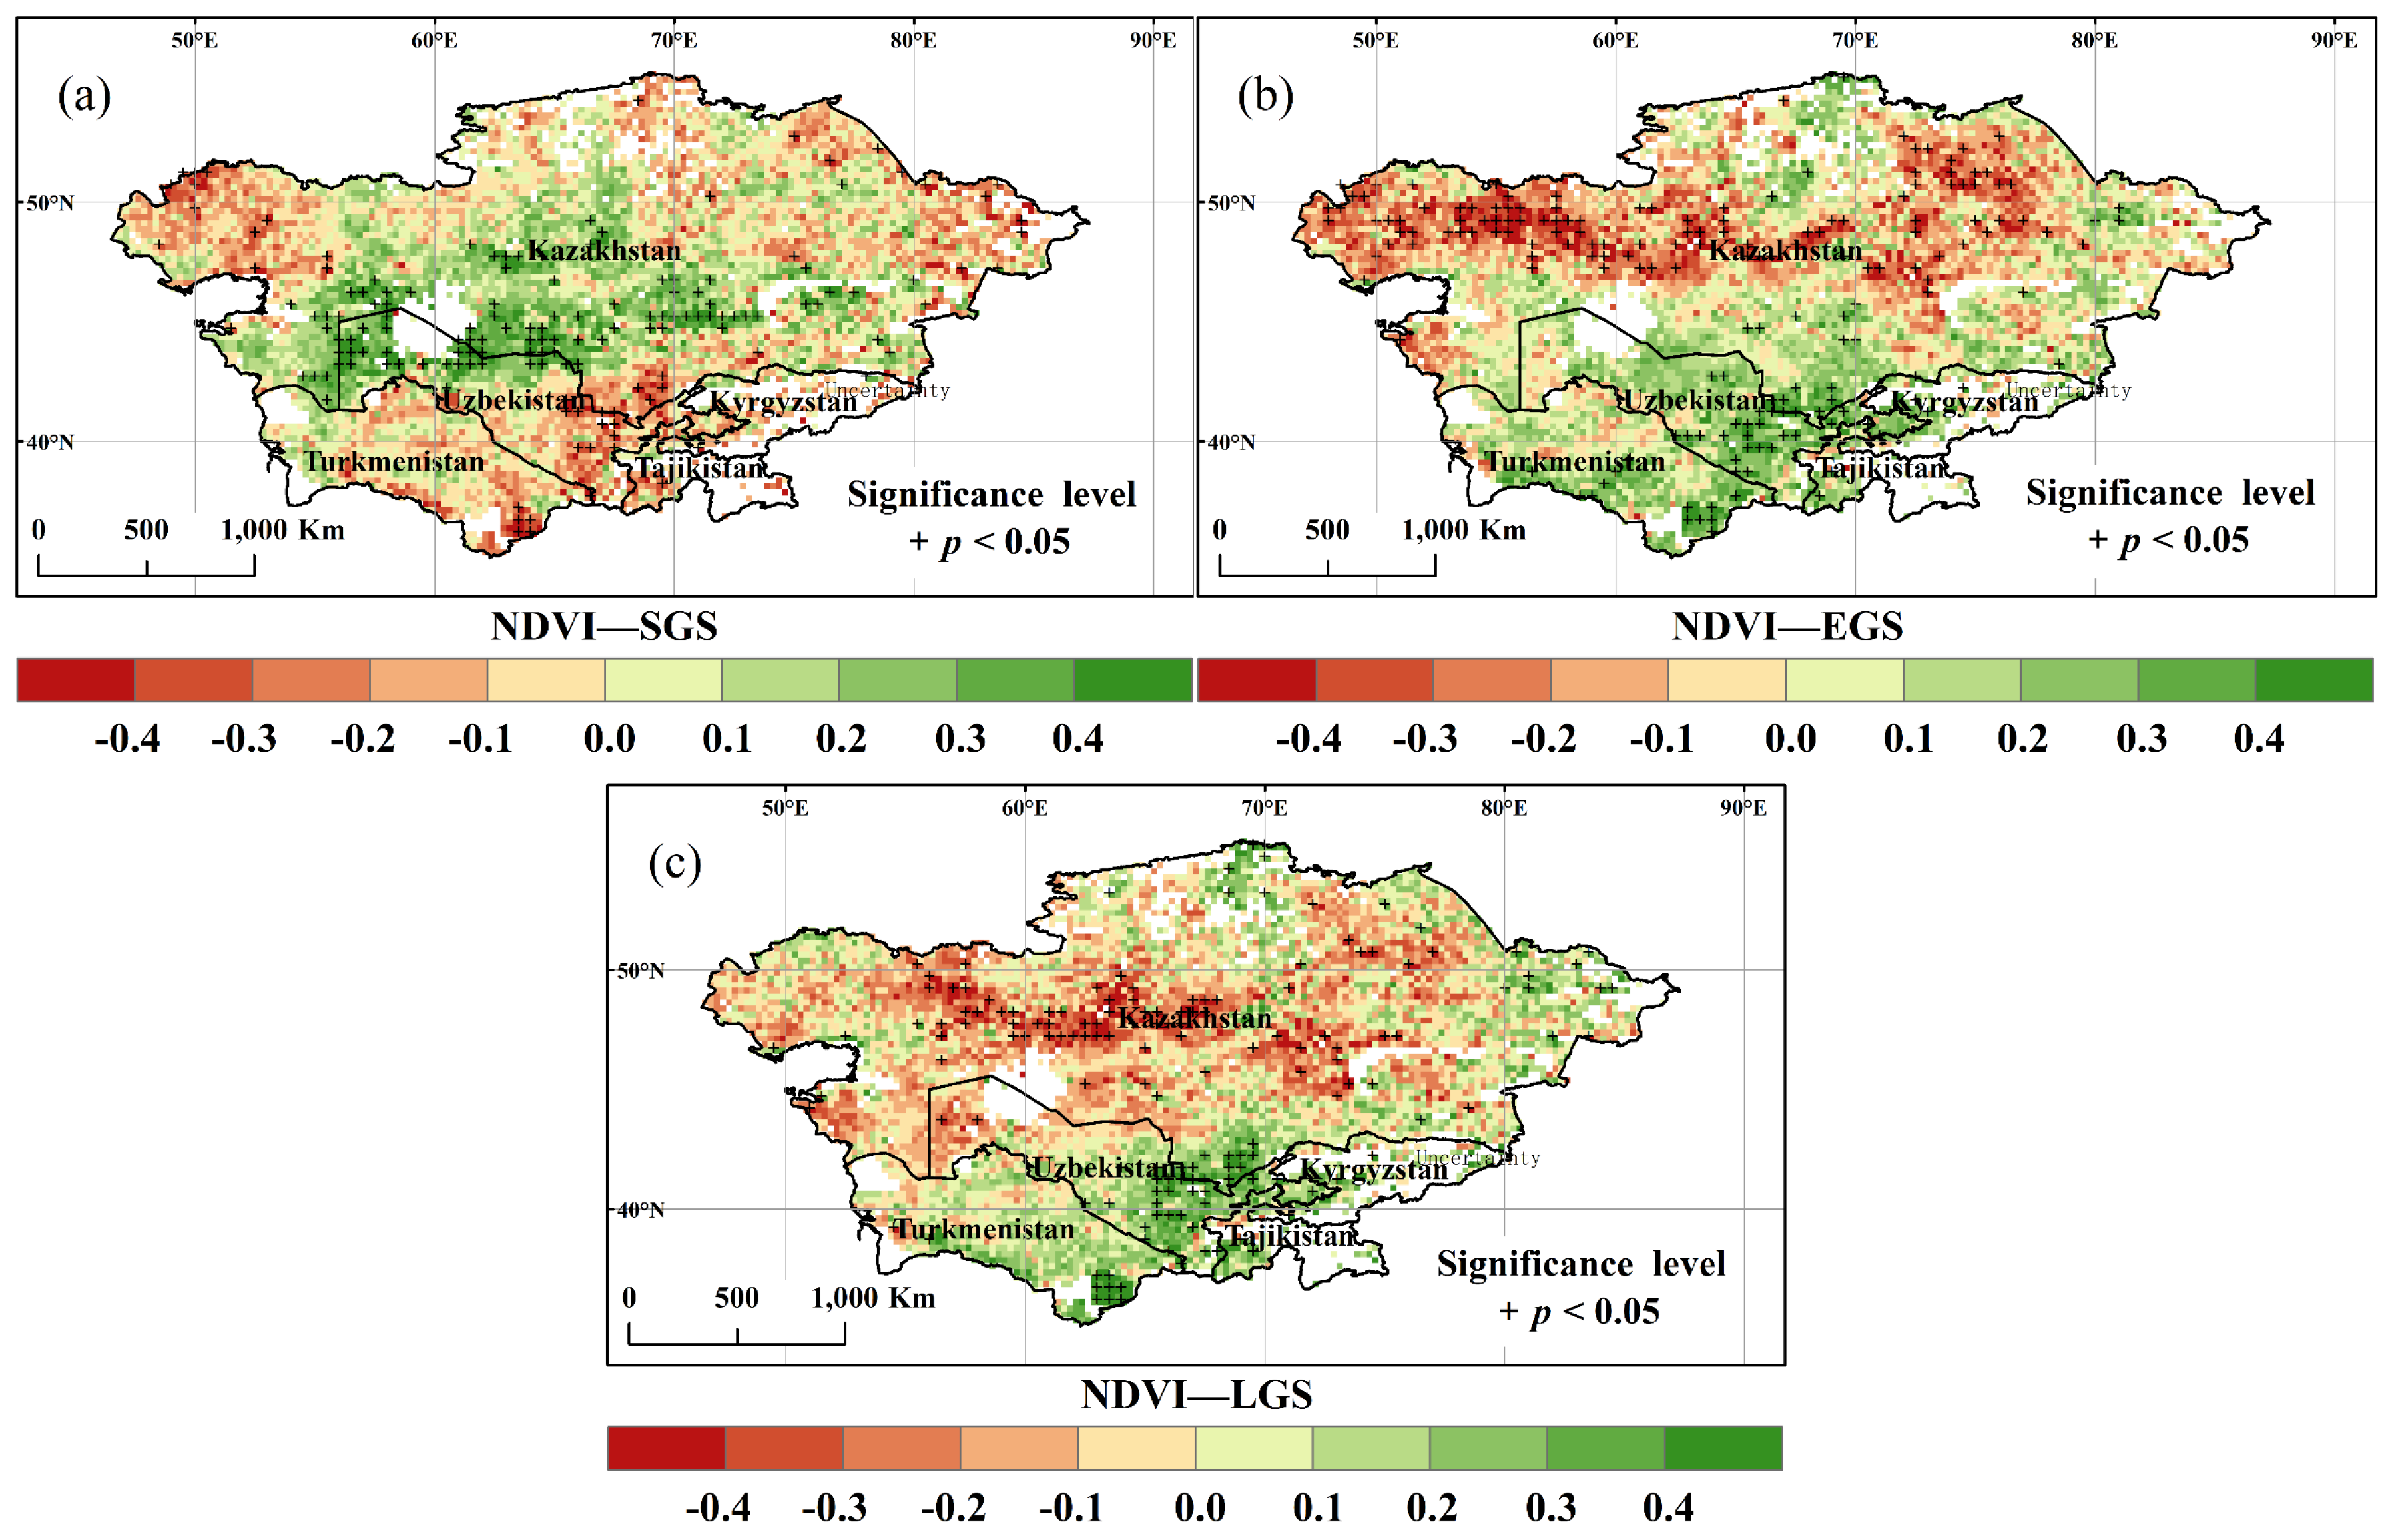
3.3. Spatial and Temporal Variation of SGS, EGS, and LGS
4. Discussion
5. Conclusions
- (1)
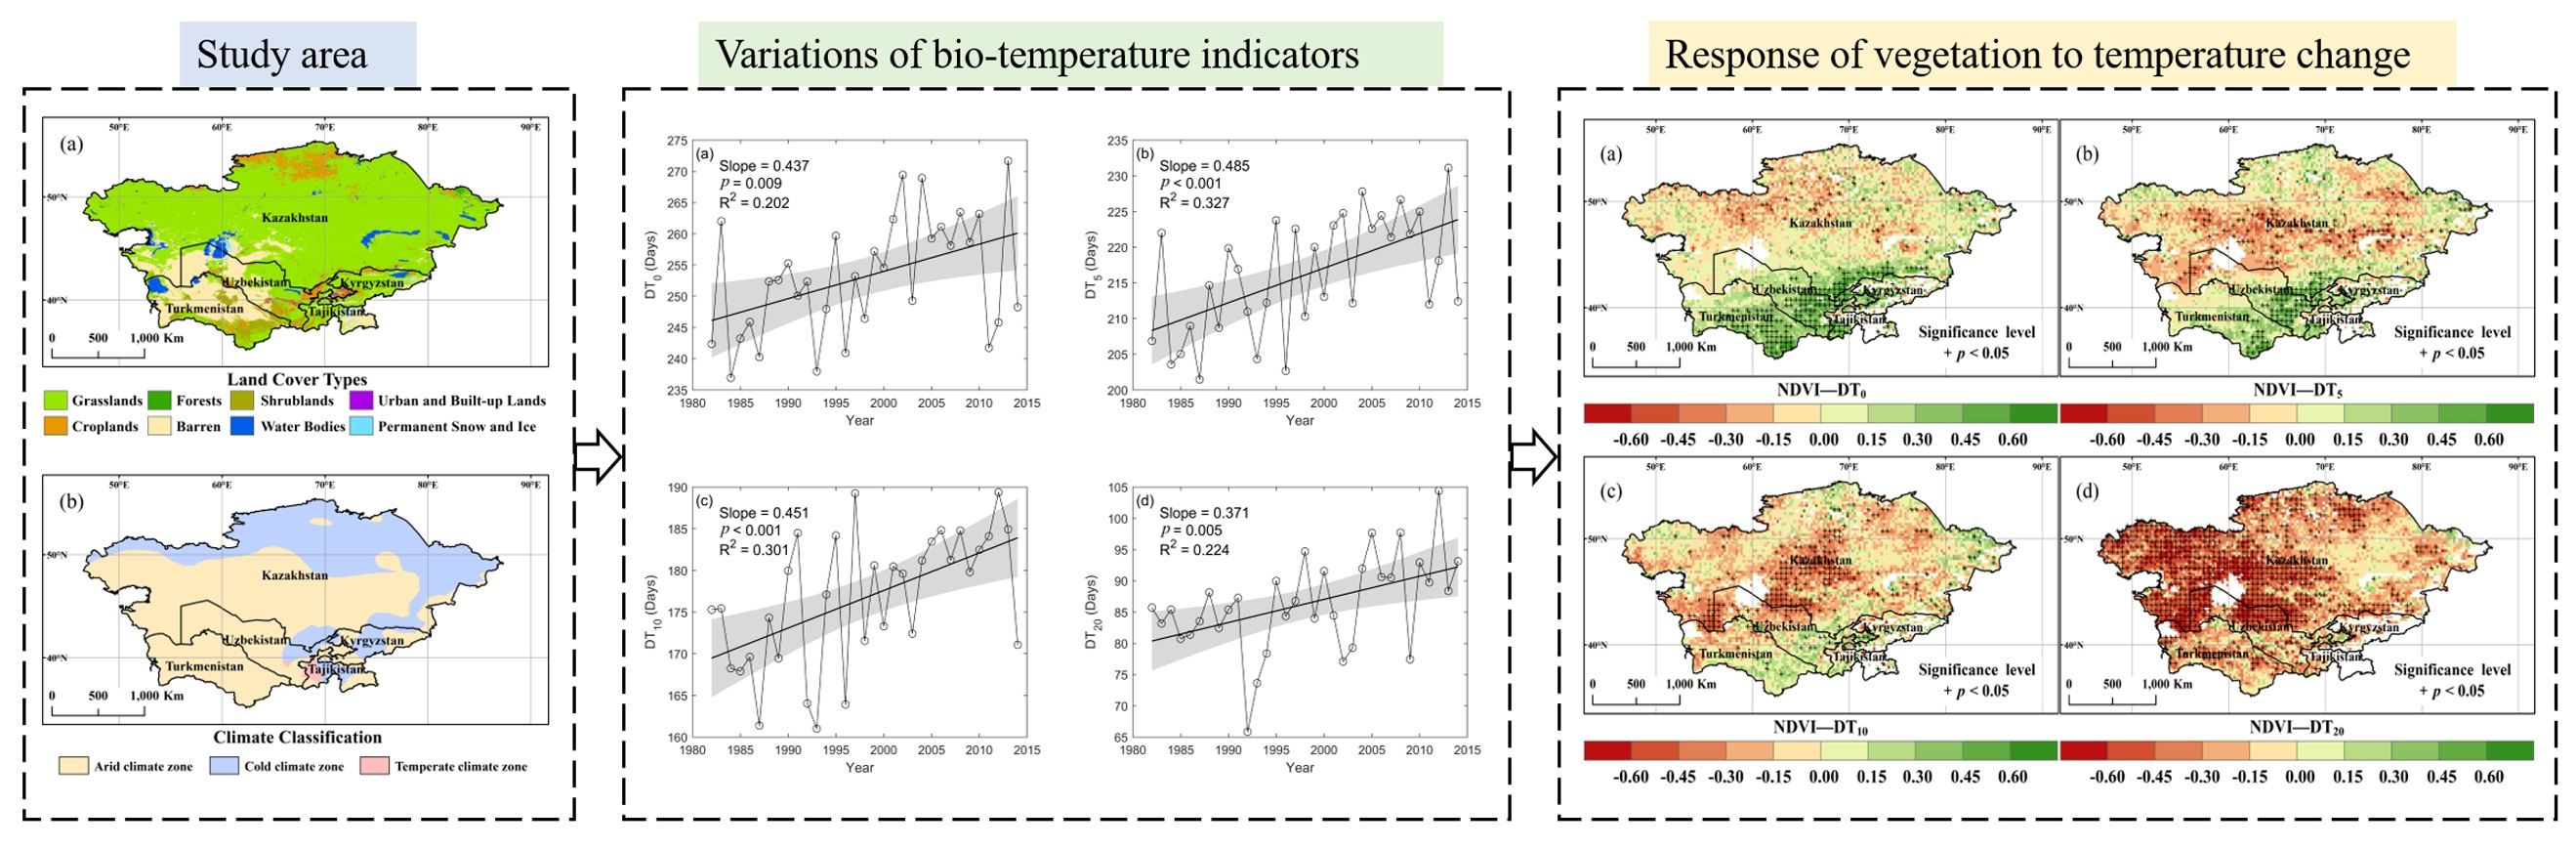
- With climate warming, DT0, DT5, DT10, and DT20 all showed a pronounced increasing trend at the regional scale. Spatially, there was significant heterogeneity in the four indicators, particularly an obvious decrease in DT20 was observed in the northeast.
- (2)
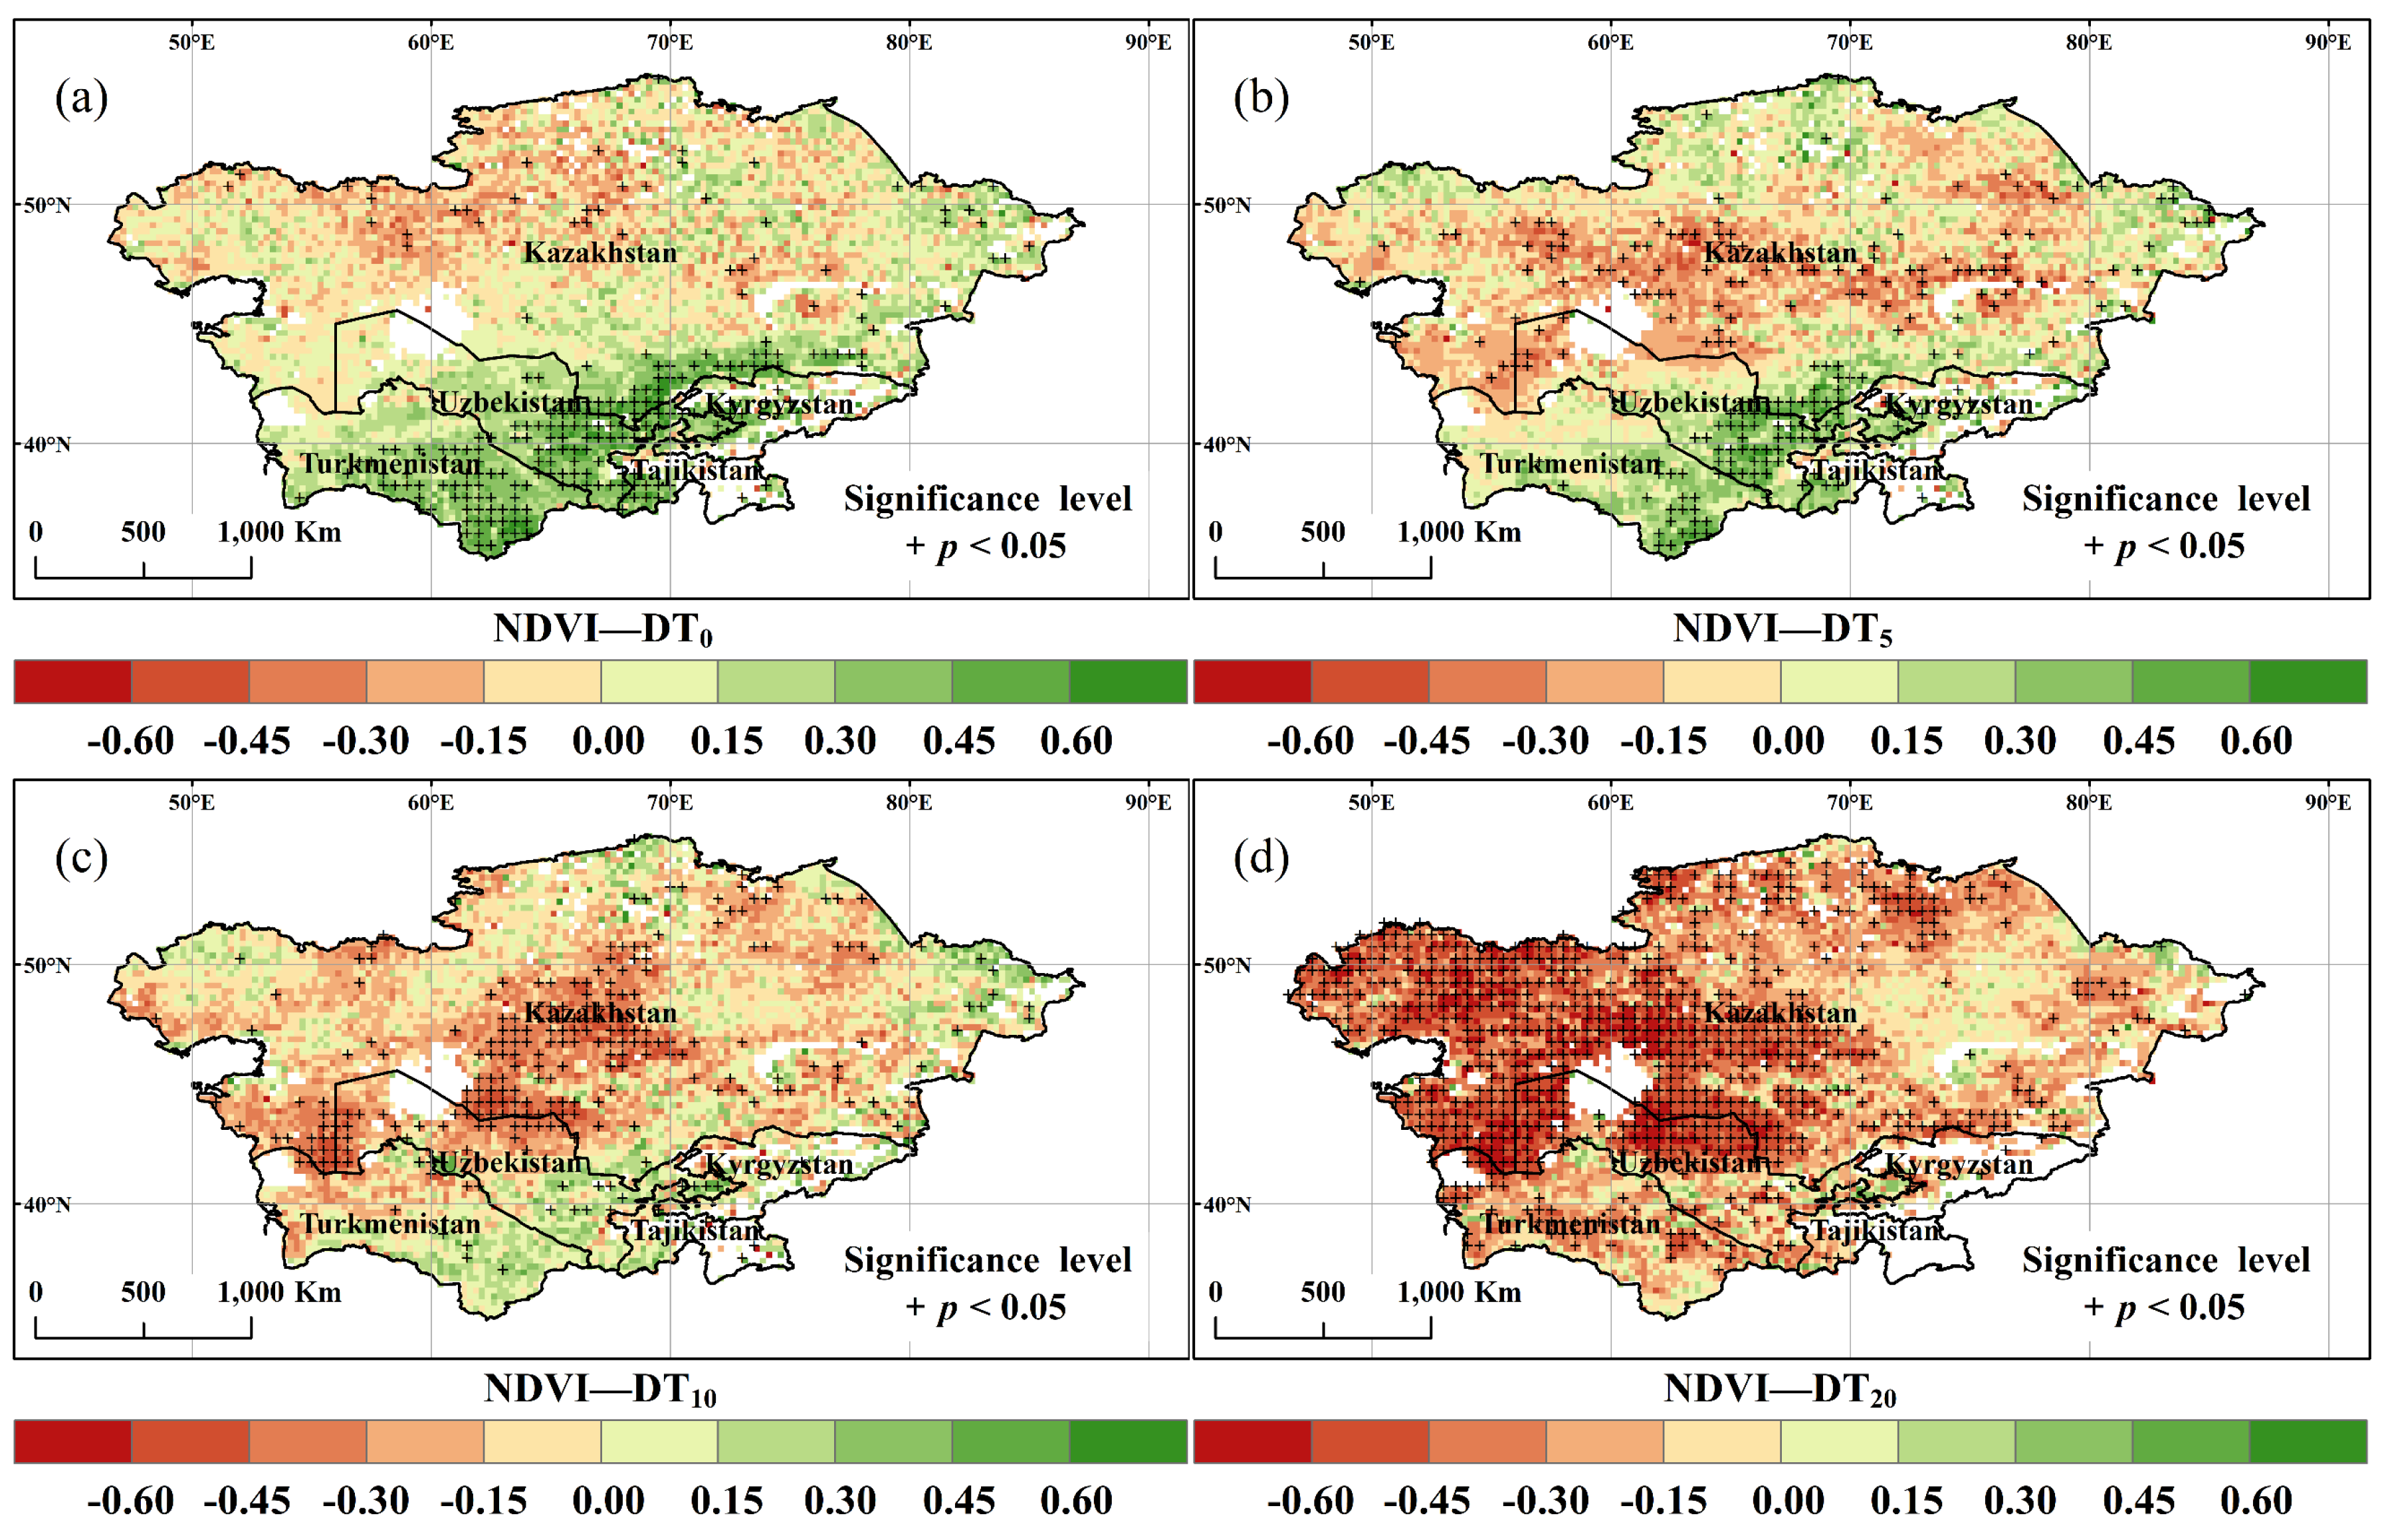
- Most of the study area showed that the negative correlation between DT0, DT5, DT10, DT20 with annual NDVI increased with increasing bio-temperature thresholds. In particular, more than 88.3% of the study area experienced a negative correlation between annual NDVI and DT20.
- (3)
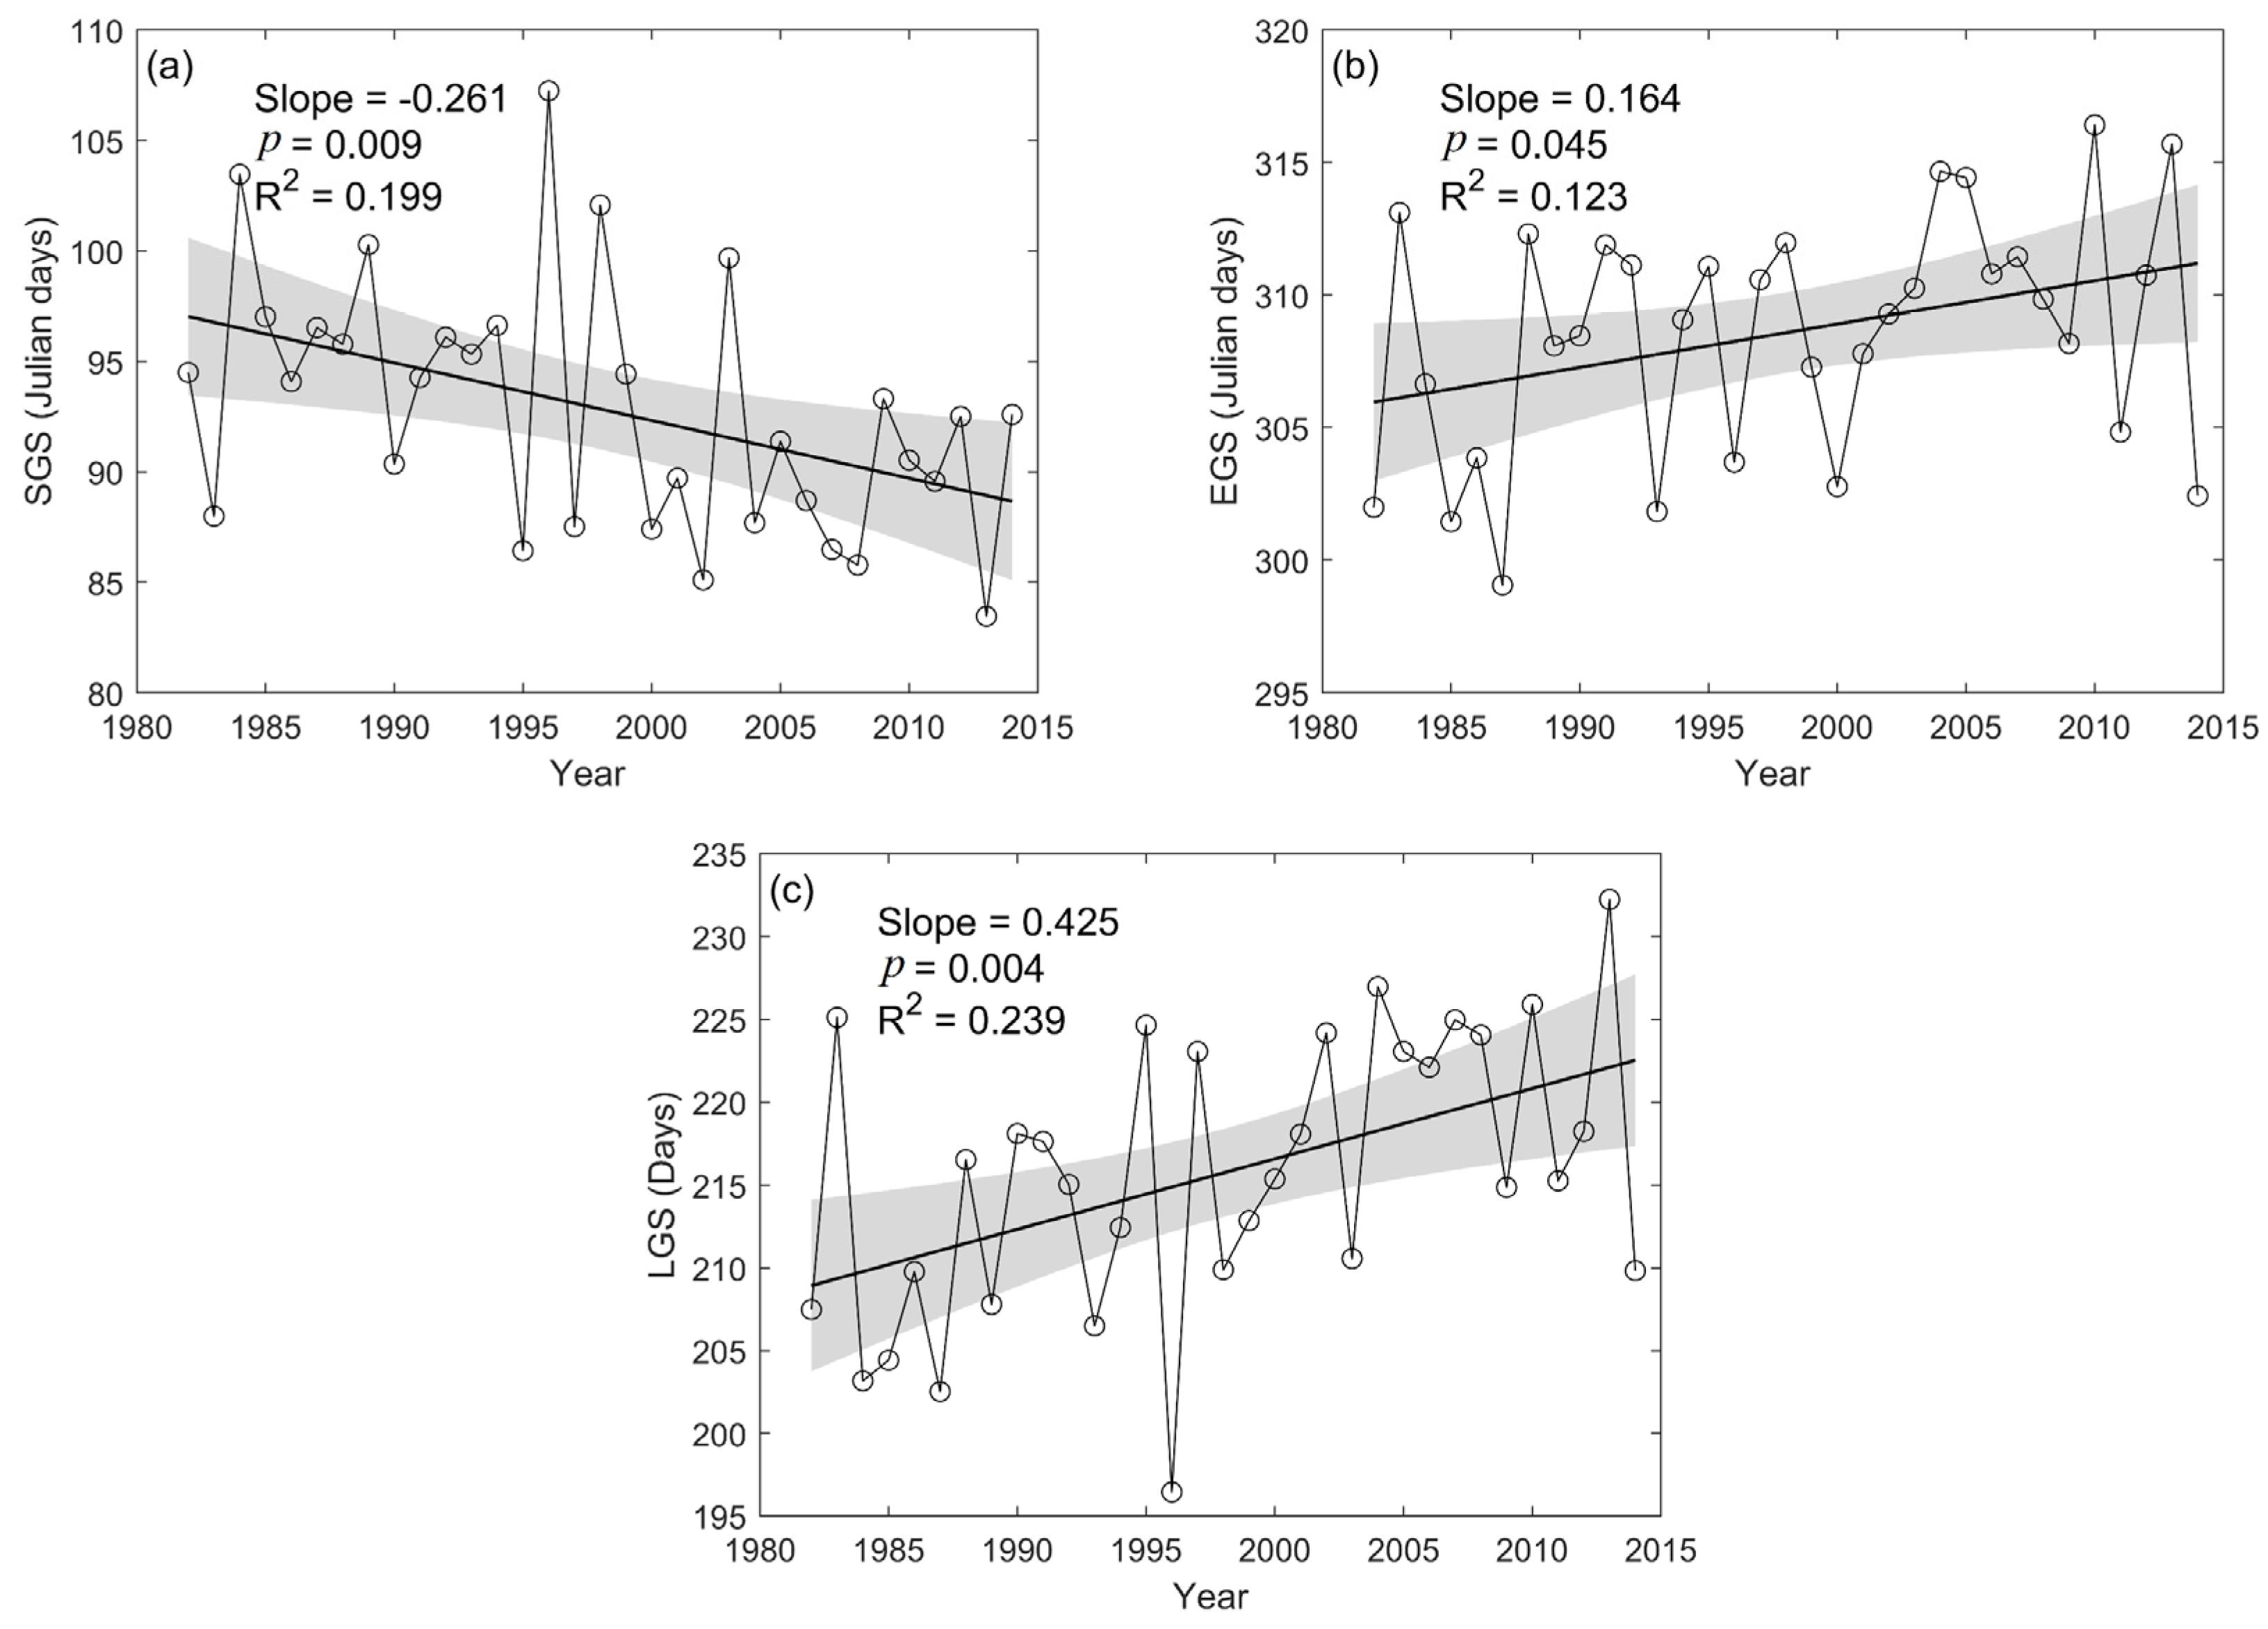
- During the entire study period, SGS exhibited a significantly advanced trend at a rate of −0.261 days/year, and EGS experienced a significantly delayed trend at a rate of 0.164 days/year. Therefore, the overall extending trend in LGS was mainly attributed to the advanced SGS.
- (4)
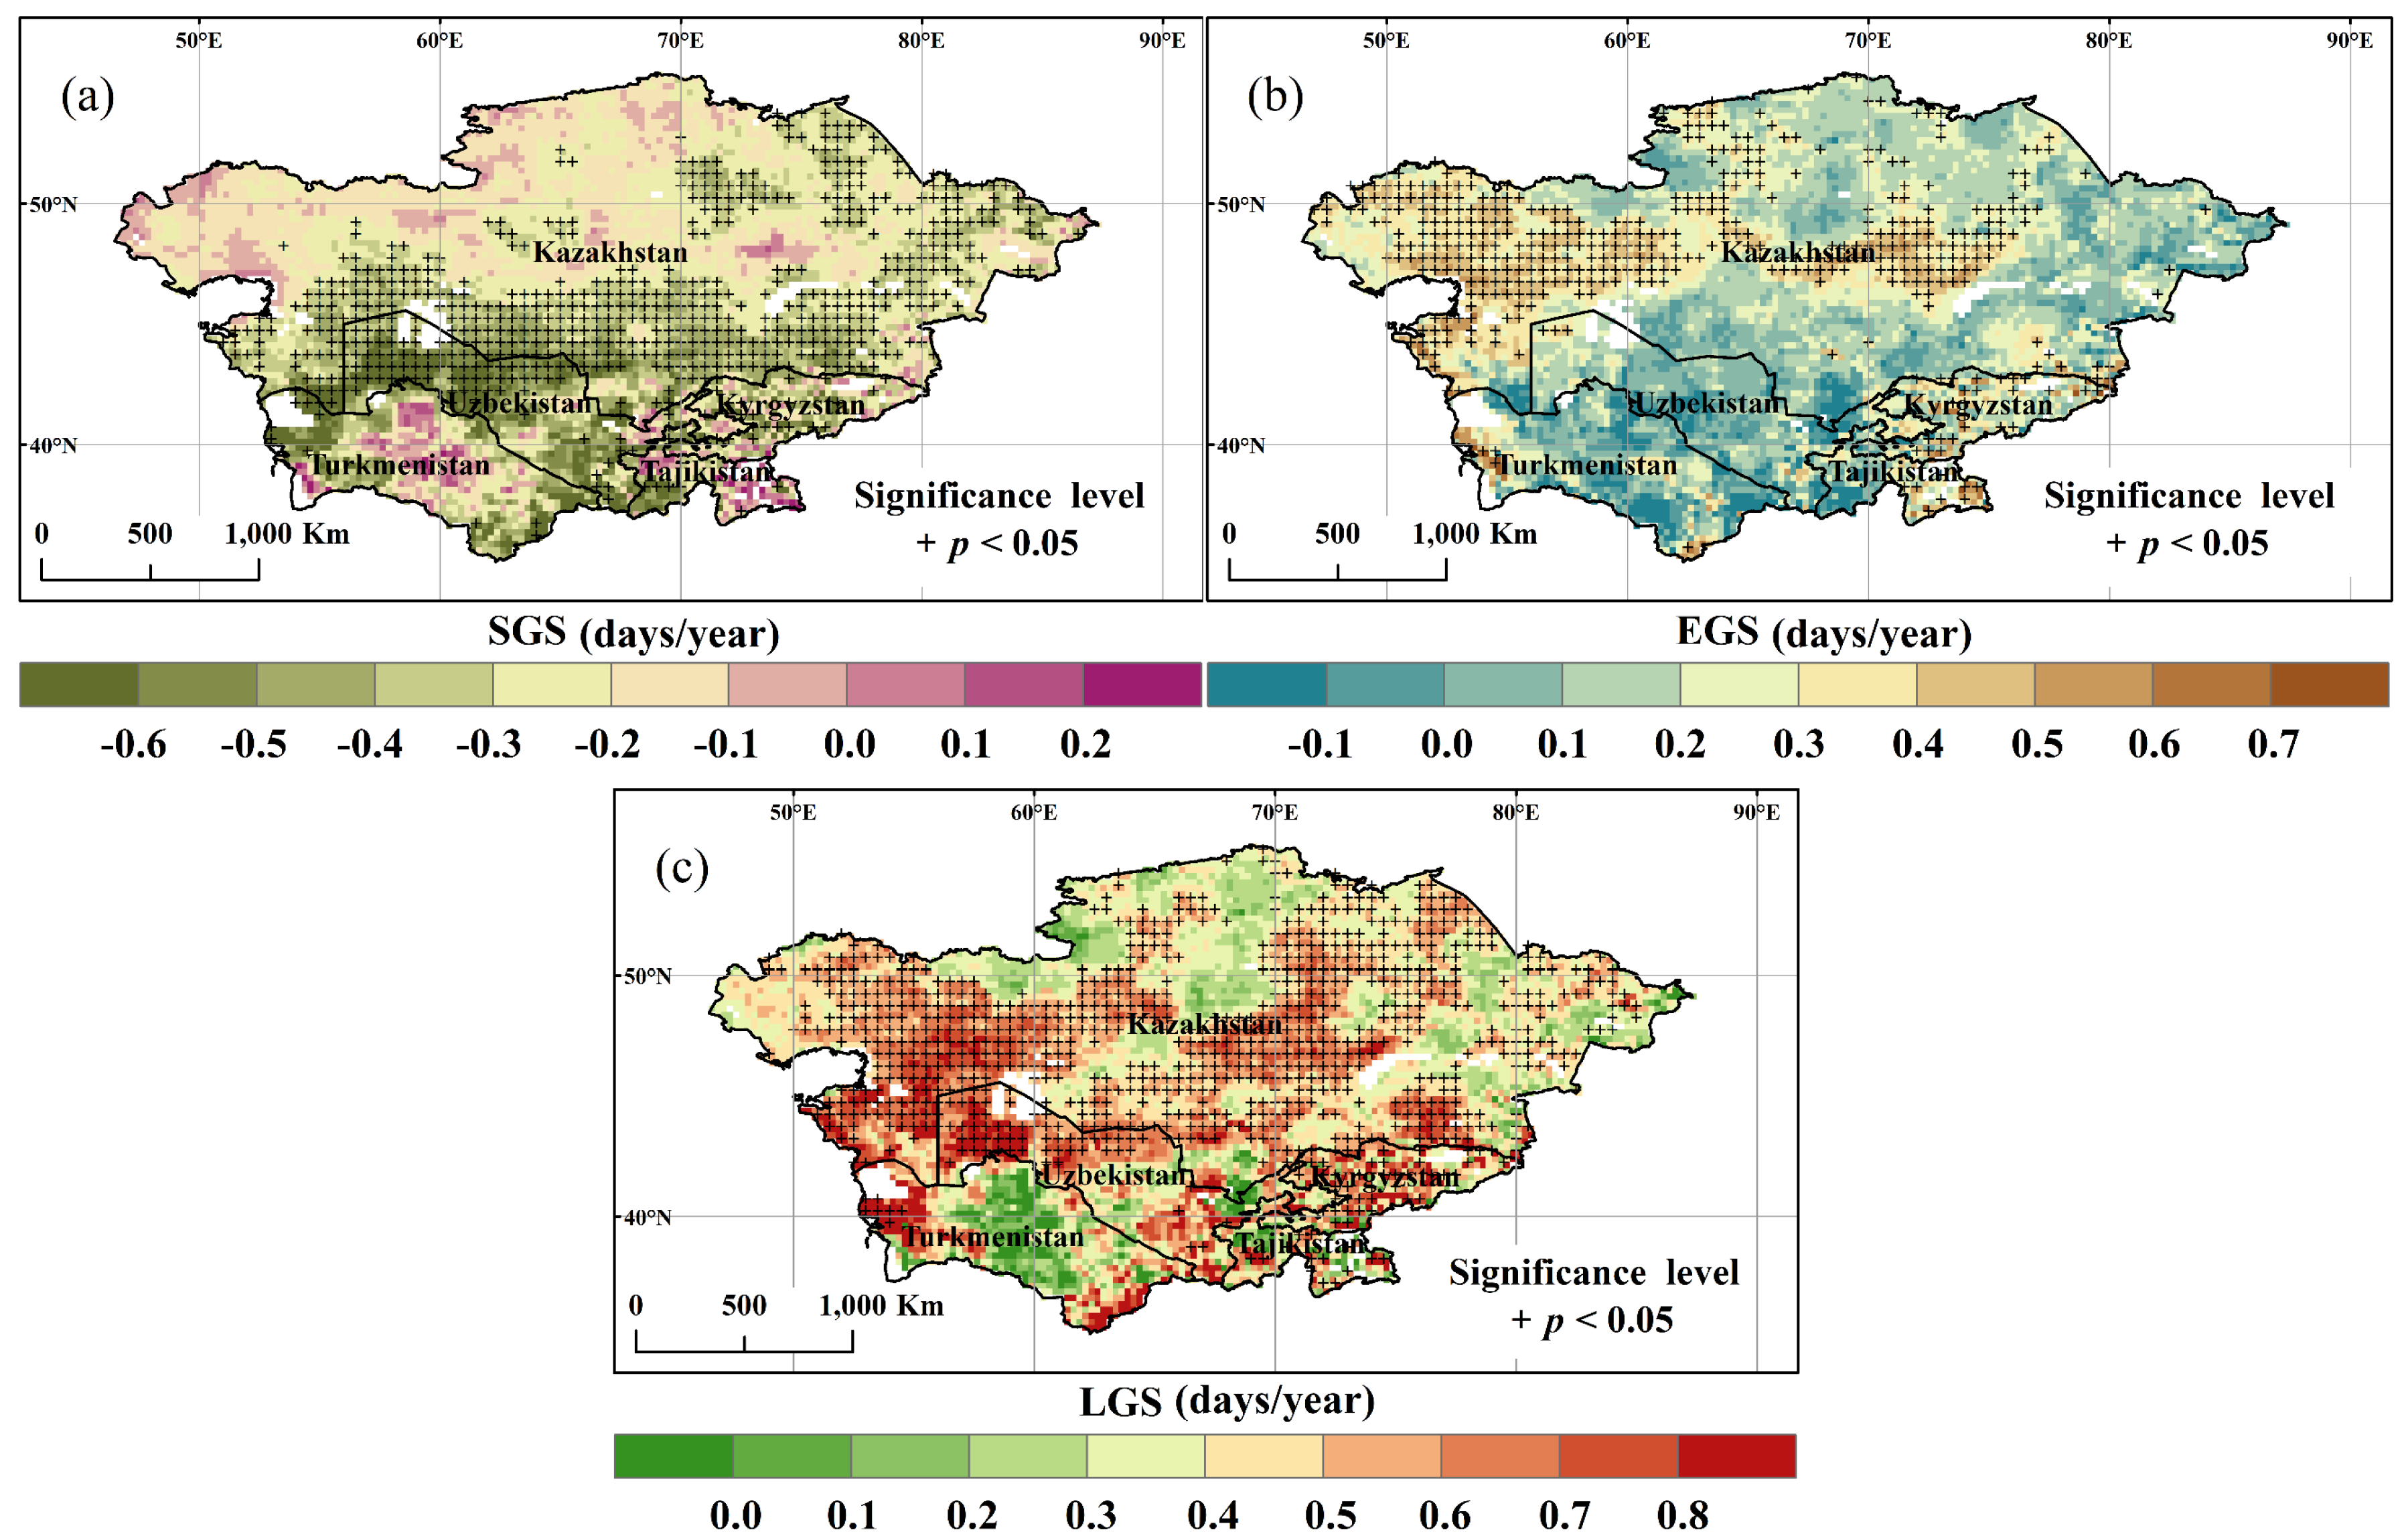
- About 53.6% of the study area showed a negative correlation between annual NDVI and LGS, especially in the north, indicating a negative effect of climate warming on dryland vegetation growth.
Author Contributions
Funding
Data Availability Statement
Conflicts of Interest
References
- IPCC. Summary for Policymakers. In Climate Change 2021: The Physical Science Basis. Contribution of Working Group I to the Sixth Assessment Report of the Intergovernmental Panel on Climate Change; Masson-Delmotte, V., Zhai, P., Pirani, A., Connors, S.L., Péan, C., Berger, S., Caud, N., Chen, Y., Goldfarb, L., Gomis, M.I., et al., Eds.; Cambridge University Press: Cambridge, UK, 2021. [Google Scholar]
- Cheng, W.; Li, Z.; Yan, L. Uniforming spring phenology under non-uniform climate warming across latitude in China. Sci. Total Environ. 2021, 762, 143177. [Google Scholar] [CrossRef] [PubMed]
- Holst, R.; Yu, X.H.; Grun, C. Climate Change, Risk and Grain Yields in China. J. Integr. Agric. 2013, 12, 1279–1291. [Google Scholar] [CrossRef]
- Bolch, T.; Yao, T.; Kang, S.; Buchroithner, M.F.; Scherer, D.; Maussion, F.; Huintjes, E.; Schneider, C. A glacier inventory for the western Nyainqentanglha Range and the Nam Co Basin, Tibet, and glacier changes 1976–2009. Cryosphere 2010, 4, 419–433. [Google Scholar] [CrossRef] [Green Version]
- Zheng, G.H.; Yang, Y.T.; Yang, D.W.; Dafflon, B.; Yi, Y.H.; Zhang, S.L.; Chen, D.L.; Gao, B.; Wang, T.H.; Shi, R.J.; et al. Remote sensing spatiotemporal patterns of frozen soil and the environmental controls over the Tibetan Plateau during 2002–2016. Remote Sens. Environ. 2020, 247, 19. [Google Scholar] [CrossRef]
- Wang, T.H.; Yang, D.W.; Yang, Y.T.; Piao, S.L.; Li, X.; Cheng, G.D.; Fu, B.J. Permafrost thawing puts the frozen carbon at risk over the Tibetan Plateau. Sci. Adv. 2020, 6, 8. [Google Scholar] [CrossRef]
- Wang, X.H.; Piao, S.L.; Ciais, P.; Li, J.S.; Friedlingstein, P.; Koven, C.; Chen, A.P. Spring temperature change and its implication in the change of vegetation growth in North America from 1982 to 2006. Proc. Natl. Acad. Sci. USA 2011, 108, 1240–1245. [Google Scholar] [CrossRef] [Green Version]
- Wei, H.; Zhao, X.; Liang, S.; Zhou, T.; Wu, D.; Tang, B. Effects of Warming Hiatuses on Vegetation Growth in the Northern Hemisphere. Remote Sens. 2018, 10, 683. [Google Scholar] [CrossRef] [Green Version]
- Piao, S.L.; Friedlingstein, P.; Ciais, P.; Viovy, N.; Demarty, J. Growing season extension and its impact on terrestrial carbon cycle in the Northern Hemisphere over the past 2 decades. Glob. Biogeochem. Cycle. 2007, 21, 11. [Google Scholar] [CrossRef]
- Tong, S.Q.; Li, X.Q.; Zhang, J.Q.; Bao, Y.H.; Bao, Y.B.; Na, L.; Si, A.L. Spatial and temporal variability in extreme temperature and precipitation events in Inner Mongolia (China) during 1960–2017. Sci. Total Environ. 2019, 649, 75–89. [Google Scholar] [CrossRef]
- Perkins, S.E.; Alexander, L.V.; Nairn, J.R. Increasing frequency, intensity and duration of observed global heatwaves and warm spells. Geophys. Res. Lett. 2012, 39, 5. [Google Scholar] [CrossRef]
- Liu, Q.; Piao, S.L.; Janssens, I.A.; Fu, Y.S.; Peng, S.S.; Lian, X.; Ciais, P.; Myneni, R.B.; Penuelas, J.; Wang, T. Extension of the growing season increases vegetation exposure to frost. Nat. Commun. 2018, 9, 426. [Google Scholar] [CrossRef] [PubMed] [Green Version]
- Baumbach, L.; Siegmund, J.F.; Mittermeier, M.; Donner, R.V. Impacts of temperature extremes on European vegetation during the growing season. Biogeosciences 2017, 14, 4891–4903. [Google Scholar] [CrossRef] [Green Version]
- Fu, B.; Forsius, M.; Liu, J. Ecosystem services: Climate change and policy impacts Editorial overview. Curr. Opin. Environ. Sustain. 2013, 5, 1–3. [Google Scholar] [CrossRef]
- Ballantyne, A.P.; Alden, C.B.; Miller, J.B.; Tans, P.P.; White, J.W.C. Increase in observed net carbon dioxide uptake by land and oceans during the past 50 years. Nature 2012, 488, 70–72. [Google Scholar] [CrossRef]
- Sitch, S.; Friedlingstein, P.; Gruber, N.; Jones, S.D.; Murray-Tortarolo, G.; Ahlstrom, A.; Doney, S.C.; Graven, H.; Heinze, C.; Huntingford, C.; et al. Recent trends and drivers of regional sources and sinks of carbon dioxide. Biogeosciences 2015, 12, 653–679. [Google Scholar] [CrossRef] [Green Version]
- Yuan, Y.; Bao, A.; Liu, T.; Zheng, G.; Jiang, L.; Guo, H.; Jiang, P.; Yu, T.; De Maeyer, P. Assessing vegetation stability to climate variability in Central Asia. J. Environ. Manag. 2021, 298, 113330. [Google Scholar] [CrossRef]
- Li, H.W.; Li, Y.P.; Huang, G.H.; Sun, J. Quantifying effects of compound dry-hot extremes on vegetation in Xinjiang (China) using a vine-copula conditional probability model. Agric. For. Meteorol. 2021, 311, 108658. [Google Scholar] [CrossRef]
- Jiang, L.L.; Jiapaer, G.; Bao, A.M.; Guo, H.; Ndayisaba, F. Vegetation dynamics and responses to climate change and human activities in Central Asia. Sci. Total Environ. 2017, 599, 967–980. [Google Scholar] [CrossRef]
- Franzke, C.L.E. Local trend disparities of European minimum and maximum temperature extremes. Geophys. Res. Lett. 2015, 42, 6479–6484. [Google Scholar] [CrossRef] [Green Version]
- Zhao, D.S.; Wu, S.H. Spatial and temporal variability of key bio-temperature indicators on the Qinghai-Tibetan Plateau for the period 1961–2013. Int. J. Climatol. 2016, 36, 2083–2092. [Google Scholar] [CrossRef]
- Yang, Y.; Zhao, D.; Chen, H. Variability of bio-climatology indicators in the Southwest China under climate warming during 1961–2015. Int. J. Biometeorol. 2019, 63, 107–119. [Google Scholar] [CrossRef]
- Yin, Y.H.; Deng, H.Y.; Wu, S.H. A new method for generating the thermal growing degree-days and season in China during the last century. Int. J. Climatol. 2017, 37, 1131–1140. [Google Scholar] [CrossRef]
- Dong, M.Y.; Jiang, Y.; Zheng, C.T.; Zhang, D.Y. Trends in the thermal growing season throughout the Tibetan Plateau during 1960–2009. Agric. For. Meteorol. 2012, 166, 201–206. [Google Scholar] [CrossRef]
- Qiu, B.; Lu, Q. A tentative regionalization of agroclimate of China. Acta Geogr. Sin. 1980, 35, 116–125. [Google Scholar]
- Xiao, W.W.; Wang, B.; Liu, D.L.; Feng, P.Y. Projecting Changes in Temperature Extremes in the Han River Basin of China Using Downscaled CMIP5 Multi-Model Ensembles. Atmosphere 2020, 11, 424. [Google Scholar] [CrossRef] [Green Version]
- Xu, L.; Myneni, R.B.; Chapin, F.S.; Callaghan, T.V.; Pinzon, J.E.; Tucker, C.J.; Zhu, Z.; Bi, J.; Ciais, P.; Tommervik, H.; et al. Temperature and vegetation seasonality diminishment over northern lands. Nat. Clim. Chang. 2013, 3, 581–586. [Google Scholar] [CrossRef] [Green Version]
- Piao, S.L.; Wang, X.H.; Ciais, P.; Zhu, B.; Wang, T.; Liu, J. Changes in satellite-derived vegetation growth trend in temperate and boreal Eurasia from 1982 to 2006. Glob. Chang. Biol. 2011, 17, 3228–3239. [Google Scholar] [CrossRef]
- Luo, M.; Sa, C.L.; Meng, F.H.; Duan, Y.C.; Liu, T.; Bao, Y.H. Assessing extreme climatic changes on a monthly scale and their implications for vegetation in Central Asia. J. Clean Prod. 2020, 271, 122396. [Google Scholar] [CrossRef]
- Yao, J.Q.; Chen, Y.N.; Zhao, Y.; Mao, W.Y.; Xu, X.B.; Liu, Y.; Yang, Q. Response of vegetation NDVI to climatic extremes in the arid region of Central Asia: A case study in Xinjiang, China. Theor. Appl. Climatol. 2018, 131, 1503–1515. [Google Scholar] [CrossRef]
- Yao, T.; Chen, F.; Cui, P.; Ma, Y.; Baiqing, X. From Tibetan Plateau to Third Pole and Pan-Third Pole. Bull. Chin. Acad. Sci. 2017, 32, 924–931. [Google Scholar] [CrossRef]
- Li, C.F.; Zhang, C.; Luo, G.P.; Chen, X.; Maisupova, B.; Madaminov, A.A.; Han, Q.F.; Djenbaev, B.M. Carbon stock and its responses to climate change in Central Asia. Glob. Chang. Biol. 2015, 21, 1951–1967. [Google Scholar] [CrossRef] [PubMed]
- Hu, Z.Y.; Zhang, C.; Hu, Q.; Tian, H.Q. Temperature Changes in Central Asia from 1979 to 2011 Based on Multiple Datasets. J. Clim. 2014, 27, 1143–1167. [Google Scholar] [CrossRef]
- Liu, Y.R.; Li, Y.P.; Yang, X.; Huang, G.H.; Li, Y.F. Development of an integrated multivariate trend-frequency analysis method: Spatial-temporal characteristics of climate extremes under global warming for Central Asia. Environ. Res. 2021, 195, 14. [Google Scholar] [CrossRef]
- Zhang, M.; Chen, Y.N.; Shen, Y.J.; Li, B.F. Tracking climate change in Central Asia through temperature and precipitation extremes. J. Geogr. Sci. 2019, 29, 3–28. [Google Scholar] [CrossRef] [Green Version]
- Lioubimtseva, E.; Henebry, G.M. Climate and environmental change in arid Central Asia: Impacts, vulnerability, and adaptations. J. Arid. Environ. 2009, 73, 963–977. [Google Scholar] [CrossRef]
- Wu, L.Z.; Ma, X.F.; Dou, X.; Zhu, J.T.; Zhao, C.Y. Impacts of climate change on vegetation phenology and net primary productivity in arid Central Asia. Sci. Total Environ. 2021, 796, 15. [Google Scholar] [CrossRef]
- Zhou, Y.; Zhang, L.; Fensholt, R.; Wang, K.; Vitkovskaya, I.; Tian, F. Climate Contributions to Vegetation Variations in Central Asian Drylands: Pre- and Post-USSR Collapse. Remote Sens. 2015, 7, 2449–2470. [Google Scholar] [CrossRef] [Green Version]
- Bohovic, R.; Dobrovolny, P.; Klein, D. The Spatial and Temporal Dynamics of Remotely-sensed Vegetation Phenology in Central Asia in the 1982–2011 Period. Eur. J. Remote Sens. 2016, 49, 279–299. [Google Scholar] [CrossRef] [Green Version]
- Zhang, G.L.; Biradar, C.M.; Xiao, X.M.; Dong, J.W.; Zhou, Y.T.; Qin, Y.W.; Zhang, Y.; Liu, F.; Ding, M.J.; Thomas, R.J. Exacerbated grassland degradation and desertification in Central Asia during 2000–2014. Ecol. Appl. 2018, 28, 442–456. [Google Scholar] [CrossRef] [Green Version]
- Trenberth, K.E.; Dai, A.; Rasmussen, R.M.; Parsons, D.B. The changing character of precipitation. Bull. Am. Meteorol. Soc. 2003, 84, 1205–1217. [Google Scholar] [CrossRef]
- Shi, Y.D.; Wang, S.J.; Wang, L.W.; Zhang, M.J.; Argiriou, A.A.; Song, Y.; Lei, S.J. Isotopic evidence in modern precipitation for the westerly meridional movement in Central Asia. Atmos. Res. 2021, 259, 10. [Google Scholar] [CrossRef]
- Bothe, O.; Fraedrich, K.; Zhu, X. Precipitation climate of Central Asia and the large-scale atmospheric circulation. Theor. Appl. Climatol. 2012, 108, 345–354. [Google Scholar] [CrossRef]
- Xu, D.; Li, R.; Wang, C. Characteristics of Precipitation Changes and Relationships with Water Vapor Transport in Typical Arid Regions of Asia and Africa under Global Warming. Clim. Environ. Res. 2016, 21, 737–748. [Google Scholar] [CrossRef]
- Chen, X.; Wang, S.S.; Hu, Z.Y.; Zhou, Q.M.; Hu, Q. Spatiotemporal characteristics of seasonal precipitation and their relationships with ENSO in Central Asia during 1901–2013. J. Geogr. Sci. 2018, 28, 1341–1368. [Google Scholar] [CrossRef] [Green Version]
- Peel, M.C.; Finlayson, B.L.; McMahon, T.A. Updated world map of the Köppen-Geiger climate classification. Hydrol. Earth Syst. Sci. 2007, 11, 1633–1644. [Google Scholar] [CrossRef] [Green Version]
- Goward, S.N. Satellite Bioclimatology. J. Clim. 1989, 2, 710–720. [Google Scholar] [CrossRef]
- Li, Z.; Chen, Y.N.; Li, W.H.; Deng, H.J.; Fang, G.H. Potential impacts of climate change on vegetation dynamics in Central Asia. J. Geophys. Res. Atmos. 2015, 120, 12345–12356. [Google Scholar] [CrossRef]
- Wang, H.L.; Tetzlaff, D.; Buttle, J.; Carey, S.K.; Laudon, H.; McNamara, J.P.; Spence, C.; Soulsby, C. Climate-phenology-hydrology interactions in northern high latitudes: Assessing the value of remote sensing data in catchment ecohydrological studies. Sci. Total Environ. 2019, 656, 19–28. [Google Scholar] [CrossRef] [Green Version]
- Zhong, L.; Su, Z.B.; Ma, Y.M.; Salama, M.S.; Sobrino, J.A. Accelerated Changes of Environmental Conditions on the Tibetan Plateau Caused by Climate Change. J. Clim. 2011, 24, 6540–6550. [Google Scholar] [CrossRef]
- Ji, L.; Senay, G.B.; Verdin, J.P. Evaluation of the Global Land Data Assimilation System (GLDAS) Air Temperature Data Products. J. Hydrometeorol. 2015, 16, 2463–2480. [Google Scholar] [CrossRef]
- Larcher, W.; Biederman-Thorson, M.A. Physiological Plant Ecology; Springer: Berlin/Heidelberg, Germany, 1980. [Google Scholar]
- Prentice, I.C.; Cramer, W.; Harrison, S.P.; Leemans, R.; Monserud, R.A.; Solomon, A.M. A global biome model based on plant physiology and dominance, soil properties and climate. J. Biogeogr. 1992, 19, 117–134. [Google Scholar] [CrossRef]
- Ruml, M.; Gregoric, E.; Vujadinovic, M.; Radovanovic, S.; Matovic, G.; Vukovic, A.; Pacuca, V.; Stojfcic, D. Observed changes of temperature extremes in Serbia over the period 1961–2010. Atmos. Res. 2017, 183, 26–41. [Google Scholar] [CrossRef]
- Huang, B.W. Draft of the comprehensive physical geographical regionalization of China. Acta Geogr. Sin. 1958, 348–365. [Google Scholar] [CrossRef]
- Sillmann, J.; Kharin, V.V.; Zhang, X.; Zwiers, F.W.; Bronaugh, D. Climate extremes indices in the CMIP5 multimodel ensemble: Part 1. Model evaluation in the present climate. J. Geophys. Res. Atmos. 2013, 118, 1716–1733. [Google Scholar] [CrossRef]
- Yin, Y.H.; Deng, H.Y.; Wu, S.H. Spatial-temporal variations in the thermal growing degree-days and season under climate warming in China during 1960–2011. Int. J. Biometeorol. 2019, 63, 649–658. [Google Scholar] [CrossRef]
- Cornes, R.C.; van der Schrier, G.; Squintu, A.A. A reappraisal of the thermal growing season length across Europe. Int. J. Climatol. 2019, 39, 1787–1795. [Google Scholar] [CrossRef] [Green Version]
- Liu, H.J.; Chen, Y.N.; Ye, Z.X.; Li, Y.P.; Zhang, Q.F. Recent Lake Area Changes in Central Asia. Sci Rep. 2019, 9, 11. [Google Scholar] [CrossRef] [Green Version]
- Yu, Y.; Chen, X.; Malik, I.; Wistuba, M.; Cao, Y.G.; Hou, D.D.; Ta, Z.J.; He, J.; Zhang, L.Y.; Yu, R.D.; et al. Spatiotemporal changes in water, land use, and ecosystem services in Central Asia considering climate changes and human activities. J. Arid Land. 2021, 13, 881–890. [Google Scholar] [CrossRef]
- Wang, Q.X.; Fan, X.H.; Wang, M.B. Recent warming amplification over high elevation regions across the globe. Clim. Dyn. 2014, 43, 87–101. [Google Scholar] [CrossRef] [Green Version]
- Wang, Z.Q.; Cui, G.L.; Liu, X.; Zheng, K.; Lu, Z.Y.; Li, H.L.; Wang, G.N.; An, Z.F. Greening of the Qinghai-Tibet Plateau and Its Response to Climate Variations along Elevation Gradients. Remote Sens. 2021, 13, 3712. [Google Scholar] [CrossRef]
- Anderegg, W.R.L.; Kane, J.M.; Anderegg, L.D.L. Consequences of widespread tree Mortality triggered by drought and temperature stress. Nat. Clim. Chang. 2013, 3, 30–36. [Google Scholar] [CrossRef]
- Zhang, W.; Li, Y.; Wu, X.; Chen, Y.; Chen, A.; Schwalm, C.R.; Kimball, J.S. Divergent Response of Vegetation Growth to Soil Water Availability in Dry and Wet Periods Over Central Asia. J. Geophys. Res. Biogeosci. 2021, 126, e2020JG005912. [Google Scholar] [CrossRef]
- Feng, R.; Yu, R.D.; Zheng, H.W.; Gan, M. Spatial and temporal variations in extreme temperature in Central Asia. Int. J. Climatol. 2018, 38, E388–E400. [Google Scholar] [CrossRef]
- Toelle, M.H.; Churiulin, E. Sensitivity of Convection-Permitting Regional Climate Simulations to Changes in Land Cover Input Data: Role of Land Surface Characteristics for Temperature and Climate Extremes. Front. Earth Sci. 2021, 9, 722244. [Google Scholar] [CrossRef]
- Yuan, X.; Wang, W.; Cui, J.; Meng, F.; Kurban, A.; Maeyer, P.D. Vegetation changes and land surface feedbacks drive shifts in local temperatures over Central Asia. Sci. Rep. 2017, 7, 3287. [Google Scholar] [CrossRef] [Green Version]
- Barbero, R.; Westra, S.; Lenderink, G.; Fowler, H.J. Temperature-extreme precipitation scaling: A two-way causality? Int. J. Climatol. 2018, 38, E1274–E1279. [Google Scholar] [CrossRef] [Green Version]
- Li, S.; Wei, F.L.; Wang, Z.; Shen, J.S.; Liang, Z.; Wang, H.; Li, S.C. Spatial Heterogeneity and Complexity of the Impact of Extreme Climate on Vegetation in China. Sustainability 2021, 13, 5748. [Google Scholar] [CrossRef]
- Zhao, D.; Gao, X.; Yang, Y. Trends of freezing period and its main cause on the Qinghai-Tibetan Plateau from 1961 to 2018. Theor. Appl. Climatol. 2021, 146, 1355–1366. [Google Scholar] [CrossRef]
- Zhang, C.; Lu, D.S.; Chen, X.; Zhang, Y.M.; Maisupova, B.; Tao, Y. The spatiotemporal patterns of vegetation coverage and biomass of the temperate deserts in Central Asia and their relationships with climate controls. Remote Sens. Environ. 2016, 175, 271–281. [Google Scholar] [CrossRef]
- Wu, X.C.; Guo, W.C.; Liu, H.Y.; Li, X.Y.; Peng, C.H.; Allen, C.D.; Zhang, C.C.; Wang, P.; Pei, T.; Ma, Y.J.; et al. Exposures to temperature beyond threshold disproportionately reduce vegetation growth in the northern hemisphere. Natl. Sci. Rev. 2019, 6, 786–795. [Google Scholar] [CrossRef]
- von Buttlar, J.; Zscheischler, J.; Rammig, A.; Sippel, S.; Reichstein, M.; Knohl, A.; Jung, M.; Menzer, O.; Arain, M.A.; Buchmann, N.; et al. Impacts of droughts and extreme-temperature events on gross primary production and ecosystem respiration: A systematic assessment across ecosystems and climate zones. Biogeosciences 2018, 15, 1293–1318. [Google Scholar] [CrossRef] [Green Version]
- Salvucci, M.E.; Crafts-Brandner, S.J. Inhibition of photosynthesis by heat stress: The activation state of Rubisco as a limiting factor in photosynthesis. Physiol. Plant. 2004, 120, 179–186. [Google Scholar] [CrossRef] [PubMed]
- Richardson, A.D.; Anderson, R.S.; Arain, M.A.; Barr, A.G.; Bohrer, G.; Chen, G.S.; Chen, J.M.; Ciais, P.; Davis, K.J.; Desai, A.R.; et al. Terrestrial biosphere models need better representation of vegetation phenology: Results from the North American Carbon Program Site Synthesis. Glob. Chang. Biol. 2012, 18, 566–584. [Google Scholar] [CrossRef] [Green Version]
- Sun, Q.L.; Li, B.L.; Zhou, G.Y.; Jiang, Y.H.; Yuan, Y.C. Delayed autumn leaf senescence date prolongs the growing season length of herbaceous plants on the Qinghai-Tibetan Plateau. Agric. For. Meteorol. 2020, 284, 11. [Google Scholar] [CrossRef]
- Li, C.; Wang, R.; Cui, X.; Wu, F.; Yan, Y.; Peng, Q.; Qian, Z.; Xu, Y. Responses of vegetation spring phenology to climatic factors in Xinjiang, China. Ecol. Indic. 2021, 124, 107286. [Google Scholar] [CrossRef]
- Sun, C.; Kucharski, F.; Li, J.P.; Wang, K.C.; Kang, I.S.; Lian, T.; Liu, T.; Ding, R.Q.; Xie, F. Spring Aleutian Low Weakening and Surface Cooling Trend in Northwest North America During Recent Decades. J. Geophys. Res. Atmos. 2019, 124, 12078–12092. [Google Scholar] [CrossRef]
- Richardson, A.D.; Black, T.A.; Ciais, P.; Delbart, N.; Friedl, M.A.; Gobron, N.; Hollinger, D.Y.; Kutsch, W.L.; Longdoz, B.; Luyssaert, S.; et al. Influence of spring and autumn phenological transitions on forest ecosystem productivity. Philos. Trans. R. Soc. B Biol. Sci. 2010, 365, 3227–3246. [Google Scholar] [CrossRef] [Green Version]
- Ma, X.L.; Huete, A.; Moran, S.; Ponce-Campos, G.; Eamus, D. Abrupt shifts in phenology and vegetation productivity under climate extremes. J. Geophys. Res. Biogeosci. 2015, 120, 2036–2052. [Google Scholar] [CrossRef]
- Sherry, R.A.; Zhou, X.H.; Gu, S.L.; Arnone, J.A.; Schimel, D.S.; Verburg, P.S.; Wallace, L.L.; Luo, Y.Q. Divergence of reproductive phenology under climate warming. Proc. Natl. Acad. Sci. USA 2007, 104, 198–202. [Google Scholar] [CrossRef] [Green Version]


| Label | Index Name | Unit |
|---|---|---|
| DT0 | Number of days with Tmean > 0 °C | Days |
| DT5 | Number of days with Tmean > 5 °C | Days |
| DT10 | Number of days with Tmean > 10 °C | Days |
| DT20 | Number of days with Tmean > 20 °C | Days |
| SGS | Start of growing season | Julian days |
| EGS | End of growing season | Julian days |
| LGS | Length of growing season | Days |
Publisher’s Note: MDPI stays neutral with regard to jurisdictional claims in published maps and institutional affiliations. |
© 2022 by the authors. Licensee MDPI, Basel, Switzerland. This article is an open access article distributed under the terms and conditions of the Creative Commons Attribution (CC BY) license (https://creativecommons.org/licenses/by/4.0/).
Share and Cite
Gao, X.; Zhao, D. Spatial and Temporal Variability of Key Bio-Temperature Indicators and Their Effects on Vegetation Dynamics in the Great Lakes Region of Central Asia. Remote Sens. 2022, 14, 2948. https://doi.org/10.3390/rs14122948
Gao X, Zhao D. Spatial and Temporal Variability of Key Bio-Temperature Indicators and Their Effects on Vegetation Dynamics in the Great Lakes Region of Central Asia. Remote Sensing. 2022; 14(12):2948. https://doi.org/10.3390/rs14122948
Chicago/Turabian StyleGao, Xuan, and Dongsheng Zhao. 2022. "Spatial and Temporal Variability of Key Bio-Temperature Indicators and Their Effects on Vegetation Dynamics in the Great Lakes Region of Central Asia" Remote Sensing 14, no. 12: 2948. https://doi.org/10.3390/rs14122948