
A Dual-Generator Translation Network Fusing Texture and Structure Features for SAR and Optical Image Matching


Abstract
:
1. Introduction
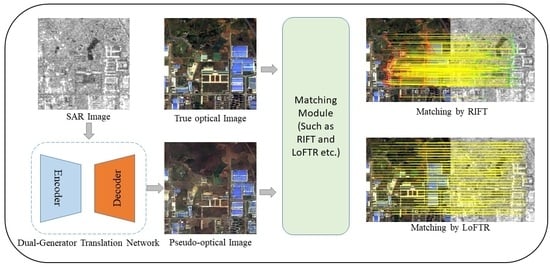
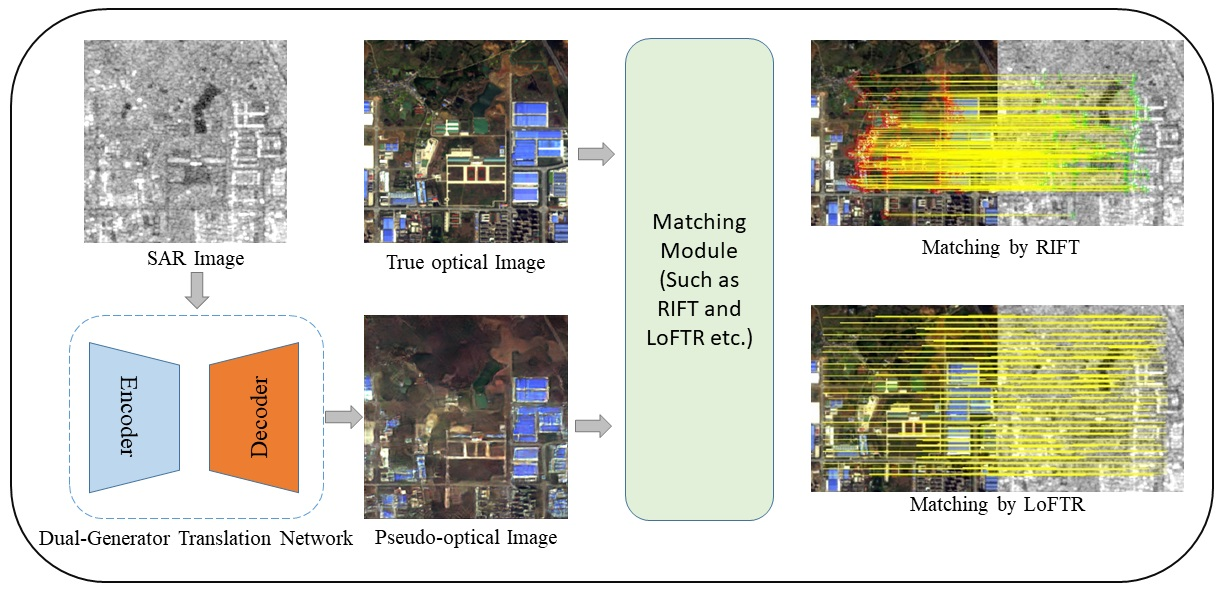
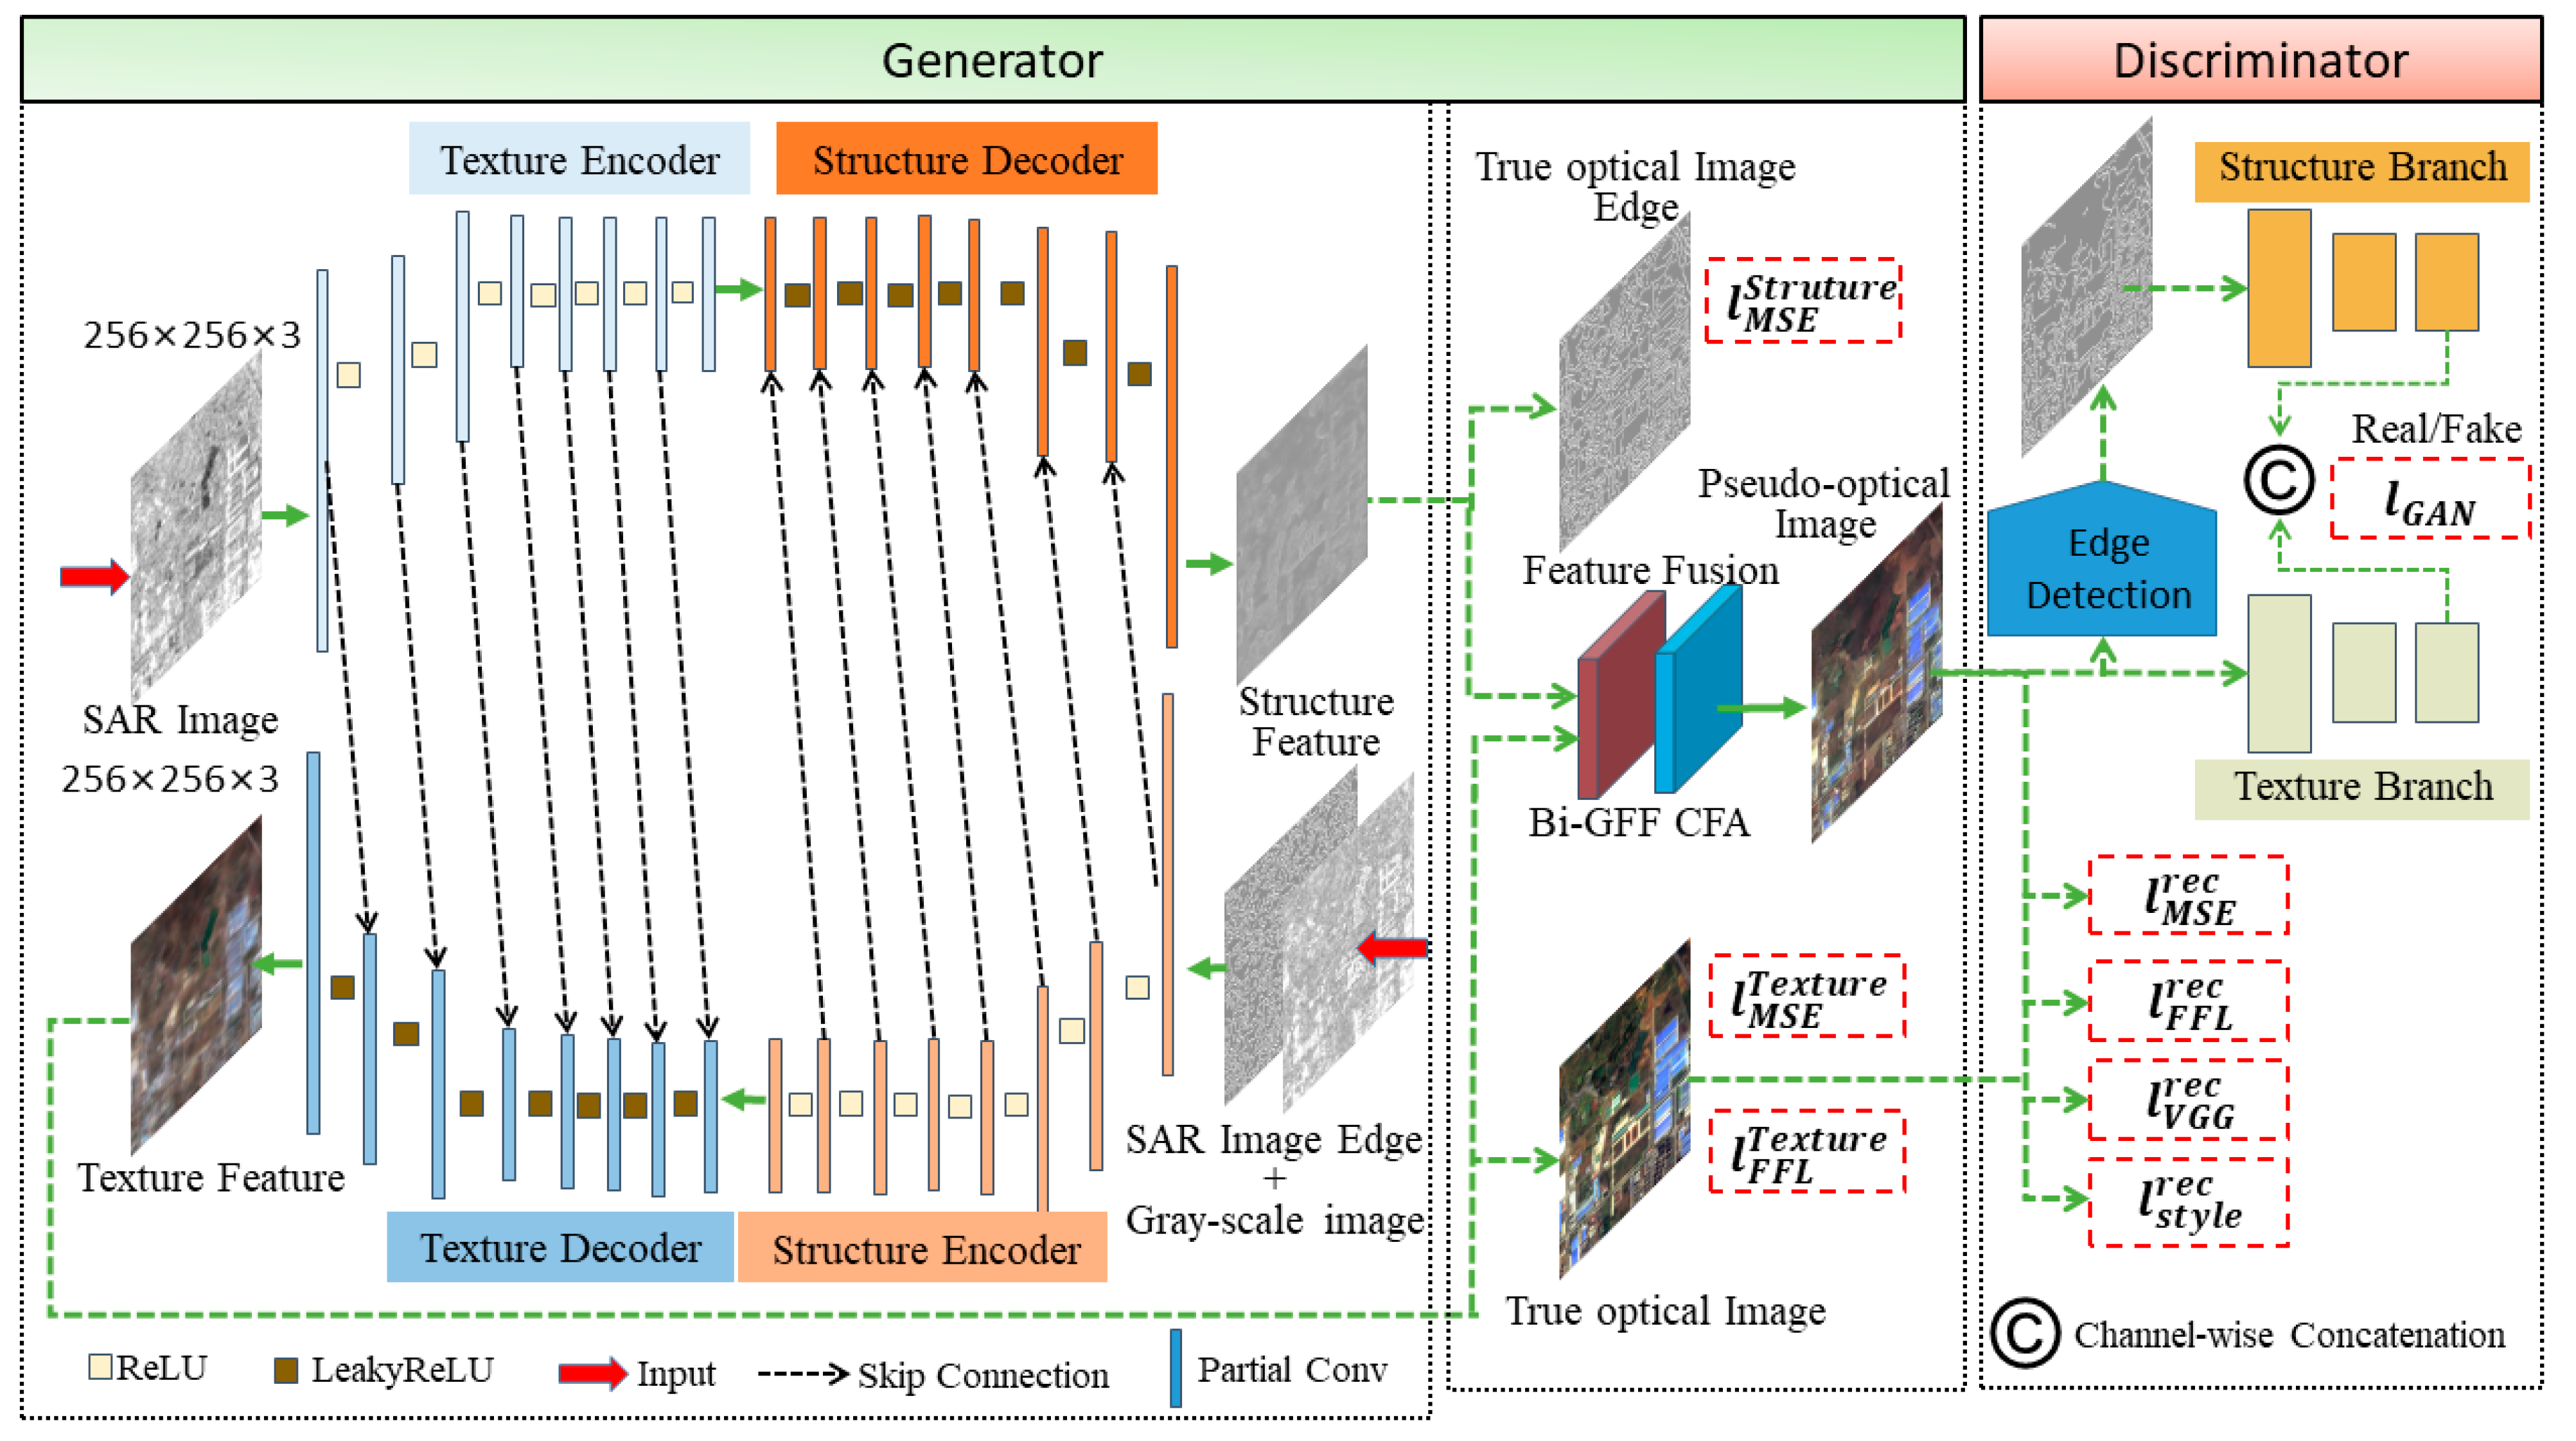
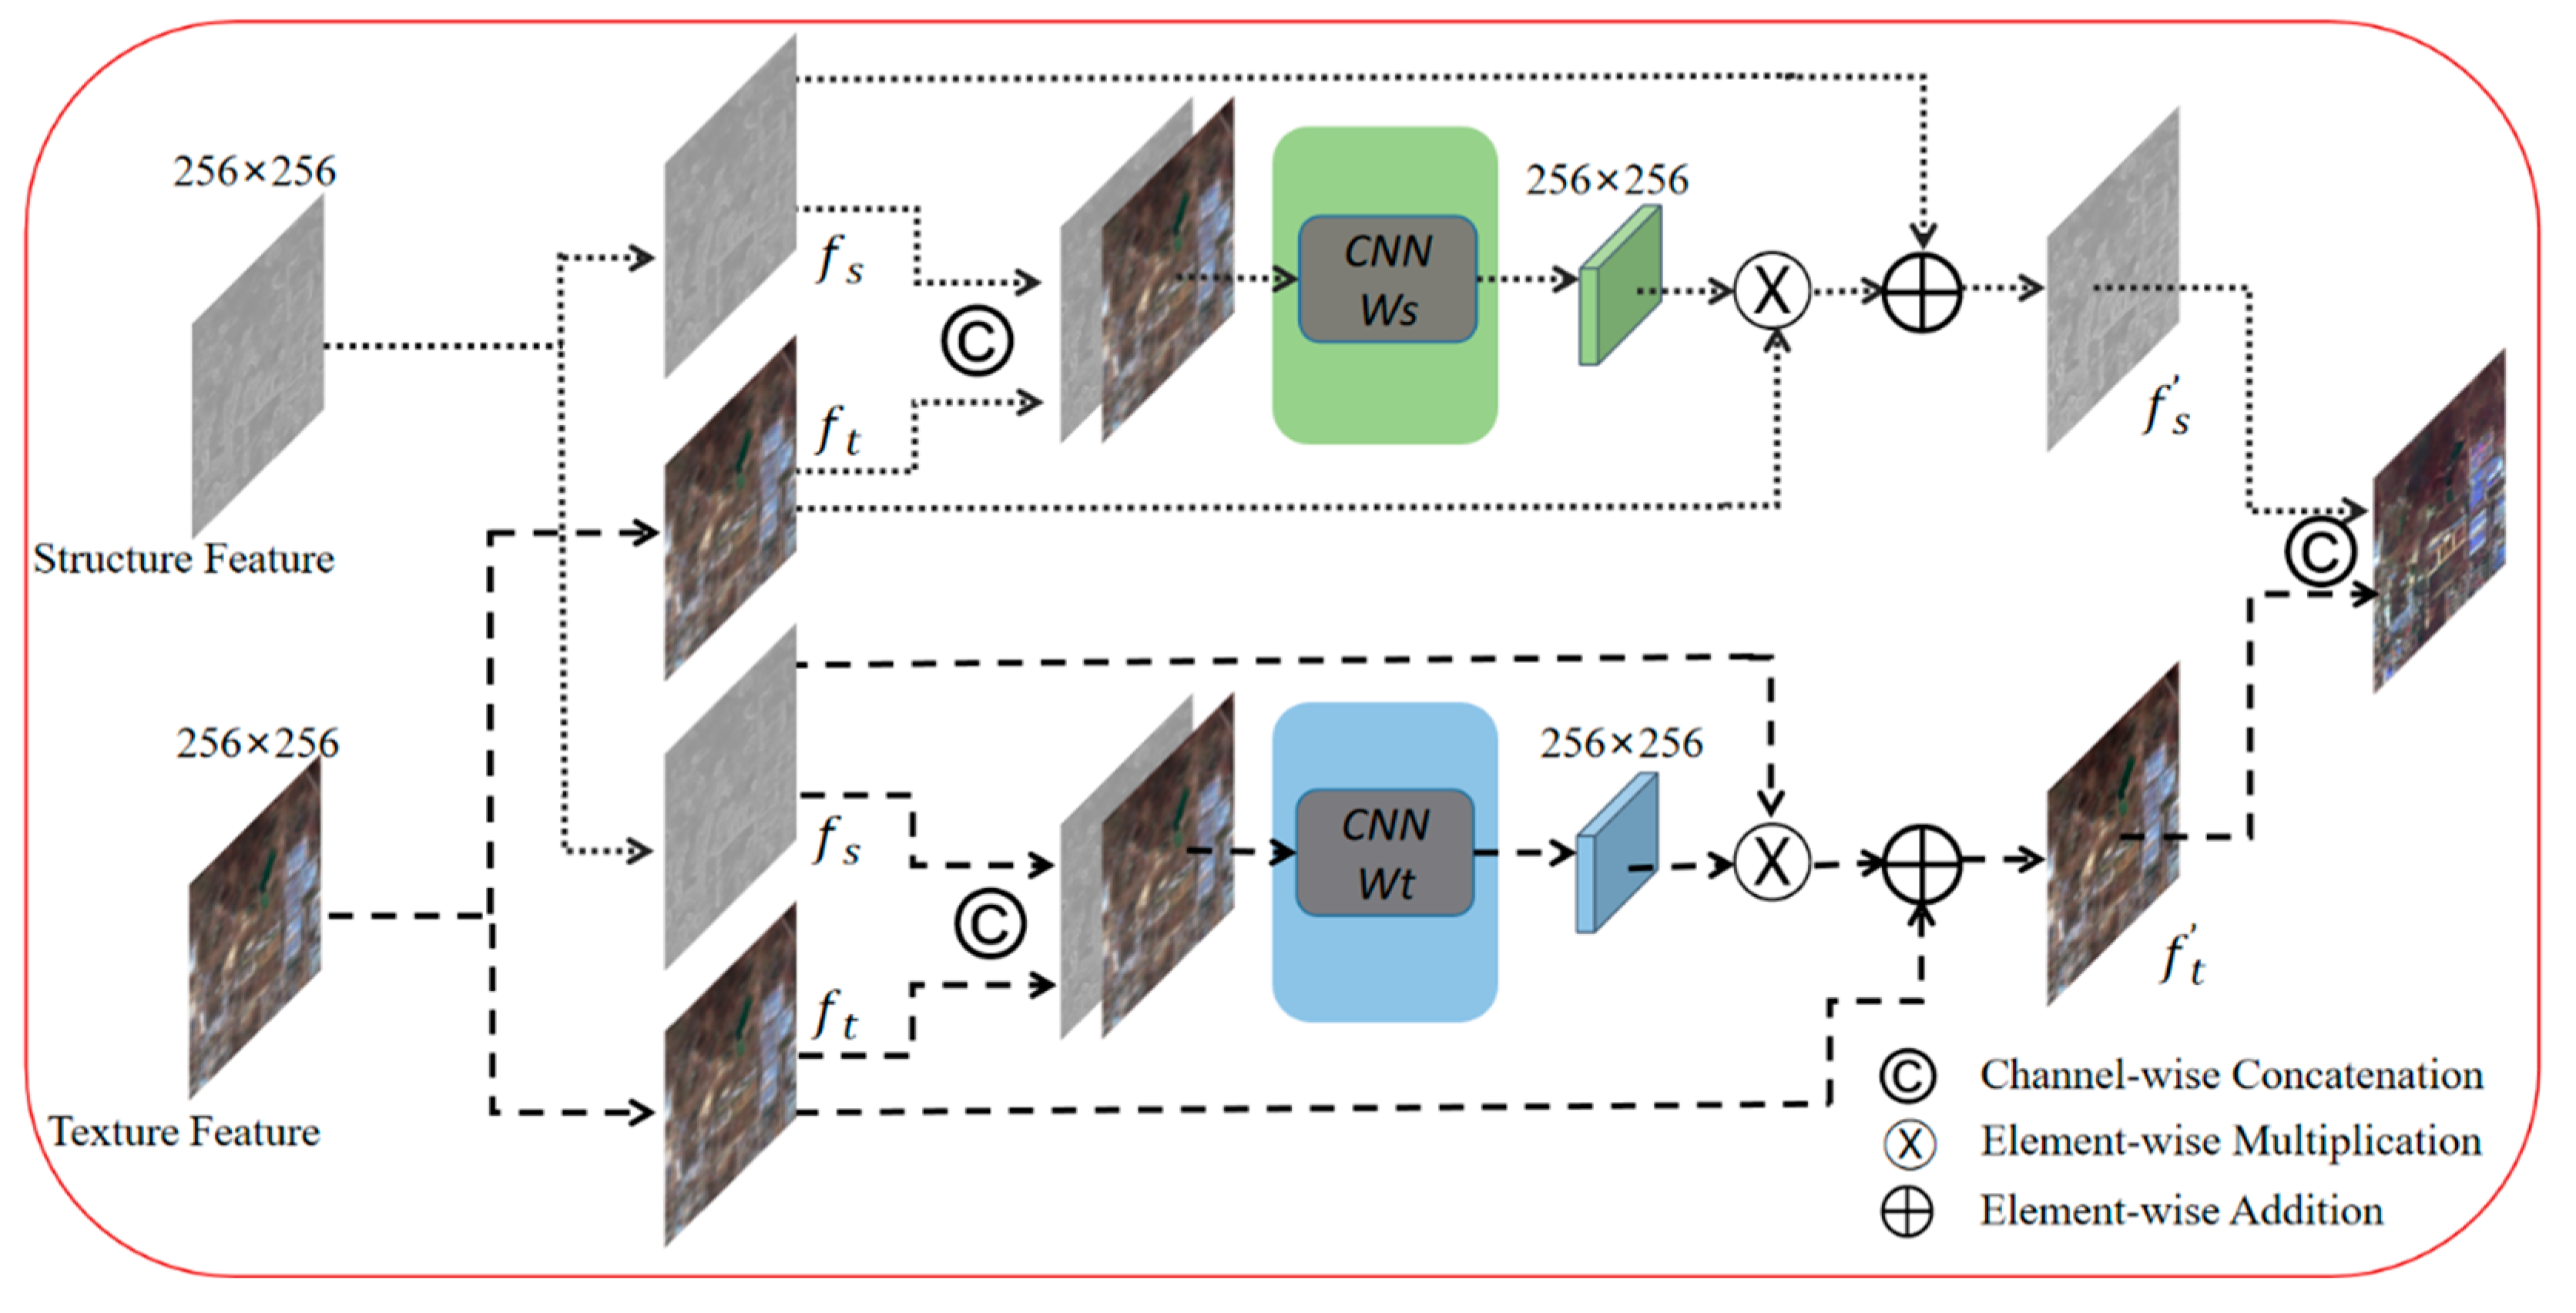
- We propose a dual-generator translation network that fuses texture and structure features to improve the matching of SAR images with optical images. The proposed network includes both structure and texture generators, and the structure and texture features are coupled with each other by these dual generators to obtain high-quality pseudo-optical images.
- We introduce spatial-domain and frequency-domain loss functions to reduce the gap between pseudo-optical images and real optical images, and present ablation experiments to prove the superiority of our approach.
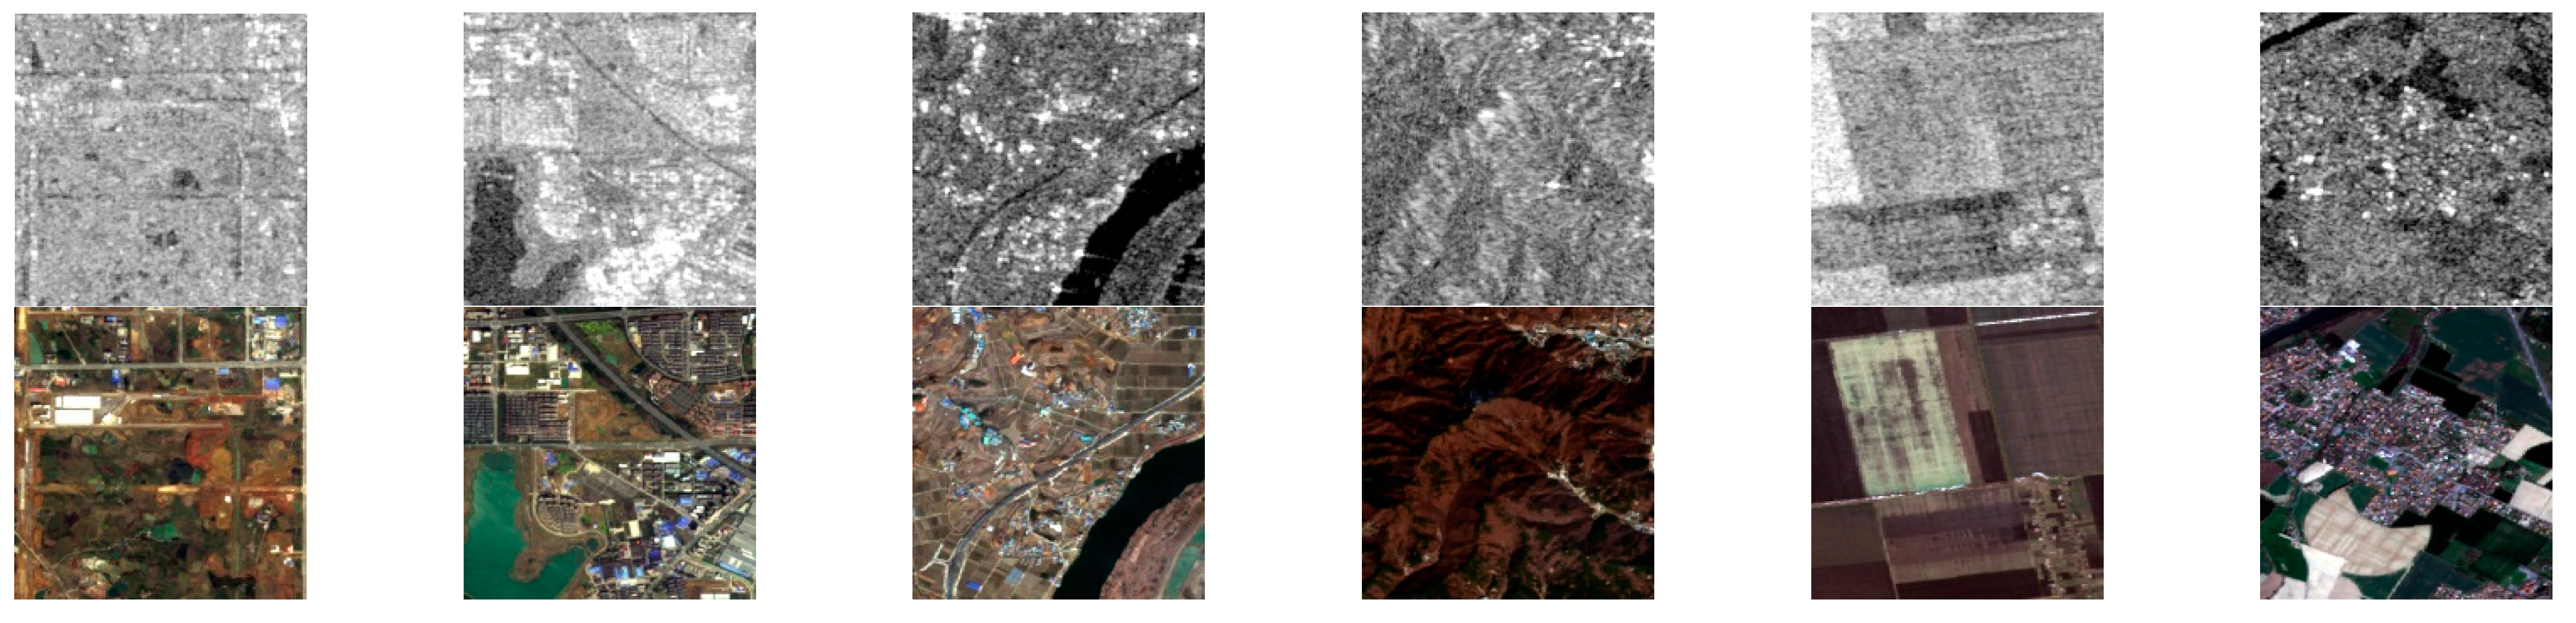
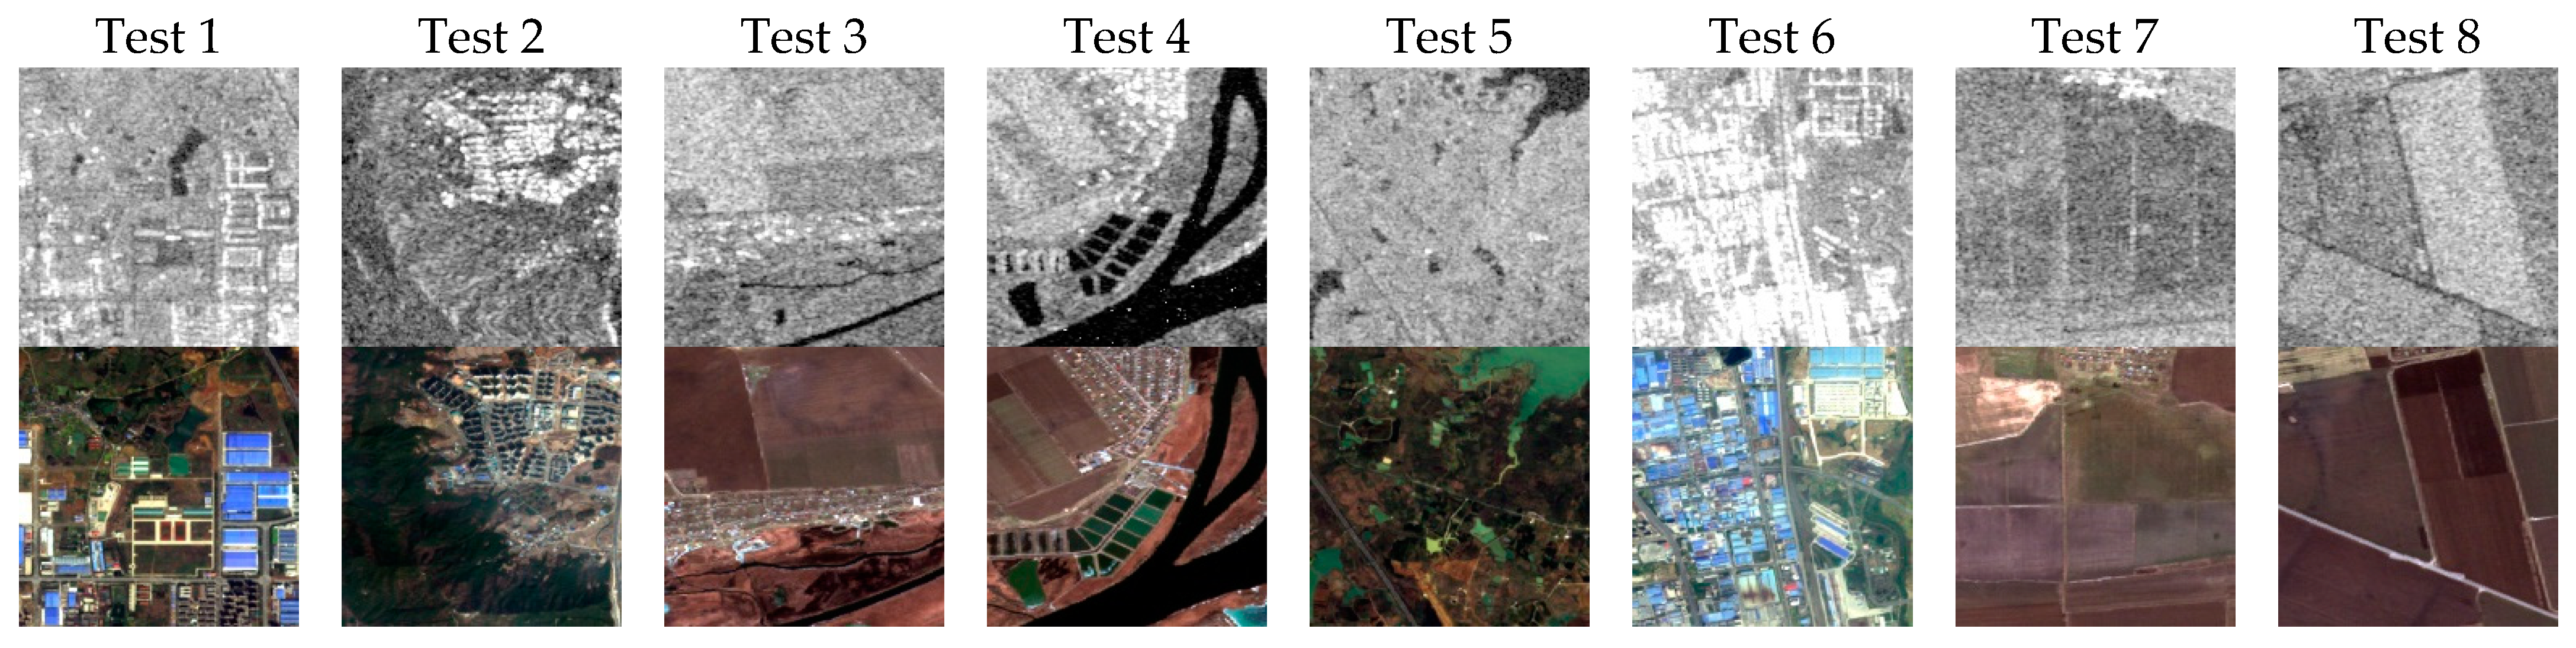
- To demonstrate the superiority of the proposed algorithm, we select training and test data from public datasets, and we present keypoint detection and matching experiments for comparisons between pseudo-optical images and real optical images and between real optical images and SAR images before and after translation.
2. Methods
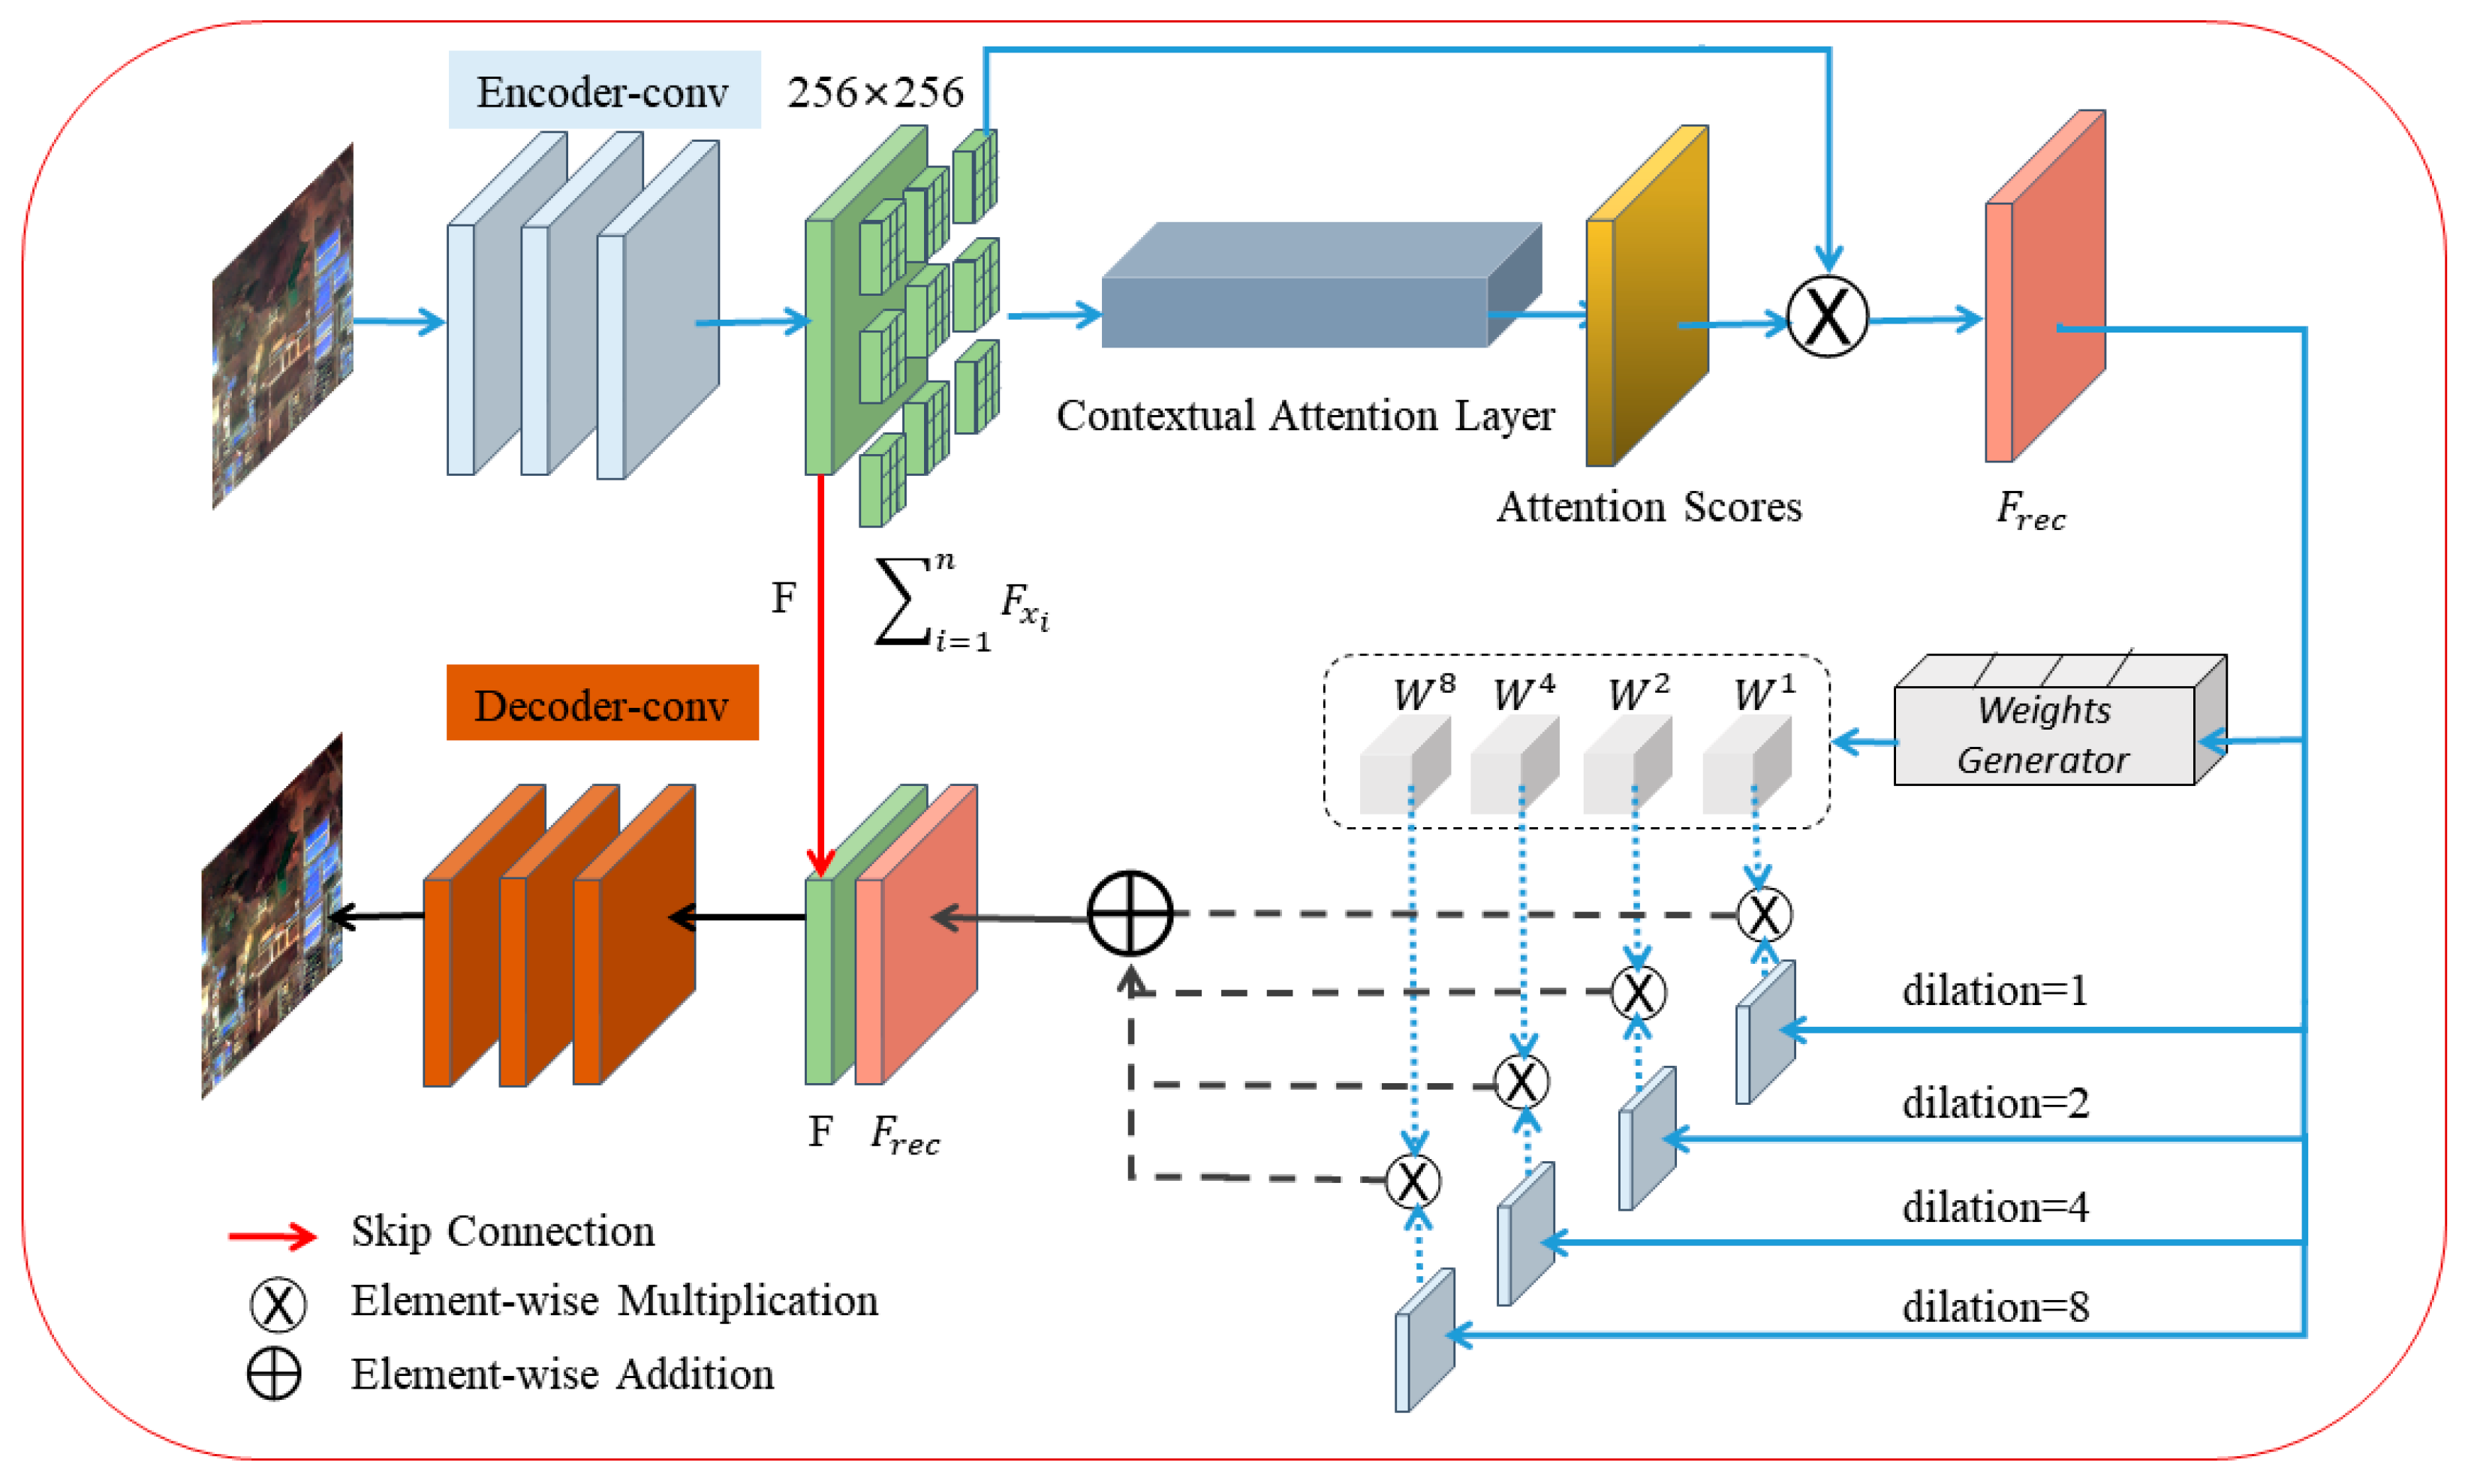
2.1. Generators
2.2. Discriminator
2.3. Loss Functions
3. Experiments
3.1. Implementation Details
3.1.1. Datasets
3.1.2. Training Details
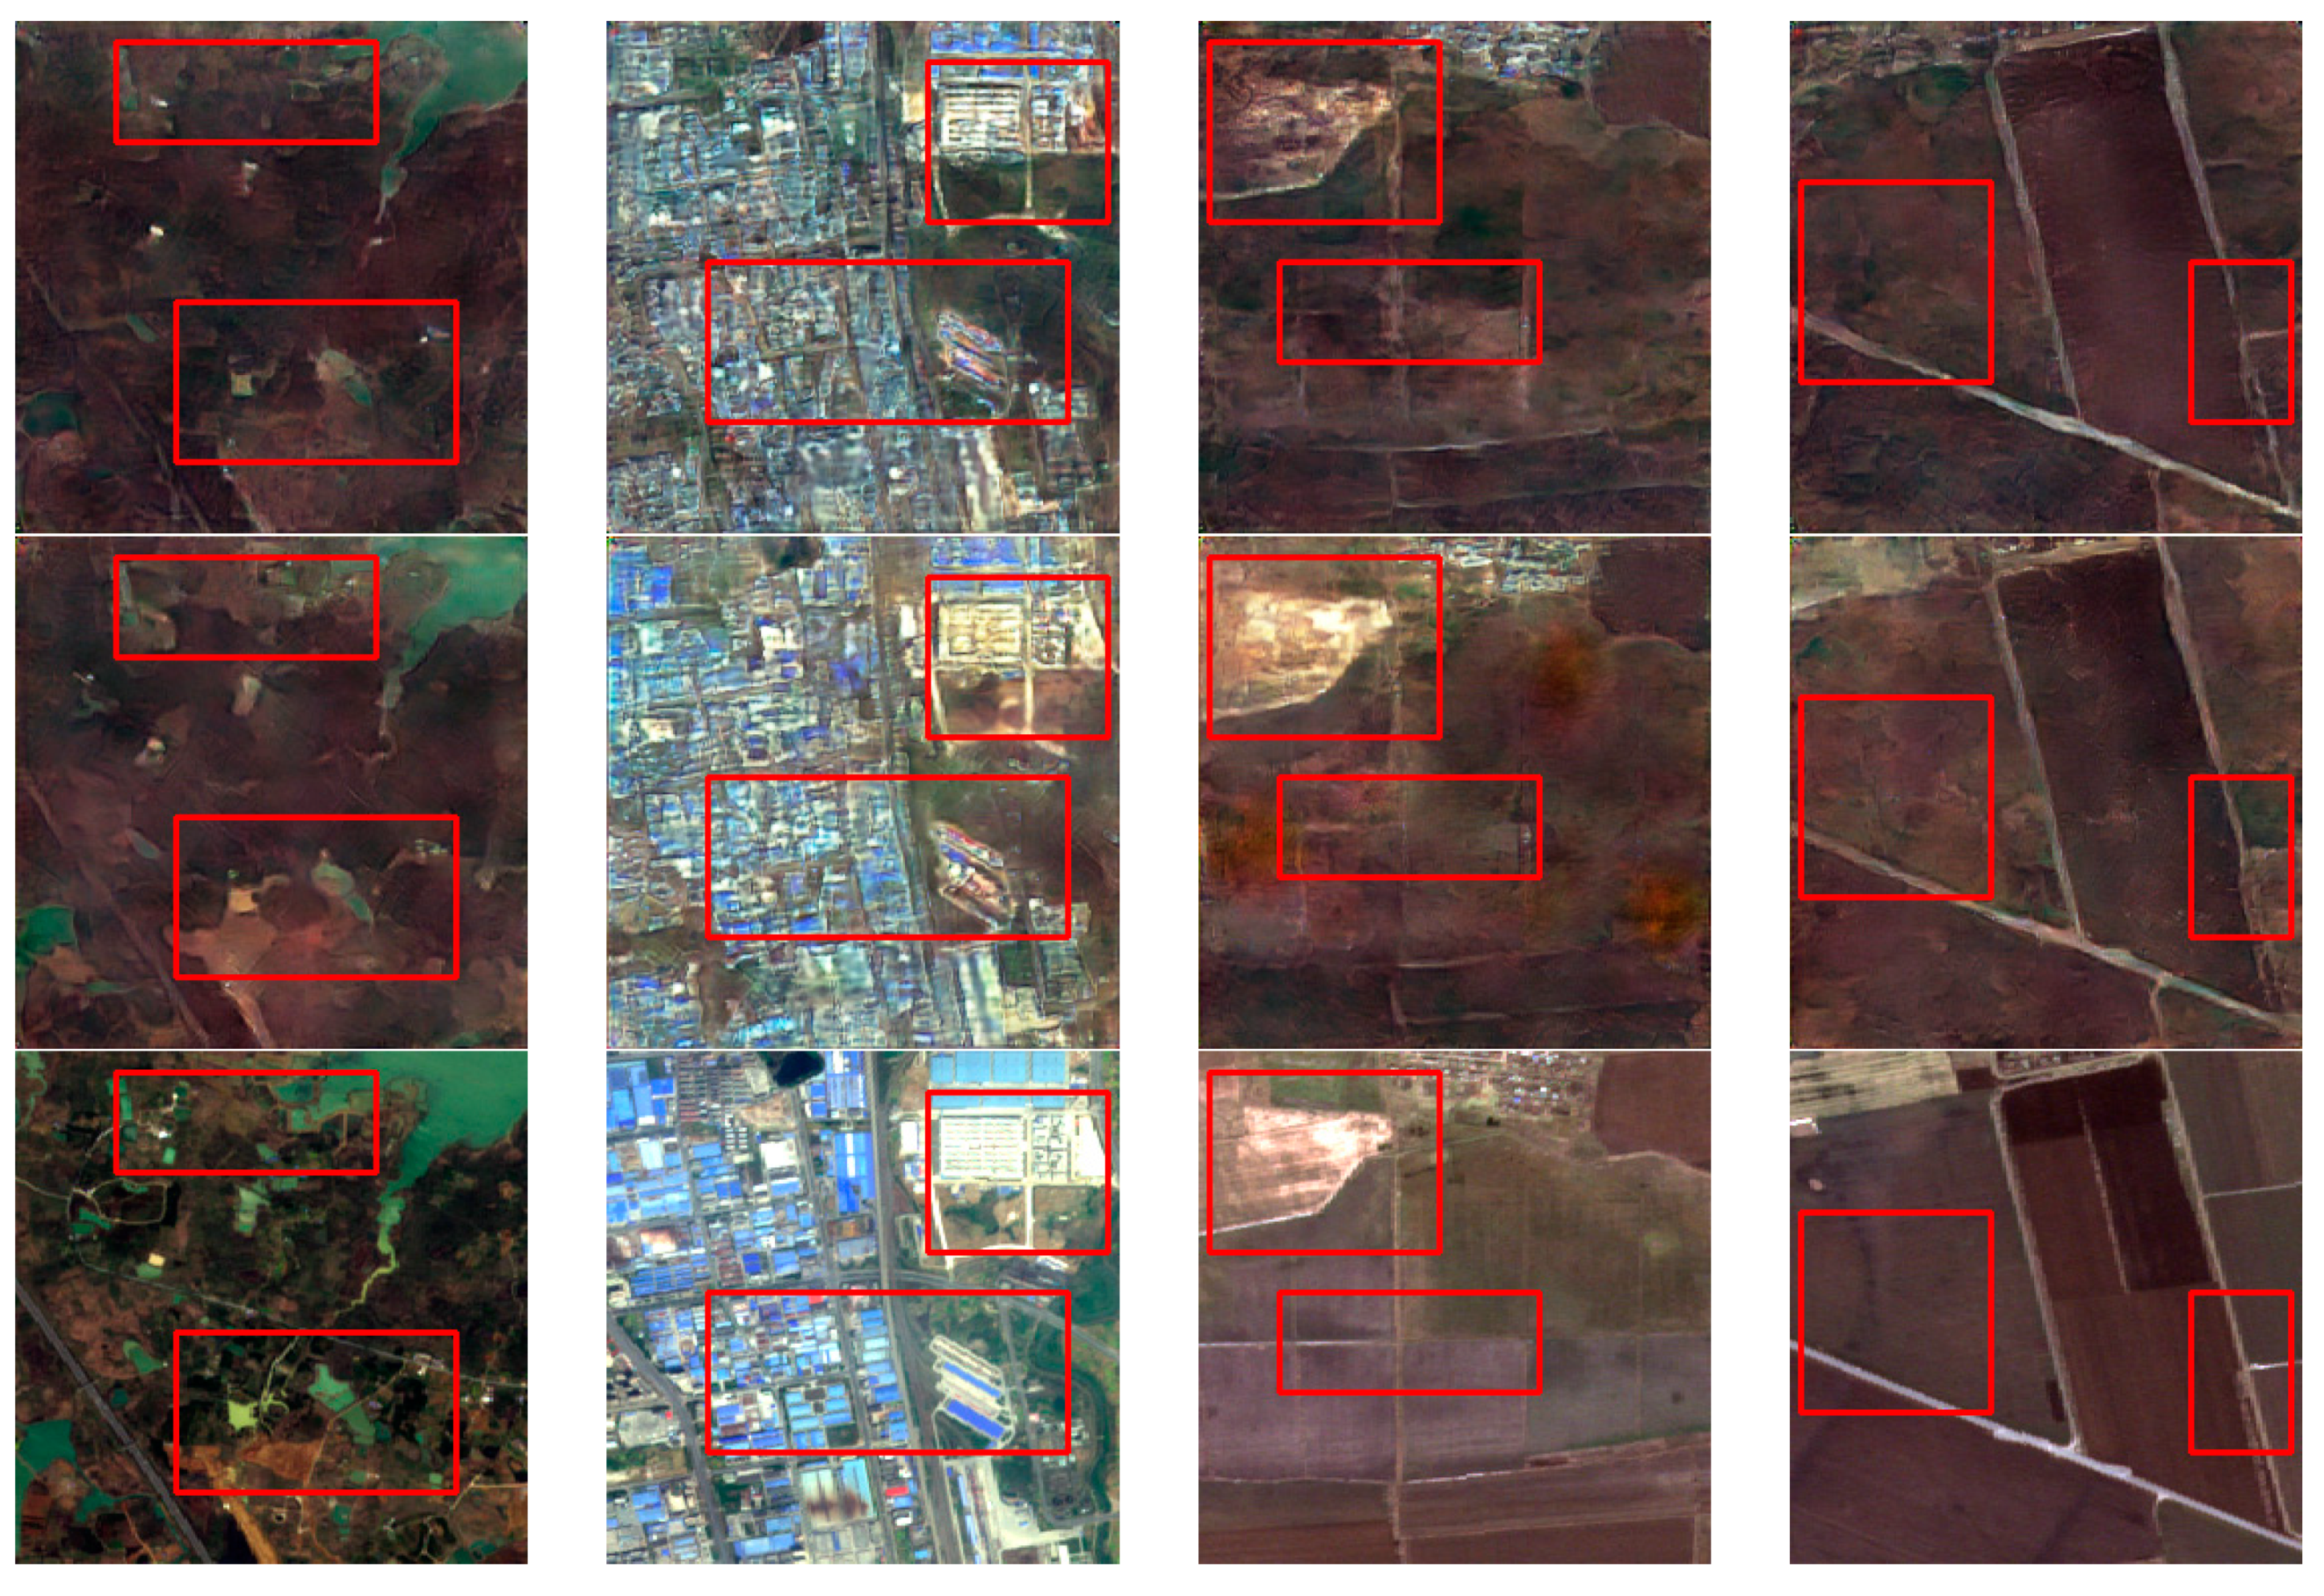
3.2. A Comparison of Textural and Structural Information
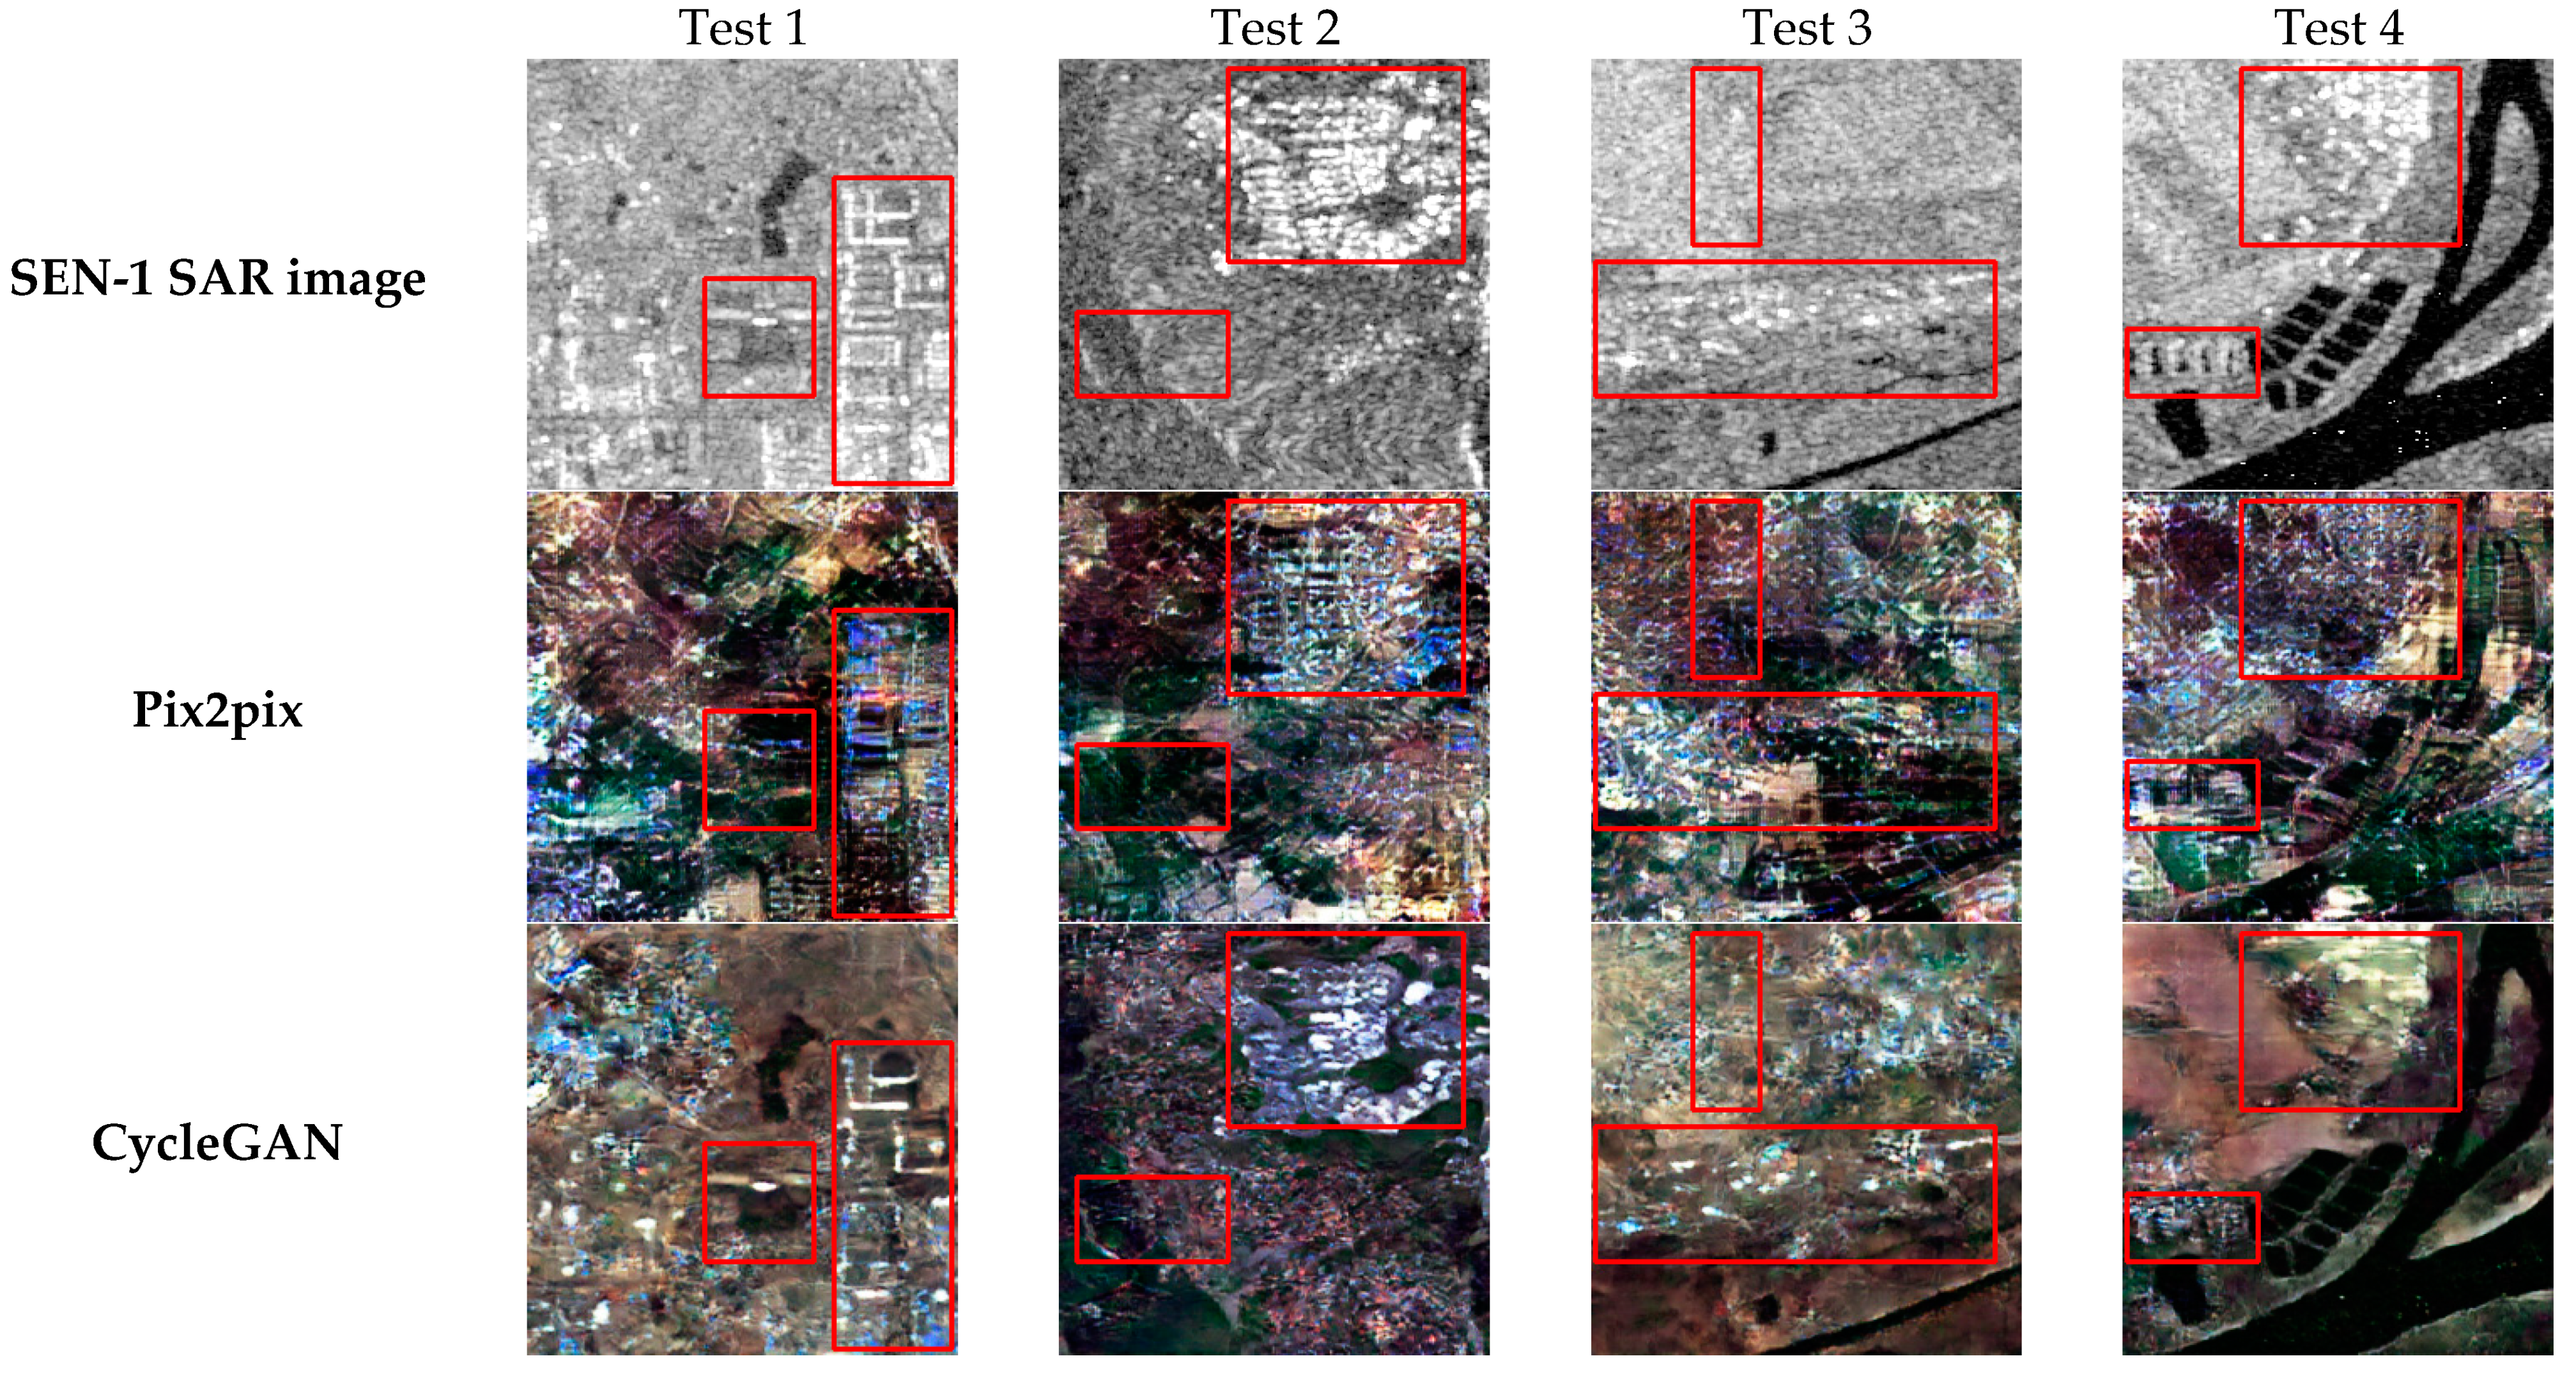
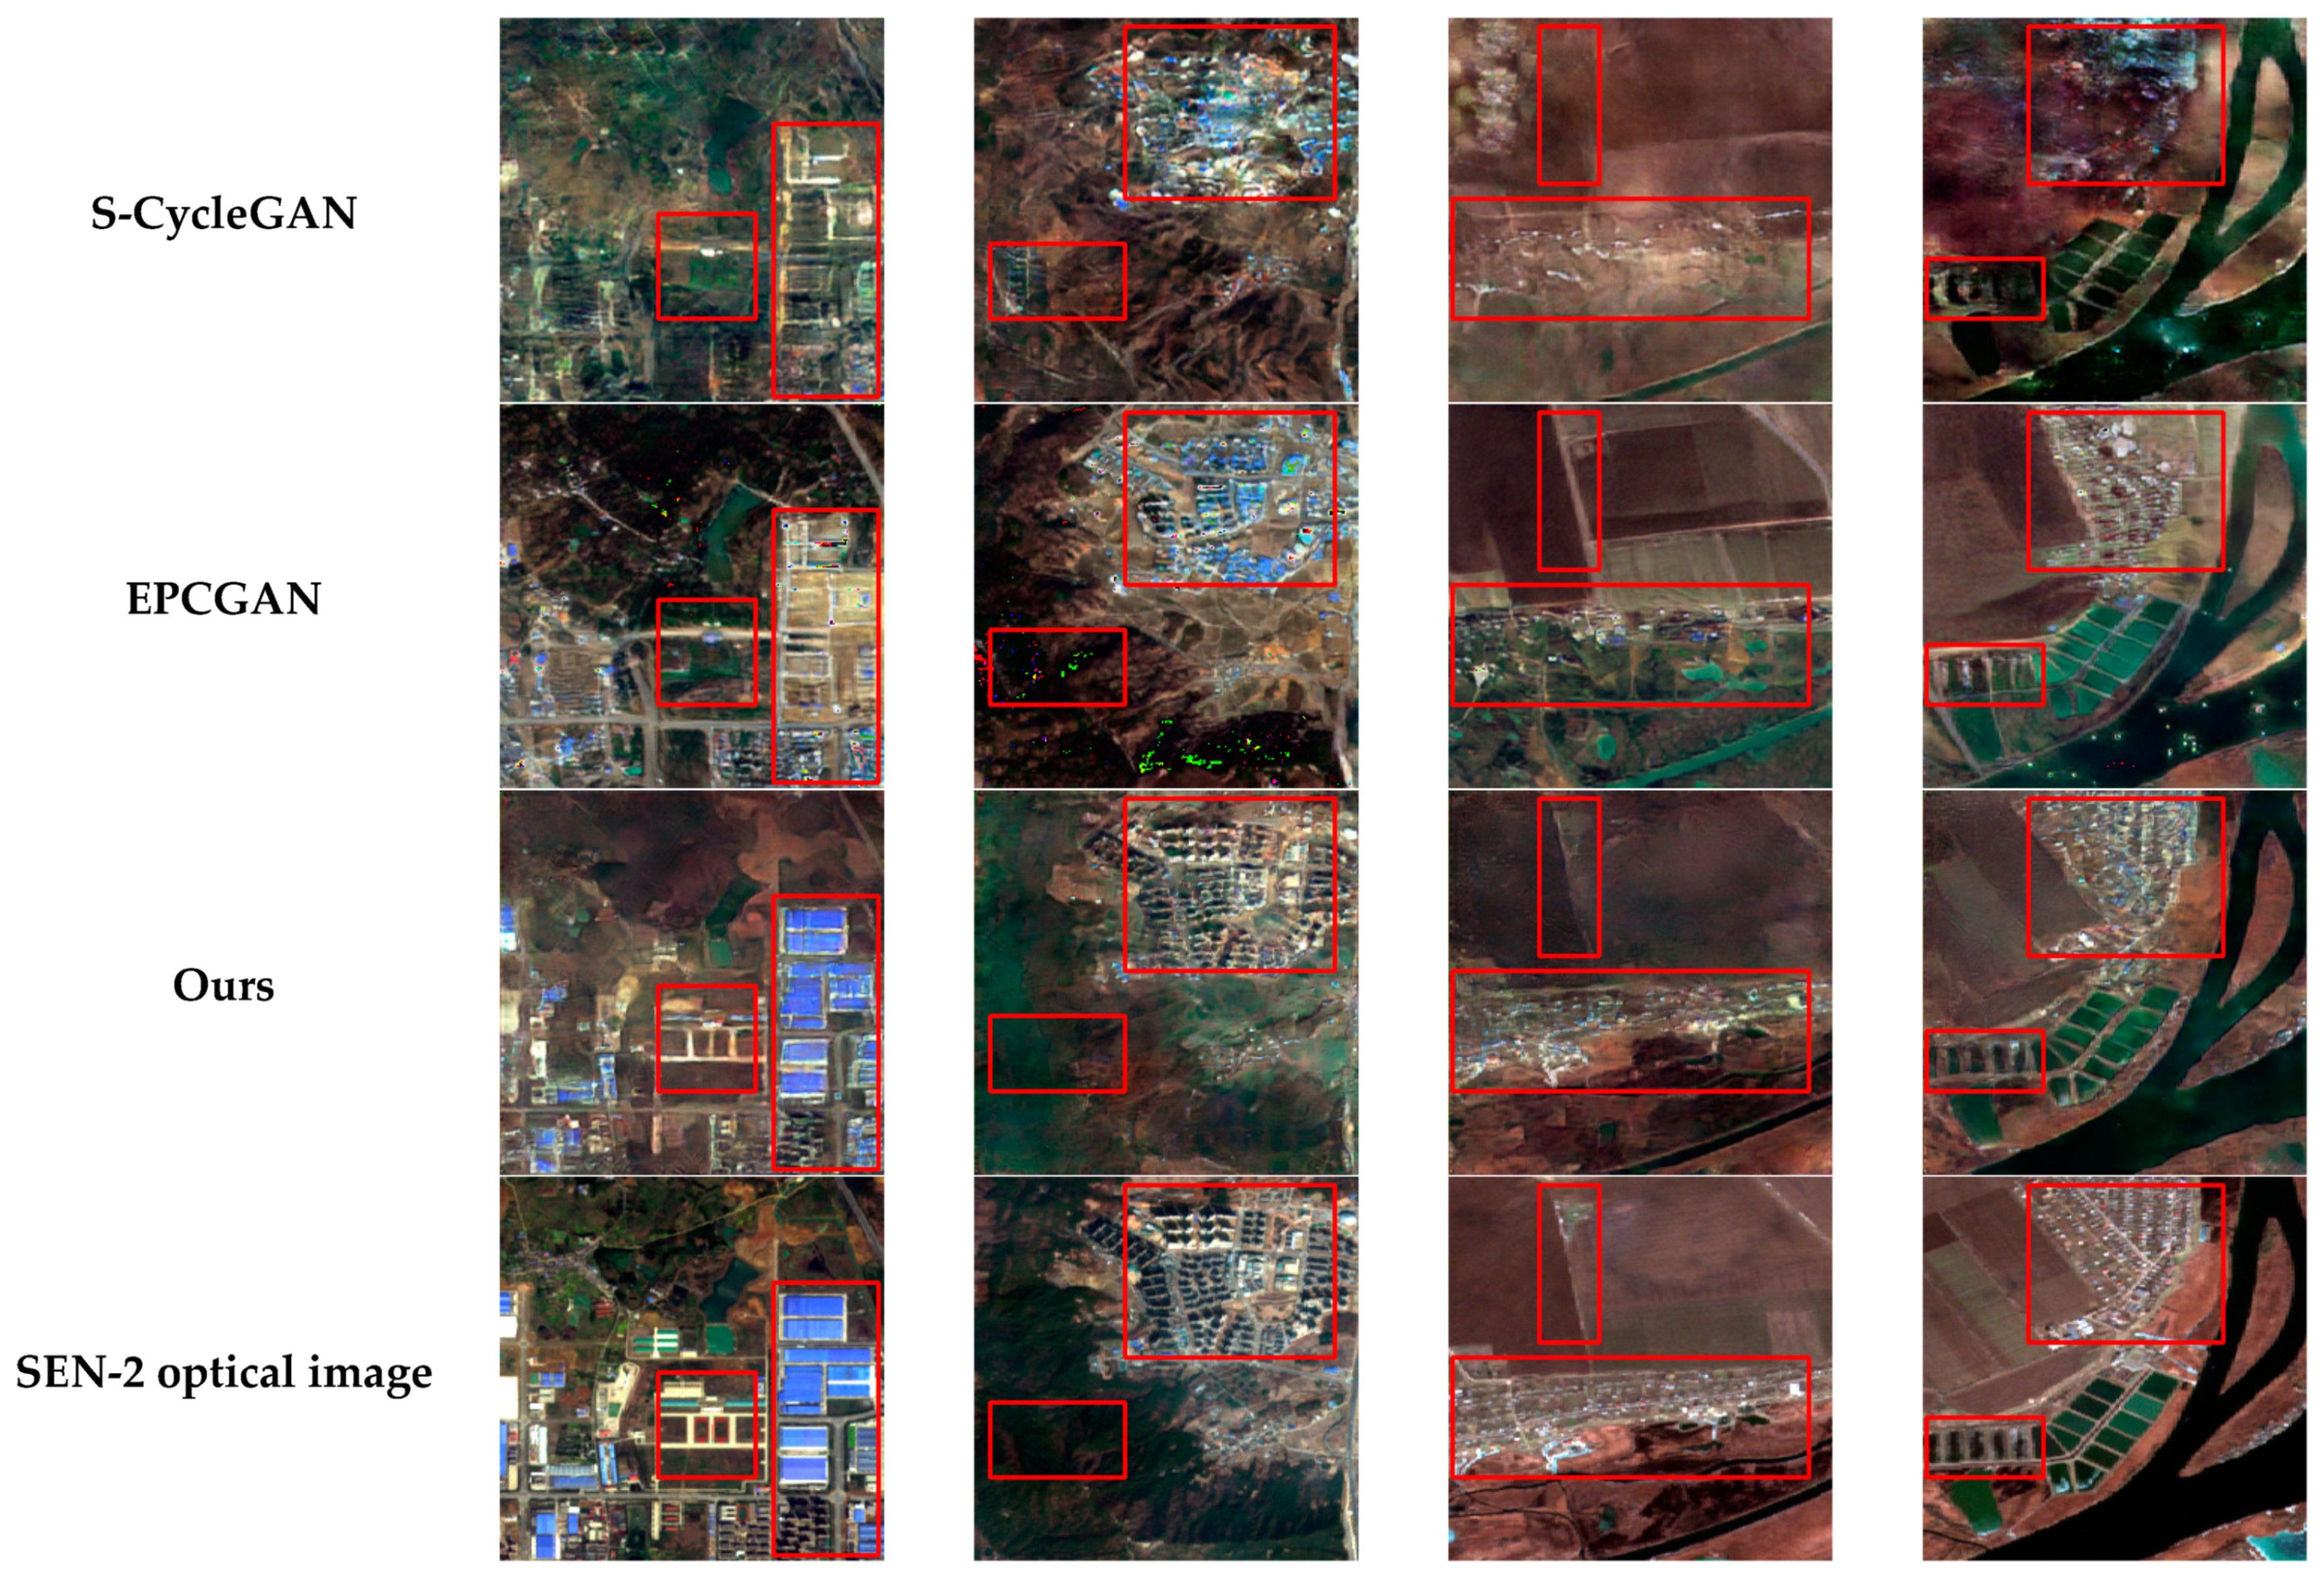
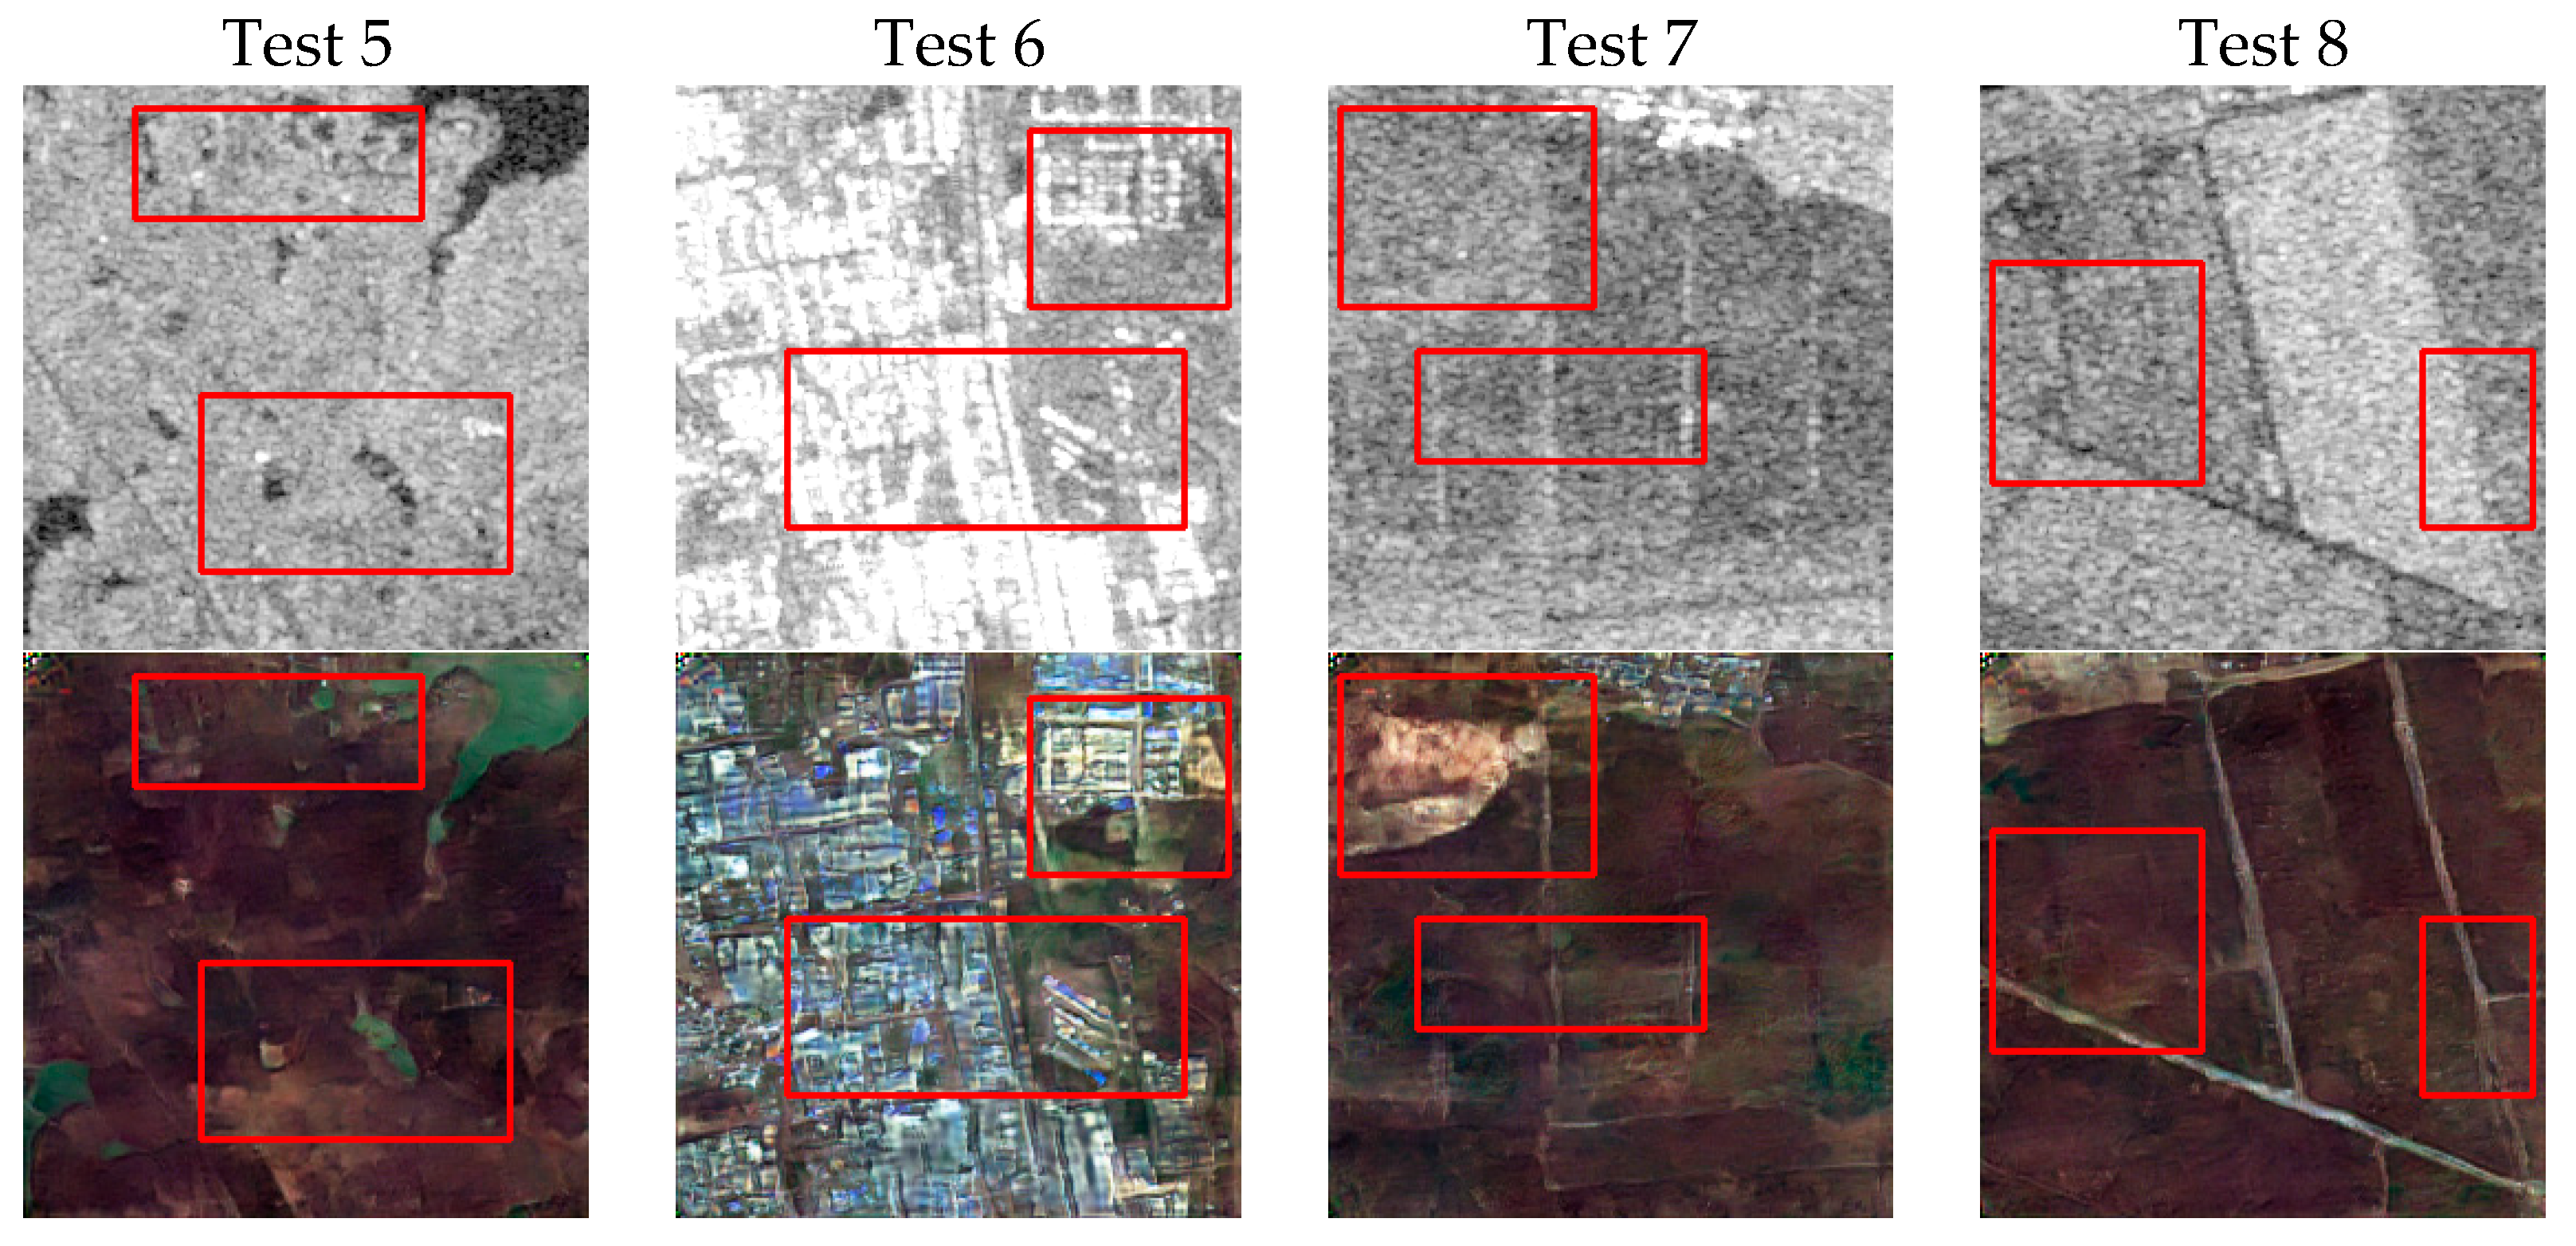
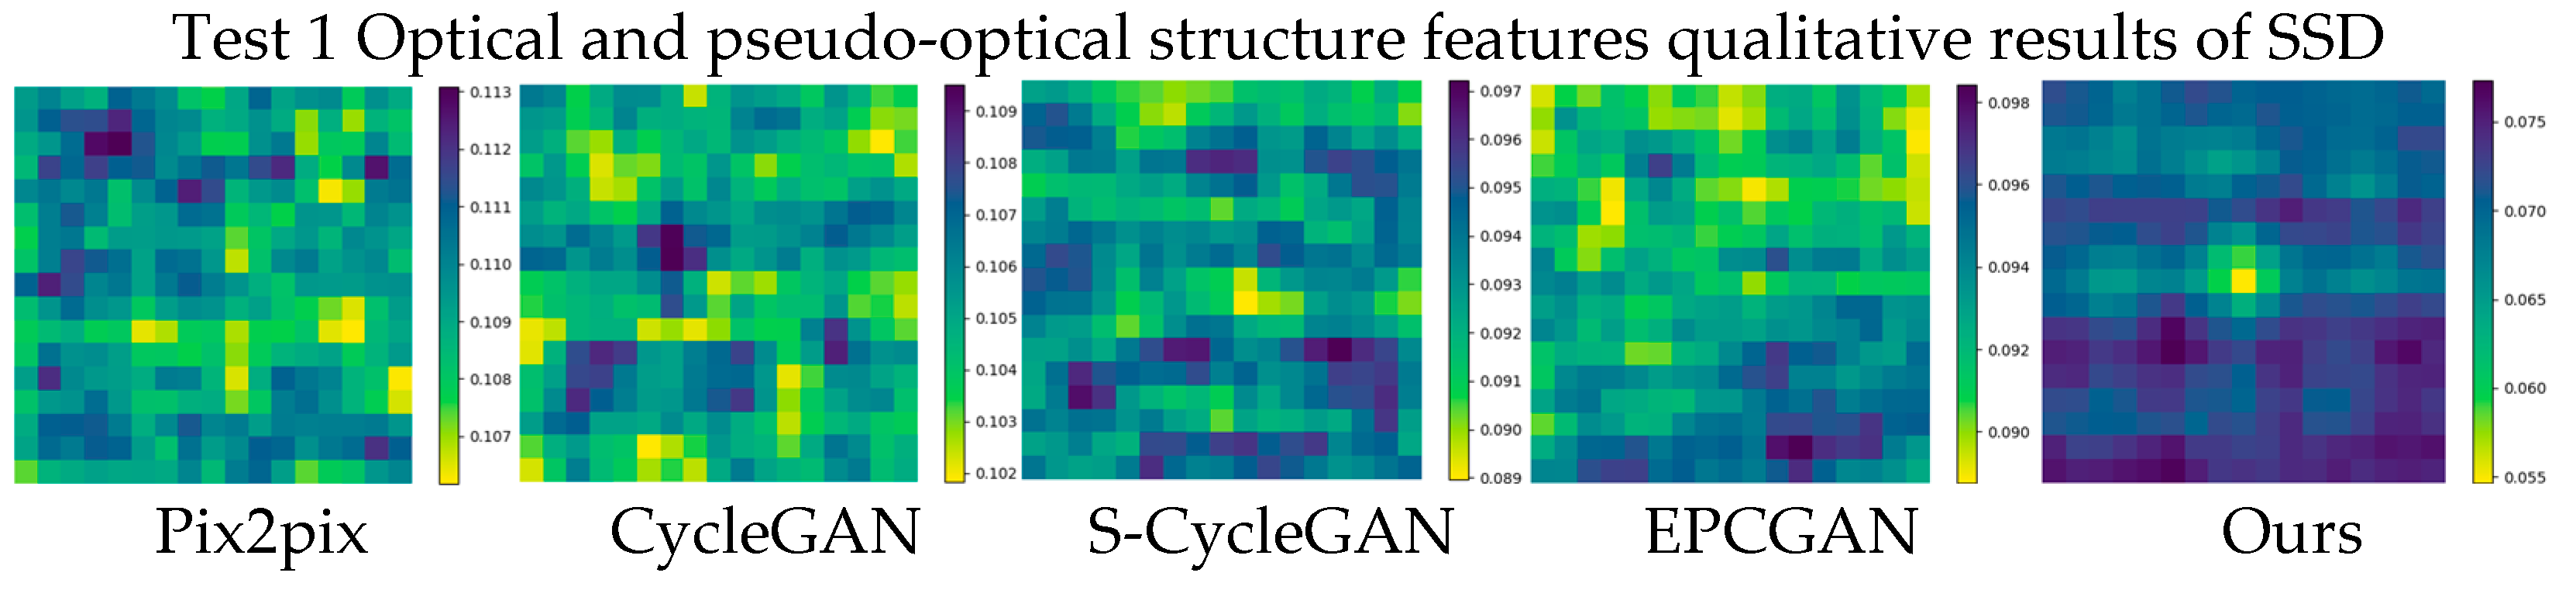
3.3. Results and Analysis
3.4. Ablation Experiment
3.5. Matching Applications
4. Discussion
5. Conclusions
Author Contributions
Funding
Institutional Review Board Statement
Informed Consent Statement
Data Availability Statement
Conflicts of Interest
References
- Kulkarni, S.C.; Rege, P.P. Pixel Level Fusion Techniques for SAR and Optical Images: A Review. Inf. Fusion 2020, 59, 13–29. [Google Scholar] [CrossRef]
- Li, Z.; Zhang, H.; Huang, Y. A Rotation-Invariant Optical and SAR Image Registration Algorithm Based on Deep and Gaussian Features. Remote Sens. 2021, 13, 2628. [Google Scholar] [CrossRef]
- Tapete, D.; Cigna, F. Detection of Archaeological Looting from Space: Methods, Achievements and Challenges. Remote Sens. 2019, 11, 2389. [Google Scholar] [CrossRef] [Green Version]
- Song, S.; Jin, K.; Zuo, B.; Yang, J. A novel change detection method combined with registration for SAR images. Remote Sens. Lett. 2019, 10, 669–678. [Google Scholar] [CrossRef]
- Lacroix, P.; Gavillon, T.; Bouchant, C.; Lavé, J.; Mugnier, J.-L.; Dhungel, S.; Vernier, F. SAR and optical images correlation illuminates post-seismic landslide motion after the Mw 7.8 Gorkha earthquake (Nepal). Sci. Rep. 2022, 12, 6266. [Google Scholar] [CrossRef]
- Lowe, D.G. Distinctive image features from scale-invariant keypoints. Int. J. Comput. Vis. 2004, 60, 91–110. [Google Scholar] [CrossRef]
- Bay, H.; Tuytelaars, T.; Gool, L.V. Surf: Speeded up robust features. In Proceedings of the European Conference on Computer Vision, Graz, Austria, 7–13 May 2006; pp. 404–417. [Google Scholar]
- Rublee, E.; Rabaud, V.; Konolige, K.; Bradski, G. ORB: An efficient alternative to SIFT or SURF. In Proceedings of the 2011 International Conference on Computer Vision, Barcelona, Spain, 6–13 November 2011; pp. 2564–2571. [Google Scholar]
- Sun, J.; Shen, Z.; Wang, Y.; Bao, H.; Zhou, X. LoFTR: Detector-free local feature matching with transformers. In Proceedings of the IEEE/CVF Conference on Computer Vision and Pattern Recognition, Nashville, TN, USA, 20–25 June 2021; pp. 8922–8931. [Google Scholar]
- Cui, S.; Ma, A.; Zhang, L.; Xu, M.; Zhong, Y. MAP-Net: SAR and Optical Image Matching via Image-Based Convolutional Network with Attention Mechanism and Spatial Pyramid Aggregated Pooling. IEEE Trans. Geosci. Remote Sens. 2021, 60, 1000513. [Google Scholar] [CrossRef]
- Li, J.; Hu, Q.; Ai, M. RIFT: Multi-modal image matching based on radiation-variation insensitive feature transform. IEEE Trans. Image Process. 2019, 29, 3296–3310. [Google Scholar] [CrossRef]
- Cui, S.; Xu, M.; Ma, A.; Zhong, Y. Modality-Free Feature Detector and Descriptor for Multimodal Remote Sensing Image Registration. Remote Sens. 2020, 12, 2937. [Google Scholar] [CrossRef]
- Li, J.; Xu, W.; Shi, P.; Zhang, Y.; Hu, Q. LNIFT: Locally Normalized Image for Rotation Invariant Multimodal Feature Matching. IEEE Trans. Geosci. Remote Sens. 2022, 60, 3165940. [Google Scholar] [CrossRef]
- Xiang, Y.; Jiao, N.; Wang, F.; You, H. A Robust Two-Stage Registration Algorithm for Large Optical and SAR Images. IEEE Trans. Geosci. Remote Sens. 2021, 60, 5218615. [Google Scholar] [CrossRef]
- Tang, L.; Yuan, J.; Ma, J. Image fusion in the loop of high-level vision tasks: A semantic-aware real-time infrared and visible image fusion network. Inf. Fusion 2022, 82, 28–42. [Google Scholar] [CrossRef]
- Guo, J.; He, C.; Zhang, M.; Li, Y.; Gao, X.; Song, B. Edge-Preserving Convolutional Generative Adversarial Networks for SAR-to-Optical Image Translation. Remote Sens. 2021, 13, 3575. [Google Scholar] [CrossRef]
- Quan, D.; Wang, S.; Liang, X.; Wang, R.; Fang, S.; Hou, B.; Jiao, L. Deep generative matching network for optical and SAR image registration. In Proceedings of the IGARSS 2018-2018 IEEE International Geoscience and Remote Sensing Symposium, Valencia, Spain, 23–17 July 2018; pp. 6215–6218. [Google Scholar]
- Merkle, N.; Auer, S.; Muller, R.; Reinartz, P. Exploring the Potential of Conditional Adversarial Networks for Optical and SAR Image Matching. IEEE J. Sel. Top. Appl. Earth Obs. Remote Sens. 2018, 11, 1811–1820. [Google Scholar] [CrossRef]
- Du, W.-L.; Zhou, Y.; Zhao, J.; Tian, X. K-means clustering guided generative adversarial networks for SAR-optical image matching. IEEE Access 2020, 8, 217554–217572. [Google Scholar] [CrossRef]
- Odegard, J.E.; Guo, H.; Lang, M.; Burrus, C.S.; Wells, R.O., Jr.; Novak, L.M.; Hiett, M. Wavelet-based SAR speckle reduction and image compression. In Algorithms for Synthetic Aperture Radar Imagery II; SPIE Press: Bellingham, WA, USA, 1995; pp. 259–271. [Google Scholar]
- Jiao, Y.; Niu, Y.; Liu, L.; Zhao, G.; Shi, G.; Li, F. Dynamic range reduction of SAR image via global optimum entropy maximization with reflectivity-distortion constraint. IEEE Trans. Geosci. Remote Sens. 2018, 56, 2526–2538. [Google Scholar] [CrossRef]
- Zhang, B.; Wang, C.; Zhang, H.; Wu, F. An adaptive two-scale enhancement method to visualize man-made objects in very high resolution SAR images. Remote Sens. Lett. 2015, 6, 725–734. [Google Scholar] [CrossRef]
- Zhou, X.; Zhang, C.; Li, S. A perceptive uniform pseudo-color coding method of SAR images. In Proceedings of the 2006 CIE International Conference on Radar, Shanghai, China, 16–19 October 2006; pp. 1–4. [Google Scholar]
- Li, Z.; Liu, J.; Huang, J. Dynamic range compression and pseudo-color presentation based on Retinex for SAR images. In Proceedings of the 2008 International Conference on Computer Science and Software Engineering, Wuhan, China, 12–14 December 2008; pp. 257–260. [Google Scholar]
- Deng, Q.; Chen, Y.; Zhang, W.; Yang, J. Colorization for polarimetric SAR image based on scattering mechanisms. In Proceedings of the 2008 Congress on Image and Signal Processing, Sanya, China, 27–30 May 2008; pp. 697–701. [Google Scholar]
- Larsson, G.; Maire, M.; Shakhnarovich, G. Learning representations for automatic colorization. In Proceedings of the European Conference on Computer Vision, Amsterdam, The Netherlands, 11–14 October 2016; pp. 577–593. [Google Scholar]
- Wang, P.; Patel, V.M. Generating high quality visible images from SAR images using CNNs. In Proceedings of the 2018 IEEE Radar Conference (RadarConf18), Oklahoma City, OK, USA, 23–27 April 2018; pp. 0570–0575. [Google Scholar]
- Goodfellow, I.; Pouget-Abadie, J.; Mirza, M.; Xu, B.; Warde-Farley, D.; Ozair, S.; Courville, A.; Bengio, Y. Generative adversarial nets. arXiv 2014, arXiv:1406.2661. [Google Scholar]
- Ao, D.; Dumitru, C.O.; Schwarz, G.; Datcu, M. Dialectical GAN for SAR image translation: From Sentinel-1 to TerraSAR-X. Remote Sens. 2018, 10, 1597. [Google Scholar] [CrossRef] [Green Version]
- Berthelot, D.; Schumm, T.; Metz, L. Began: Boundary equilibrium generative adversarial networks. arXiv 2017, arXiv:1703.10717. [Google Scholar]
- Marmanis, D.; Yao, W.; Adam, F.; Datcu, M.; Reinartz, P.; Schindler, K.; Wegner, J.D.; Stilla, U. Artificial generation of big data for improving image classification: A generative adversarial network approach on SAR data. arXiv 2017, arXiv:1711.02010. [Google Scholar]
- Isola, P.; Zhu, J.-Y.; Zhou, T.; Efros, A.A. Image-to-image translation with conditional adversarial networks. In Proceedings of the IEEE Conference on Computer Vision and Pattern Recognition, Honolulu, HI, USA, 21–26 July 2017; pp. 1125–1134. [Google Scholar]
- Zhu, J.-Y.; Park, T.; Isola, P.; Efros, A.A. Unpaired image-to-image translation using cycle-consistent adversarial networks. In Proceedings of the IEEE International Conference on Computer Vision, Venice, Italy, 22–29 October 2017; pp. 2223–2232. [Google Scholar]
- Wang, L.; Xu, X.; Yu, Y.; Yang, R.; Gui, R.; Xu, Z.; Pu, F. SAR-to-optical image translation using supervised cycle-consistent adversarial networks. IEEE Access 2019, 7, 129136–129149. [Google Scholar] [CrossRef]
- He, W.; Yokoya, N. Multi-temporal sentinel-1 and-2 data fusion for optical image simulation. ISPRS Int. J. Geo-Inf. 2018, 7, 389. [Google Scholar] [CrossRef] [Green Version]
- Zhang, J.; Zhou, J.; Lu, X. Feature-guided SAR-to-optical image translation. IEEE Access 2020, 8, 70925–70937. [Google Scholar] [CrossRef]
- Zhang, Q.; Liu, X.; Liu, M.; Zou, X.; Zhu, L.; Ruan, X. Comparative analysis of edge information and polarization on sar-to-optical translation based on conditional generative adversarial networks. Remote Sens. 2021, 13, 128. [Google Scholar] [CrossRef]
- Guo, X.; Yang, H.; Huang, D. Image Inpainting via Conditional Texture and Structure Dual Generation. In Proceedings of Proceedings of the IEEE/CVF International Conference on Computer Vision, Montreal, QC, Canada, 10–17 October 2021; pp. 14134–14143. [Google Scholar]
- Yu, J.; Lin, Z.; Yang, J.; Shen, X.; Lu, X.; Huang, T.S. Generative image inpainting with contextual attention. In Proceedings of Proceedings of the IEEE Conference on Computer Vision and Pattern Recognition, Salt Lake City, UT, USA, 18–23 June 2018; pp. 5505–5514. [Google Scholar]
- Canny, J. A computational approach to edge detection. IEEE Trans. Pattern Anal. Mach. Intell. 1986, 6, 679–698. [Google Scholar] [CrossRef]
- Jiang, L.; Dai, B.; Wu, W.; Loy, C.C. Focal frequency loss for image reconstruction and synthesis. In Proceedings of the IEEE/CVF International Conference on Computer Vision, Montreal, QC, Canada, 10–17 October 2021; pp. 13919–13929. [Google Scholar]
- Liu, G.; Reda, F.A.; Shih, K.J.; Wang, T.-C.; Tao, A.; Catanzaro, B. Image inpainting for irregular holes using partial convolutions. In Proceedings of the European Conference on Computer Vision (ECCV), Munich, Germany, 8–14 September 2018; pp. 85–100. [Google Scholar]
- He, K.; Zhang, X.; Ren, S.; Sun, J. Deep residual learning for image recognition. In Proceedings of the IEEE Conference on Computer Vision and Pattern Recognition, Las Vegas, NV, USA, 27–30 June 2016; pp. 770–778. [Google Scholar]
- Miyato, T.; Kataoka, T.; Koyama, M.; Yoshida, Y. Spectral normalization for generative adversarial networks. arXiv 2018, arXiv:1802.05957. [Google Scholar]
- Russakovsky, O.; Deng, J.; Su, H.; Krause, J.; Satheesh, S.; Ma, S.; Huang, Z.; Karpathy, A.; Khosla, A.; Bernstein, M. Imagenet large scale visual recognition challenge. Int. J. Comput. Vis. 2015, 115, 211–252. [Google Scholar] [CrossRef] [Green Version]
- Gatys, L.A.; Ecker, A.S.; Bethge, M. Image style transfer using convolutional neural networks. In Proceedings of the IEEE Conference on Computer Vision and Pattern Recognition, Las Vegas, NV, USA, 27–30 June 2016; pp. 2414–2423. [Google Scholar]
- Sajjadi, M.S.; Scholkopf, B.; Hirsch, M. Enhancenet: Single image super-resolution through automated texture synthesis. In Proceedings of the IEEE International Conference on Computer Vision, Venice, Italy, 22–29 October 2017; pp. 4491–4500. [Google Scholar]
- Wang, Z.; Bovik, A.C.; Sheikh, H.R.; Simoncelli, E.P. Image quality assessment: From error visibility to structural similarity. IEEE Trans. Image Process. 2004, 13, 600–612. [Google Scholar] [CrossRef] [Green Version]
- Zhang, L.; Zhang, L.; Mou, X.; Zhang, D. FSIM: A feature similarity index for image quality assessment. IEEE Trans. Image Process. 2011, 20, 2378–2386. [Google Scholar] [CrossRef] [Green Version]
- Schmitt, M.; Hughes, L.H.; Zhu, X.X. The SEN1-2 dataset for deep learning in SAR-optical data fusion. arXiv 2018, arXiv:1807.01569. [Google Scholar] [CrossRef] [Green Version]
- Collobert, R.; Kavukcuoglu, K.; Farabet, C. Torch7: A matlab-like environment for machine learning. In Proceedings of the BigLearn, NIPS Workshop, Granada, Spain, 12–15 December 2011. [Google Scholar]
- Kingma, D.P.; Ba, J. Adam: A method for stochastic optimization. arXiv 2014, arXiv:1412.6980. [Google Scholar]
- Ye, Y.; Shan, J.; Hao, S.; Bruzzone, L.; Qin, Y. A local phase based invariant feature for remote sensing image matching. ISPRS J. Photogramm. Remote Sens. 2018, 142, 205–221. [Google Scholar] [CrossRef]
- DeTone, D.; Malisiewicz, T.; Rabinovich, A. Superpoint: Self-supervised interest point detection and description. In Proceedings of the IEEE Conference on Computer Vision and Pattern Recognition Workshops, Salt Lake City, UT, USA, 18–23 June 2018; pp. 224–236. [Google Scholar]
- Barroso-Laguna, A.; Riba, E.; Ponsa, D.; Mikolajczyk, K. Key. net: Keypoint detection by handcrafted and learned cnn filters. In Proceedings of the IEEE/CVF International Conference on Computer Vision, Seoul, Korea, 27 October–2 November 2019; pp. 5836–5844. [Google Scholar]
- Leutenegger, S.; Chli, M.; Siegwart, R.Y. BRISK: Binary robust invariant scalable keypoints. In Proceedings of the 2011 International Conference on Computer Vision, Barcelona, Spain, 6–13 November 2011; pp. 2548–2555. [Google Scholar]
- Harris, C.; Stephens, M. A combined corner and edge detector. In Proceedings of the Alvey Vision Conference, Manchester, UK, 31 August–2 September 1988; pp. 10–5244. [Google Scholar]
- Zhang, X.; Hu, Q.; Ai, M.; Ren, X. A Multitemporal UAV Images Registration Approach Using Phase Congruency. In Proceedings of the 2018 26th International Conference on Geoinformatics, Kunming, China, 28–30 June 2018; pp. 1–6. [Google Scholar]
- Ma, W.; Wen, Z.; Wu, Y.; Jiao, L.; Gong, M.; Zheng, Y.; Liu, L. Remote sensing image registration with modified SIFT and enhanced feature matching. IEEE Geosci. Remote Sens. Lett. 2016, 14, 3–7. [Google Scholar] [CrossRef]
- Dellinger, F.; Delon, J.; Gousseau, Y.; Michel, J.; Tupin, F. SAR-SIFT: A SIFT-like algorithm for SAR images. IEEE Trans. Geosci. Remote Sens. 2014, 53, 453–466. [Google Scholar] [CrossRef] [Green Version]
- Zhang, H.; Lei, L.; Ni, W.; Tang, T.; Wu, J.; Xiang, D.; Kuang, G. Optical and SAR image matching using pixelwise deep dense features. IEEE Geosci. Remote Sens. Lett. 2020, 19, 6000705. [Google Scholar] [CrossRef]
- Zhang, H.; Lei, L.; Ni, W.; Tang, T.; Wu, J.; Xiang, D.; Kuang, G. Explore Better Network Framework for High-Resolution Optical and SAR Image Matching. IEEE Trans. Geosci. Remote Sens. 2022, 60, 4704418. [Google Scholar] [CrossRef]
- Pu, W. SAE-Net: A Deep Neural Network for SAR Autofocus. IEEE Trans. Geosci. Remote Sens. 2022, 60, 5220714. [Google Scholar] [CrossRef]


| Module Name | Filter Size | Channel | Stride | Padding | Nonlinearity |
|---|---|---|---|---|---|
| Texture/Structure (T/S) Encoder | |||||
| T/S Input | 3/2 | ||||
| T/S Encoder PConv1 | 7 × 7 | 64 | 2 | 3 | ReLU |
| T/S Encoder PConv2 | 5 × 5 | 128 | 2 | 2 | ReLU |
| T/S Encoder PConv3 | 5 × 5 | 256 | 2 | 2 | ReLU |
| T/S Encoder PConv4 | 3 × 3 | 512 | 2 | 1 | ReLU |
| T/S Encoder PConv5 | 3 × 3 | 512 | 2 | 1 | ReLU |
| T/S Encoder PConv6 | 3 × 3 | 512 | 2 | 1 | ReLU |
| T/S Encoder PConv7 | 3 × 3 | 512 | 2 | 1 | ReLU |
| Texture Decoder | |||||
| S Encoder-PConv7 | 512 | - | - | - | |
| Concat (S Encoder-PConv7, T Encoder-PConv6) | 512 + 512 | - | - | - | |
| T Decoder PConv8 | 3 × 3 | 512 | 1 | 1 | LeakyReLU |
| Concat (T Decoder PConv8, T Encoder-PConv5) | 512 + 512 | - | - | - | |
| T Decoder PConv9 | 3 × 3 | 512 | 1 | 1 | LeakyReLU |
| Concat (T Decoder PConv9, T Encoder-PConv4) | 512 + 512 | - | - | - | |
| T Decoder PConv10 | 3 × 3 | 512 | 1 | 1 | LeakyReLU |
| Concat (T Decoder PConv10, T Encoder-PConv3) | 512 + 256 | - | - | - | |
| T Decoder PConv11 | 3 × 3 | 256 | 1 | 1 | LeakyReLU |
| Concat (T Decoder PConv11, T Encoder-PConv2) | 256 + 128 | - | - | - | |
| T Decoder PConv12 | 3 × 3 | 128 | 1 | 1 | LeakyReLU |
| Concat (T Decoder PConv12, T Encoder-PConv1) | 128 + 64 | - | - | - | |
| T Decoder PConv13 | 3 × 3 | 64 | 1 | 1 | LeakyReLU |
| Concat (T Decoder PConv13, T Input) | 64 + 3 | - | - | - | |
| Texture Feature | 3 × 3 | 64 | 1 | 1 | LeakyReLU |
| Structure Decoder | |||||
| T Encoder-PConv7 | 512 | - | - | - | |
| Concat (T Encoder-PConv7, S Encoder-PConv6) | 512 + 512 | - | - | - | |
| S Decoder PConv14 | 3 × 3 | 512 | 1 | 1 | LeakyReLU |
| Concat (S Decoder PConv14, T Encoder-PConv5) | 512 + 512 | - | - | - | |
| S Decoder PConv15 | 3 × 3 | 512 | 1 | 1 | LeakyReLU |
| Concat (S Decoder PConv15, T Encoder-PConv4) | 512 + 512 | - | - | - | |
| S Decoder PConv16 | 3 × 3 | 512 | 1 | 1 | LeakyReLU |
| Concat (S Decoder PConv16, T Encoder-PConv3) | 512 + 256 | - | - | - | |
| S Decoder PConv17 | 3 × 3 | 256 | 1 | 1 | LeakyReLU |
| Concat (S Decoder PConv17, T Encoder-PConv2) | 256 + 128 | - | - | - | |
| S Decoder PConv18 | 3 × 3 | 128 | 1 | 1 | LeakyReLU |
| Concat (S Decoder PConv18, T Encoder-PConv1) | 128 + 64 | - | - | - | |
| S Decoder PConv19 | 3 × 3 | 64 | 1 | 1 | LeakyReLU |
| Concat (S Decoder PConv19, S Input) | 64 + 2 | - | - | - | |
| Structure Feature | 3 × 3 | 64 | 1 | 1 | LeakyReLU |
| IQA | DATA | Pix2pix | CycleGAN | S-CycleGAN | EPCGAN | Ours |
|---|---|---|---|---|---|---|
| PSNR | Test 1 | 11.2090 | 11.8234 | 13.6493 | 13.1767 | 19.0867 |
| Test 2 | 12.0022 | 13.0566 | 14.3403 | 15.7064 | 20.2105 | |
| Test 3 | 13.1578 | 12.8568 | 16.5878 | 16.6274 | 20.1606 | |
| Test 4 | 11.6502 | 14.7996 | 14.1882 | 16.0283 | 20.2383 | |
| all_test (Average) | 11.2212 | 12.0270 | 14.4801 | 14.7253 | 17.8228 | |
| FSIMc | Test 1 | 0.5962 | 0.6062 | 0.6262 | 0.6210 | 0.7357 |
| Test 2 | 0.5980 | 0.6071 | 0.6712 | 0.6623 | 0.7736 | |
| Test 3 | 0.5222 | 0.5622 | 0.6651 | 0.6859 | 0.7793 | |
| Test 4 | 0.5383 | 0.7011 | 0.6942 | 0.7005 | 0.7837 | |
| all_test (Average) | 0.5719 | 0.6055 | 0.6699 | 0.6611 | 0.7167 | |
| SSIM | Test 1 | 0.0711 | 0.0413 | 0.0566 | 0.0746 | 0.4574 |
| Test 2 | 0.0825 | 0.0642 | 0.0909 | 0.1318 | 0.4586 | |
| Test 3 | 0.0567 | 0.0601 | 0.2367 | 0.2326 | 0.4911 | |
| Test 4 | 0.0616 | 0.2023 | 0.1697 | 0.2042 | 0.4263 | |
| all_test (Average) | 0.0528 | 0.0533 | 0.1204 | 0.1264 | 0.3308 |
| IQA | DATA | Guo [38] | Ours (+MSE Loss) | Ours (+MSE Loss +FFL Loss) |
|---|---|---|---|---|
| PSNR | Test 5 | 22.6563 | 22.8161 | 23.3868 |
| Test 6 | 13.0547 | 13.8798 | 16.4298 | |
| Test 7 | 16.4138 | 16.5352 | 19.4805 | |
| Test 8 | 22.5349 | 22.7283 | 24.8288 | |
| all_test (Average) | 16.6327 | 17.0269 | 17.8228 | |
| FSIMc | Test 5 | 0.7227 | 0.7255 | 0.7271 |
| Test 6 | 0.6789 | 0.7026 | 0.7231 | |
| Test 7 | 0.7745 | 0.7837 | 0.8068 | |
| Test 8 | 0.7747 | 0.7734 | 0.7824 | |
| all_test (Average) | 0.7007 | 0.7117 | 0.7167 | |
| SSIM | Test 5 | 0.3237 | 0.3344 | 0.3756 |
| Test 6 | 0.2493 | 0.3038 | 0.3818 | |
| Test 7 | 0.3534 | 0.4079 | 0.4459 | |
| Test 8 | 0.4897 | 0.5259 | 0.5364 | |
| all_test (Average) | 0.2714 | 0.3092 | 0.3308 |
| Keypoint Repeatability | Keypoint Detection Methods | Optical Keypoint Number | PO/S Keypoint Number | Translation Mode | Euclidean Distance Threshold (L2) | ||||
|---|---|---|---|---|---|---|---|---|---|
| 3.0 | 2.5 | 2.0 | 1.5 | 1.0 | |||||
| Test 1 % Rep. | SuperPoint [54] | 603 | 488/288 | O-PO | 56.64% | 45.55% | 30.25% | 20.18% | 9.93% |
| O-S | 26.23% | 19.25% | 11.07% | 7.46% | 4.09% | ||||
| Key.Net [55] | 494 | 593/419 | O-PO | 40.66% | 36.40% | 28.07% | 22.37% | 15.29% | |
| O-S | 19.27% | 14.68% | 9.20% | 5.91% | 3.72% | ||||
| SIFT [6] | 564 | 600/597 | O-PO | 51.20% | 42.27% | 34.36% | 23.19% | 14.95% | |
| O-S | 39.28% | 29.80% | 22.22% | 13.61% | 5.50% | ||||
| SURF [7] | 530 | 517/542 | O-PO | 53.30% | 46.03% | 36.87% | 26.93% | 17.38% | |
| O-S | 35.45% | 24.63% | 16.79% | 10.26% | 5.41% | ||||
| BRISK [56] | 613 | 604/585 | O-PO | 67.05% | 61.13% | 49.96% | 39.77% | 24.65% | |
| O-S | 39.23% | 30.55% | 21.70% | 14.02% | 6.51% | ||||
| Harris [57] | 587 | 599/576 | O-PO | 50.08% | 38.11% | 27.65% | 18.21% | 9.10% | |
| O-S | 40.24% | 30.26% | 18.57% | 10.83% | 4.64% | ||||
| PC-Harris [58] | 532 | 458/581 | O-PO | 53.13% | 43.23% | 30.30% | 19.80% | 9.90% | |
| O-S | 40.61% | 29.11% | 18.86% | 9.88% | 5.03% | ||||
| Hessian | 569 | 563/588 | O-PO | 55.83% | 44.52% | 33.92% | 22.61% | 11.84% | |
| O-S | 41.83% | 33.36% | 24.20% | 12.96% | 5.36% | ||||
| Match Pairs | Translation Mode | LoFTR [9] | RIFT [11] | PSO-SIFT [59] | SAR-SIFT [60] | SIFT [6] | |||||
|---|---|---|---|---|---|---|---|---|---|---|---|
| NCM | RMSE | NCM | RMSE | NCM | RMSE | NCM | RMSE | NCM | RMSE | ||
| Test 1 | O-PO | 638 | 0.1113 | 232 | 1.6275 | 75 | 1.5361 | 22 | 0.5712 | 29 | 0.6069 |
| O-S | 0 | / | 86 | 1.8802 | 0 | / | 0 | / | 0 | / | |
| Test 2 | O-PO | 485 | 0.1861 | 328 | 1.7807 | 69 | 1.5554 | 18 | 0.5427 | 26 | 0.5795 |
| O-S | 0 | / | 131 | 1.8214 | 0 | / | 0 | / | 0 | / | |
| Test 3 | O-PO | 335 | 0.6239 | 211 | 1.8689 | 20 | 1.3701 | 7 | 0.4694 | 14 | 0.5907 |
| O-S | 0 | / | 91 | 1.9132 | 0 | / | 0 | / | 0 | / | |
| Test 4 | O-PO | 404 | 0.2441 | 265 | 1.8538 | 57 | 1.7190 | 8 | 0.6512 | 15 | 0.5801 |
| O-S | 72 | 1.1113 | 180 | 1.9114 | 11 | 1.0988 | 0 | / | 8 | 0.4473 | |
Publisher’s Note: MDPI stays neutral with regard to jurisdictional claims in published maps and institutional affiliations. |
© 2022 by the authors. Licensee MDPI, Basel, Switzerland. This article is an open access article distributed under the terms and conditions of the Creative Commons Attribution (CC BY) license (https://creativecommons.org/licenses/by/4.0/).
Share and Cite
Nie, H.; Fu, Z.; Tang, B.-H.; Li, Z.; Chen, S.; Wang, L. A Dual-Generator Translation Network Fusing Texture and Structure Features for SAR and Optical Image Matching. Remote Sens. 2022, 14, 2946. https://doi.org/10.3390/rs14122946
Nie H, Fu Z, Tang B-H, Li Z, Chen S, Wang L. A Dual-Generator Translation Network Fusing Texture and Structure Features for SAR and Optical Image Matching. Remote Sensing. 2022; 14(12):2946. https://doi.org/10.3390/rs14122946
Chicago/Turabian StyleNie, Han, Zhitao Fu, Bo-Hui Tang, Ziqian Li, Sijing Chen, and Leiguang Wang. 2022. "A Dual-Generator Translation Network Fusing Texture and Structure Features for SAR and Optical Image Matching" Remote Sensing 14, no. 12: 2946. https://doi.org/10.3390/rs14122946