
Multi-Scenario Simulation of Production-Living-Ecological Space in the Poyang Lake Area Based on Remote Sensing and RF-Markov-FLUS Model

Abstract
:1. Introduction
- (1)
- To investigate regional land-use patterns and determine the development changes in regional space.
- (2)
- To simulate the territorial spatial pattern of the PYL area in 2030 under multiple scenarios using the RF-Markov-FLUS model and predict the spatial change characteristics.
- (3)
- To construct an enhancement path for sustainable development of PLE space from the perspective of the goal-problem-principle.
2. Materials and Methods
2.1. Study Area
2.2. Data
3. Methodology
3.1. The Object-Based Image Analysis (OBIA) Method
3.2. The RF-Markov-FLUS Model
3.2.1. Selecting the Drivers of Land-Use Change
3.2.2. Quantity Forecast
3.2.3. Spatial Distribution Simulation
3.3. Landscape Pattern Index
3.4. Multi-Scenario Spatial Constraints and Parameter Settings
3.5. The Space Type Dynamic Degree
4. Results
4.1. Accuracy Verification
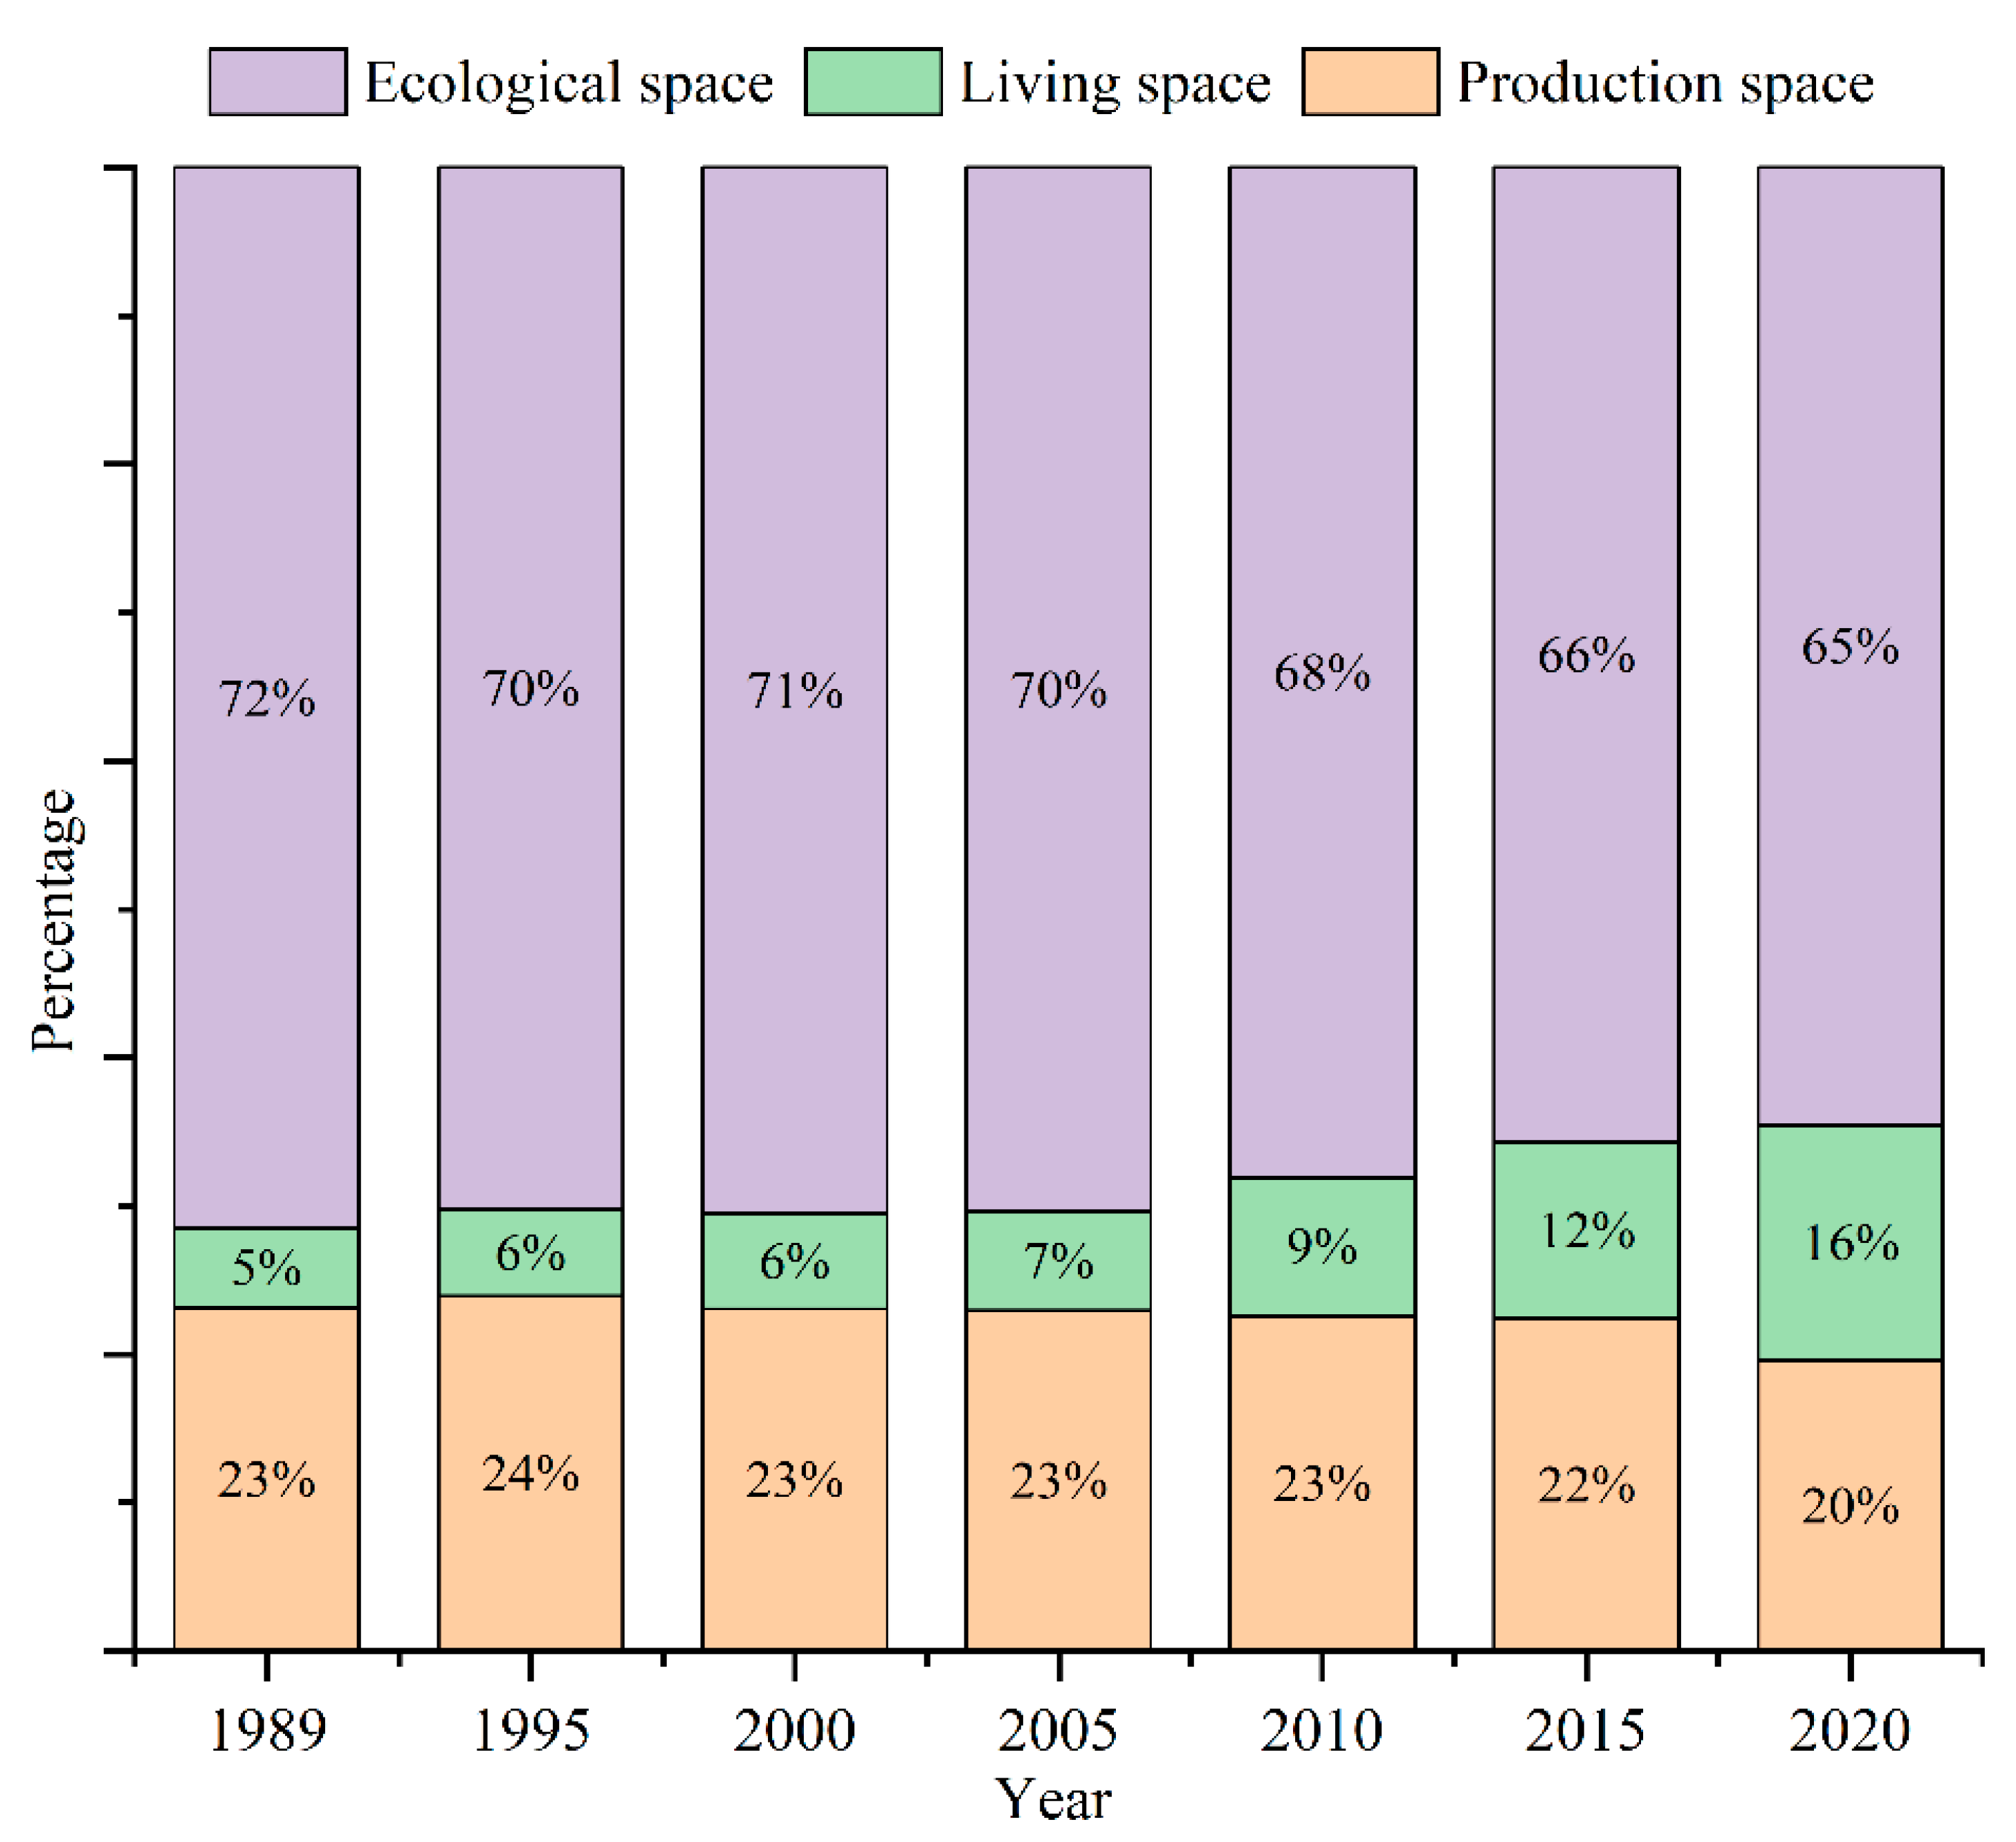
4.2. Analysis of the Evolution of PLE Space from 1989 to 2020
4.2.1. Analysis of Spatial and Temporal Changes
4.2.2. Transfer Matrix Analysis
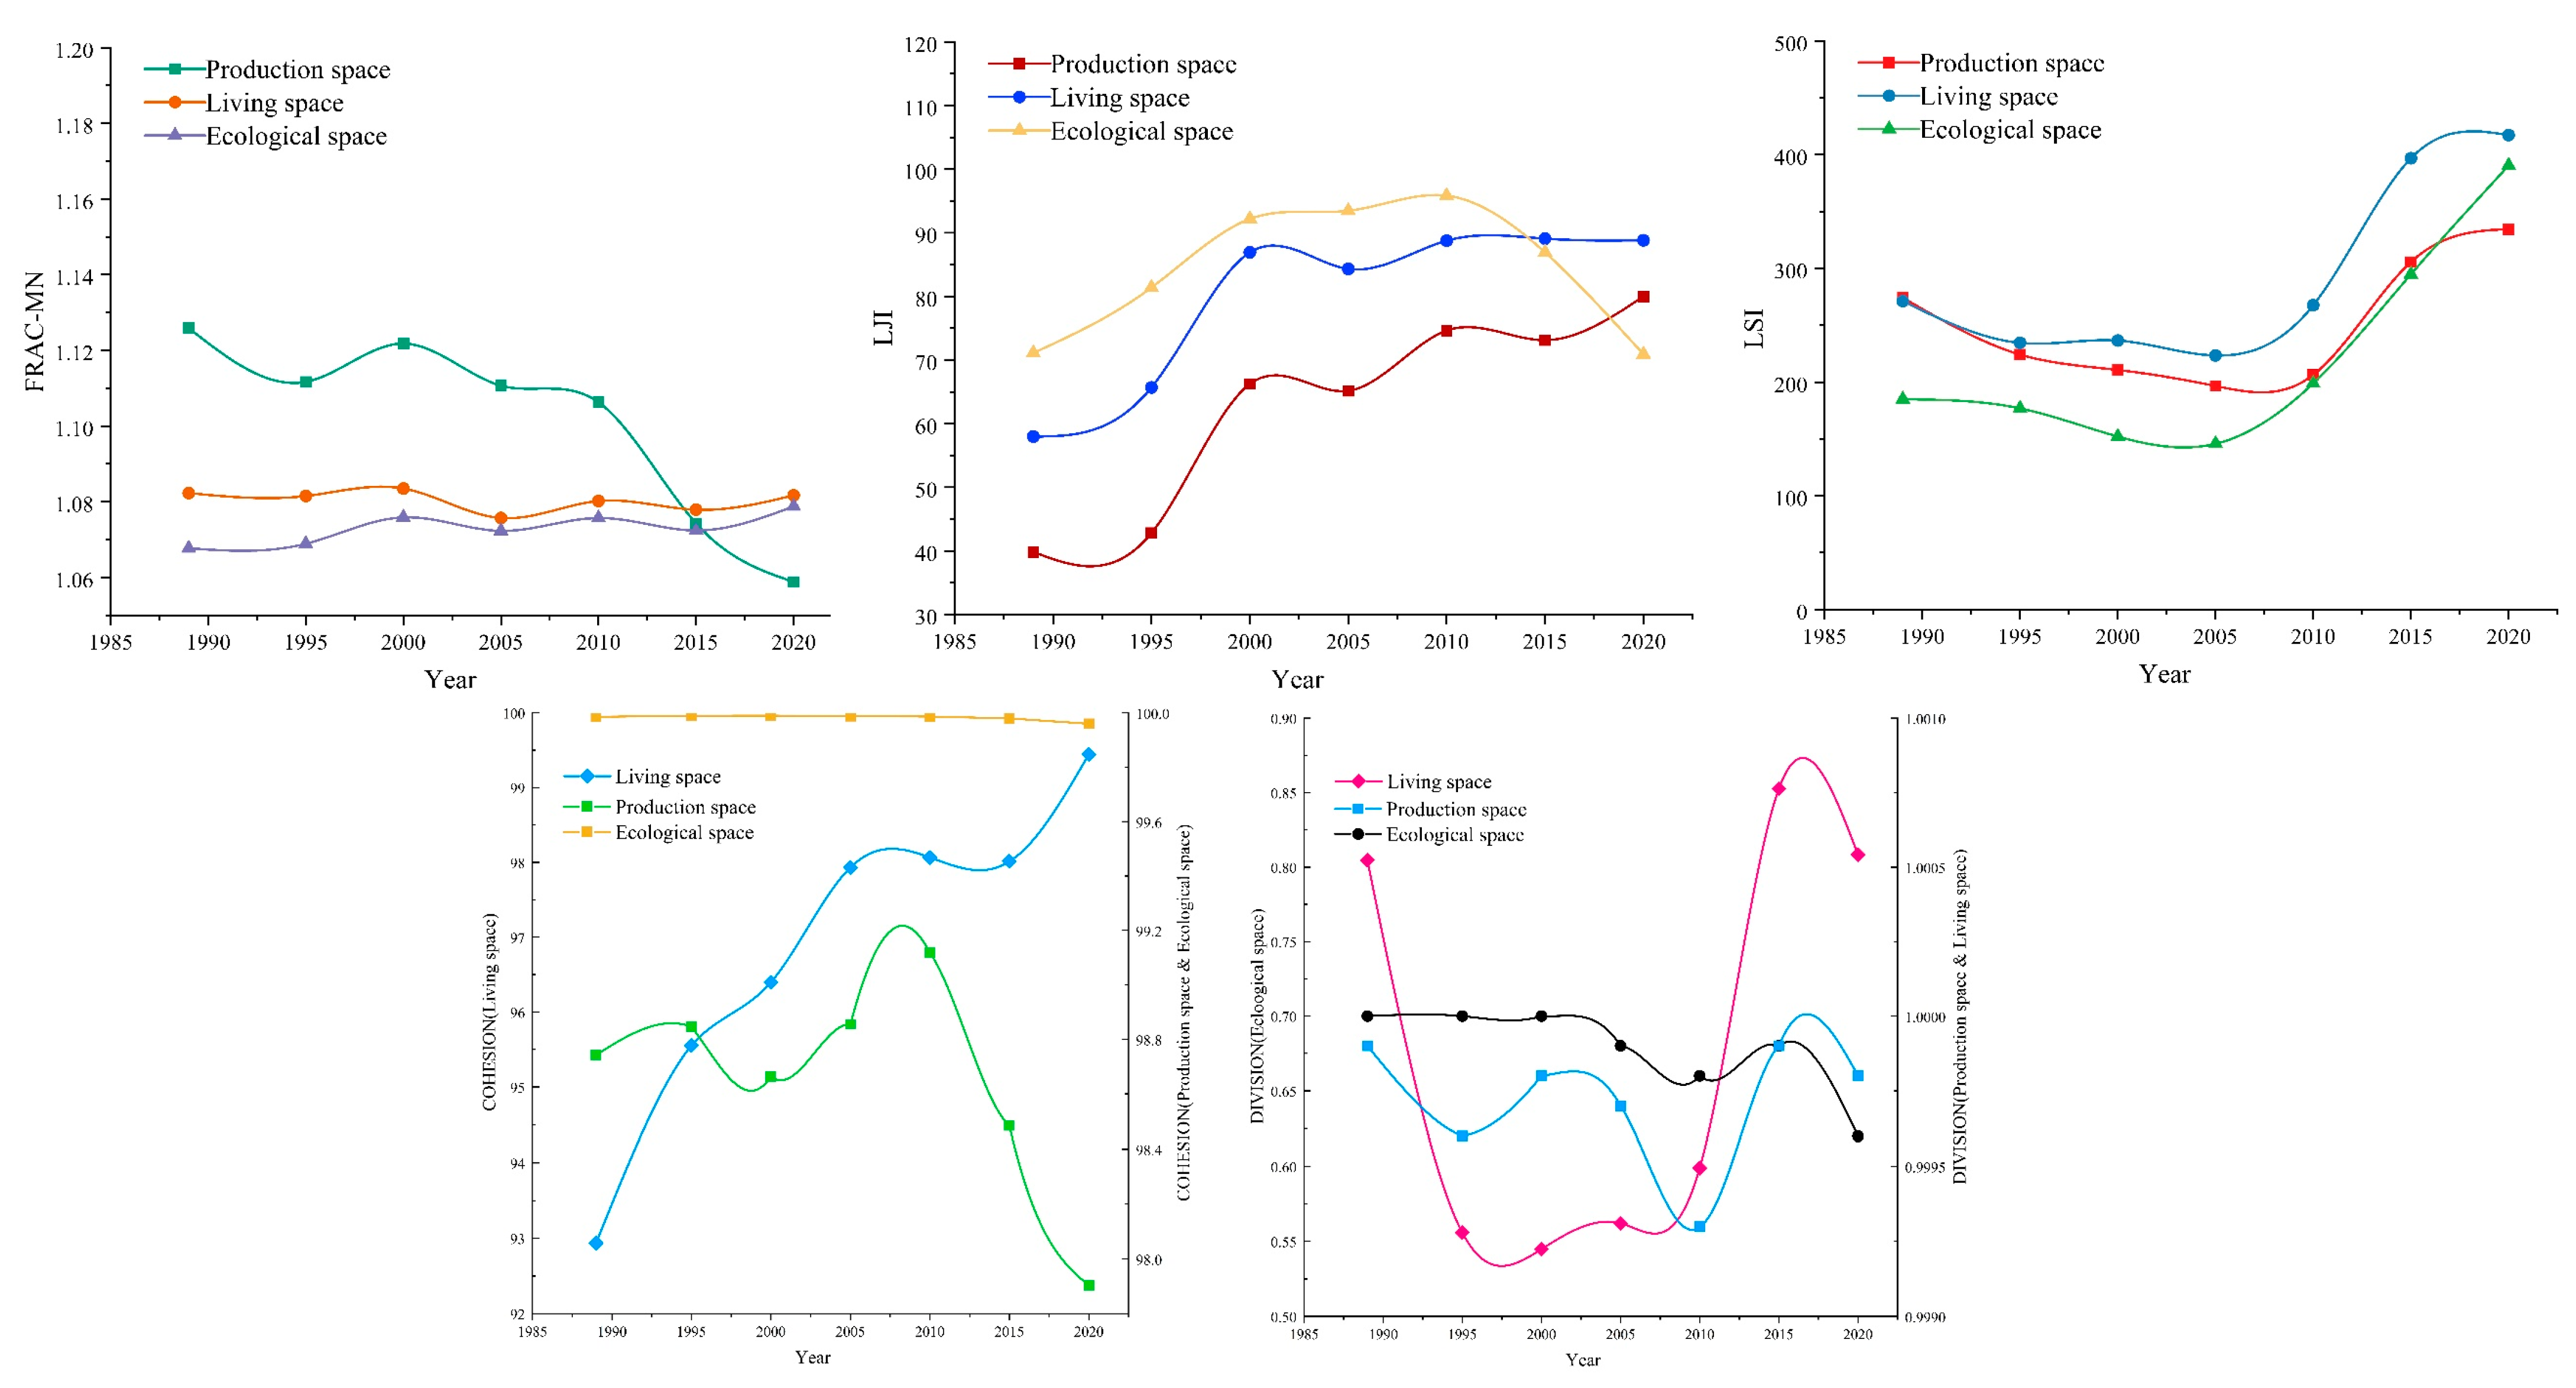
4.2.3. Landscape Pattern Analysis
- (a)
- The FRAC_MN index indicates the geometric complexity of each landscape type. During the study period, the production space and ecological space areas increased while the living space area decreased. This indicated that ecological and production spaces became more complex in shape, whereas living space expanded regularly from the center to the surroundings, with spatial continuity and unity. The landscape complexity decreased.
- (b)
- The IJI index reflects the overall dispersion and juxtaposition between specific landscape patch types. The production and living spaces exhibited more or less the same increase while ecological space increased and then decreased. Compared with the other two spaces, the IJI index for ecological space decreased from a maximum value in 1989 to a minimum value in 2020. Ecological space connectivity increased with the landscape patches of the other two spaces, indicating that the conservation of ecological space is easily constrained by the surrounding human activities.
- (c)
- The LSI index reflects the irregularity of landscape patches. During the study period, the production, living, and ecological space areas all increased, and for all of them, 2005 and 2010 were turning points for growth rate increases. The most significant change occurred in ecological space, which indicated that under the influence of human activities, the landscape regularity change was hindered, and fragmentation occurred.
- (d)
- The DIVISION index reflects the degree of separation of dominant landscape patches and patch integration. As Figure 7 shows, although the production and living space index values were higher, the changes were more stable compared to ecological space. Ecological space decreased and then increased, indicating that the dominant patches of ecological space decreased and were more dispersed from each other.
- (e)
- The COHESION index reflects the degree of aggregation and connectivity of each patch. The cohesion of patches decreased in production space and increased in living space, but ecological space remained stable, which indicated that the continuous expansion and protection of the landscape can improve connectivity. In general, the complexity, fragmentation, and dispersion of production and ecological space gradually increased, whereas the living space change was more steady, and the degree of connectivity and overall degree improved.
4.3. Multi-Scenario Simulation Results
5. Discussion
5.1. Discussion of the RF-Markov-FLUS Model
5.2. Comparison of Multi-Scenario Simulation Results
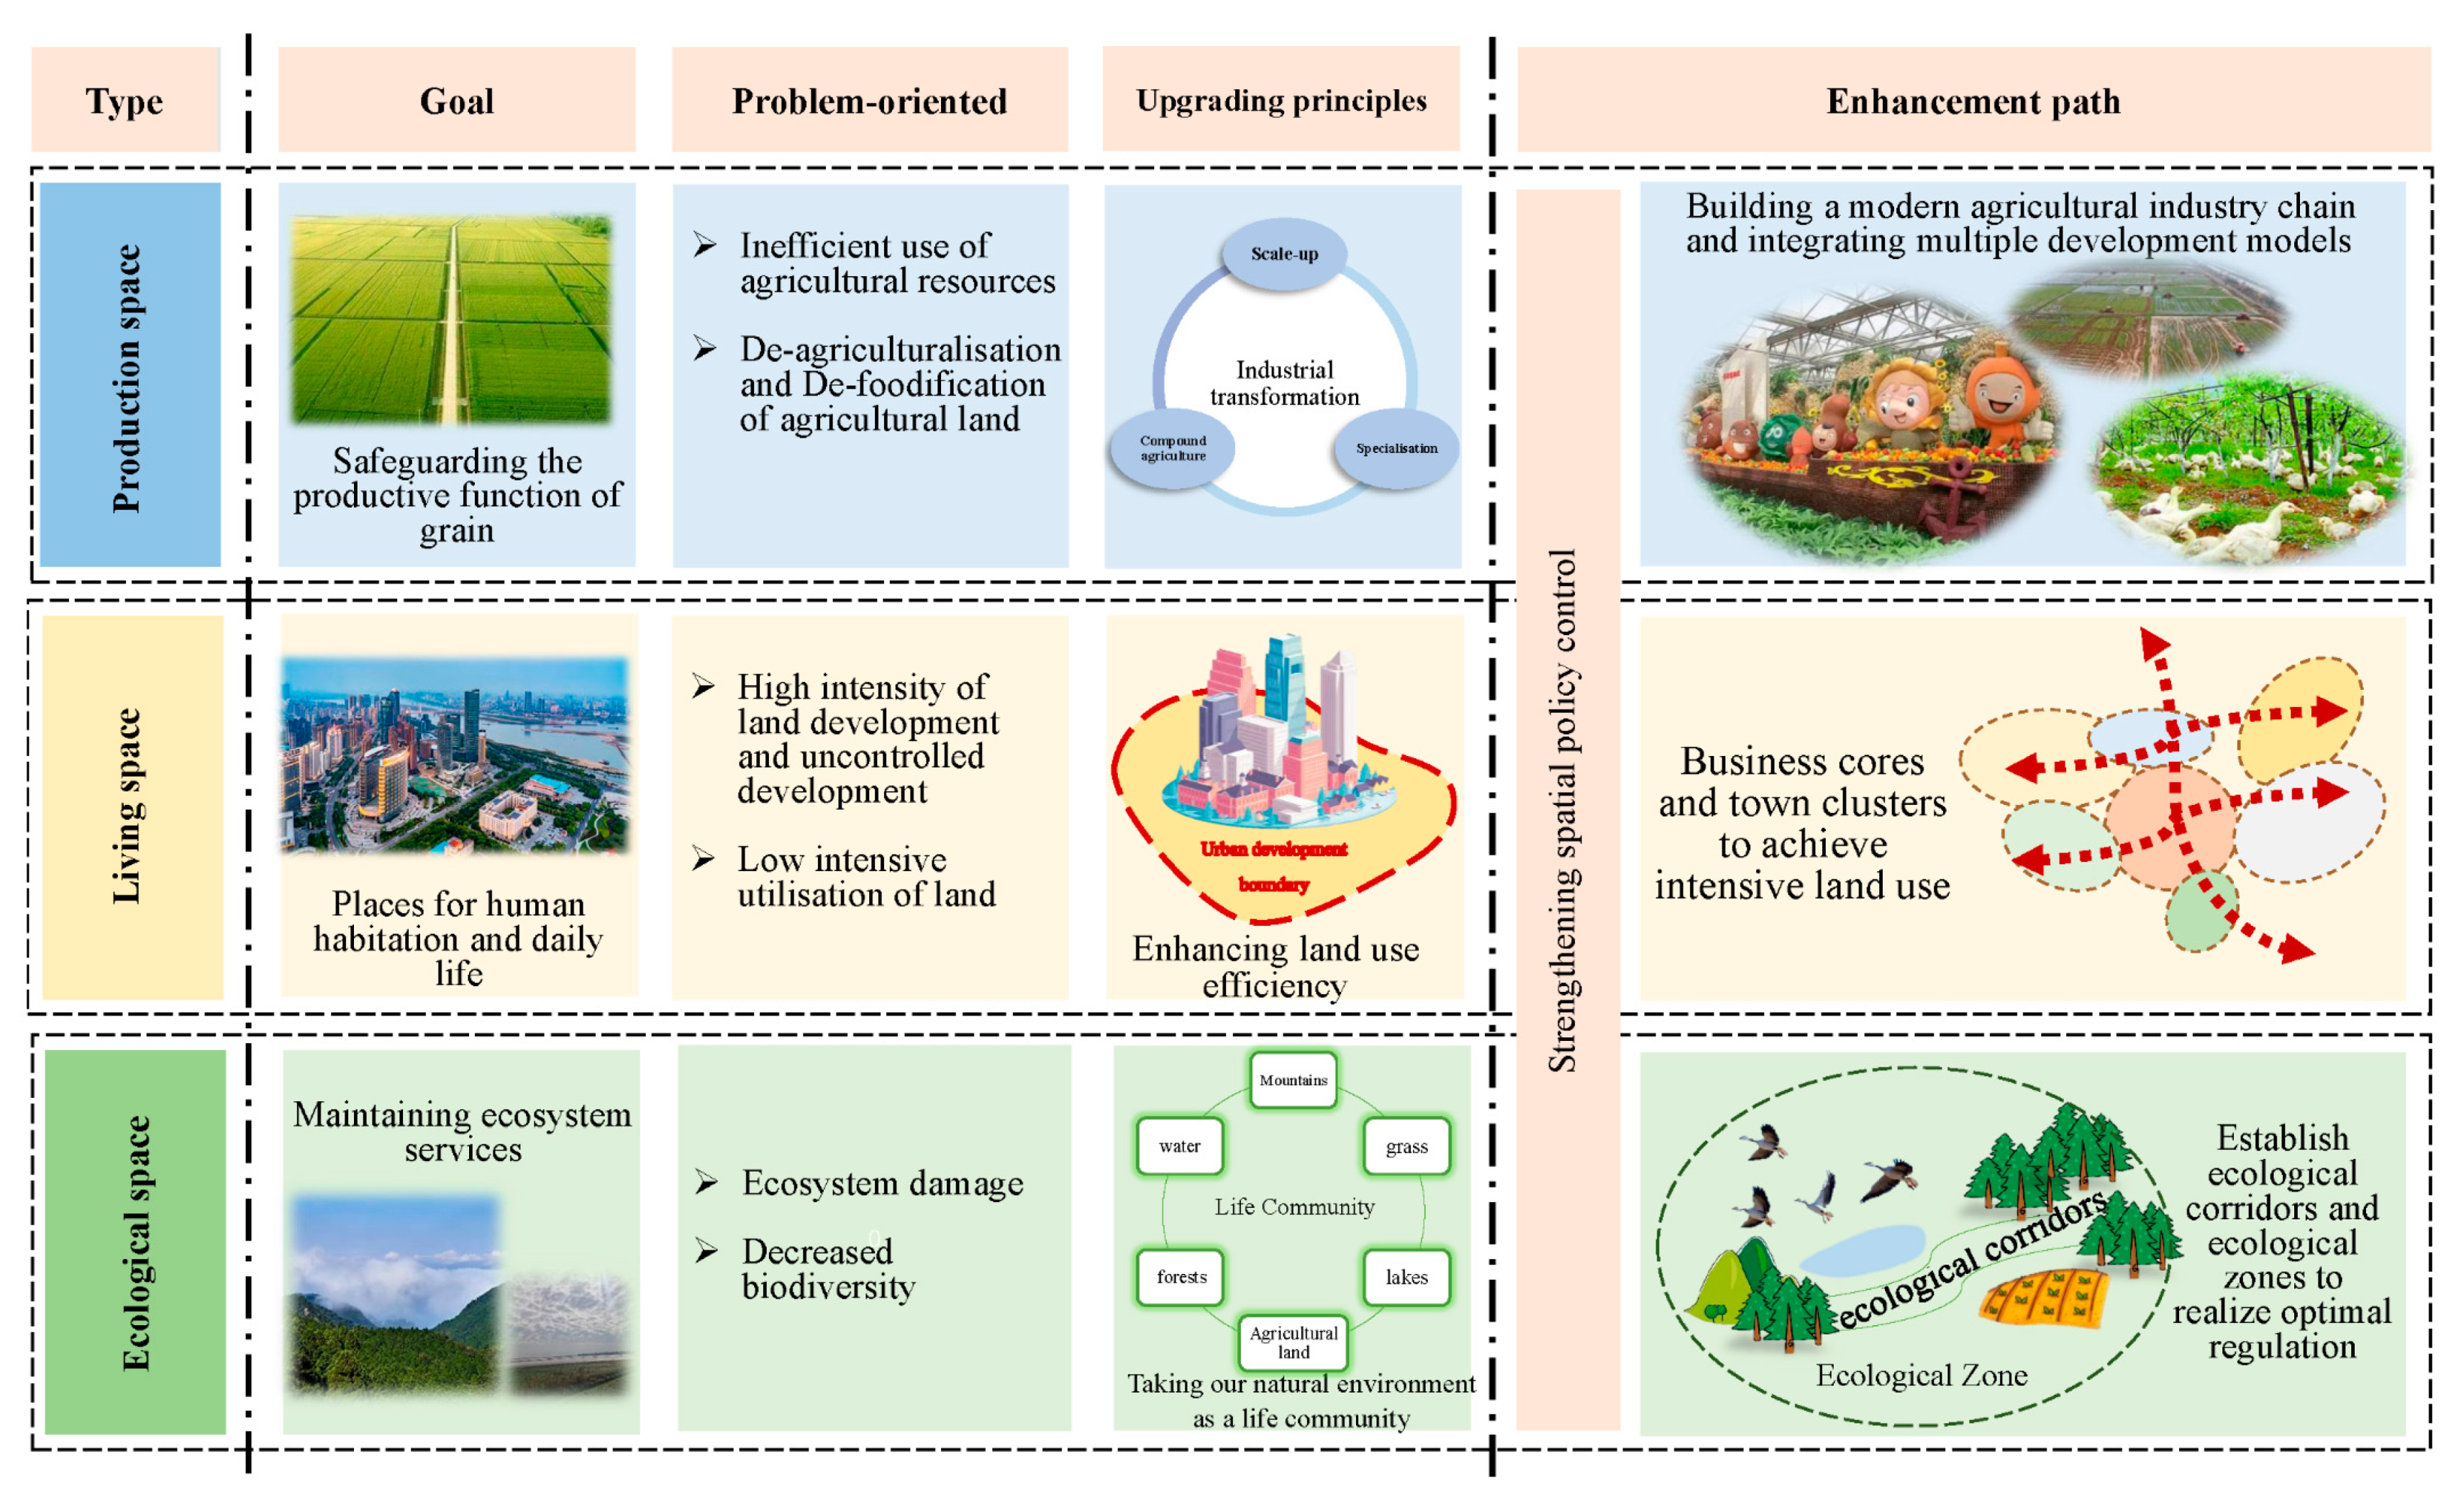
5.3. The Optimization of Territorial Space Pattern Enhancement
6. Conclusions
- (1)
- From 1989 to 2020, the production and ecological space areas in the study area both declined, by 717.9 and 1414.19 km2, respectively. Living space expanded from the center to the periphery with the fastest growth rate, with an area increase of 2144.72 km2, mainly dominated by the urban areas of Nanchang City and Jiujiang City, indicating the continuous expansion of urban living space.
- (2)
- Secondly, the PYL area experienced enhanced landscape fragmentation, landscape heterogeneity, landscape connectivity, and landscape dominance during the study period.
- (3)
- The overall accuracy of the RF-Markov-FLUS coupled model simulation was as high as 90.3%, and the Kappa coefficient of the model was 0.912. This showed it has strong applicability in the region and can predict the future spatial pattern of land use in all districts and counties in the PYL area.
- (4)
- According to the four scenario simulation results in 2030, production, living, and ecological spaces can be developed and protected to the greatest extent in the PSP, LSP, and ESP scenarios, respectively, but the ID scenario can more scientifically and reasonably lay out the spatial pattern of production, living, and ecology, realizing multiple functions of production, living, and ecology.
- (5)
- Based on the ID scenario and PYL area profile, we established a path framework to improve the territorial spatial function in three aspects: agricultural industry transformation, improved urban land use efficiency, and the creation of “mountain, water, forest, field, lake and grass” communities, which will help the government make more sustainable decisions in the PYL area.
Author Contributions
Funding
Data Availability Statement
Conflicts of Interest
References
- Zalles, V.; Hansen, M.C.; Potapov, P.V.; Parker, D.; Kommareddy, I. Rapid expansion of human impact on natural land in South America since 1985. Sci. Adv. 2021, 7, 1620. [Google Scholar] [CrossRef] [PubMed]
- Zhou, D.; Xu, J.; Lin, Z. Conflict or coordination? Assessing land use multi-functionalization using production-living-ecology analysis. Sci. Total Environ. 2016, 577, 136–147. [Google Scholar] [CrossRef] [PubMed]
- Yang, S.; Dou, S.; Li, C. Land-use conflict identification in urban fringe areas using the theory of leading functional space partition. Soc. Sci. J. 2020, 1–16. [Google Scholar] [CrossRef]
- Huang, X.; Wang, H.; Xiao, F. Simulating urban growth affected by national and regional land use policies: Case study from Wuhan, China. Land Use Policy 2022, 112, 105850. [Google Scholar] [CrossRef]
- Chen, X.; Li, F.; Li, X.; Hu, Y.; Wang, Y. Mapping ecological space quality changes for ecological management: A case study in the Pearl River Delta urban agglomeration, China. J. Environ. Manag. 2020, 267, 110658. [Google Scholar] [CrossRef]
- Lovell, S.T.; Desantis, S.; Nathan, C.A.; Olson, M.B.; Méndez, V.E.; Kominami, H.C.; Erickson, D.L.; Morris, K.S.; Morris, W.B. Integrating agroecology and landscape multifunctionality in Vermont: An evolving framework to evaluate the design of agroecosystems. Agr. Syst. 2010, 103, 327–341. [Google Scholar] [CrossRef]
- Theobald, D.M.; Spies, T.; Kline, J.; Maxwell, B.; Dale, H.V.H. Ecological support for rural land-use planning. Ecol. Appl. 2005, 15, 1906–1914. [Google Scholar] [CrossRef]
- Kong, L.; Xu, X.; Wang, W.; Wu, J.; Zhang, M. Comprehensive evaluation and quantitative research on the living protection of traditional villages from the perspective of “Production–Living–Ecology”. Land 2021, 10, 570. [Google Scholar] [CrossRef]
- Wiggering, H.; Müller, K.; Werner, A.; Helming, K. The concept of multifunctionality in sustainable land development. In Sustainable Development of Multifunctional Landscape; Springer: Berlin/Heidelberg, Germany, 2003; pp. 3–18. [Google Scholar] [CrossRef]
- Global Environment Outlook 6|UNEP—UN Environment Programme. Available online: https://www.unep.org/resources/global-environment-outlook-6 (accessed on 27 March 2022).
- Wiggering, H.; Dalchow, C.; Glemnitz, M.; Helming, K.; Muller, K.; Schultz, A.; Stachow, U.; Zander, P. Indicators for multifunctional land use—Linking socio-economic requirements with landscape potentials. Ecol. Indic. 2006, 6, 238–249. [Google Scholar] [CrossRef]
- Li, J.; Sun, W.; Li, M.; Meng, L. Coupling coordination degree of production, living and ecological spaces and its influencing factors in the Yellow River Basin. J. Clean. Prod. 2021, 298, 126803. [Google Scholar] [CrossRef]
- People’s Republic of China Land Management Law Implementation Regulations (State Decree No. 743). Available online: http://www.gov.cn/zhengce/content/2021-07/30/content_5628461.htm (accessed on 5 March 2022).
- Paracchini, M.L.; Pacini, C.; Jones ML, M.; Pérez-Soba, M. An aggregation framework to link indicators associated with multifunctional land use to the stakeholder evaluation of policy options. Ecol. Indic. 2011, 11, 71–80. [Google Scholar] [CrossRef]
- Zong, W.; Cheng, L.; Xia, N.; Jiang, P.; Li, M. New technical framework for assessing the spatial pattern of land development in Yunnan Province, China: A “production-life-ecology” perspective. Habitat. Int. 2018, 80, 28–40. [Google Scholar] [CrossRef]
- Fan, Y.; Jin, X.; Gan, L.; Jessup, L.H.; Pijanowski, B.C.; Yang, X.; Xiang, X.; Zhou, Y. Spatial identification and dynamic analysis of land use functions reveals distinct zones of multiple functions in eastern China. Sci. Total Environ. 2018, 642, 33–44. [Google Scholar] [CrossRef] [PubMed]
- Abdullahi, S.; Pradhan, B.; Mansor, S.; Shariff, A.R.M. GIS-based modeling for the spatial measurement and evaluation of mixed land use development for a compact city. Mapp. Sci. Remote Sens. 2015, 52, 18–39. [Google Scholar] [CrossRef]
- Gong, J.; Liu, D.; Zhang, J.; Xie, Y.; Cao, E.; Li, H. Tradeoffs/synergies of multiple ecosystem services based on land use simulation in a mountain-basin area, western China. Ecol. Indic. 2019, 99, 283–293. [Google Scholar] [CrossRef]
- Manaugh, K.; Kreider, T. What is mixed use? Presenting an interaction method for measuring land use mix. J. Transp. Land Use 2013, 6, 63–72. [Google Scholar] [CrossRef]
- Yu, Z.; Xu, E.; Zhang, H.; Shang, E. Spatio-temporal coordination and conflict of production-living-ecology land functions in the Beijing-Tianjin-Hebei Region, China. Land 2020, 9, 170. [Google Scholar] [CrossRef]
- Zhang, Y.; Long, H.; Tu, S.; Ge, D.; Ma, L.; Wang, L. Spatial identification of land use functions and their tradeoffs/synergies in China: Implications for sustainable land management. Ecol. Indic. 2019, 107, 105550–105551. [Google Scholar] [CrossRef]
- Wang, H. Regional assessment of human-caused ecological risk in the Poyang Lake Eco-economic Zone using production–living–ecology analysis. PLoS ONE 2021, 16, e0246749. [Google Scholar] [CrossRef]
- Holmes, J. Impulses towards a multifunctional transition in rural Australia: Gaps in the research agenda. J. Rural Stud. 2006, 22, 142–160. [Google Scholar] [CrossRef]
- Liu, L.; Chen, H.; Liu, T. Study on urban spatial function mixture and individual activity space from the perspectives of resident activity. IEEE Access 2020, 8, 184137–184150. [Google Scholar] [CrossRef]
- Arsanjani, J.J.; Helbich, M.; Kainz, W.; Boloorani, A.D.R. Integration of logistic regression, Markov chain and cellular automata models to simulate urban expansion. Int. J. Appl. Earth Obs. Geoinf. 2013, 21, 265–275. [Google Scholar] [CrossRef]
- Halmy, M. Land use/land cover change detection and prediction in the north-western coastal desert of Egypt using Markov-CA. Appl. Geogr. 2015, 63, 101–112. [Google Scholar] [CrossRef]
- Mamanis, G.; Vrahnakis, M.; Chouvardas, D.; Nasiakou, S.; Kleftoyanni, V. Land Use Demands for the CLUE-S Spatiotemporal Model in an Agroforestry Perspective. Land 2021, 10, 1097. [Google Scholar] [CrossRef]
- Verburg, P.H.; Soepboer, W.; Veldkamp, A. Modeling the spatial dynamics of regional land use: The CLUE-S model. Environ. Manag. 2002, 30, 391. [Google Scholar] [CrossRef]
- Mitsova, D.; Shuster, W.; Wang, X. A cellular automata model of land cover change to integrate urban growth with open space conservation. Landsc. Urban. Plan. 2011, 99, 141–153. [Google Scholar] [CrossRef]
- Wang, H.J.; He, S.W.; Liu, X.J.; Dai, L.; Pan, P.; Hong, S.; Zhang, W.T. Simulating urban expansion using a cloud-based cellular automata model: A case study of Jiangxia, Wuhan, China. Landsc. Urban. Plan. 2013, 110, 99–112. [Google Scholar] [CrossRef]
- Hui, Y.; Cynthia, V.; Siamak, K. An Automated artificial neural network system for land use/land cover classification from landsat TM imagery. Remote Sens. 2009, 1, 243–265. [Google Scholar] [CrossRef] [Green Version]
- Zhou, D.; Lin, Z.; Liu, L. Regional land salinization assessment and simulation through cellular automaton-Markov modeling and spatial pattern analysis. Sci. Total Environ. 2012, 439, 260–274. [Google Scholar] [CrossRef]
- Sang, L.; Zhang, C.; Yang, J.; Zhu, D.; Yun, W. Simulation of land use spatial pattern of towns and villages based on CA–Markov model. Math. Comput. Model. 2011, 54, 938–943. [Google Scholar] [CrossRef]
- Yang, J.; Guo, A.; Li, Y.; Zhang, Y.; Li, X. Simulation of landscape spatial layout evolution in rural-urban fringe areas: A case study of Ganjingzi District. Gisci. Remote Sens. 2019, 56, 388–405. [Google Scholar] [CrossRef]
- He, X.; Mai, X.; Shen, G. Delineation of urban growth boundaries with SD and CLUE-s models under multi-scenarios in chengdu metropolitan area. Sustainability 2019, 11, 5919. [Google Scholar] [CrossRef] [Green Version]
- Liu, X.; Xun, L.; Xia, L.; Xu, X.; Wang, S. A future land use simulation model (FLUS) for simulating multiple land use scenarios by coupling human and natural effects. Landsc. Urban Plan. 2017, 168, 94–116. [Google Scholar] [CrossRef]
- Liang, X.; Liu, X.; Li, X.; Chen, Y.; Tian, H.; Yao, Y. Delineating multi-scenario urban growth boundaries with a CA-based FLUS model and morphological method. Landsc. Urban Plan. 2018, 177, 47–63. [Google Scholar] [CrossRef]
- Liang, X.; Liu, X.; Li, D.; Zhao, H.; Chen, G. Urban growth simulation by incorporating planning policies into a CA-based future land-use simulation model. Int. J. Geogr. Inf. Sci. 2018, 32, 2294–2316. [Google Scholar] [CrossRef]
- Hga, B.; Ycab, C.; Zya, B.; Zza, B.; Yoa, B. Dynamic simulation of coastal wetlands for Guangdong-Hong Kong-Macao Greater Bay area based on multi-temporal Landsat images and FLUS model. Ecol. Indic. 2021, 125, 107559. [Google Scholar] [CrossRef]
- Lao, J.; Wang, C.; Wang, J.; Pan, F.; Liang, L. Land use simulation of Guangzhou based on nighttime light data and planning policies. Remote Sens. 2020, 12, 1675. [Google Scholar] [CrossRef]
- Ding, Q.; Chen, Y.; Bu, L.; Ye, Y. Multi-Scenario Analysis of Habitat Quality in the Yellow River Delta by Coupling FLUS with InVEST Model. Int. J. Environ. Res. Public Health 2021, 18, 2389. [Google Scholar] [CrossRef]
- Hu, S.; Chen, L.; Li, L.; Zhang, T.; Wen, M. Simulation of land use change and ecosystem service value dynamics under ecological constraints in Anhui Province, China. Int. J. Environ. Res. Public Health 2020, 17, 4228. [Google Scholar] [CrossRef]
- Feng, D.; Bao, W.; Fu, M.; Zhang, M.; Sun, Y. Current and future land use characters of a national central city in eco-fragile region—A case study in Xi’an City Based on FLUS Model. Land 2021, 10, 286. [Google Scholar] [CrossRef]
- Wang, X.; Che, L.; Zhou, L.; Jiangang, X.U. Spatio-temporal dynamic simulation of land use and ecological risk in the Yangtze River Delta Urban Agglomeration, China. Chin. Geogr. Sci. Engl. Ed. 2021, 31, 19. [Google Scholar] [CrossRef]
- Sun, D.L.; Shi, S.X.; Wen, H.J.; Xu, J.H.; Zhou, X.Z.; Wu, J.P. A hybrid optimization method of factor screening predicated on GeoDetector and Random Forest for Landslide Susceptibility Mapping. Geomorphology 2021, 379, 107623. [Google Scholar] [CrossRef]
- Dai, L.; Liu, Y.; Luo, X. Integrating the MCR and DOI models to construct an ecological security network for the urban agglomeration around Poyang Lake, China. Sci. Total Environ. 2020, 754, 141868. [Google Scholar] [CrossRef]
- Xia, Y.; Fang, C.; Lin, H.; Li, H.; Wu, B. Spatiotemporal Evolution of Wetland Eco-Hydrological Connectivity in the Poyang Lake Area Based on Long Time-Series Remote Sensing Images. Remote Sens. 2021, 13, 4812. [Google Scholar] [CrossRef]
- Xie, H.; He, Y.; Choi, Y.; Chen, Q.; Cheng, H. Warning of negative effects of land-use changes on ecological security based on GIS. Sci. Total Environ. 2019, 704, 135427. [Google Scholar] [CrossRef] [PubMed]
- He, M.F.; Bu, F.X.; Delang, C.O.; Xie, J.L.; Ye, Q.; Zhao, H.F.; He, Q.L.; He, W.M. Historical environmental changes in the Poyang Lake basin (Yangtze River, China) and impacts on agricultural activities. Holocene 2022, 32, 17–28. [Google Scholar] [CrossRef]
- Zhu, Z.; Huai, W.; Yang, Z.; Li, D.; Wang, Y. Assessing habitat suitability and habitat fragmentation for endangered Siberian cranes in Poyang Lake region, China. Ecol. Indic. 2021, 125, 107594. [Google Scholar] [CrossRef]
- Public Announcement of Jiangxi Provincial People’s Government on “Poyang Lake Ecological City Cluster Planning (2015–2030)” and “Nanchang Metropolitan Area Planning (2015–2030)”. Available online: http://www.jiangxi.gov.cn/art/2016/8/10/art_5141_266068.html (accessed on 6 March 2022).
- EarthExplorer. Available online: https://earthexplorer.usgs.gov/ (accessed on 10 March 2022).
- Blaschke, T.; Hay, G.J.; Kelly, M.; Lang, S.; Hofmann, P.; Addink, E.; Queiroz, F.R.; Van, D.; Van, D.; Van, C.F. Geographic Object-Based Image Analysis—Towards a new paradigm. ISPRS J. Photogramm. Remote Sens. Off. Publ. Int. Soc. Photogramm. Remote Sens. (ISPRS) 2014, 87, 180. [Google Scholar] [CrossRef] [Green Version]
- Tian, F.; Fensholt, R.; Verbesselt, J.; Grogan, K.; Horion, S.; Wang, Y.J. Evaluating temporal consistency of long-term global NDVI datasets for trend analysis. Remote Sens. Environ. 2015, 163, 326–340. [Google Scholar] [CrossRef]
- Bhatti, S.S.; Tripathi, N.K. Built-up area extraction using Landsat 8 OLI imagery. Gisci. Remote Sens. 2014, 51, 445–467. [Google Scholar] [CrossRef] [Green Version]
- Rokni, K.; Ahmad, A.; Selamat, A.; Hazini, S. Water Feature extraction and change detection using multitemporal landsat imagery. Remote Sens. 2014, 6, 4173–4189. [Google Scholar] [CrossRef] [Green Version]
- Gromping, U. Variable importance assessment in regression: Linear regression versus random forest. Am. Stat. 2009, 63, 308–319. [Google Scholar] [CrossRef]
- Turner, M.G. Landscape ecology in north america: Past, present, and future. Ecology 2005, 86, 1967–1974. [Google Scholar] [CrossRef] [Green Version]
- He, H.S.; DeZonia, B.E.; Mladenoff, D.J. An aggregation index (AI) to quantify spatial patterns of landscapes. Landsc. Ecol. 2000, 15, 591–601. [Google Scholar] [CrossRef]
- Zhang, D.; Wang, X.R.; Qu, L.P.; Li, S.C.; Lin, Y.P.; Yao, R.; Zhou, X.; Li, J.Y. Land use/cover predictions incorporating ecological security for the Yangtze River Delta region, China. Ecol. Indic. 2020, 119, 106841. [Google Scholar] [CrossRef]
- Chen, Q.; Mao, Y.; Morrison, A.M. The Influence of Land Use Evolution on the Visitor Economy in Wuhan from the Perspective of Ecological Service Value. Land 2021, 11, 1. [Google Scholar] [CrossRef]
- Wang, Y.; Li, S. Simulating multiple class urban land-use/cover changes by RBFN-based CA model. Comput. Geosci. 2011, 37, 111–121. [Google Scholar] [CrossRef]
- Khwarahm, N.R.; Najmaddin, P.M.; Ararat, K.; Qader, S. Past and future prediction of land cover land use change based on earth observation data by the CA–Markov model: A case study from Duhok governorate, Iraq. Arab. J. Geosci. 2021, 14, 1544. [Google Scholar] [CrossRef]
- Chen, W.; Zhao, H.; Li, J.; Zhu, L.; Wang, Z.; Zeng, J. Land use transitions and the associated impacts on ecosystem services in the Middle Reaches of the Yangtze River Economic Belt in China based on the geo-informatic Tupu method. Sci. Total Environ. 2020, 701, 134690–134691. [Google Scholar] [CrossRef]
- Xu, C.; Yang, G.; Wan, R.; Ou, W.; Wang, P. Toward ecological function zoning and comparison to the Ecological Redline Policy: A case study in the Poyang Lake Region, China. Environ. Sci. Pollut. Res. 2021, 28, 40178–40191. [Google Scholar] [CrossRef]
- Xia, H.J.; Liu, L.S.; Bai, J.H.; Kong, W.J.; Lin, K.X.; Guo, F. Wetland Ecosystem service dynamics in the yellow river estuary under natural and anthropogenic stress in the past 35 years. Wetlands 2020, 40, 2741–2754. [Google Scholar] [CrossRef]
- Feng, J.; Zhao, Z.; Wen, Y.; Hou, Y. Organically Linking Green Development and Ecological Environment Protection in Poyang Lake, China Using a Social-Ecological System (SES) Framework. Int. J. Environ. Res. Public Health 2021, 18, 2572. [Google Scholar] [CrossRef] [PubMed]
- Gao, J.H.; Jia, J.; Kettner, A.J.; Xing, F.; Wang, Y.P.; Xu, X.N.; Yang, Y.; Zou, X.Q.; Gao, S.; Qi, S. Changes in water and sediment exchange between the Changjiang River and Poyang Lake under natural and anthropogenic conditions, China. Sci. Total Environ. 2014, 481, 542–553. [Google Scholar] [CrossRef] [PubMed]
- Sun, Q.; Tang, F.H.; Tang, Y. An economic tie network-structure analysis of urban agglomeration in the middle reaches of Changjiang River based on SNA. J. Geogr. Sci. 2015, 25, 739–755. [Google Scholar] [CrossRef] [Green Version]


| Type | Properties | Time | Data Type | Data Source |
|---|---|---|---|---|
| Land Use Data | Remote Sensing Images | 1989, 1995, 2000, 2005, 2010, 2015, 2020 | Raster (15 m/30 m) | USGS (https://earthexplorer.usgs.gov/) (accessed on 10 September 2021) |
| Natural factors | Elevation | 2010, 2015, 2020 | Raster (30 m) | Resource and Environment Sciences and Data Center (https://www.resdc.cn/) (accessed on 30 September 2021) |
| Slope | ||||
| Slope orientation | ||||
| Precipitation | WorldClim-Global Climate Data (http://www.worldclim.org/) (accessed on 30 September 2021) Local weather bureau and weather bulletin | |||
| Average annual temperature | ||||
| Socio-economic factors | Population density | 2010, 2015, 2020 | Raster (1 km) | Nanchang, Jiujiang, Shangrao City Statistical Yearbook |
| GDP per capita | ||||
| POI kernel density (airports, bus stations, buildings, schools, hotels, supermarkets, banks, etc.) | 2010, 2015–2021 | Vector | Baidu Map Open Platform (https://lbsyun.baidu.com/) (accessed on 20 October 2021) | |
| Accessibility factors | Distance from city roads | 2010–2020 | Vector | OpenstreetMap Website (https://openstreetmap.org/) (accessed on 15 October 2021) National Catalogue Service For Geographic Information (http://www.webmap.cn) (accessed on 15 October 2021) |
| Distance to railroad | ||||
| Distance to the water system | ||||
| Distance to urban center | ||||
| Distance to rural settlements | ||||
| Limiting factors | Permanent basic cropland protection red line | 2017 | Vector | Jiangxi Provincial Natural Resources Bureau |
| Urban development boundary | 2019 | |||
| Ecological protection red line | 2018 |
| Category I | Category II | Description |
|---|---|---|
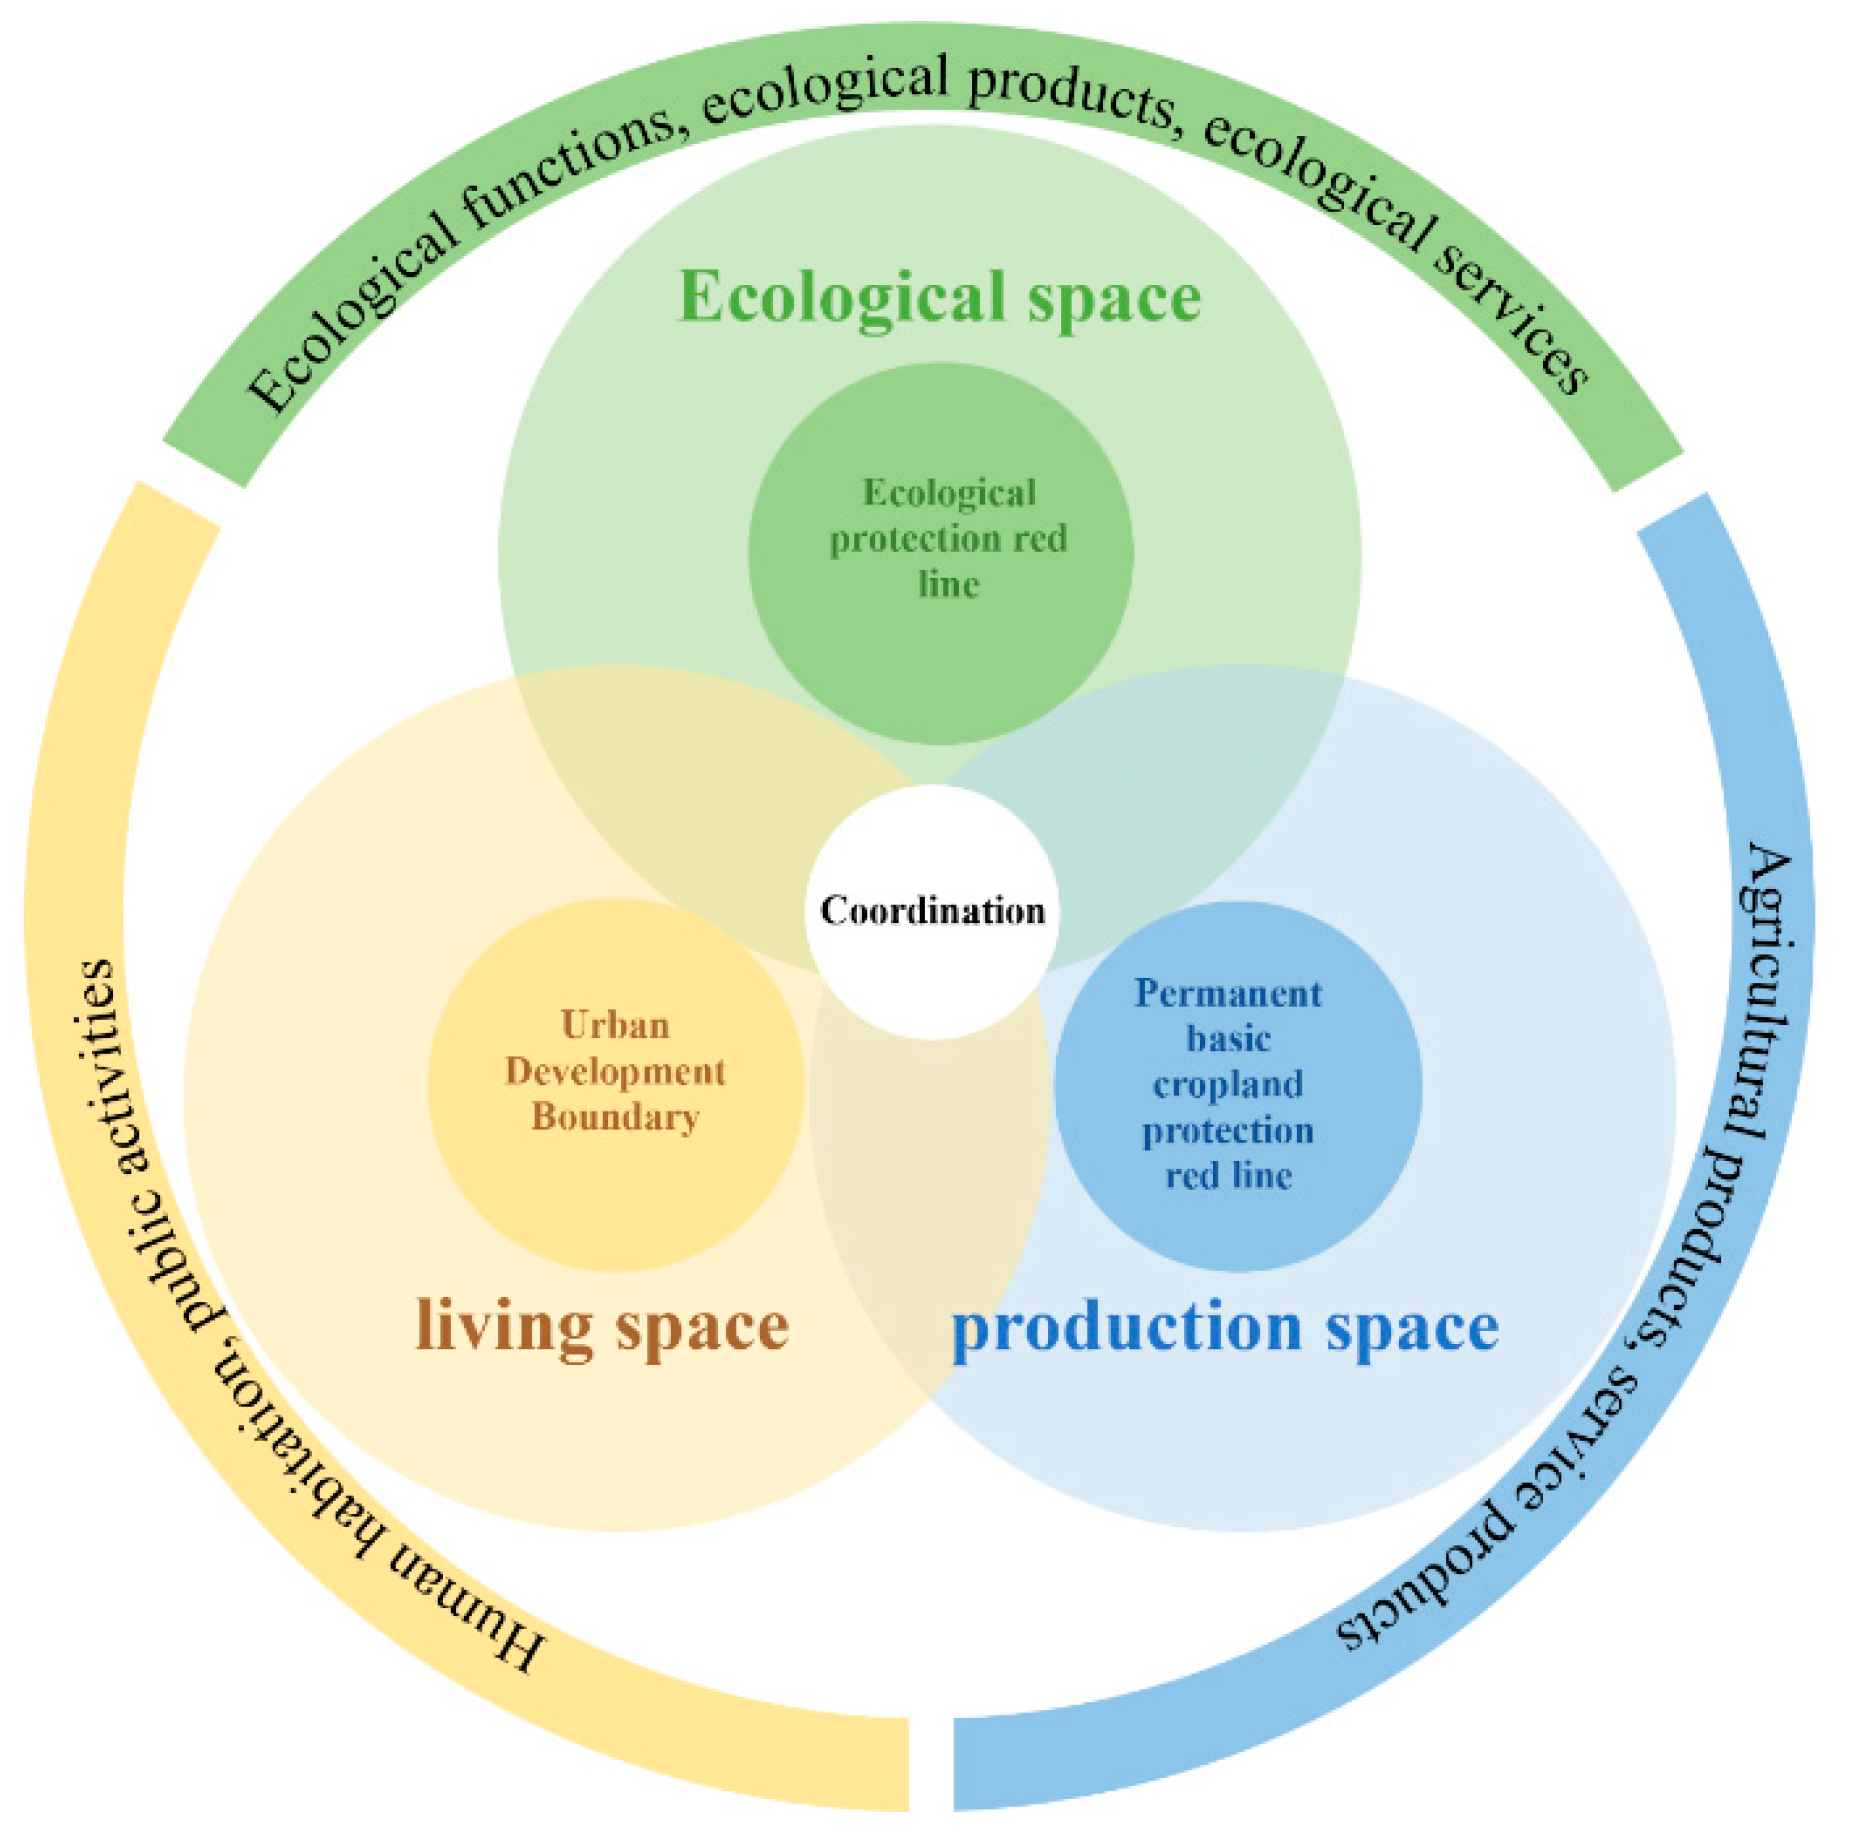
| Production space | Cropland | Land where crops are grown, including paddy fields, irrigated land, and dry land, which are important for agricultural production and function. |
| Living space | Construction land | Land mainly used for housing and ancillary facilities, including urban and rural residential land, and land for supporting commercial services and other facilities. |
| Ecological space | Water | Areas such as inland water bodies, mudflats, ditches, and marshes. Wetlands have water conservation and purification functions and are important ecological lands. |
| Forest | Land where trees, bamboos, and shrubs grow. Forests play important roles in ecosystem regulation and biodiversity, and are important ecological lands. | |
| Grassland | Land where herbaceous plants mainly grow, including natural pasture, marsh grassland, artificial pasture, and other grasslands. Grasslands have functions such as ecological landscape and water connotation and are important ecological lands. | |
| Unused land | Land types other than those mentioned above, including saline land, sandy land, bare land, and other unused land, all of which are natural land cover types and are important ecological lands. |
| Metrics | Index | Ecological Significance |
|---|---|---|
| Class/Landscape | FRAC_MN | Reflects the complexity of the shape in the range of spatial scales. The larger the value, the more convoluted the shape is from the regular geometry. |
| IJI | IJI converges to zero when the distribution of nodes of a particular patch type in the landscape becomes uneven. | |
| LSI | As the landscape shape becomes irregular and the edges lengthen, LSI increases and has no maximum limit. | |
| DIVISION | The value approaches 1 when the area weight and patch size of that patch type in the landscape decreases. | |
| COHESION | When the connectivity of a patch type in the landscape decreases, the value approaches 0. As the proportion of that type of patch composition in the landscape increases, the value increases. | |
| Landscape | CONTAG | Reflects the degree of fragmentation of landscape patches, and the value approaches 0 when all patch types are maximally fragmented and randomly distributed. |
| SHDI | Reflects landscape heterogeneity, and higher values reflect more diverse land use and higher fragmentation. | |
| SHEI | Reflects the degree of uniformity in the distribution of different ecosystems in the landscape, and values close to 1 indicate more uniformity. | |
| SPLIT | Reflects the degree of dispersion of landscape patches, and a maximum value occurs when the whole landscape is maximally refined. |
| Production Space | Living Space | Ecological Space | ||||
|---|---|---|---|---|---|---|
| Year | Cropland Area | Construction Land | Water | Forest | Grassland | Unused Land |
| 1989 | 4695.60 | 1080.98 | 4905.83 | 4884.20 | 3839.61 | 902.39 |
| 1995 | 4856.34 | 1181.21 | 4183.11 | 5005.16 | 4197.74 | 898.07 |
| 2000 | 4679.42 | 1303.56 | 4311.90 | 4823.64 | 4047.56 | 1155.96 |
| 2005 | 4655.59 | 1366.57 | 4639.13 | 4780.30 | 3915.82 | 966.79 |
| 2010 | 4591.02 | 1893.56 | 4712.12 | 4499.16 | 3368.24 | 1260.10 |
| 2015 | 4547.87 | 2420.23 | 3750.40 | 4471.04 | 3760.14 | 1379.22 |
| 2020 | 3977.70 | 3225.70 | 4978.33 | 4407.06 | 2876.11 | 856.33 |
| Area of change for each space | −717.9 | 2144.72 | −1414.19 | |||
| dynamic degree (%) | −0.58 | 2.14 | −0.35 | |||
| 1989/2020 | Production Space | Living Space | Ecological Space | Total Transfers Out |
|---|---|---|---|---|
| Production space | 2413.36 | 996.05 | 1446.29 | 2442.34 |
| Living Space | 72.63 | 600.84 | 507.11 | 579.74 |
| Ecological Space | 1474.95 | 2348.33 | 10,457.85 | 3823.28 |
| Total transfers in | 1547.58 | 3344.38 | 1953.4 |
| Scenario | PSP | LSP | ESP | ID |
|---|---|---|---|---|
| Production space (km2) | 4162.01 | 3889.45 | 3819.99 | 3881.52 |
| Percentage of the whole area (%) | 20.49 | 16.3 | 18.8 | 18.94 |
| 2020–2030 rate of change (%) | 0.91 | -3.28 | −0.77 | −0.64 |
| Living space (km2) | 4343.28 | 5183.69 | 4318.21 | 4415.94 |
| Percentage of the whole area (%) | 21.38 | 25.51 | 21.25 | 21.54 |
| 2020–2030 rate of change (%) | 5.5 | 9.63 | 5.38 | 5.67 |
| Ecological Space (km2) | 11,811.95 | 11,823.39 | 12,179.04 | 12,200.01 |
| Percentage of the whole area (%) | 58.14 | 58.19 | 59.94 | 59.52 |
| 2020–2030 rate of change (%) | −6.41 | −6.36 | −4.61 | −5.03 |
Publisher’s Note: MDPI stays neutral with regard to jurisdictional claims in published maps and institutional affiliations. |
© 2022 by the authors. Licensee MDPI, Basel, Switzerland. This article is an open access article distributed under the terms and conditions of the Creative Commons Attribution (CC BY) license (https://creativecommons.org/licenses/by/4.0/).
Share and Cite
Li, H.; Fang, C.; Xia, Y.; Liu, Z.; Wang, W. Multi-Scenario Simulation of Production-Living-Ecological Space in the Poyang Lake Area Based on Remote Sensing and RF-Markov-FLUS Model. Remote Sens. 2022, 14, 2830. https://doi.org/10.3390/rs14122830
Li H, Fang C, Xia Y, Liu Z, Wang W. Multi-Scenario Simulation of Production-Living-Ecological Space in the Poyang Lake Area Based on Remote Sensing and RF-Markov-FLUS Model. Remote Sensing. 2022; 14(12):2830. https://doi.org/10.3390/rs14122830
Chicago/Turabian StyleLi, Huizhong, Chaoyang Fang, Yang Xia, Zhiyong Liu, and Wei Wang. 2022. "Multi-Scenario Simulation of Production-Living-Ecological Space in the Poyang Lake Area Based on Remote Sensing and RF-Markov-FLUS Model" Remote Sensing 14, no. 12: 2830. https://doi.org/10.3390/rs14122830