Article

Investigating the Performance of Red and Far-Red SIF for Monitoring GPP of Alpine Meadow Ecosystems

1
College of Geomatics, Xi’an University of Science and Technology, Xi’an 710054, China
2
Key Laboratory of Digital Earth Science, Aerospace Information Research Institute, Chinese Academy of Sciences, Beijing 100094, China
3
International Research Center of Big Data for Sustainable Development Goals, Beijing 100094, China
*
Author to whom correspondence should be addressed.
Remote Sens. 2022, 14(12), 2740; https://doi.org/10.3390/rs14122740
Submission received: 7 April 2022 / Revised: 5 June 2022 / Accepted: 6 June 2022 / Published: 7 June 2022

Abstract

:
Alpine meadow ecosystems are extremely vulnerable to climate change and serve an essential function in terrestrial carbon sinks. Accurately estimating their gross primary productivity (GPP) is essential for understanding the global carbon cycle. Solar-induced chlorophyll fluorescence (SIF), as a companion product directly related to plant photosynthesis process, has become an attractive pathway for estimating GPP accurately. To date, the quantitative SIF-GPP relationship in terrestrial ecosystems is not yet clear. Especially, red SIF and far-red SIF present differences in their ability to track GPP under different environmental conditions. In this study, we investigated the performance of SIF at both red and far-red band in monitoring the GPP of an alpine meadow ecosystem based on continuous tower-based observations in 2019 and 2020. The results show that the canopy red SIF ( SIF Red ) and far-red SIF ( SIF Far-red ) were both strongly correlated with GPP. SIF Red was comparable to SIF Far-red for monitoring GPP based on comparisons of both half-hourly averaged and daily averaged datasets. Moreover, the relationship between SIF Red and GPP was linearly correlated, while the relationship between SIF Far-red and GPP tended to be nonlinear. At a diurnal scale, dramatic changes in photosynthetically active radiation (PAR), air temperature (Ta), and vapor pressure deficit (VPD) all had effects on the slope of the linear fitted line with zero intercept for SIF Red -GPP and SIF Far-red -GPP, and the effect on the slope of the linear fitted line with zero intercept for SIF Far-red -GPP was obviously stronger than that for SIF Red -GPP. PAR was the dominant factor among the three environmental factors in determining the diurnal variation of the slope of SIF-GPP. At a seasonal scale, the SIF Far-red /GPP was susceptible to PAR, Ta, and VPD, while the SIF Red /GPP remained relatively stable at different levels of Ta and VPD, and it was only weakly affected by PAR, suggesting that SIF Red was more consistent than SIF Far-red with GPP in response to seasonal variations in environmental factors. These results indicate that SIF Red has more potential than SIF Far-red for monitoring the GPP of alpine meadow ecosystems and can also assist researchers in gaining a more comprehensive understanding of the diversity of SIF-GPP relationships in different ecosystems.

Graphical Abstract

1. Introduction

Alpine meadow is a typical alpine ecosystem found globally and consists of hardy perennial herbaceous communities, and such meadows are mainly distributed at high altitudes and covers about one-third of the Qinghai–Tibet Plateau (QTP). They have a crucial role in the carbon cycle and serve as an essential ecological security barrier in alpine regions [1,2,3]. Alpine meadows of the QTP are exposed to intensive and sufficient solar radiation throughout the year, including strong ultraviolet radiation [4]. Temperatures at the QTP usually undergo wide diurnal variation, and the temperature and rainfall here are severely influenced by latitude, topography, and atmospheric circulation, making the growing environment of alpine meadows extremely harsh [3]. Previous studies have demonstrated the vulnerability of alpine ecosystems to major changes in climate [3,5,6,7], which inevitably leads to changes in carbon fluxes in this ecosystem [4].
Gross primary productivity (GPP) is the sum of total organic carbon fixation through photosynthesis within the vegetation under natural light conditions, which is an important indicator of carbon fluxes [8,9,10]. Accurate estimations of the GPP of ecosystems is important for understanding the state of the ecosystem response to environmental variations and changes in carbon balance [11,12]. Throughout recent decades, an increasing number of researchers have become accustomed to utilizing solar-induced chlorophyll fluorescence (SIF) as a promising approach on monitoring GPP [11,13,14]. SIF is an emission spectrum showing two emitting peaks in the red and far-red bands, which is a by-product of the photosynthesis process [11,15,16,17]. Thereby, SIF is directly related to photosynthesis and could be treated as an indicator of GPP [15,18,19,20,21].
Most current studies on the association of SIF and GPP have focused on cropland, forest, grassland, and wetland ecosystems, and SIF-based GPP monitoring has demonstrated a strong ability to track changes in all of these ecosystems. Canopy far-red SIF ( SIF Far-red ) follows likeness seasonal and diurnal pattern of variation to GPP, which have been observed in crops [14,22,23,24,25], forests [26,27,28], and coastal salt marsh ecosystems [29]. In crop ecosystems such as wheat, maize, rice, and soybean, many studies have found that SIF Far-red showed an obvious linear relationship with GPP [24,25,30,31], but this linear relationship is highly variable depending on the type of crop photosynthetic pathway [24]. Additionally, studies on grassland ecosystems based on the GOME-2 terrestrial chlorophyll fluorescence data product and FLUXNET GPP data have shown good linear relationships between SIF Far-red and GPP in multi-year data on monthly time scales but also variations in the correlations between SIF Far-red and GPP due to differences in the types of photosynthetic pathways of grasslands [32,33]. Several studies on evergreen coniferous [26], evergreen broadleaf [34], and deciduous broadleaf forests [35] have shown that, under normal growth conditions, SIF Far-red exhibited a positive linear relationship with GPP at different time scales, although the coefficient of determination (R2) of this linear relationship varied obviously depending on the observed time scale. More recently, a study on coastal salt marsh ecosystems also reported that SIF Far-red had an obvious linear correlation with GPP in coastal salt marsh ecosystems, and the linearity strengthened with increasing time scale [29]. However, other studies have also revealed that SIF Far-red and GPP have a nonlinear relationship. For example, Chen et al. [23] found a hyperbolic relationship between maize SIF Far-red and GPP. The results from a study on evergreen coniferous forests showed a strong nonlinear relationship between SIF Far-red and GPP on both diurnal and seasonal scales, mainly because the GPP was saturated with increasing absorbed photosynthetically active radiation (APAR), while SIF Far-red was not [36]. Another study demonstrated that the linear correlation for SIF Far-red with GPP shifted from positive to negative when the trees were subjected to extreme weather conditions (e.g., heat waves) in evergreen broadleaf forests, thus showing an overall nonlinear correlation [34]. This is mainly due to a change in internal plant energy allocation as an evergreen broadleaf forest experiences nonphotochemical quenching (NPQ) saturation and continuous photoinhibition during heat waves [34].
Notably, researchers prefer to use SIF Far-red to study the dynamics of GPP in various ecosystems [14], owing to the fact that fluorescence in the red band is strongly influenced by reabsorption, and that accurate retrieval of SIF is easier in the far-red than the red band. Benefiting from the improvement of signal-to-noise ratio and spectral resolution of spectral measurement instruments, as well as the development of fluorescence inversion algorithms, researchers have also explored the relationship between canopy red SIF ( SIF Red ) and GPP [37]. For instance, through downscaling from the observed canopy level SIF to the photosystem level in maize, Liu et al. [38] investigated the relationship between photosystem level SIF and GPP in maize. As compared to canopy-level red SIF, the correlation between photosystem-level red SIF and GPP was found to be greatly enhanced and even better than that between photosystem-level far-red SIF and GPP. During the wheat canopy growth stage, the correlation between SIF Far-red and GPP was found to be stronger than that between SIF Red and GPP [14]. When the growing stage reached a stable state, SIF Far-red was slightly weakened in relation to GPP, while SIF Red was strengthened in relation to GPP, thereby causing the correlations between SIF Red and GPP and between SIF Far-red and GPP to be comparable [14]. Magney et al. [26] studied on an evergreen coniferous forest and stated that the expected increase in SIF Red did not occur as a consequence of the absence of a significant increase in chlorophyll concentration, and that SIF Red was capable of closely tracking the seasonal changes in GPP in this evergreen coniferous forest.
Across various environmental conditions, the relationship is by no means invariant between SIF and GPP. Previously, an investigation on mangroves showed that VPD negatively affected the strength of the SIF-GPP relationship in mangroves, and that the SIF-GPP correlation did not consistently get stronger as PAR and air temperature increased. The strength of the SIF-GPP relationship in mangroves was most strongly correlated at moderate PAR and air temperature. Thereby high PAR, air temperature, and VPD would weaken the correlation between SIF-GPP in mangrove ecosystem [39]. Yang et al. [25] exhibited that variations in relative humidity and temperature had obvious effects on the ratio of GPP to SIF Far-red for rice. At the same humidity level, the ratio of GPP to SIF Far-red diminished with elevated temperature, while at the same temperature level, the ratio of GPP to SIF Far-red showed an increase with elevated relative humidity. In a subalpine coniferous forest ecosystem, Yang et al. [40] found that there were differences in the relative importance of environmental factors driving changes in GPP and SIF Red from spring to winter. Moreover, SIF Red responded to light earlier than GPP after winter dormancy ends, potentially making it challenging to capture the onset of the photosynthetic season using SIF Red . Regarding a coastal salt marsh ecosystem, tidal inundation had a negative effect on the relationship between SIF Far-red and GPP, mainly due to its different degrees of effects on the light use efficiency (LUE), fluorescence escape probability, and fluorescence quantum yield of vegetation in coastal salt marshes, which affected the performance of SIF Far-red in accurately estimating GPP [29]. Across global scales, Chen et al. [41] showed that moisture availability had a remarkable moderating effect on the SIF-GPP relationship and that the most important environmental factors influencing the SIF-GPP relationship differed in diverse climatic zones. Furthermore, Chen et al. [42] focused on the Northern Hemisphere SIF-GPP relationship and found that the seasonal variation in the SIF-GPP relationship was strongest in regions of moderate temperature and precipitation. Evidently, the effects of environmental factors on the SIF-GPP relationship display different patterns in different regions, making it very essential to consider the transformation of the SIF-GPP relationship at different levels of various environmental factors.
Although advances have been made in the SIF-GPP relationship and its response to environmental factors in some ecosystems, apparently the SIF-GPP relationship varies with ecosystem shifts. Even in the same ecosystem, the SIF-GPP relationship varies significantly due to the different stages of vegetation growth and the effects of changes in different environmental factors on vegetation. The SIF-GPP relationship in the whole terrestrial ecosystem is not clarified, therefore, it is necessary to investigate the SIF-GPP relationship under different ecosystems and the influence of environment on this relationship. However, for some special ecosystems, such as alpine meadow, there has rarely been research on how SIF and GPP relate to each other and the effects of environmental factors on their relationships. Furthermore, since researchers investigated the relationship between SIF Far-red and GPP much more frequently than the relationship between SIF Red and GPP in various ecosystems, this has resulted in the scarcity of information on diurnal and seasonal variations of SIF Red and SIF Red -GPP relationships in various ecosystems. However, SIF Red , mainly generated from photosystem II, reveals more information related to plant physiological changes than SIF Far-red and, therefore, has theoretically more potential for the accurate monitoring of GPP [14,15,20,43].
We are aware of still no research on the use of tower-based continuous observations to study SIF-GPP relationships for alpine meadow ecosystems. Hence, in this study, we collected canopy reflectance spectral data, SIF spectral data, meteorological variables data, and carbon flux data of alpine meadows for two growing seasons using a continuous automatic tower-based observation system. Based on the above observations, our main research objectives are to investigate that for alpine meadow ecosystem, (1) whether SIF at red and far-red bands could track variations of GPP over diurnal and seasonal scales; (2) what is the effect of environmental factors upon the SIF-GPP relationship for different bands; and (3) whether the SIF-GPP relationship and its environmental effects are wavelength-dependent and which band is better for GPP estimation.

2. Materials and Methods

2.1. Experimental Site

Long-term continuous in-situ spectral measurements based on tower-based observations were conducted in 2019 and 2020 at the Arou (AR) site, a grassland site (Figure 1) in the ChinaSpec network, a ground-based continuous SIF observation network of flux tower sites in China [44]. The AR site was also established for use in the Heihe Watershed Allied Telemetry Experimental Research (HiWATER) experiment [45]. The AR site is located in Arou Township, Qilian County, Qinghai Province, Western China (100.4643E, 38.0473N, altitude 3033 m), and in the hinterland of the middle Qilian Mountains in the northeastern region of the Qinghai–Tibet Plateau, with a typical plateau continental climate [5]. The average multi-year temperature is around 0.7 °C, the average yearly precipitation is 400 mm, and the yearly snowfall period reaches about 240–270 days, with absence of absolute frost-free period all year round. The underlying surface of the AR site is mainly alpine meadow. The grass can reach heights of 30 cm during the peak growing period in summer. With high atmospheric transparency, thin air, strong solar radiation, long illuminating hours, and abundant incoming radiation throughout the year, SIF and GPP relationship for alpine meadow may, to some extent, differ from those of other ecosystems.

2.2. Tower-Based Spectral Measurements

An automated long term in-situ SIF observation system, SIFSpec, was installed on a tower-based platform about 17 m from the ground for continuous SIF spectral measurements [44,46]. The main components of the SIF observation system include (1) a customized Ocean Optics QE65 Pro spectrometer (Ocean Optics, Dunedin, FL, USA) with a spectral range of 649–805 nm, a spectral resolution of 0.34 nm, a sampling interval of 0.155 nm, and a signal-to-noise ratio (SNR) of >1000 [46]; (2) a computer storing the spectral data and information about the instrument operation status and a software control system controlling the switching of instrument switches and electronic switches [46]; (3) a Y-shaped bifurcated optical fiber (CPATCH, Ocean Optics, Inc., Dunedin, FL, USA), two five meters long optical fibers (core diameter 1000 μm); (4) two inline TTL-driven electronic switches (Ocean Optics, Inc., Dunedin, FL, USA) [46]; (5) a bare optic fiber probe (field of view (FOV) of 20°) and a fiber optic probe (FOV of 180°) connected to the cosine corrector (CC3-3-UV-S, Ocean Optics, Inc., Dunedin, FL, USA); and (6) an automatic radiator to maintain the temperature inside the instrument case [46]. The fiber optic probe with cosine corrector and the bare fiber optic probe are used to collect the downlink solar incidence spectrum and the uplink feature canopy reflection spectrum, respectively, and the collected spectra are sequentially passed through the long fiber and electronic switch connected to the corresponding probes to form two spectral channels, which reach the bifurcated end of the Y-shaped bifurcated fiber and finally arrive inside the QE65 Pro spectrometer.
The SIF observation system uses a “sandwich” mode to collect spectral data [47]. A dataset consists of three spectral acquisitions, the downlinked solar incidence spectrum, the uplinked feature canopy reflection spectrum, and the downwelling solar incidence spectrum, which are acquired by controlling the alternate opening and closing of two electronic switches [46]. Since the mismatch of time between measurements of downwelling and upwelling introduces errors due to weather variations, the downwelling solar incidence spectrum is represented by the average of the two measured downwelling solar incidence spectra. Before acquisition of each spectrum, the spectrometer optimally determines the integration time based on the received spectral signal and records the dark current [46]. Under normal conditions, a complete set of data acquisition takes about 15 seconds during midday, and about two minutes during sunrise and sunset.

2.3. Meteorological Variables and Flux Observations

An automatic weather station (AWS) was utilized to observe meteorological variables, which was mounted on the AR site flux tower platform and could observe several meteorological variables including air temperature (Ta), barometric pressure (p), relative humidity (Rh), precipitation, wind speed/direction, and photosynthetically active radiation (PAR); measurements were recorded every 10 min [48]. Half-hourly averaged meteorological data were obtained by averaging multiple 10-min data over a half-hour period, and daily averaged meteorological data were obtained by re-averaging daily half-hourly averaged data.
Alpine meadow and atmospheric exchange of energy, carbon dioxide, and water were measured by an eddy covariance (EC) system, which was also mounted on the tower-based platform around three meters from the ground [48]. The EC system includes a three-dimensional acoustic anemometer (CSAT3, Campbell Scientific Inc., Logan, UT, USA) and an open path gas analyzer (Li-7500, Li-Cor, Lincoln, NE, USA) [48,49]. The data sampling frequency is 10 Hz. We filled in the gaps in the data with the online resource tool (http://www.bgc-jena.mpg.de/~MDIwork/eddyproc/ (accessed on 24 September 2021)) supplied by the Max Planck Institute for Biogeochemistry (MPI-BGC). Based on data for the measured CO2 net ecosystem exchange flux (NEE) and meteorological variables, a division of inter-day NEE into GPP and ecosystem respiration was performed using the inter-day division method proposed by Lasslop et al. [50]. The final separation was obtained for half-hourly GPP data. The daily averaged GPP data were obtained by re-averaging daily half-hourly averaged data.

2.4. Canopy SIF Retrieval

Canopy SIF ( SIF Red , SIF Far-red ) for red and far-red bands were retrieved with spectral fitting method (SFM). The prerequisite assumption for extracting SIF from the reflected radiance spectrum of surface vegetation is that reflectance and fluorescence emission obey Lambert’s cosine law, whereby the upwelling radiance of vegetation is coupled by two components: the solar flux reflected, and the fluorescence emitted [51,52]. SFM supposes that reflectance spectra and fluorescence spectra in chosen spectral intervals are functions of wavelengths that can be described by mathematical functions rather than that they are spectrally constant [52]. Here, the reflectance and fluorescence spectra were fitted separately with quadratic functions:
L ( λ ) = r ( λ ) E ( λ ) π + F ( λ ) = ( a λ 2 + b λ + c ) E ( λ ) π + ( m λ 2 + n λ + p )
where λ is wavelength, L ( λ ) is the radiance upwelling from vegetation, r ( λ ) is the reflectance (without the emission component), E ( λ ) is the incoming total solar irradiance to the target, F ( λ ) is the solar-induced fluorescence, and a , b , c , m , n , and p are the spectral fitting coefficients, respectively.

2.5. Statistical Analysis and Model Fitted

To reduce the confounding due to backgrounds, such as soil, and the effect of scattered light ratios from direct light, only spectral data with NDVI > 0.5 and SZA < 80° were used.
N D V I = R N I R R R e d R N I R + R R e d
where R N I R and R R e d represent the reflectance at near-infrared (NIR) and red bands. Here, the average reflectance of 780–800 nm and 681–685 nm was used to stand for the NIR and red band reflectance, respectively.
The existence of coupling between SIF and GPP has been illustrated in a variety of studies on various platforms, scales, and ecosystems, but whether the link between SIF and GPP is linear or nonlinear remains inconclusive [28,53]. Previous studies indicated that the SIF-GPP relationship is linear [26,30], but mounting studies have shown that the SIF-GPP relationship tends to be more nonlinear as the data temporal resolution improves [54,55,56]. Because of this, two fitted models, linear and nonlinear, were used to depict the SIF-GPP relationship for the 30-min averaged data, while for the daily averaged data, only the linear fitted model was used.
G P P L i n e a r = k × S I F
G P P N o n l i n e a r = p 1 × S I F + p 2 S I F + p 3
where G P P L i n e a r stands for the fitted results of SIF with the linear model, G P P N o n l i n e a r stands for the fitted results of SIF with the nonlinear model, and k , p 1 , p 2 , and p 3 stand for the fitted parameters of the models.
The merits of the fitted models were then evaluated using R2 and the root mean square error (RMSE) for a comprehensive evaluation.

3. Results

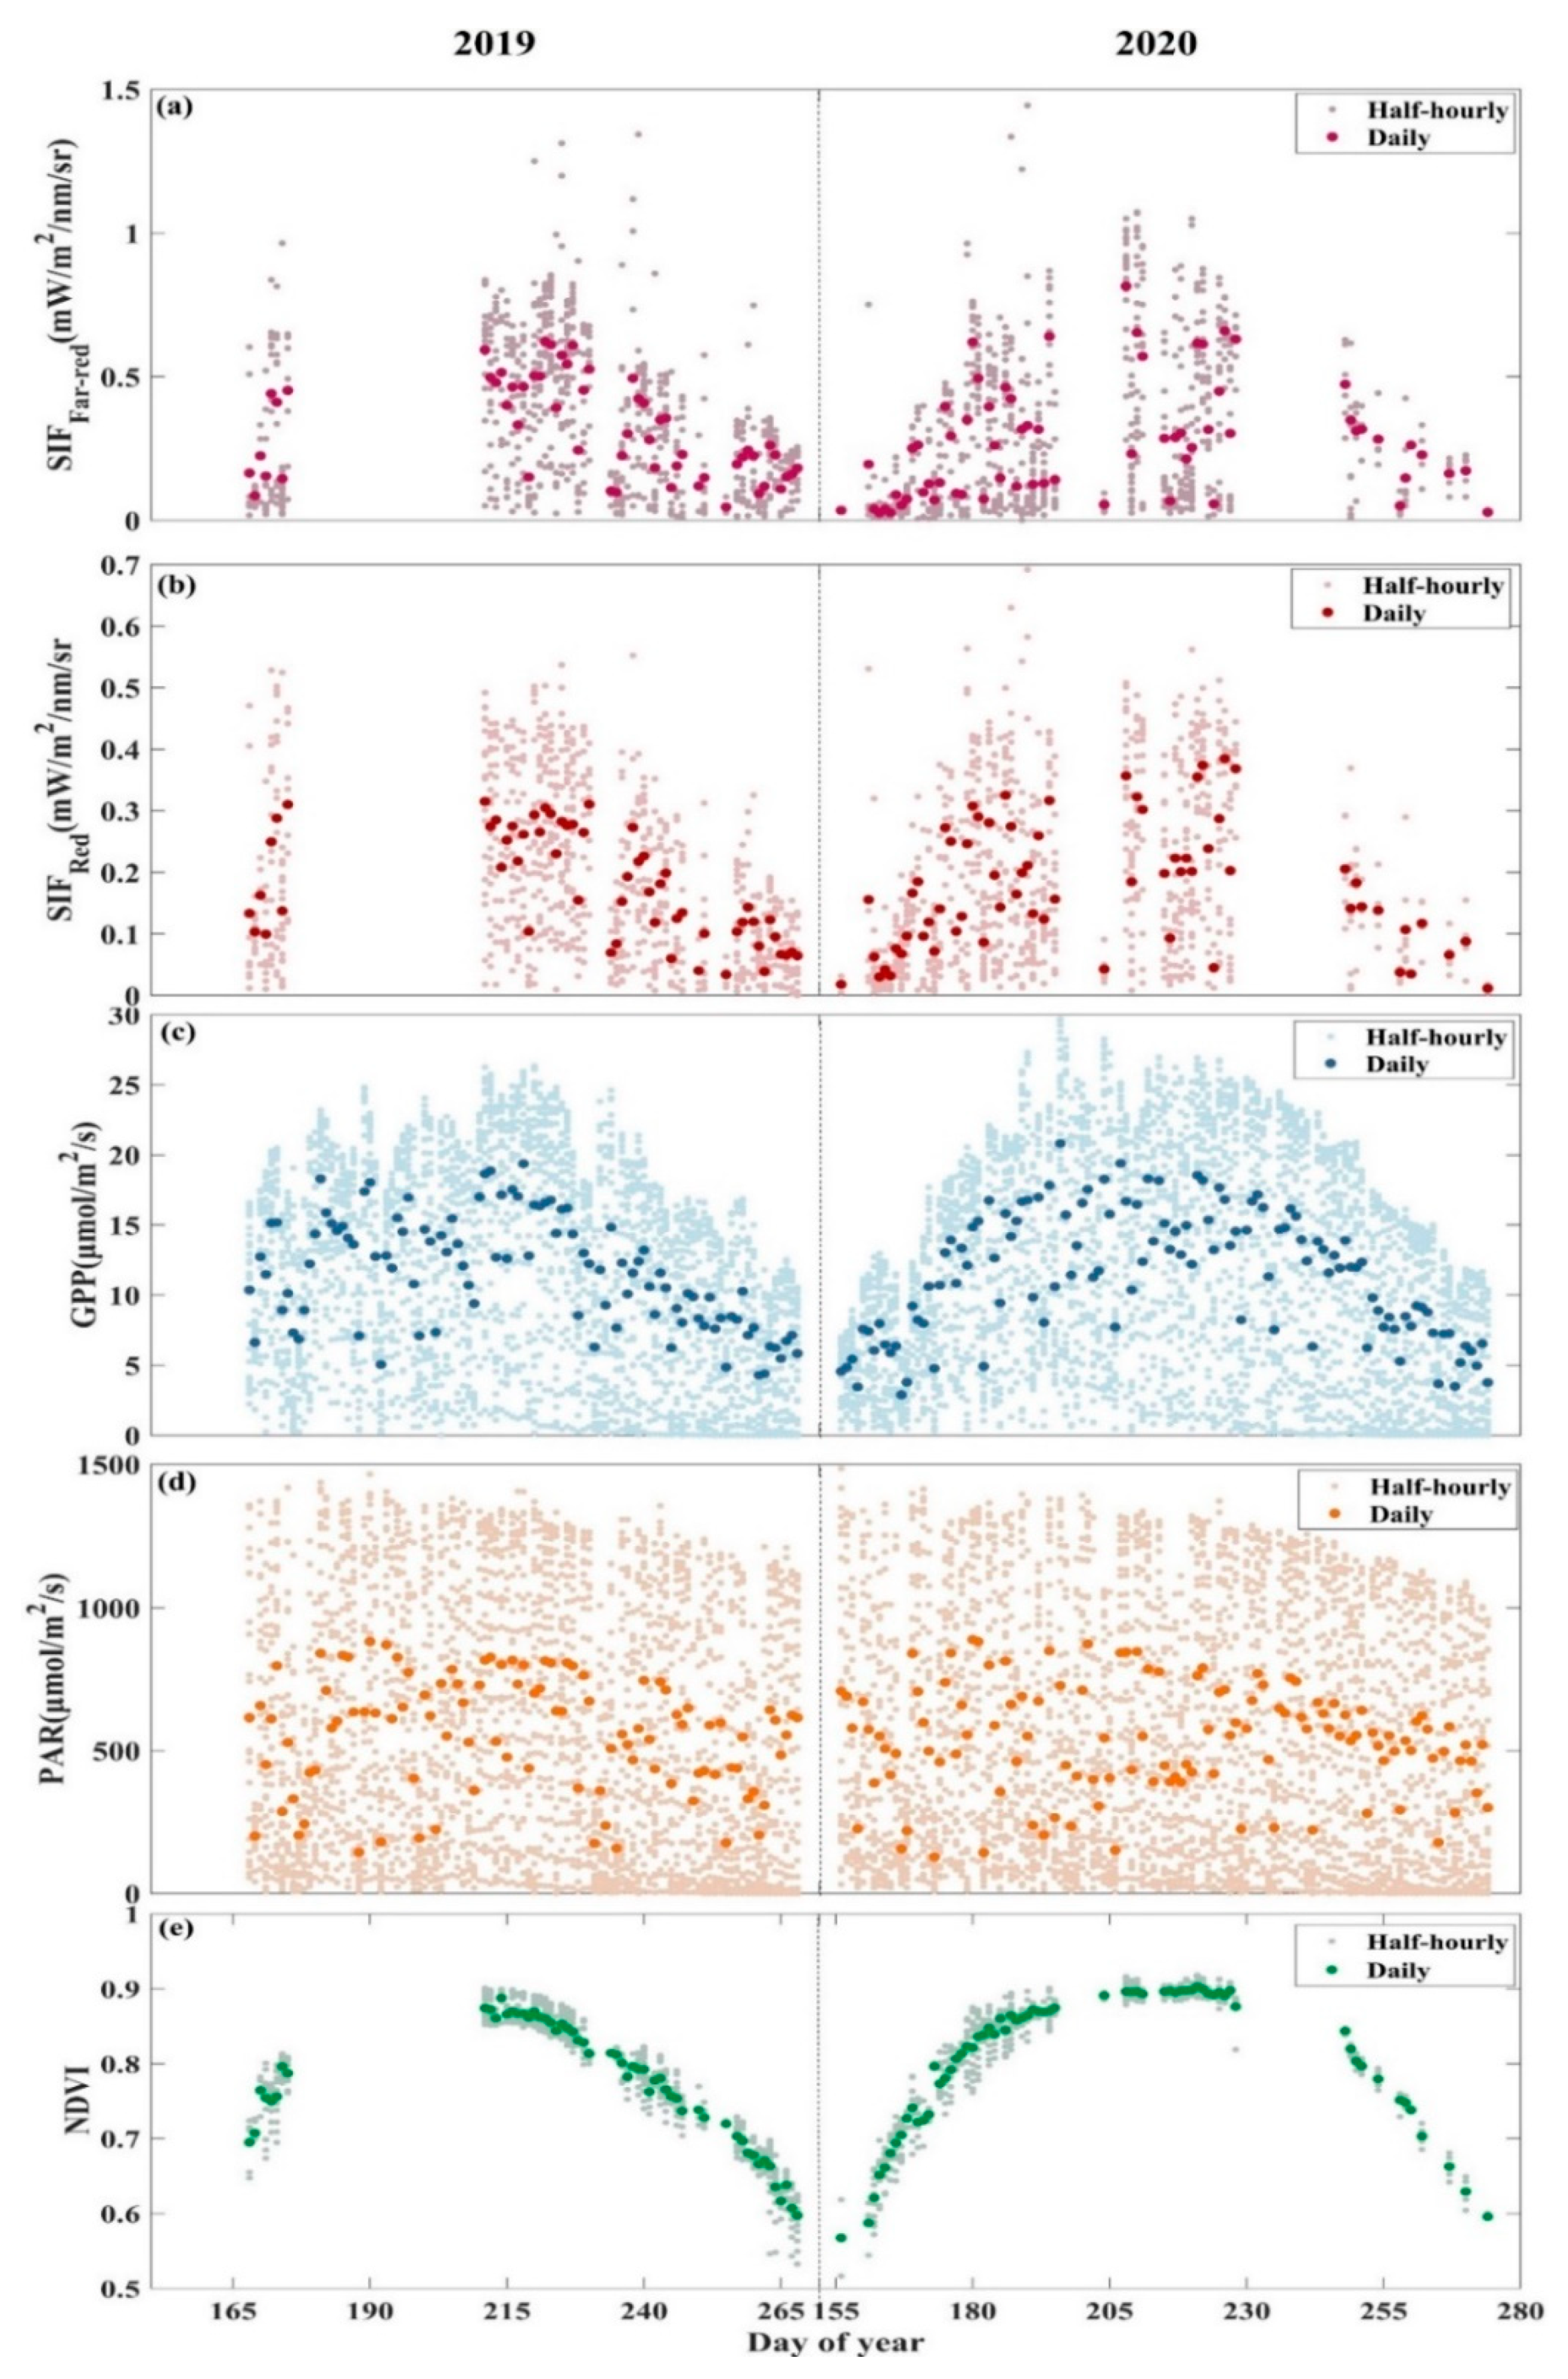
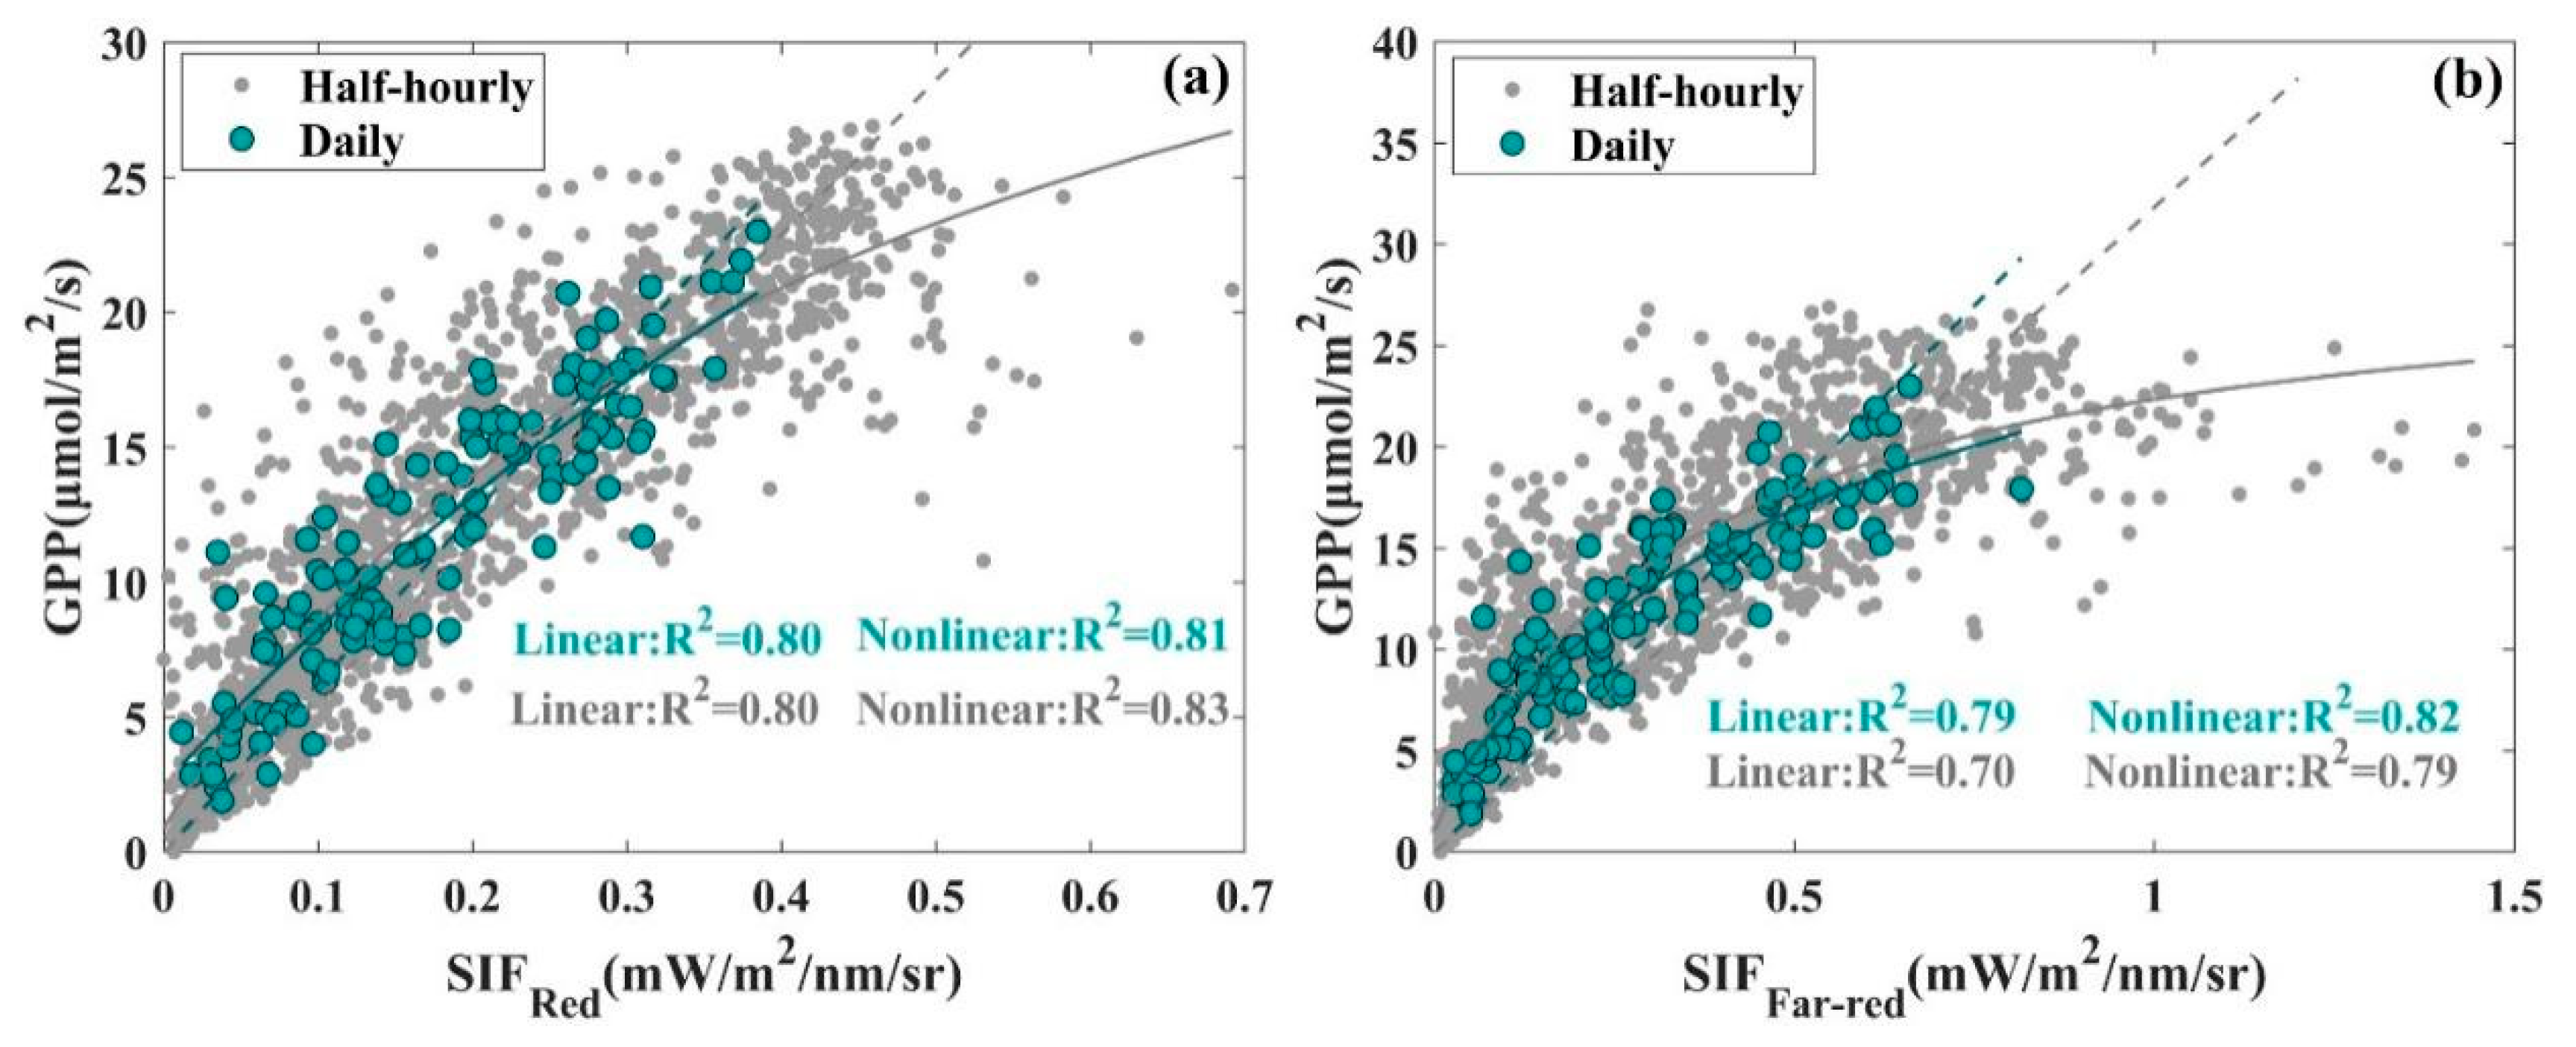
3.1. Seasonal Patterns of SIF and GPP and Their Relationship

Due to instrument failures, there were some data gaps for alpine meadow spectral and flux data in both the 2019 and 2020 growing seasons, but the available data could cover most growing stages of alpine meadow. Figure 2 illustrates the seasonal variations of SIF Red , SIF Far-red , GPP, and NDVI. At the seasonal scale, they show consistent and obvious “single-peaked” seasonal patterns. NDVI reaches its maximum value for the whole growing season at about 205–220 days of day of year (DOY), and the corresponding SIF Red , SIF Far-red , and GPP also reach their maximum values during the same period. There is relatively small variation in the seasonality of photosynthetically active radiation (PAR), with generally high PAR values over the entire growing season.
The relationships between SIF Red and SIF Far-red with GPP in alpine meadows were analyzed with half-hourly and daily averaged datasets. Both a linear function model ( y = k x ), with the intercept of the linear function set to zero, and a nonlinear function model ( y = ( p 1 x + p 2 ) / ( x + p 3 ) ) were adopted to fit SIF and GPP relationship (Table 1). The differences in R2 between the nonlinear and linear fitted function models for the SIF Red -GPP relationship are small with regard to both half-hourly and daily averaged data and are larger for the SIF Far-red -GPP relationship, especially concerning the half-hourly averaged data, where the R2 of the fitted results of the nonlinear function model is 12.86% higher than that of the linear function model. The difference in RMSE between the nonlinear and linear fitted function models for both SIF Red -GPP and SIF Far-red -GPP is obvious; for the half-hourly data, the RMSE of the linear fitted results for SIF Red -GPP and SIF Far-red -GPP are 31.49% and 59.44% higher than the corresponding nonlinear fitted results, respectively, and for the daily averaged data, 24.89% and 64.93% higher, respectively. Although for both SIF Red -GPP and SIF Far-red -GPP, the RMSE of the linear fitted results are higher than the nonlinear fitted results for both the half-hourly and daily averaged data, considering the R2 of the fitted results and the scatter plot distribution of the data together (Figure 3), the SIF Red -GPP relationship tends to be more linear than the SIF Far-red -GPP relationship. The R2 of the linear fitted SIF Red -GPP relationship and that of the nonlinear fitted SIF Far-red -GPP relationship are also close. These results indicate that the performance of SIF Red and SIF Far-red were comparable for monitoring GPP in an alpine meadow.

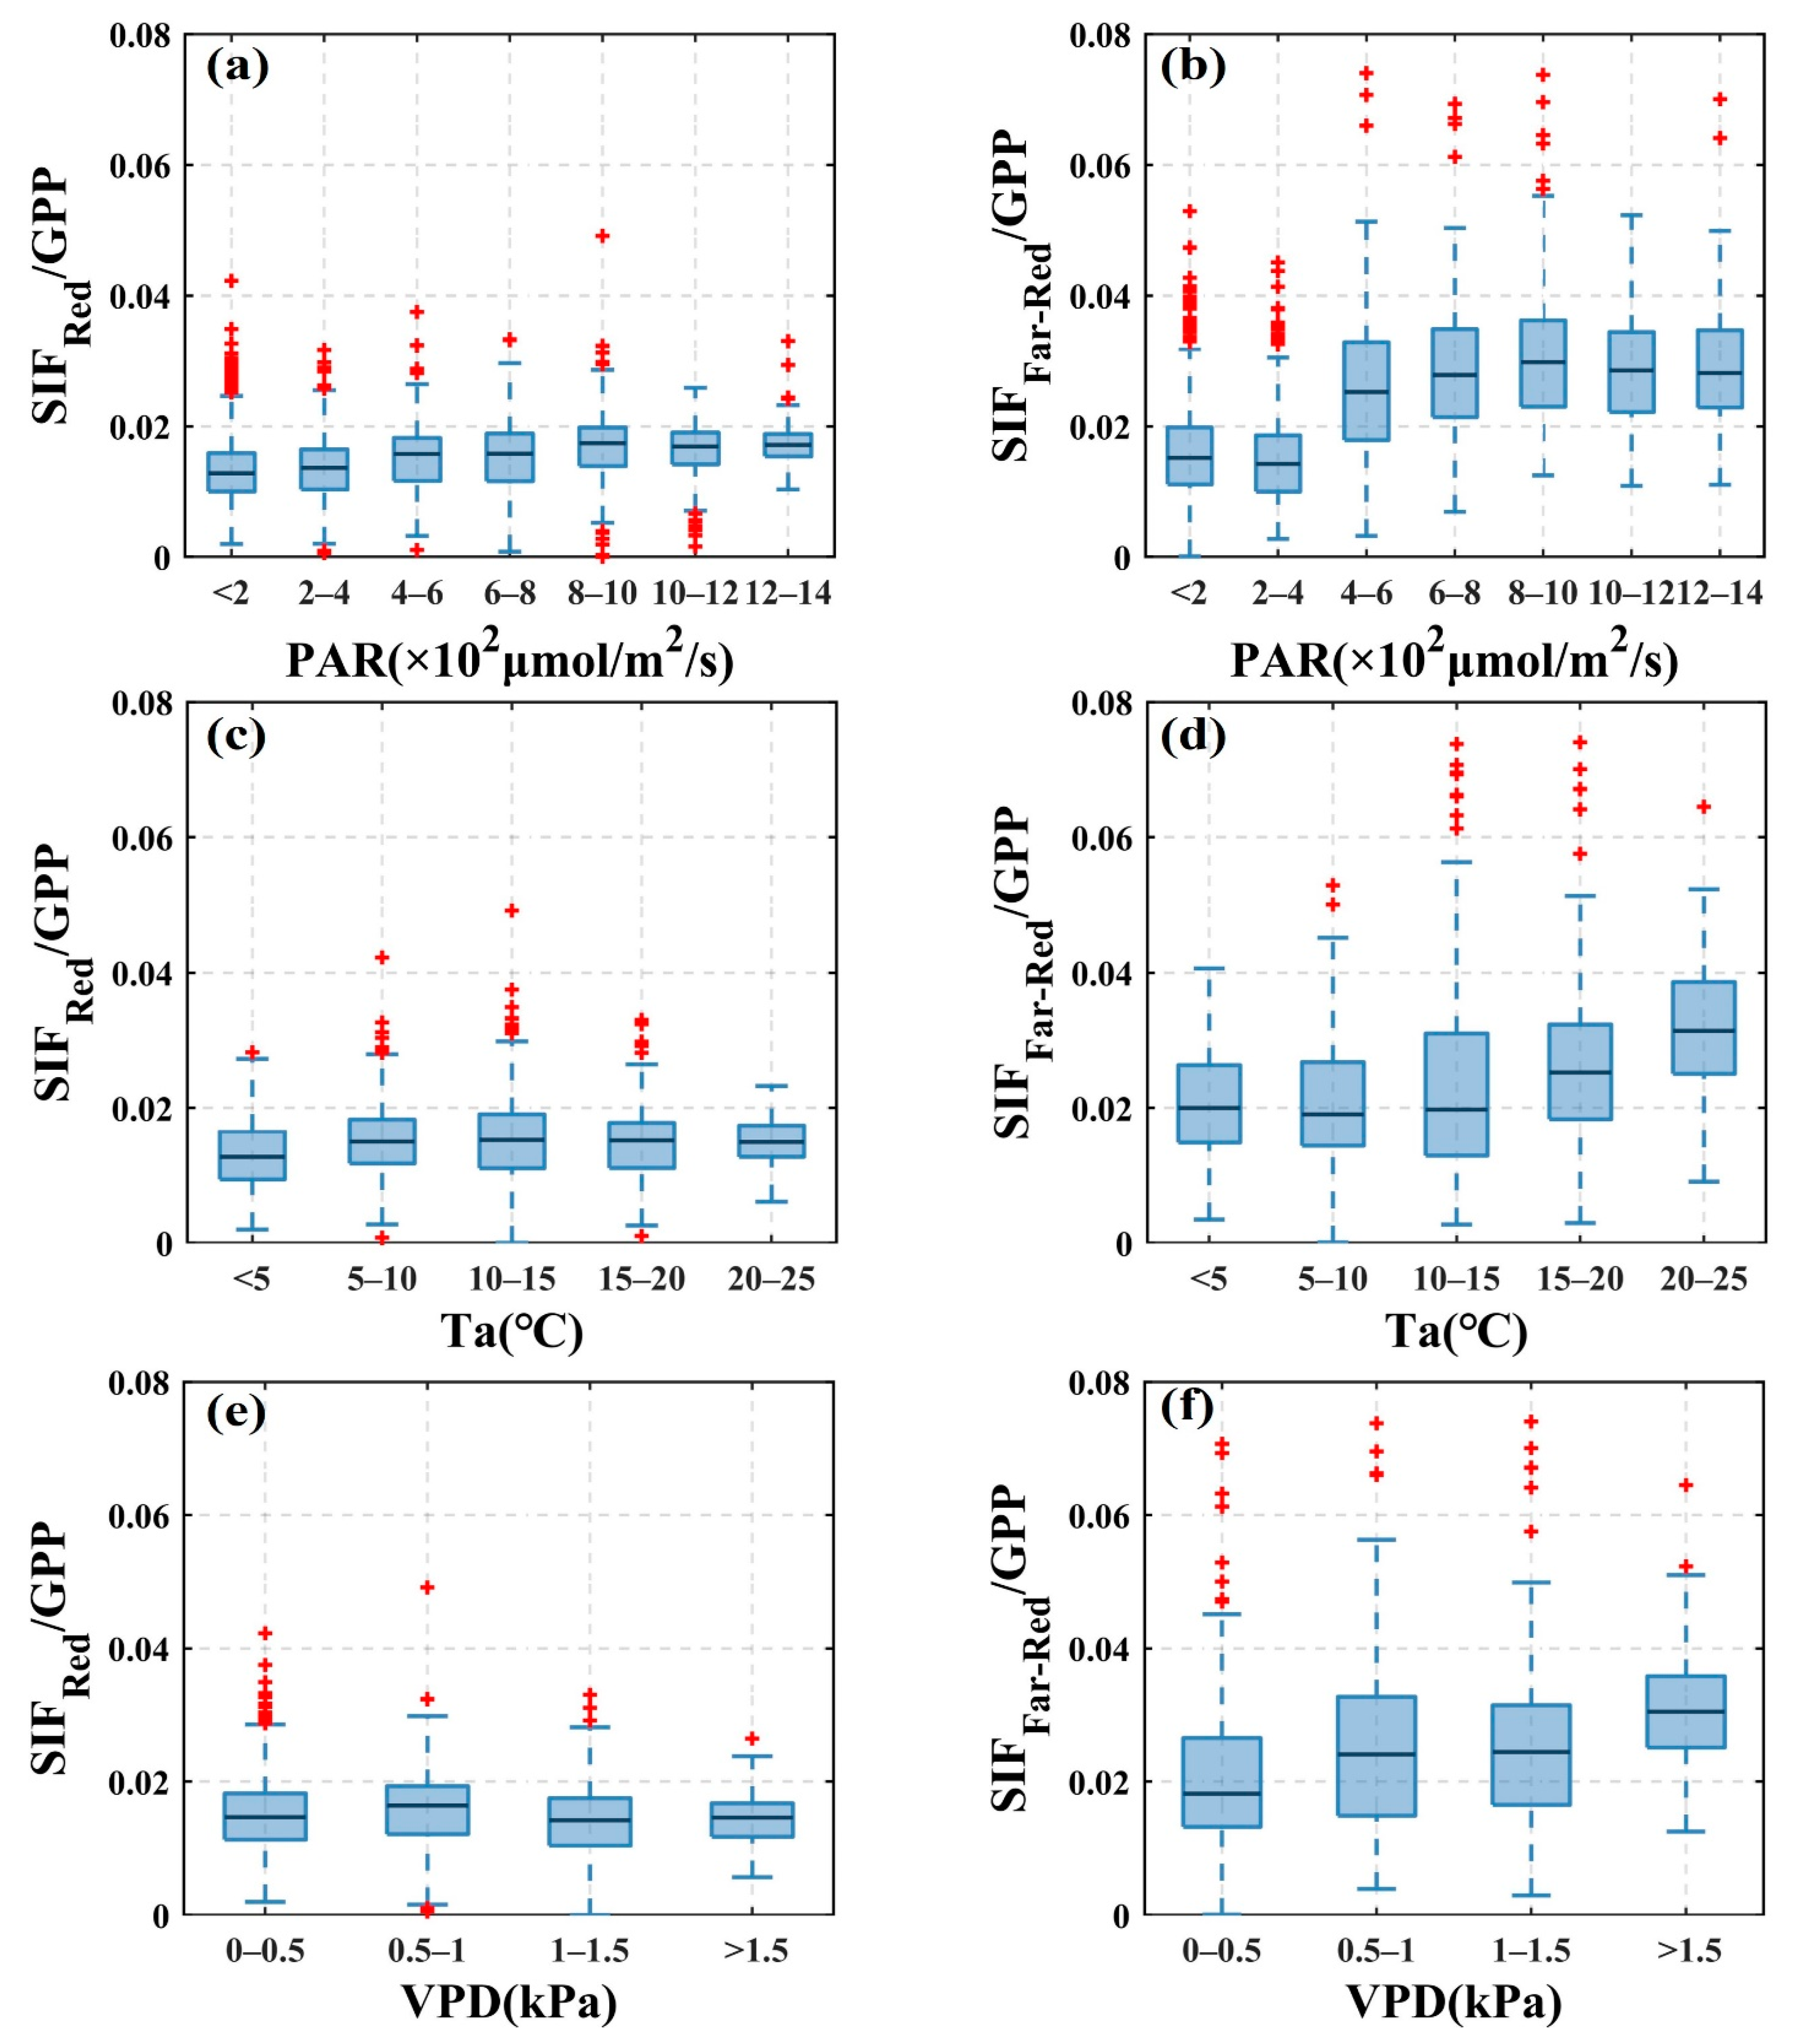
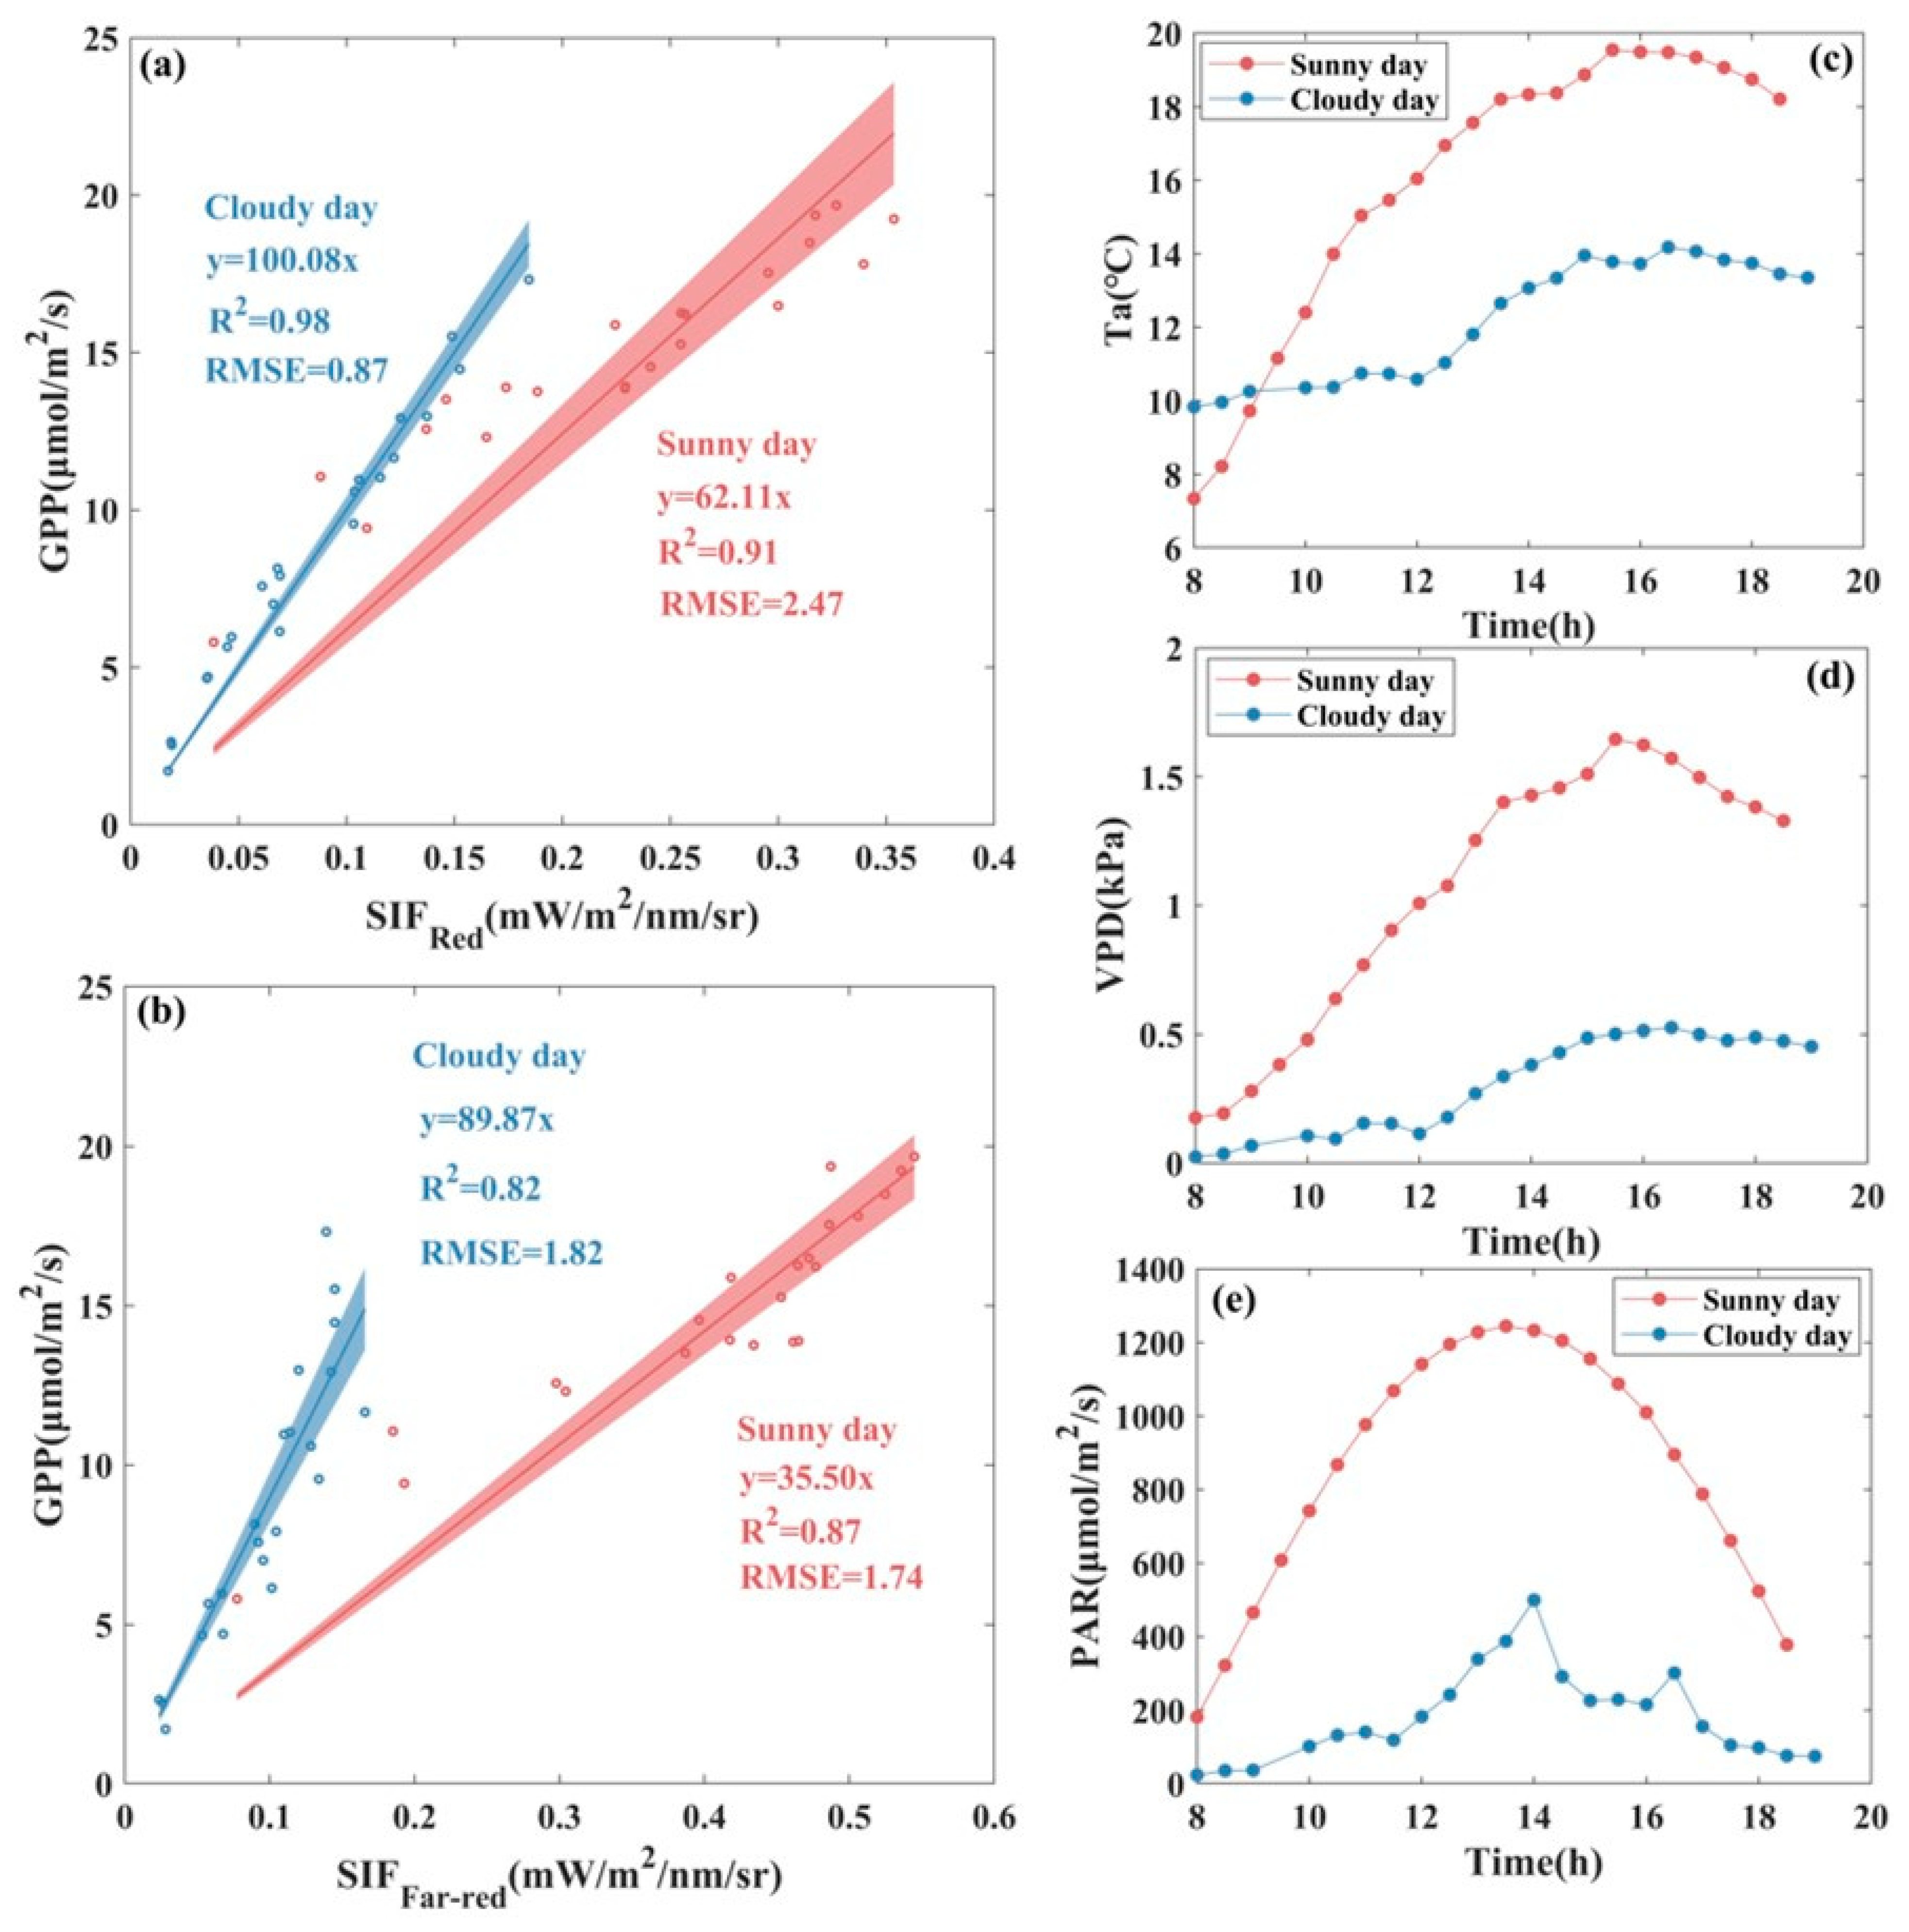
3.2. Response of SIF and GPP to Environmental Factors

The impact of environmental factors upon the SIF-to-GPP ratio was also analyzed. As shown in Figure 4, with increasing PAR values, SIF Red /GPP values show a very slight increasing trend, while SIF Far-red /GPP values show an obvious increasing trend, with obvious increases when PAR is higher than 400–600   μ mol / m 2 / s . SIF Red /GPP values remain almost constant across different changes in Ta without obvious variations, while those of SIF Far-red /GPP show an increasing trend, especially when the temperature increases to 15 °C, where SIF Far-red /GPP shows a substantial increase. In addition, SIF Red /GPP values did not show obvious variations across different changes in VPD, while SIF Far-red /GPP values showed an obvious increasing trend with increases in VPD. In general, for the same value of a given environmental factor, the SIF Red /GPP values tended to be concentrated and have smaller variance, while those of SIF Far-red /GPP were dispersed and had larger variance. When there were changes in the value of the given environmental factor, the SIF Red /GPP values tended to vary less in response and those of SIF Far-red /GPP vary more. This indicates that SIF Red and GPP tended to have a more consistent response to changes in environmental factors than SIF Far-red and GPP.
At the diurnal scale, first, observations from two days with similar PAR but different Ta and VPD were selected to analyze the impacts of environmental factors on SIF-GPP relationship at red and far-red band for alpine meadow. The diurnal variations and values of PAR are similar for DOY220 and DOY227 as shown in Figure 5, while changes in Ta and VPD are obvious, i.e., the values of Ta and VPD for DOY220 are lower than those for DOY227. Due to the decrease in Ta and VPD, the R2 of the linear fitted with zero intercept of both SIF Red -GPP and SIF Far-red -GPP underwent serious decrease and the RMSE underwent dramatic increase in DOY220, with 29.63% and 40% decrease in R2 and about one and three times increase in RMSE for SIF Red -GPP and SIF Far-red -GPP, respectively. Comparing the SIF-GPP relationship for these two days, we found that the slope of the linear fitted with zero intercept between SIF Far-red and GPP decreased obviously when there was an obvious decrease in Ta and VPD values, i.e., of 24.35%, while the slope of the linear fit between SIF Red and GPP did not show any obvious differences.
Furthermore, we selected a typical sunny day and a cloudy day, between which there were obvious differences in the daily changes of PAR, Ta, and VPD. We analyzed the variations in the relationship of SIF Red and SIF Far-red with GPP separately for these two days. From the sunny day to the cloudy day, the R2 of the linear fitted with zero intercept for SIF Red -GPP increased by 7.69% and the RMSE decreased appreciably, by 64.78%, with the scattered distribution of the data on the cloudy day being closer to the fitted line compared to the sunny day, while the R2 of SIF Far-red -GPP decreased by 5.75% and the RMSE increased by 4.6%. As shown in Figure 6, the slopes of the linear fitted with zero intercept between SIF Far-red and SIF Red with GPP are both obviously steeper under cloudy weather than those under sunny weather, though the degree of changes in the slopes differ. For SIF Red and GPP, the slope of the linear fitted is approximately 1.6 times higher under cloudy weather than those under sunny weather, while for SIF Far-red and GPP, it is approximately 2.5 times higher.

4. Discussion

4.1. Reasons Why Red SIF Shows More Potential Than Far-Red SIF for Monitoring GPP in an Alpine Meadow Ecosystem

At present, researchers have not reached a definite conclusion as to which has greater potential for monitoring GPP in various ecosystems, red SIF or far-red SIF. Most previous studies at the canopy level have shown that the potential of red SIF for monitoring GPP was limited by strong reabsorption effects within the canopy and relatively low retrieval accuracy [9,14,27]. However, the results in this study show that red SIF had even more potential than far-red SIF in monitoring GPP in an alpine meadow ecosystem. Here are several possible main reasons for this result.
First of all, we obtained a relatively high precision SIF inversion result for the red and far-red bands. The specifications of the instruments used to measure the spectra and the spectral properties of the irradiance and the reflectance spectra at the absorption bands affect the accuracy of SIF retrieval [57]. In this study, measurements of the continuous spectrum were performed using the SIFSpec system, the core of which is a customized Ocean Optics QE65 Pro spectrometer having high signal-to-noise ratio (>1000) and high spectral resolution (~0.34 nm), ensuring the quality and accuracy of the collected spectral data. Meanwhile, the SFM algorithm was used for the inversion of canopy SIF. The SFM algorithm uses mathematical functions to, first, model the reflectance and fluorescence spectral curves and then invert the chlorophyll fluorescence intensity. In a narrow spectral range, relatively simple fluorescence and reflectance spectral curves can be fitted relatively accurately using polynomial functions. In this study, a quadratic polynomial function was used to fit the spectral curves in both absorption bands of O2-A and O2-B, therefore, high-precision canopy SIF inversion results were obtained for both bands.
For the second, the theoretical basis for red SIF to be sensitive to physiological changes in vegetation. SIF contains APAR information, and it also contains, to some extent, energy distribution information at the photosystem level [11,17,20]. There are two photosynthetic reaction systems in the mechanism of photosynthesis in higher plants, photosystem I (PS I) and photosystem II (PS II) [58,59]. Variable plant fluorescence is observed for PS II due to changes in plant physiological conditions, but this variable fluorescence is not observed for PS I [11,60,61]. SIF emission in the far-red band is performed by PS I and PS II, while SIF emission in the red band is mainly performed by PS II [11,62]. Therefore, theoretically, the SIF in the red contributed mostly by PS II shows greater responsiveness to changes in the physiological condition of vegetation [11]. Previously, several studies have reported the potential of red SIF in monitoring GPP. For example, Liu et al. [38] showed that after down-scaling the red SIF of the maize canopy to the photosystem level, an obvious improvement in the red SIF and GPP correlation was achieved. Their findings also showed that at the photosystem level, red SIF monitored GPP equally well or even better than far-red SIF, which indicated that after removing the effect of canopy reabsorption, red SIF could provide more effective information on plant photosynthesis and physiology and, thus, red SIF was more related to GPP than far-red SIF. Joiner et al. [58] also observed that fluorescence in the red band was more sensitive to GPP than fluorescence in the far-red band under drought stress. Hence, from a plant physiological perspective, the strong correlation between PSII and SIF Red may be one of the reasons for the performance of SIF Red being better than that of SIF Far-red in monitoring GPP in this alpine meadow ecosystem.
Last but not least, the red SIF showed a linear correlation with GPP in this alpine meadow ecosystem. That linear relationship between red SIF and GPP is more advantageous for GPP tracking than the nonlinear relationship between far-red SIF and GPP. Alpine meadow ecosystems are dominated by grasses with relatively low leaf area index values, and the resorption effect within the canopy is likely to be relatively small. However, during a period of vigorous vegetation growth, the SIF in the red band is probably inevitably affected by the reabsorption effect. For example, following the downscaling of grass and wheat canopy SIF to the photosystem level using the random forest method, Liu et al. [63] found that the correlation between red SIF at the photosystem level and chlorophyll absorption of photosynthetically active radiation was remarkably enhanced compared to red SIF at the canopy level. This also implied that the red SIF is mainly influenced by the internal reabsorption effect of leaves. Therefore, it is reasonable to speculate that the red SIF observed in the alpine meadow canopy was saturated due to the reabsorption effect. Moreover, many studies have confirmed that the relationship between GPP and absorption of photosynthetically active radiation is nonlinear and that GPP will saturate when the APAR reaches a certain level [40,56]. Therefore, the saturation phenomenon that occurred for both GPP and SIF Red resulted in a linear relationship between the two. While the far-red SIF is mainly affected by canopy scattering, and the effect of reabsorption on it can be basically ignored [43,63], thus the far-red SIF does not exist saturation phenomenon. When PAR reached a certain level, GPP no longer increased, while far-red SIF was still increasing, thus far-red SIF showed a nonlinear correlation with GPP in this alpine meadow ecosystem. As the time resolution of the data was reduced from half-hourly average to daily average, there was smoothing of the data noise and variance, which led to a reduction in the difference between the results of fitted SIF Far-red to GPP with nonlinear and linear functions under the daily averaged data. Nevertheless, from the trend of data distribution, whether half-hourly or daily averaged data, GPP showed a more linear relationship with red SIF than with far-red SIF.

4.2. Differences in the Response of S I F R e d /GPP and S I F F a r - r e d /GPP to Changes in Environmental Factors

How well synchronized the SIF and GPP are in response to environmental changes affects the accuracy of SIF estimation of GPP. Alpine meadow ecosystems are sensitive to environmental changes [3,5,6,7]. For the alpine meadow ecosystem at the AR site, the average annual Ta is low. Even in summer, frosts may still occur in the early morning [64]. The AR station is at high altitude and has high levels of harmful ultraviolet-B radiation, it also has sufficient radiation and sufficient hours of sunshine to allow plants to perform normal photosynthesis to maintain their organic growth. VPD also has a range of fluctuations in this alpine meadow ecosystem. The level of VPD has a direct effect on the stomatal conductance of plant leaves. Excessive VPD leads to decrease in stomatal conductance to prevent excessive water loss in plants, though this inevitably reduces the CO2 uptake of photosynthesis and affects the photosynthetic process.
In this research, the ratio of SIF Red /GPP was found more stable than SIF Far-red /GPP as environmental factors varied at the seasonal scale. We investigated the relationship between SIF Red -GPP and SIF Far-red -GPP with seasonal changes in PAR, Ta, and VPD at seasonal scales using the ratio of SIF to GPP. As Ta, VPD levels varied along the x-axis, SIF Red /GPP was able to remain relatively stable, and the boxes at different levels in Figure 4c,e were roughly on the same level, indicating that the sensitivity of SIF Red and GPP to changes in Ta and VPD were similar. Therefore, the magnitude of SIF Red /GPP values did not change obviously on the seasonal scale. Compared to the stability of SIF Red /GPP, the value of SIF Far-red /GPP showed a more obvious fluctuation with the variation of Ta and VPD and showed an increasing trend. Both Ta and VPD can cause physiological activity alterations in vegetation as Ta variations cause changes in photosynthetic enzyme activity, while VPD variations change the degree of opening of vegetation stomatal conductance. Red SIF is more closely correlated with changes in vegetation physiological activity and may provide more timely feedback than far-red SIF on physiological changes such as photosynthetic carbon assimilation due to environmental changes [11], and this may explain why SIF Red /GPP was more stable than SIF Far-red /GPP. As shown in Figure 4, when PAR levels varied along the x-axis, SIF Red /GPP also showed slight fluctuations after PAR reached a certain level, but obviously not as much as SIF Far-red /GPP. As discussed in Section 4.1, both the red SIF and GPP were probably saturated, but likely the degree of saturation was different for both, resulting in slight fluctuations in SIF Red /GPP. While saturation occurred in GPP, the far-red SIF value was still increasing, thus leading to large fluctuations with an increasing trend in the value of SIF Far-red /GPP. These results are consistent with the conclusions obtained in Figure 2.
PAR dominated the variation in the slope of the linear fitted line with zero intercept for SIF-GPP at the diurnal scale among the three environmental factors investigated in this research. At the diurnal scale, when PAR experienced an obvious drop, the slope of the linear fitted line between SIF and GPP changed by 107.14% on average, while when Ta and VPD had an obvious drop, the slope of the linear fitted line between SIF and GPP changed by only 13.68% on average. Thus, combining Figure 5 and Figure 6, it is evident that the slope variation of the linear fitted line of SIF versus GPP depended more on PAR than on Ta and VPD. The slope of the linear fitted line between SIF Red and GPP varied obviously less than that between SIF Far-red and GPP. This also indicated that the red SIF was more similar than the far-red SIF in response to environmental changes with GPP. Both red SIF and far-red SIF correlated stronger with GPP on the cloudy day than on the sunny day. This result is consistent with previous results in crops [31] and forests ecosystems [35]. On cloudy days, the proportion of scattered light increases, which penetrates into the lower leaves of the plant and the light-use efficiency of the plants gets improved [16,23], leading to a larger slope of the linear fitted of SIF to GPP.
Against the background of global climate change, alpine meadow ecosystems will face a very uncertain growth environment, in which changes in meteorological environmental factors will be unpredictable. The estimation of GPP in alpine meadow ecosystems urgently needs a stable indicator, and the results of this paper exactly demonstrated the potential of red SIF to track GPP in alpine meadow ecosystems when environmental changes occur.

4.3. Limitations and Uncertainties

Benefiting from the long-term and continuous observation capability of both the EC system and the Tower Platform Automated spectral observation system, we were able to explore the SIF-GPP relationship in alpine meadow ecosystems at the seasonal and daily scale as well as the response of their relationship to changes in environmental factor levels. However, several limitations and uncertainties still exist here. Firstly, there is a problem of footprint matching and spatial representativeness [65,66]. The spectral and flux observation are often prone to the problem of footprint mismatch [67]. At this research site, the EC system and the tower-based automatic spectral observation system were positioned on the same tower, and the spectral observation coverage was included in the flux observation coverage. The underlying surface of the AR station is flat and homogeneous, so the footprint mismatch problem was expected to have little impact on this study. However, given that only one alpine meadow ecosystem observation station at the AR site was involved, whether the conclusions obtained in this study are applicable to all alpine meadow ecosystems needs further study. Secondly, there is the problem of observation geometry. The probe of our tower-based platform automatic spectroscopic observation system was placed heading southwest. We have removed the observation data with solar azimuth angle greater than 80° in order to ensure the data quality. However, the change of solar azimuth angle through the day still lead to the appearance of shadows in the observation field of view, which would certainly introduce errors to the inversion of canopy SIF. The effect of solar observation geometry should be considered in future studies. Thirdly, we merely conducted observational studies on canopy-scale SIF and GPP in alpine meadows at AR stations, without involving the measurement of canopy structural and physiological parameters in alpine meadows, which should be included in future studies to enable us to analyze the relationship between SIF and GPP more comprehensively from a physiological perspective. Finally, recent studies have highlighted the excellent performance of NIRV in tracking GPP [68,69], but NIRV reflects more information on vegetation canopy structure [70], while SIF is directly related to vegetation photosynthetic processes [16]. In the future study, we will investigate the superior and inferior performance of NIRV and SIF in tracking GPP in alpine meadow ecosystems.

5. Conclusions

In this study, we acquired canopy spectral data, meteorological data, and flux data in 2019 and 2020 alpine meadow growing seasons using a continuous tower-based automated SIF and flux observation system to investigate SIF Red and SIF Far-red in terms of their performance in monitoring GPP in an alpine meadow ecosystem. Our results show that canopy SIF can effectively monitor GPP in alpine meadow ecosystem at both the seasonal and diurnal scales. In particular, SIF Red presented a linear relationship with GPP, while SIF Far-red presented a nonlinear relationship with GPP, and the performance of SIF Red for monitoring GPP was comparable to that of SIF Far-red . PAR, VPD, and Ta affected SIF Far-red /GPP more than SIF Red /GPP at the seasonal scale. Red SIF was more similar with GPP than far-red SIF in response to seasonal changes in environmental factors. PAR dominated the influence on the diurnal-scale variation of the SIF-GPP relationship among the three environmental impact factors considered in this research. Altogether, the red band SIF-GPP relationship was more robust when the environmental factors changed compared to the far-red band. The results of this study highlight the potential of utilizing red SIF for GPP monitoring in alpine meadow ecosystems.

Author Contributions

Conceptualization, W.D. and X.L.; software, W.D.; formal analysis, W.D.; investigation, W.D.; resources, X.L. and L.L.; data curation, W.D., J.C. and S.D.; writing—original draft preparation, W.D.; writing—review and editing, X.L., L.L. and X.J.; visualization, W.D.; funding acquisition, X.L., L.L. and X.J. All authors have read and agreed to the published version of the manuscript.

Funding

This research was funded by the National Natural Science Foundation of China, grant number 42071310, 41825002 and 42171394.

Data Availability Statement

The continuous observations of SIF and GPP in AR site is free to access at http://doi.org/10.5281/zenodo.6407548 (accessed on 2 April 2022).

Acknowledgments

The authors gratefully acknowledge the meteorological and flux data provided by National Tibetan Plateau Data Center (http://data.tpdc.ac.cn, accessed on 2 April 2022).

Conflicts of Interest

The authors declare that they have no known competing financial interest or personal relationships that could have appeared to influence the work reported in this paper.

References

  1. Gu, S.; Tang, Y.H.; Du, M.Y.; Kato, T.; Li, Y.N.; Cui, X.Y.; Zhao, X.Q. Short-term variation of CO2 flux in relation to environmental controls in an alpine meadow on the Qinghai-Tibetan Plateau. J. Geophys. Res. Atmos. 2003, 108. [Google Scholar] [CrossRef]
  2. Kato, T.; Tang, Y.H.; Gu, S.; Hirota, M.; Du, M.Y.; Li, Y.N.; Zhao, X.Q. Temperature and biomass influences on interannual changes in CO2 exchange in an alpine meadow on the Qinghai-Tibetan Plateau. Glob. Chang. Biol. 2006, 12, 1285–1298. [Google Scholar] [CrossRef]
  3. Wang, Y.Y.; Xiao, J.F.; Ma, Y.M.; Luo, Y.Q.; Hu, Z.Y.; Li, F.; Li, Y.N.; Gu, L.L.; Li, Z.G.; Yuan, L. Carbon fluxes and environmental controls across different alpine grassland types on the Tibetan Plateau. Agric. For. Meteorol. 2021, 311, 108694. [Google Scholar] [CrossRef]
  4. Saito, M.; Kato, T.; Tang, Y. Temperature controls ecosystem CO2 exchange of an alpine meadow on the northeastern Tibetan Plateau. Glob. Chang. Biol. 2009, 15, 221–228. [Google Scholar] [CrossRef]
  5. Wang, Y.Y.; Ma, Y.M.; Li, H.X.; Yuan, L. Carbon and water fluxes and their coupling in an alpine meadow ecosystem on the northeastern Tibetan Plateau. Theor. Appl. Climatol. 2020, 142, 1–18. [Google Scholar] [CrossRef]
  6. Wang, Y.X.; Sun, Y.; Chang, S.H.; Wang, Z.F.; Fu, H.; Zhang, W.G.; Hou, F.J. Restoration Practices Affect Alpine Meadow Ecosystem Coupling and Functions. Rangel. Ecol. Manag. 2020, 73, 441–451. [Google Scholar] [CrossRef]
  7. Zhang, T.; Zhang, Y.J.; Xu, M.J.; Zhu, J.; Chen, N.; Jiang, Y.B.; Huang, K.; Zu, J.X.; Liu, Y.J.; Yu, G.R. Water availability is more important than temperature in driving the carbon fluxes of an alpine meadow on the Tibetan Plateau. Agric. For. Meteorol. 2018, 256, 22–31. [Google Scholar] [CrossRef]
  8. Baldocchi, D.; Chu, H.; Reichstein, M. Inter-annual variability of net and gross ecosystem carbon fluxes: A review. Agric. For. Meteorol. 2018, 249, 520–533. [Google Scholar] [CrossRef] [Green Version]
  9. Liu, X.J.; Liu, Z.Q.; Liu, L.Y.; Lu, X.L.; Chen, J.D.; Du, S.S.; Zou, C. Modelling the influence of incident radiation on the SIF-based GPP estimation for maize. Agric. For. Meteorol. 2021, 307, 108522. [Google Scholar] [CrossRef]
  10. Wang, X.F.; Ma, M.G.; Huang, G.H.; Veroustraete, F.; Zhang, Z.H.; Song, Y.; Tan, J.L. Vegetation primary production estimation at maize and alpine meadow over the Heihe River Basin, China. Int. J. Appl. Earth Obs. Geoinf. 2012, 17, 94–101. [Google Scholar] [CrossRef]
  11. Guanter, L.; Zhang, Y.G.; Jung, M.; Joiner, J.; Voigt, M.; Berry, J.A.; Frankenberg, C.; Huete, A.R.; Zarco-Tejada, P.; Lee, J.E.; et al. Global and time-resolved monitoring of crop photosynthesis with chlorophyll fluorescence. Proc. Natl. Acad. Sci. USA 2014, 111, E1327–E1333. [Google Scholar] [CrossRef] [PubMed] [Green Version]
  12. Hilker, T.; Coops, N.C.; Wulder, M.A.; Black, T.A.; Guy, R.D. The use of remote sensing in light use efficiency based models of gross primary production: A review of current status and future requirements. Sci. Total Environ. 2008, 404, 411–423. [Google Scholar] [CrossRef] [PubMed] [Green Version]
  13. Li, X.; Xiao, J.F.; He, B.B.; Altaf Arain, M.; Beringer, J.; Desai, A.R.; Emmel, C.; Hollinger, D.Y.; Krasnova, A.; Mammarella, I.; et al. Solar-induced chlorophyll fluorescence is strongly correlated with terrestrial photosynthesis for a wide variety of biomes: First global analysis based on OCO-2 and flux tower observations. Glob. Chang. Biol. 2018, 24, 3990–4008. [Google Scholar] [CrossRef] [PubMed]
  14. Goulas, Y.; Fournier, A.; Daumard, F.; Champagne, S.; Ounis, A.; Marloie, O.; Moya, I. Gross Primary Production of a Wheat Canopy Relates Stronger to Far Red Than to Red Solar-Induced Chlorophyll Fluorescence. Remote Sens. 2017, 9, 97. [Google Scholar] [CrossRef] [Green Version]
  15. Baker, N.R. Chlorophyll fluorescence: A probe of photosynthesis in vivo. Annu. Rev. Plant Biol. 2008, 59, 89–113. [Google Scholar] [CrossRef] [Green Version]
  16. Porcar-Castell, A.; Tyystjarvi, E.; Atherton, J.; van der Tol, C.; Flexas, J.; Pfundel, E.E.; Moreno, J.; Frankenberg, C.; Berry, J.A. Linking chlorophyll a fluorescence to photosynthesis for remote sensing applications: Mechanisms and challenges. J. Exp. Bot. 2014, 65, 4065–4095. [Google Scholar] [CrossRef]
  17. Sun, Y.; Frankenberg, C.; Wood, J.D.; Schimel, D.S.; Jung, M.; Guanter, L.; Drewry, D.T.; Verma, M.; Porcar-Castell, A.; Griffis, T.J.; et al. OCO-2 advances photosynthesis observation from space via solar-induced chlorophyll fluorescence. Science 2017, 358, eaam5747. [Google Scholar] [CrossRef] [Green Version]
  18. Krause, G.H.; Weis, E. Chlorophyll fluorescence and photosynthesis the basics. Annu. Rev. Plant Physiol. 1991, 42, 313–349. [Google Scholar] [CrossRef]
  19. Frankenberg, C.; Fisher, J.B.; Worden, J.; Badgley, G.; Saatchi, S.S.; Lee, J.-E.; Toon, G.C.; Butz, A.; Jung, M.; Kuze, A.; et al. New global observations of the terrestrial carbon cycle from GOSAT: Patterns of plant fluorescence with gross primary productivity. Geophys. Res. Lett. 2011, 38. [Google Scholar] [CrossRef] [Green Version]
  20. Yang, P.Q.; van der Tol, C.; Verhoef, W.; Damm, A.; Schickling, A.; Kraska, T.; Muller, O.; Rascher, U. Using reflectance to explain vegetation biochemical and structural effects on sun-induced chlorophyll fluorescence. Remote Sens. Environ. 2019, 231, 110996. [Google Scholar] [CrossRef]
  21. Zhang, Z.; Zhang, Y.; Chen, J.M.; Ju, W.; Migliavacca, M.; El-Madany, T.S. Sensitivity of Estimated Total Canopy SIF Emission to Remotely Sensed LAI and BRDF Products. J. Remote Sens. 2021, 2021, 9795837. [Google Scholar] [CrossRef]
  22. Miao, G.F.; Guan, K.Y.; Suyker, A.E.; Yang, X.; Arkebauer, T.J.; Walter-Shea, E.A.; Kimm, H.; Hmimina, G.Y.; Gamon, J.A.; Franz, T.E.; et al. Varying Contributions of Drivers to the Relationship Between Canopy Photosynthesis and Far-Red Sun-Induced Fluorescence for Two Maize Sites at Different Temporal Scales. J. Geophys. Res. Biogeosci. 2020, 125, e2019JG005051. [Google Scholar] [CrossRef] [Green Version]
  23. Chen, J.D.; Liu, X.J.; Du, S.S.; Ma, Y.; Liu, L.Y. Integrating SIF and Clearness Index to Improve Maize GPP Estimation Using Continuous Tower-Based Observations. Sensors 2020, 20, 2493. [Google Scholar] [CrossRef]
  24. Liu, L.Y.; Guan, L.L.; Liu, X.J. Directly estimating diurnal changes in GPP for C3 and C4 crops using far-red sun-induced chlorophyll fluorescence. Agric. For. Meteorol. 2017, 232, 1–9. [Google Scholar] [CrossRef]
  25. Yang, K.G.; Ryu, Y.; Dechant, B.; Berry, J.A.; Hwang, Y.; Jiang, C.; Kang, M.; Kim, J.; Kimm, H.; Kornfeld, A.; et al. Sun-induced chlorophyll fluorescence is more strongly related to absorbed light than to photosynthesis at half-hourly resolution in a rice paddy. Remote Sens. Environ. 2018, 216, 658–673. [Google Scholar] [CrossRef]
  26. Magney, T.S.; Bowling, D.R.; Logan, B.A.; Grossmann, K.; Stutz, J.; Blanken, P.D.; Burns, S.P.; Cheng, R.; Garcia, M.A.; Köhler, P.; et al. Mechanistic evidence for tracking the seasonality of photosynthesis with solar-induced fluorescence. Proc. Natl. Acad. Sci. USA 2019, 116, 11640–11645. [Google Scholar] [CrossRef] [Green Version]
  27. Liu, Z.Q.; Lu, X.L.; An, S.Q.; Heskel, M.; Yang, H.L.; Tang, J.W. Advantage of multi-band solar-induced chlorophyll fluorescence to derive canopy photosynthesis in a temperate forest. Agric. For. Meteorol. 2019, 279, 107691. [Google Scholar] [CrossRef]
  28. Yang, H.L.; Yang, X.; Zhang, Y.G.; Heskel, M.A.; Lu, X.L.; Munger, J.W.; Sun, S.C.; Tang, J.W. Chlorophyll fluorescence tracks seasonal variations of photosynthesis from leaf to canopy in a temperate forest. Glob. Chang. Biol. 2017, 23, 2874–2886. [Google Scholar] [CrossRef]
  29. Huang, Y.; Cheng, Z.; Du, M.H.; Wu, P.F.; Yuan, L.; Tang, J.W. Tidal influence on the relationship between solar-induced chlorophyll fluorescence and canopy photosynthesis in a coastal salt marsh. Remote Sens. Environ. 2022, 270, 112865. [Google Scholar] [CrossRef]
  30. Miao, G.F.; Guan, K.Y.; Yang, X.; Bernacchi, C.J.; Berry, J.A.; DeLucia, E.H.; Wu, J.; Moore, C.E.; Meacham, K.; Cai, Y.P.; et al. Sun-Induced Chlorophyll Fluorescence, Photosynthesis, and Light Use Efficiency of a Soybean Field from Seasonally Continuous Measurements. J. Geophys. Res. Biogeosci. 2018, 123, 610–623. [Google Scholar] [CrossRef]
  31. Li, Z.H.; Zhang, Q.; Li, J.; Yang, X.; Wu, Y.F.; Zhang, Z.Y.; Wang, S.H.; Wang, H.Z.; Zhang, Y.G. Solar-induced chlorophyll fluorescence and its link to canopy photosynthesis in maize from continuous ground measurements. Remote Sens. Environ. 2020, 236, 111420. [Google Scholar] [CrossRef]
  32. Halubok, M.; Yang, Z.L. Estimating Crop and Grass Productivity over the United States Using Satellite Solar-Induced Chlorophyll Fluorescence, Precipitation and Soil Moisture Data. Remote Sens. 2020, 12, 3434. [Google Scholar] [CrossRef]
  33. Wang, S.H.; Zhang, Y.G.; Ju, W.; Porcar-Castell, A.; Ye, S.S.; Zhang, Z.Y.; Brümmer, C.; Urbaniak, M.; Mammarella, I.; Juszczak, R.; et al. Warmer spring alleviated the impacts of 2018 European summer heatwave and drought on vegetation photosynthesis. Agric. For. Meteorol. 2020, 295, 108195. [Google Scholar] [CrossRef]
  34. Martini, D.; Sakowska, K.; Wohlfahrt, G.; Pacheco-Labrador, J.; van der Tol, C.; Porcar-Castell, A.; Magney, T.S.; Carrara, A.; Colombo, R.; El-Madanay, T.; et al. Heatwave breaks down the linearity between sun-induced fluorescence and gross primary production. New Phytol. 2021, 233, 2415–2428. [Google Scholar] [CrossRef]
  35. Cheng, X.F.; Zhou, Y.; Hu, M.J.; Wang, F.; Huang, H.; Zhang, J.S. The Links between Canopy Solar-Induced Chlorophyll Fluorescence and Gross Primary Production Responses to Meteorological Factors in the Growing Season in Deciduous Broadleaf Forest. Remote Sens. 2021, 13, 2363. [Google Scholar] [CrossRef]
  36. Kim, J.M.; Ryu, Y.; Dechant, B.; Lee, H.; Kim, H.S.; Kornfeld, A.; Berry, J.A. Solar-induced chlorophyll fluorescence is non-linearly related to canopy photosynthesis in a temperate evergreen needleleaf forest during the fall transition. Remote Sens. Environ. 2021, 258, 112362. [Google Scholar] [CrossRef]
  37. Grossmann, K.; Frankenberg, C.; Magney, T.S.; Hurlock, S.C.; Seibt, U.; Stutz, J. PhotoSpec: A new instrument to measure spatially distributed red and far-red Solar-Induced Chlorophyll Fluorescence. Remote Sens. Environ. 2018, 216, 311–327. [Google Scholar] [CrossRef] [Green Version]
  38. Liu, X.J.; Liu, L.Y.; Hu, J.C.; Guo, J.; Du, S.S. Improving the potential of red SIF for estimating GPP by downscaling from the canopy level to the photosystem level. Agric. For. Meteorol. 2020, 281, 107846. [Google Scholar] [CrossRef]
  39. Zhu, X.D.; Hou, Y.W.; Zhang, Y.G.; Lu, X.L.; Liu, Z.Q.; Weng, Q.H. Potential of Sun-Induced Chlorophyll Fluorescence for Indicating Mangrove Canopy Photosynthesis. J. Geophys. Res. Biogeosci. 2021, 126, e2020JG006159. [Google Scholar] [CrossRef]
  40. Yang, J.C.; Magney, T.S.; Albert, L.P.; Richardson, A.D.; Frankenberg, C.; Stutz, J.; Grossmann, K.; Burns, S.P.; Seyednasrollah, B.; Blanken, P.D.; et al. Gross primary production (GPP) and red solar induced fluorescence (SIF) respond differently to light and seasonal environmental conditions in a subalpine conifer forest. Agric. For. Meteorol. 2022, 317, 108904. [Google Scholar] [CrossRef]
  41. Chen, A.P.; Mao, J.F.; Ricciuto, D.; Xiao, J.F.; Frankenberg, C.; Li, X.; Thornton, P.E.; Gu, L.H.; Knapp, A.K. Moisture availability mediates the relationship between terrestrial gross primary production and solar-induced chlorophyll fluorescence Insights from global-scale variations. Glob. Chang. Biol. 2020, 27, 1144–1156. [Google Scholar] [CrossRef] [PubMed]
  42. Chen, A.P.; Mao, J.F.; Ricciuto, D.; Lu, D.; Xiao, J.F.; Li, X.; Thornton, P.E.; Knapp, A.K. Seasonal changes in GPP/SIF ratios and their climatic determinants across the Northern Hemisphere. Glob. Chang. Biol. 2021, 27, 5186–5197. [Google Scholar] [CrossRef] [PubMed]
  43. Yang, P.Q.; van der Tol, C. Linking canopy scattering of far-red sun-induced chlorophyll fluorescence with reflectance. Remote Sens. Environ. 2018, 209, 456–467. [Google Scholar] [CrossRef]
  44. Zhang, Y.G.; Zhang, Q.; Liu, L.Y.; Zhang, Y.J.; Wang, S.Q.; Ju, W.M.; Zhou, G.S.; Zhou, L.; Tang, J.W.; Zhu, X.D.; et al. ChinaSpec: A Network for Long-Term Ground-Based Measurements of Solar-Induced Fluorescence in China. J. Geophys. Res. Biogeosci. 2021, 126, e2020JG006042. [Google Scholar] [CrossRef]
  45. Li, X.; Cheng, G.D.; Liu, S.M.; Xiao, Q.; Ma, M.G.; Jin, R.; Che, T.; Liu, Q.H.; Wang, W.Z.; Qi, Y.; et al. Heihe Watershed Allied Telemetry Experimental Research (HiWATER): Scientific Objectives and Experimental Design. Bull. Am. Meteorol. Soc. 2013, 94, 1145–1160. [Google Scholar] [CrossRef]
  46. Du, S.S.; Liu, L.Y.; Liu, X.J.; Guo, J.; Hu, J.C.; Wang, S.Q.; Zhang, Y.G. SIFSpec: Measuring Solar-Induced Chlorophyll Fluorescence Observations for Remote Sensing of Photosynthesis. Sensors 2019, 19, 3009. [Google Scholar] [CrossRef] [Green Version]
  47. Meroni, M.; Rossini, M.; Picchi, V.; Panigada, C.; Cogliati, S.; Nali, C.; Colombo, R. Assessing Steady-state Fluorescence and PRI from Hyperspectral Proximal Sensing as Early Indicators of Plant Stress: The Case of Ozone Exposure. Sensors 2008, 8, 1740. [Google Scholar] [CrossRef] [Green Version]
  48. Liu, S.M.; Xu, Z.W.; Wang, W.Z.; Jia, Z.Z.; Zhu, M.J.; Bai, J.; Wang, J.M. A comparison of eddy-covariance and large aperture scintillometer measurements with respect to the energy balance closure problem. Hydrol. Earth Syst. Sci. 2011, 15, 1291–1306. [Google Scholar] [CrossRef] [Green Version]
  49. Liu, S.M.; Li, X.; Xu, Z.W.; Che, T.; Xiao, Q.; Ma, M.G.; Liu, Q.H.; Jin, R.; Guo, J.W.; Wang, L.X.; et al. The Heihe Integrated Observatory Network: A Basin-Scale Land Surface Processes Observatory in China. Vadose Zone J. 2018, 17, 1–21. [Google Scholar] [CrossRef]
  50. Lasslop, G.; Reichstein, M.; Papale, D.; Richardson, A.D.; Arneth, A.; Barr, A.; Stoy, P.; Wohlfahrt, G. Separation of net ecosystem exchange into assimilation and respiration using a light response curve approach: Critical issues and global evaluation. Glob. Chang. Biol. 2010, 16, 187–208. [Google Scholar] [CrossRef] [Green Version]
  51. Meroni, M.; Rossini, M.; Guanter, L.; Alonso, L.; Rascher, U.; Colombo, R.; Moreno, J. Remote sensing of solar-induced chlorophyll fluorescence: Review of methods and applications. Remote Sens. Environ. 2009, 113, 2037–2051. [Google Scholar] [CrossRef]
  52. Meroni, M.; Busetto, L.; Colombo, R.; Guanter, L.; Moreno, J.; Verhoef, W. Performance of Spectral Fitting Methods for vegetation fluorescence quantification. Remote Sens. Environ. 2010, 114, 363–374. [Google Scholar] [CrossRef]
  53. Damm, A.; Guanter, L.; Paul-Limoges, E.; van der Tol, C.; Hueni, A.; Buchmann, N.; Eugster, W.; Ammann, C.; Schaepman, M.E. Far-red sun-induced chlorophyll fluorescence shows ecosystem-specific relationships to gross primary production: An assessment based on observational and modeling approaches. Remote Sens. Environ. 2015, 166, 91–105. [Google Scholar] [CrossRef]
  54. Paul-Limoges, E.; Damm, A.; Hueni, A.; Liebisch, F.; Eugster, W.; Schaepman, M.E.; Buchmann, N. Effect of environmental conditions on sun-induced fluorescence in a mixed forest and a cropland. Remote Sens. Environ. 2018, 219, 310–323. [Google Scholar] [CrossRef]
  55. Zhang, Y.; Guanter, L.; Berry, J.A.; van der Tol, C.; Yang, X.; Tang, J.; Zhang, F. Model-based analysis of the relationship between sun-induced chlorophyll fluorescence and gross primary production for remote sensing applications. Remote Sens. Environ. 2016, 187, 145–155. [Google Scholar] [CrossRef] [Green Version]
  56. Gu, L.H.; Han, J.M.; Wood, J.D.; Chang, C.Y.; Sun, Y. Sun-induced Chl fluorescence and its importance for biophysical modeling of photosynthesis based on light reactions. New Phytol. 2019, 223, 1179–1191. [Google Scholar] [CrossRef] [Green Version]
  57. Liu, L.Y.; Liu, X.J.; Hu, J.C.; Guan, L.L. Assessing the wavelength-dependent ability of solar-induced chlorophyll fluorescence to estimate the GPP of winter wheat at the canopy level. Int. J. Remote Sens. 2017, 38, 4396–4417. [Google Scholar] [CrossRef]
  58. Joiner, J.; Yoshida, Y.; Guanter, L.; Middleton, E.M. New methods for retrieval of chlorophyll red fluorescence from hyper-spectral satellite instruments: Simulations and application to GOME-2 and SCIAMACHY. Atmos. Meas. Tech. 2016, 9, 3939–3967. [Google Scholar] [CrossRef] [Green Version]
  59. Verrelst, J.; van der Tol, C.; Magnani, F.; Sabater, N.; Rivera, J.P.; Mohammed, G.; Moreno, J. Evaluating the predictive power of sun-induced chlorophyll fluorescence to estimate net photosynthesis of vegetation canopies: A SCOPE modeling study. Remote Sens. Environ. 2016, 176, 139–151. [Google Scholar] [CrossRef]
  60. Kautsky, H.; Appel, W.; Amann, H. Chlorophyll fluorescence and carbon assimilation. Part XIII. The fluorescence and the photochemistry of plants. Biochem. Z. 1960, 332, 277–292. [Google Scholar]
  61. Romero, J.M.; Cordon, G.B.; Lagorio, M.G. Re-absorption and scattering of chlorophyll fluorescence in canopies: A revised approach. Remote Sens. Environ. 2020, 246, 111860. [Google Scholar] [CrossRef]
  62. Govindjee; Papageorgiou, G.C. Chlorophyll a Fluorescence: A Signature of Photosynthesis; Springer: Dordrecht, The Netherlands, 2004. [Google Scholar]
  63. Liu, X.J.; Guanter, L.; Liu, L.Y.; Damm, A.; Malenovský, Z.; Rascher, U.; Peng, D.L.; Du, S.S.; Gastellu-Etchegorry, J.-P. Downscaling of solar-induced chlorophyll fluorescence from canopy level to photosystem level using a random forest model. Remote Sens. Environ. 2019, 231, 110772. [Google Scholar] [CrossRef]
  64. Chen, J.; Shen, M.G.; Kato, T. Diurnal and seasonal variations in light-use efficiency in an alpine meadow ecosystem: Causes and implications for remote sensing. J. Plant Ecol. 2009, 2, 173–185. [Google Scholar] [CrossRef]
  65. Qiu, R.; Han, G.; Ma, X.; Sha, Z.; Shi, T.; Xu, H.; Zhang, M. CO2 Concentration, A Critical Factor Influencing the Relationship between Solar-induced Chlorophyll Fluorescence and Gross Primary Productivity. Remote Sens. 2020, 12, 1377. [Google Scholar] [CrossRef]
  66. Qiu, R.; Han, G.; Ma, X.; Xu, H.; Shi, T.; Zhang, M. A Comparison of OCO-2 SIF, MODIS GPP, and GOSIF Data from Gross Primary Production (GPP) Estimation and Seasonal Cycles in North America. Remote Sens. 2020, 12, 258. [Google Scholar] [CrossRef] [Green Version]
  67. Liu, X.J.; Liu, L.Y.; Hu, J.C.; Du, S.S. Modeling the footprint and equivalent radiance transfer path length for tower-based hemispherical observations of chlorophyll fluorescence. Sensors 2017, 17, 1131. [Google Scholar] [CrossRef] [Green Version]
  68. Badgley, G.; Field, C.B.; Berry, J.A. Canopy near-infrared reflectance and terrestrial photosynthesis. Sci. Adv. 2017, 3, e1602244. [Google Scholar] [CrossRef] [Green Version]
  69. Liu, L.; Liu, X.; Chen, J.; Du, S.; Ma, Y.; Qian, X.; Chen, S.; Peng, D. Estimating maize GPP using near-infrared radiance of vegetation. Sci. Remote Sens. 2020, 2, 100009. [Google Scholar] [CrossRef]
  70. Zeng, Y.; Chen, M.; Hao, D.; Damm, A.; Badgley, G.; Rascher, U.; Johnson, J.E.; Dechant, B.; Siegmann, B.; Ryu, Y.; et al. Combining near-infrared radiance of vegetation and fluorescence spectroscopy to detect effects of abiotic changes and stresses. Remote Sens. Environ. 2022, 270, 11285. [Google Scholar] [CrossRef]
Figure 1. AR’s observation tower and pictures of the alpine meadow in spring, summer, and autumn captured by the camera mounted above the tower.
Remotesensing 14 02740 g001
Figure 2. Seasonal patterns of (a) the canopy solar-induced chlorophyll fluorescence at the far-red band ( SIF Far-red ), (b) the canopy solar-induced chlorophyll fluorescence at the red band ( SIF Red ), (c) gross primary productivity (GPP), (d) photosynthetically active radiation (PAR), (e) normalized difference vegetation index (NDVI) at AR site in the growing seasons in 2019 (left) and 2020 (right). The dark large dots represent daily averaged data, and the light small dots represent half-hourly averaged data.
Remotesensing 14 02740 g002
Figure 3. The relationship between SIF Red (a), SIF Far-red (b), and GPP at the seasonal scale at the AR site, large green dots represent daily averaged data, small gray dots represent half-hourly averaged data, the dashed lines represent linear fit lines, the solid lines represent non-linear fit lines, and the green and gray lines represent the daily averaged data fit lines and the half-hourly averaged data fit lines of SIF and GPP, respectively.
Remotesensing 14 02740 g003
Figure 4. Boxplots show the variation of values of SIF Red /GPP and SIF Far-red /GPP at different levels of environmental factors including (a,b) photosynthetically active radiation (PAR), (c,d) air temperature (Ta), and (e,f) vapor pressure deficit (VPD) at AR site during the 2019 (left) and 2020 (right) growing seasons with half-hourly averaged data. Red plus signs in the figure represent outliers.
Remotesensing 14 02740 g004
Figure 5. Scatter plot of the fitted relationship between (a) SIF Red , (b) SIF Far-red , and GPP at the diurnal scale and daily variations of (c) air temperature (Ta), (d) vapor pressure deficit (VPD), and (e) photosynthetically active radiation (PAR) for DOY220 and DOY227 in 2020 at AR site. The scatter points represent half-hourly averaged data, the solid line represents the fitted line of the SIF-GPP relationship, and the shaded area indicates the 95% confidence level of the prediction, where red represents DOY227, and blue represents DOY220.
Remotesensing 14 02740 g005
Figure 6. Scatter plot of the fitted relationship between (a) SIF Red , (b) SIF Far-red , and GPP at the diurnal scale and daily variations of (c) air temperature (Ta), (d) vapor pressure deficit (VPD), and (e) photosynthetically active radiation (PAR) for a typical sunny day and cloudy day at AR site. The scatter points represent half-hourly averaged data, the solid line represents the fitted line of the SIF-GPP relationship, and the shaded area indicates the 95% confidence level of the prediction, where red represents sunny day and blue represents cloudy day.
Remotesensing 14 02740 g006
Table 1. Statistical results of linear and nonlinear fitting for SIF Red and SIF Far-red with GPP.
Temporal ResolutionHalf-HourlyDaily
Mathematical Function ModelLinearNonlinearLinearNonlinear
SIF Red Formula y = 57.23 x y = 43.69 x + 0.40 x + 0.45 y = 62.52 x y = 79.24 x + 3.09 x + 1.23
R20.800.830.800.81
RMSE3.802.892.762.21
SIF Far-red Formula y = 31.84 x y = 29.99 x + 0.37 x + 0.36 y = 35.97 x y = 33.46 x + 1.05 x + 0.55
R20.700.790.790.82
RMSE5.153.233.482.11
Publisher’s Note: MDPI stays neutral with regard to jurisdictional claims in published maps and institutional affiliations.

