Article

Potential Applications of CE-2 Microwave Radiometer Data in Understanding Basaltic Volcanism in Heavily Ejecta-Contaminated Mare Frigoris

1
College of Geoexploration Science and Technology, Jilin University, Changchun 130026, China
2
The State Key Laboratory of Lunar and Planetary Sciences, Macau University of Science and Technology, Macau 999078, China
3
Institute of Deep Earth Science and Green Energy, Shenzhen University, Shenzhen 518060, China
4
Key Laboratory of Lunar and Deep Space Exploration, National Astronomical Observatory, Chinese Academy of Sciences, Beijing 100012, China
5
School of Space Science and Astronomy, University of Chinese Academy of Sciences, Beijing 100049, China
*
Author to whom correspondence should be addressed.
Remote Sens. 2022, 14(11), 2725; https://doi.org/10.3390/rs14112725
Submission received: 9 May 2022 / Revised: 2 June 2022 / Accepted: 4 June 2022 / Published: 6 June 2022
(This article belongs to the Special Issue Planetary Geologic Mapping and Remote Sensing)

Abstract

:
Mare Frigoris is the fifth largest and almost northernmost mare located on the near side of the Moon. Mare Frigoris has an elongated shape, with a length of approximately 1500 km and a width of approximately 200 km, which makes it susceptible to becoming contaminated by the impact ejecta from the nearby highlands. Comparatively speaking, microwave radiometer (MRM) data have good penetration capabilities. Therefore, the MRM data from Chang’e-2 satellite were employed to study the volumetric thermal emission features of basaltic deposits in Mare Frigoris. Combining the MRM data with the basaltic units with FeO and TiO2 abundances identified using the small crater rim and ejecta probing (SCREP) methodology and with the gravity from Gravity Recovery and Interior Laboratory (GRAIL), the four potential conclusions that were obtained are as follows: (1) The MRM data are strongly related to the (FeO + TiO2) abundance of pristine basalts and are less influenced by ejecta contamination; (2) in every quadrant of Mare Frigoris, the (FeO + TiO2) abundance of the basalt decreases with an increase in age; (3) at least in Mare Frigoris, the main influencing factor regarding the brightness temperature remains the (FeO + TiO2) abundance of surface deposits; (4) a warm microwave anomaly was revealed in the western-central and eastern-central areas of Mare Frigoris which has a strong relationship with the positive Bouguer gravity anomaly derived from GRAIL data in terms of spatial distribution. The results are significant in the context of improving our understanding the basaltic igneous rock and thermal evolution of the Moon using MRM data.

1. Introduction

Mare Frigoris is the fifth largest and northernmost lunar mare on the near side of the Moon. The mare extends from about 55°W to 45°E, with an average latitudinal extent of only 7.5° (Figure 1) [1,2,3]. In Mare Frigoris, there are light plain deposits, stress fractures, volcanic vents, rilles, pyroclastic deposits, cryptomare, and mare basalts, all of which have been identified mainly using optical remote sensing data [1,2,3,4,5]. With gravitational potential derived from the Gravity Recovery and Interior Laboratory (GRAIL) mission data, Andrews-Hanna et al. [6] suggested the existence of buried, ancient igneous intrusions in the mare. Thus, the study of Mare Frigoris can provide essential information on the basaltic volcanism and thermal evolution of the Moon.
To accurately assess the basaltic volcanism of the Moon, it is necessary to characterize the pristine compositions of basaltic deposits [2]. Traditionally, basaltic units were mapped and their compositions estimated mainly by using ultraviolet, visible, and infrared data [1,7,8,9,10,11]. However, Mare Frigoris is narrow, and, therefore, ejecta from highland craters reach its central portions and obscure the basalt deposits more easily compared to large circular maria [1,2]. In addition, several large craters exist in Mare Frigoris, including the Harpalus crater (43.5°W, 52.7°N), which has a diameter of 40 km, and the Aristoteles crater (17.3°E, 50.2°N), which has a diameter of 88 km (Figure 1), the ejecta from which have heavily decreased the (FeO + TiO2) abundance (FTA) of nearby mare deposits in the shallow layer [2]. This makes it difficult to infer the pristine compositions of the basaltic deposits of Mare Frigoris using optical data, as indicated by Figure 1.
To reduce the influence of the impact ejecta on the surface mafic contents of basaltic units, Kramer et al. [2,12,13] and Weider et al. [14] proposed the small crater rim and ejecta probing (SCREP) methodology, which collects composition information from small, immature impact craters that have penetrated the surface regolith. The SCREP methodology is considered the best approach to evaluate the pristine compositions of underlying basaltic units. Combined with the superposition of adjacent basaltic units and the FeO and TiO2 abundances of the candidate 1533 SCREP craters, a new map of basaltic volcanism in Mare Frigoris was provided by Kramer et al. [2]. Using remote sensing data mainly from a Clementine Ultraviolet-Visible (UVVIS) camera and the Lunar Reconnaissance Orbiter (LRO) Wide Angle Camera (WAC), Kramer et al. [2] mapped 22 basaltic units, fewer than the 37 units previously mapped by Hiesinger et al. [10].
Generally, the penetration depth of optical remote sensing instruments is only several micrometers [15,16,17], which, combined with heavy surface contamination, has severely limited the application of optical data in the context of understanding basaltic volcanism in Mare Frigoris. Comparatively, the microwave radiometer (MRM) onboard the Chang’e (CE)-1 and -2 satellites, operated at microwave range and combined with the measured brightness temperature (TB), can reflect the dielectric properties of the lunar regolith at the corresponding penetration depths [15,17,18]. Moreover, MRM data have been proven to be highly correlated with the compositions of the regolith within the penetration depth [17,19]. At such depth, the deposits are less influenced by space weathering and less contaminated by the ejecta from nearby and distant impact events [20,21]. Thus, MRM data can provide a new potential choice to assess the basaltic units with heavy surface contamination in the maria on the Moon.
In this work, the MRM data from the CE-2 satellite were applied to assess the basaltic units in Mare Frigoris. Section 2 presents the process procedures for the CE-2 MRM data, the Clementine UVVIS data, and the GRAIL data. In Section 3, the microwave thermal emission features of the basaltic units are described, and the boundaries and ages of the basaltic units are assessed. Section 4 presents the potential application of the MRM data in understanding the basaltic volcanism and thermal evolution of Mare Frigoris. The conclusions are provided in Section 5.

2. Data Processing

The TB maps of Mare Frigoris were derived from the CE-2 MRM data. To test the TB anomaly and the mare’s deep structure, the FeO, TiO2, and Bouguer gravity anomaly maps were generated using the Clementine UVVIS data and GRAIL data, respectively.

2.1. CE-2 MRM Data Processing

From 15 October 2010 to 20 May 20 2011, the CE-2 MRM instrument measured the lunar surface for more than 5000 earth hours and operated at 3.0 GHz, 7.8 GHz, 19.35 GHz, and 37 GHz [22,23]. The integration time of the CE-2 MRM instrument is 200 ms, the observation angle is 0°, and the temperature sensitivity is approximately 0.5 K [22,24]. At an orbital altitude of approximately 100 km, the resolution of the MRM data is about 25 km at 3.0 GHz and 17.5 km at 7.8, 19.35, and 37 GHz. This study adopted the 2C level data after system calibration and geometric correction, obtained from the Lunar and Planetary Data Release System (https://moon.bao.ac.cn/ce5web/moonGisMap.search, accessed on 1 September 2019). For a description of the CE-2 MRM data, please see Zheng et al. [23] and Cai and Lan [25].

2.1.1. TB Maps Generation

The method of generating TB maps which was adopted in this study has been thoroughly described by Chan et al. [26], Cai and Lan [25], and Meng et al. [17,27]. According to a theoretical simulation using microwave radiative transfer equations, the TB of surface deposits is highly dependent on the surface temperature, which is dominated by the surface solar illumination and changes greatly with the lunation time [24,28]. Thus, the hour angle is introduced to describe the observed MRM points in terms of twenty-four lunation hours. However, for the special geometry of Mare Frigoris, it is difficult to generate TB maps with the sufficient MRM data points within one lunation hour. Thus, a new data selection method was proposed.
According to the geographical range of Mare Frigoris, 344,752 MRM data points was selected, and the local hours of every MRM data point were then calculated using the method provided by Chan et al. [26] and Zheng et al. [22,23]. Then, the histogram of the MRM data points in one lunation represented by the hour angles was counted (Figure 2a), which showed that the MRM data were concentrated around several time spans. After a comparison, we found that the data points from 12:26 to 13:08 and from 0:00 to 0:39 were enough to cover the whole of Mare Frigoris (Figure 2b,c). Therefore, the data points of the two time spans were extracted to generate TB maps at four channels using the linear interpolation method, and the spatial resolution was 0.25° × 0.25° (Figure 3, 37 GHz). The TB performances of the basaltic units at noon and night were represented by the observation from 12:26 to 13:08 and from 0:00 to 0:39, respectively. To clearly understand the thermophysical properties of basaltic deposits in Mare Frigoris, the boundaries of the basaltic units mapped by Kramer et al. [2] were vectorized and overlaid on the TB maps.
The reliability of MRM data has been proven by Zheng et al. [22,23] and Cai and Lan [25], and our TB maps are identical to the previous results. Moreover, the TB maps in other hour spans were also generated and the TB performances were consistent in terms of the basaltic units, indicating the stability of the MRM data. What is more, Figure 3 shows a good correlation between the TB performances and the large craters, including Harpalus and Aristoteles. Particularly, the noon TB is enhanced in the southern slope of these craters, which are oriented towards solar illumination, and reduced in the northern slope. Furthermore, Figure 3 shows that the mare unit with high a FTA marked WF5 in the southwestern part of Mare Frigoris shows a high noon TB and low night TB, which is consistent with theoretical simulation result using microwave radiative transfer equations which show that the TB of deposits with a higher FTA will be higher at noon and lower at night when compared with deposits with a lower FTA [24,28]. Thus, the generated TB maps are rational.

2.1.2. nTB and TBD Maps Generation

Figure 3 shows an obvious N-S trend, demonstrating that the TB is higher in the south and lower in the north. Here, according to the latitude within and beyond Mare Frigoris, the change in TB is up to 40 K, which is much higher than the 12-K variation among the basaltic units within Mare Frigoris. This apparently decreases the dynamic range of the TB values in Mare Frigoris; thus, the following two steps were adopted to weaken the N-S trend of the TB and to enhance the TB performances of the mare units.
The first step was to exclude the nearby highlands by employing the traditional image cutting method according to the range of Mare Frigoris. Since the highest TB occurs in Sinus Iridum and the lowest TB occurs in the north highlands, such a process can, relatively speaking, enlarge the dynamic TB range in the cropped figures.
The second step was to operate normalized TB (nTB) mapping and TB difference (TBD) mapping, a method which was proposed by Meng et al. [17,27] to enhance the relationship between the TB and the surface materials.
To obtain the nTB maps, the standard TB values of every latitude were calculated according to the procedure provided in references [17,27]. The nTB maps at noon and night were generated by dividing the TB of every pixel by the standard TB of the corresponding latitude (Figure 4 and Figure 5). The resulting nTB maps are considered to be sensitive to the compositions and thermal state of the surface deposits in the penetration depth [17,27].
The TBD is the difference between the interpolated noon and night TB of the same frequency before normalizing (Figure 6). The TBD maps are a good reflection of the compositions of the surface deposits in the penetration depth [17,27].
When compared with the TB maps, the microwave thermal emission features of surface deposits in Mare Frigoris are enhanced in Figure 4, Figure 5 and Figure 6. The nTB and TBD maps agree well with the boundaries of the geologic units mapped by Kramer et al., especially in the units marked WF4, WF5, WCF6, and WCF7 [2]. In other words, the nTB and TBD maps can highlight mare deposits with different FTAs, which can be used to re-evaluate surface deposits in Mare Frigoris.

2.2. FeO and TiO2 Abundance (FTA)

FTA is the decisive factor for the dielectric constant, which is the main influencing factor of the TB emitted from the lunar regolith [24,28,29]. In the microwave domain, the FTA value is always thought of as one of the important factors that can influence the loss tangent of the regolith [30].
Currently, FeO and TiO2 abundances are also considered to be the most important index in the identification of basaltic units in different eras [1,2,10,31,32] with severe surface contamination, including Mare Frigoris. Thus, the FeO and TiO2 abundances (Figure 7) were retrieved from the Clementine UVVIS data using the methods developed by Lucey et al. [33]. The Clementine UVVIS data can be downloaded from USGS Astrogeology Science Center (https://astrogeology.usgs.gov/search/map/Moon/Clementine/UVVIS/Lunar_Clementine_UVVIS_WarpMosaic_5Bands_200m, accessed on 9 February 2022). Figure 7 shows that the FeO and TiO2 abundances are highest in the western region, moderate in the middle region, and lowest in the eastern region. These maps are used as an important reference to evaluate the TB performances of basaltic units.
The TB of the Moon and its characteristics have been thoroughly theoretically investigated by a number of authors [22,23,24,25]. After evaluating the TB performances on a global scale, Meng et al. [34] proposed that the (FeO + TiO2) abundance (FTA) is the controlling factor with regard to surface deposits on a local scale. As shown in Figure 8, the simulated TB using the radiative transfer model shows a clear change with respect to the FTA of the regolith. Compared to the deposits with lower FTAs, the TB is higher during the daytime (represented by surface temperatures of 390 K and 300 K) and lower at night (represented by surface temperatures 200 K and 100 K) in the deposits with higher FTAs. Correspondingly, the TBD will be much higher in FTA-rich deposits. This relationship between the TB (nTB) and TBD and the FTA of surface deposits is helpful in our understanding of the findings regarding the basaltic units in the following sections.

2.3. Bouguer Gravity Anomaly

The TB can reflect the dielectric properties of the regolith within the penetration depth and is sensitive to the substrate temperature [17,27]. Meanwhile, there is no air on the Moon, and the TB results likely represent thermal behaviors in the shallow lunar crust. Thus, the GRAIL data were introduced to unravel the potential relationship between the nTB results and the Bouguer gravity anomaly. The Bouguer gravity anomaly map was filtered from degree 42 to 600 and derived from GRAIL data (Figure 9), which can be downloaded from https://pds-geosciences.wustl.edu/grail/grail-l-lgrs-5-rdr-v1/grail_1001/shadr/ (accessed on 27 April 2016).
In Figure 9, there exists a considerable linear gravity anomaly centered on the ECF6 unit and several relatively low gravity anomalies to the north of the WCF1 unit, the junction of the WCF4 and WCF6 units, the junction of the eastern WCF3 and WCF5 units, the EF3 unit, and the EF4 unit. The map was used as a useful reference to understand the TB anomalies mentioned in the following sections.

3. Results

SCREP-based results can reduce the influence of surface contamination on the pristine compositions of underlying materials. Thus, the basaltic units mapped by Kramer et al. [2] were used to evaluate the nTB and TBD results. Also, the basaltic units mapped by Hiesinger et al. [10] were used for a comparison between the nTB and TBD results, and the estimated ages were used to evaluate the ages of the basaltic units mapped by Kramer et al. [2].

3.1. Assessing the Basaltic Results

Regarding the weathering effects of the contamination of impact ejecta from other locations and space on the surface deposits, Kramer et al. [2] depended on the SCREP craters to probe the material beneath the surface regolith to determine the pristine compositions of the basaltic units.
Comparatively, a CE-2 microwave signal can penetrate surface deposits up to 10 to 20 times the wavelength of the used microwave [17,36]. Also, TBD maps have been proven to be sensitive to the FTA of deposits within the penetration depth of the microwave that is used [17,27]. Thus, the MRM data provided a new way to evaluate the pristine compositions of the basaltic units.
Figure 6 demonstrates how, in the study of the basaltic units on the lunar surface, the overlay of the geologic boundaries mapped by Kramer et al. [2] on TBD maps highlights the MRM data. Kramer et al. [2] divided Mare Frigoris into four quadrants comprising Western Frigoris (WF), West-central Frigoris (WCF), East-central Frigoris (ECF), and Eastern Frigoris (EF), which include 21 basaltic units in addition to the EF1 unit in Lacus Mortis, pyroclastic deposits, and cryptomare that are not mentioned by Hiesinger et al. [10]. Here, in the WF4, WF5, WCF4, WCF6, ECF3, and ECF5 units, the TBD results correlate with the basaltic unit mapped by Kramer et al. [2] (Figure 6). This correlation indicates that the TBD is highly related to the SCREP-based (FeO + TiO2) abundance of pristine basalts, which is not as influenced by the ejecta contamination as the UVVIS-based FeO and TiO2 abundances, as shown in Figure 7.
Moreover, the correspondence between the TBD results and the basaltic units is good in the WF, WCF, and ECF quadrants, while the correspondence is only poor in the EF quadrant (Figure 6). Two large craters exist in Mare Frigoris, the Harpalus crater in the WF quadrant, with a diameter of 40 km, and the Aristoteles crater in the EF quadrant, with a diameter of 88 km (Figure 1). Figure 6 shows that the influence of Aristoteles crater on the compositions of pristine basaltic units are complex. In the EF quadrant, the TBD in the southern area is higher than that in the northern area, which deserves to be further studied.
For comparative purposes, the basaltic units identified by Hiesinger et al. [10] were also vectorized and overlaid on the 37-GHz TBD map (Figure 10). Only four (the F1, F25, F27, and F31 units) of the 37 units (units F1–F37) show a good agreement with the TBD results. This suggests that the weathering effects of the contamination of the impact ejecta from other locations and space on the compositions of surfaces are fairly strong in Mare Frigoris.

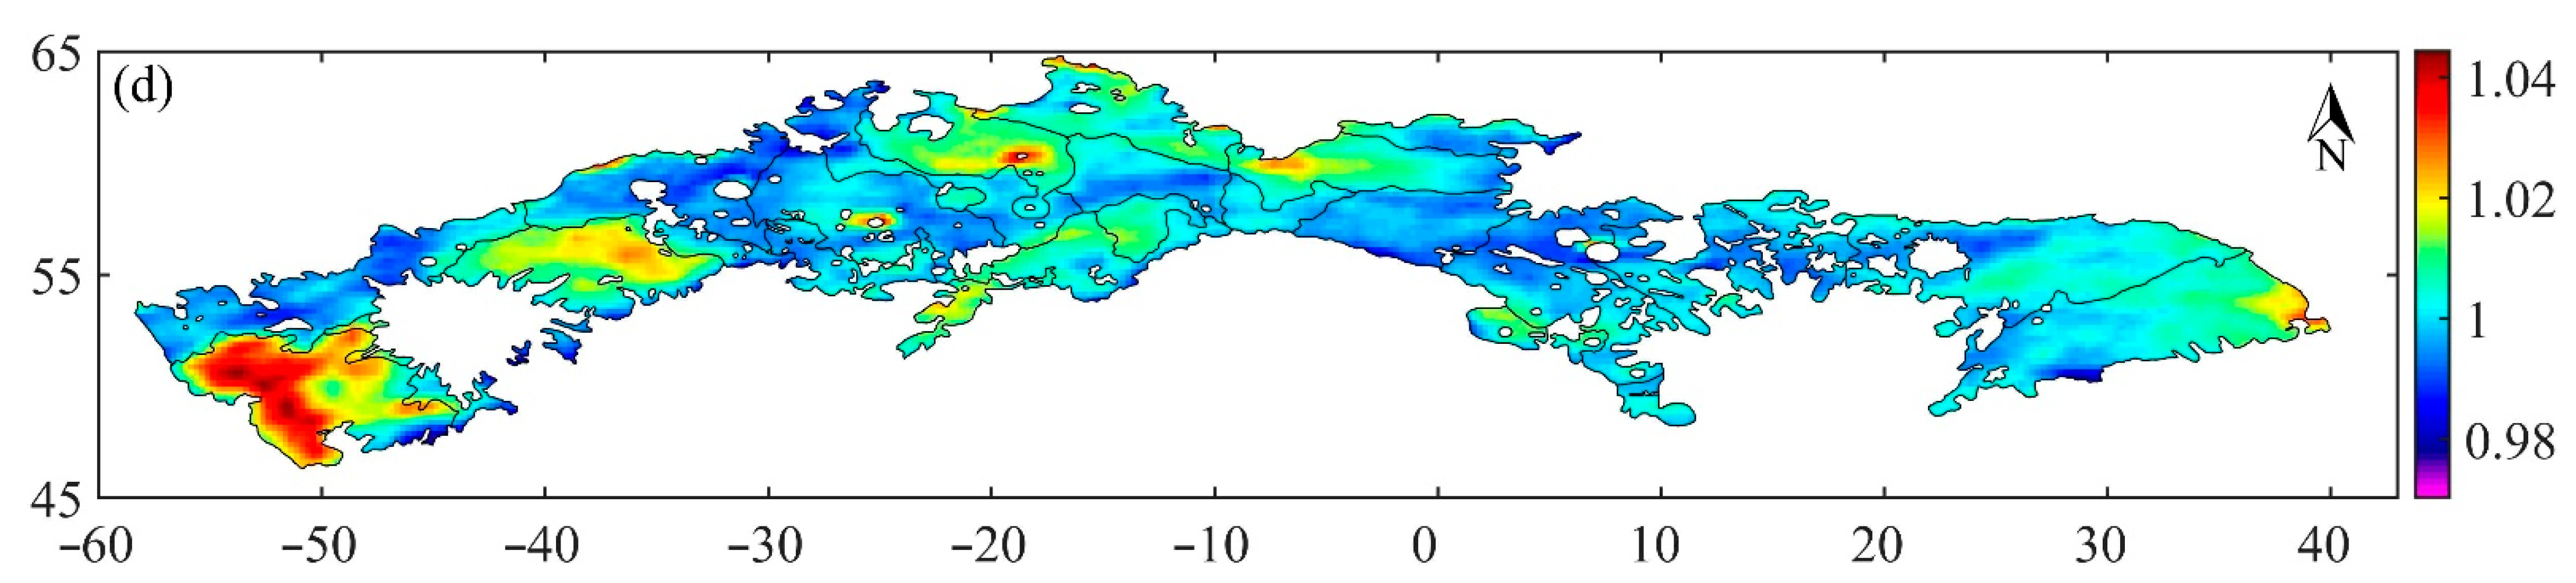
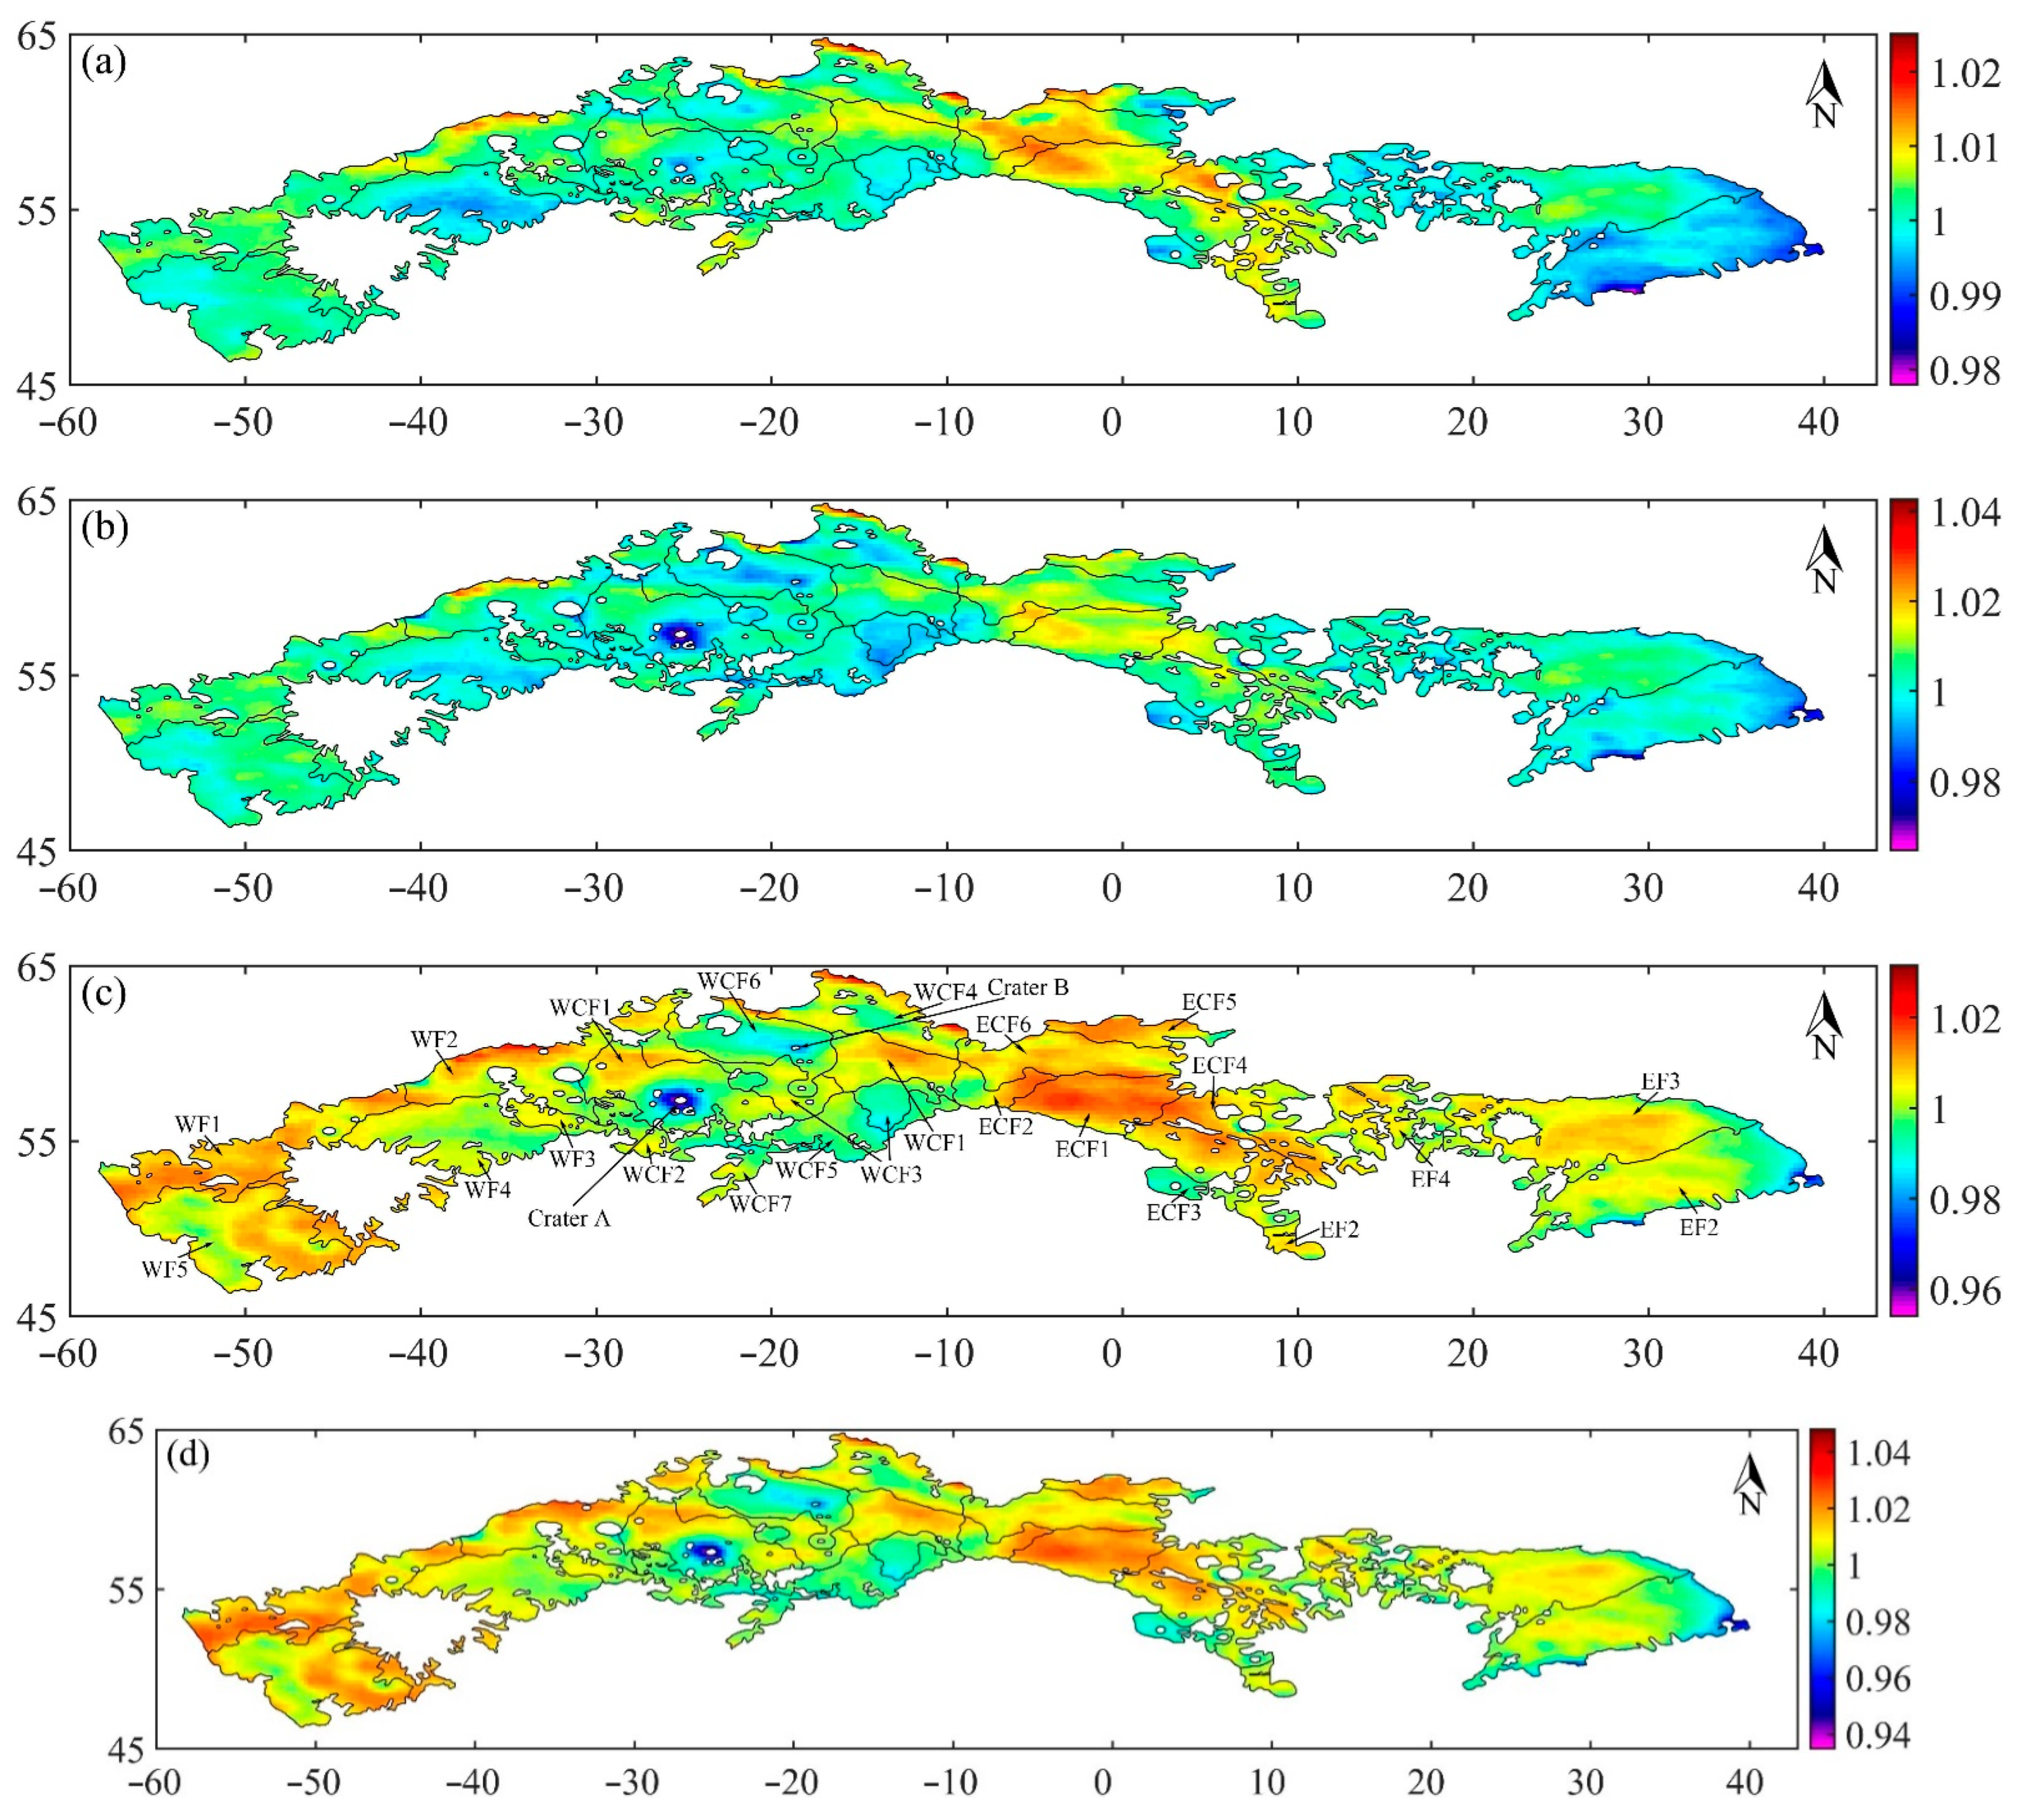
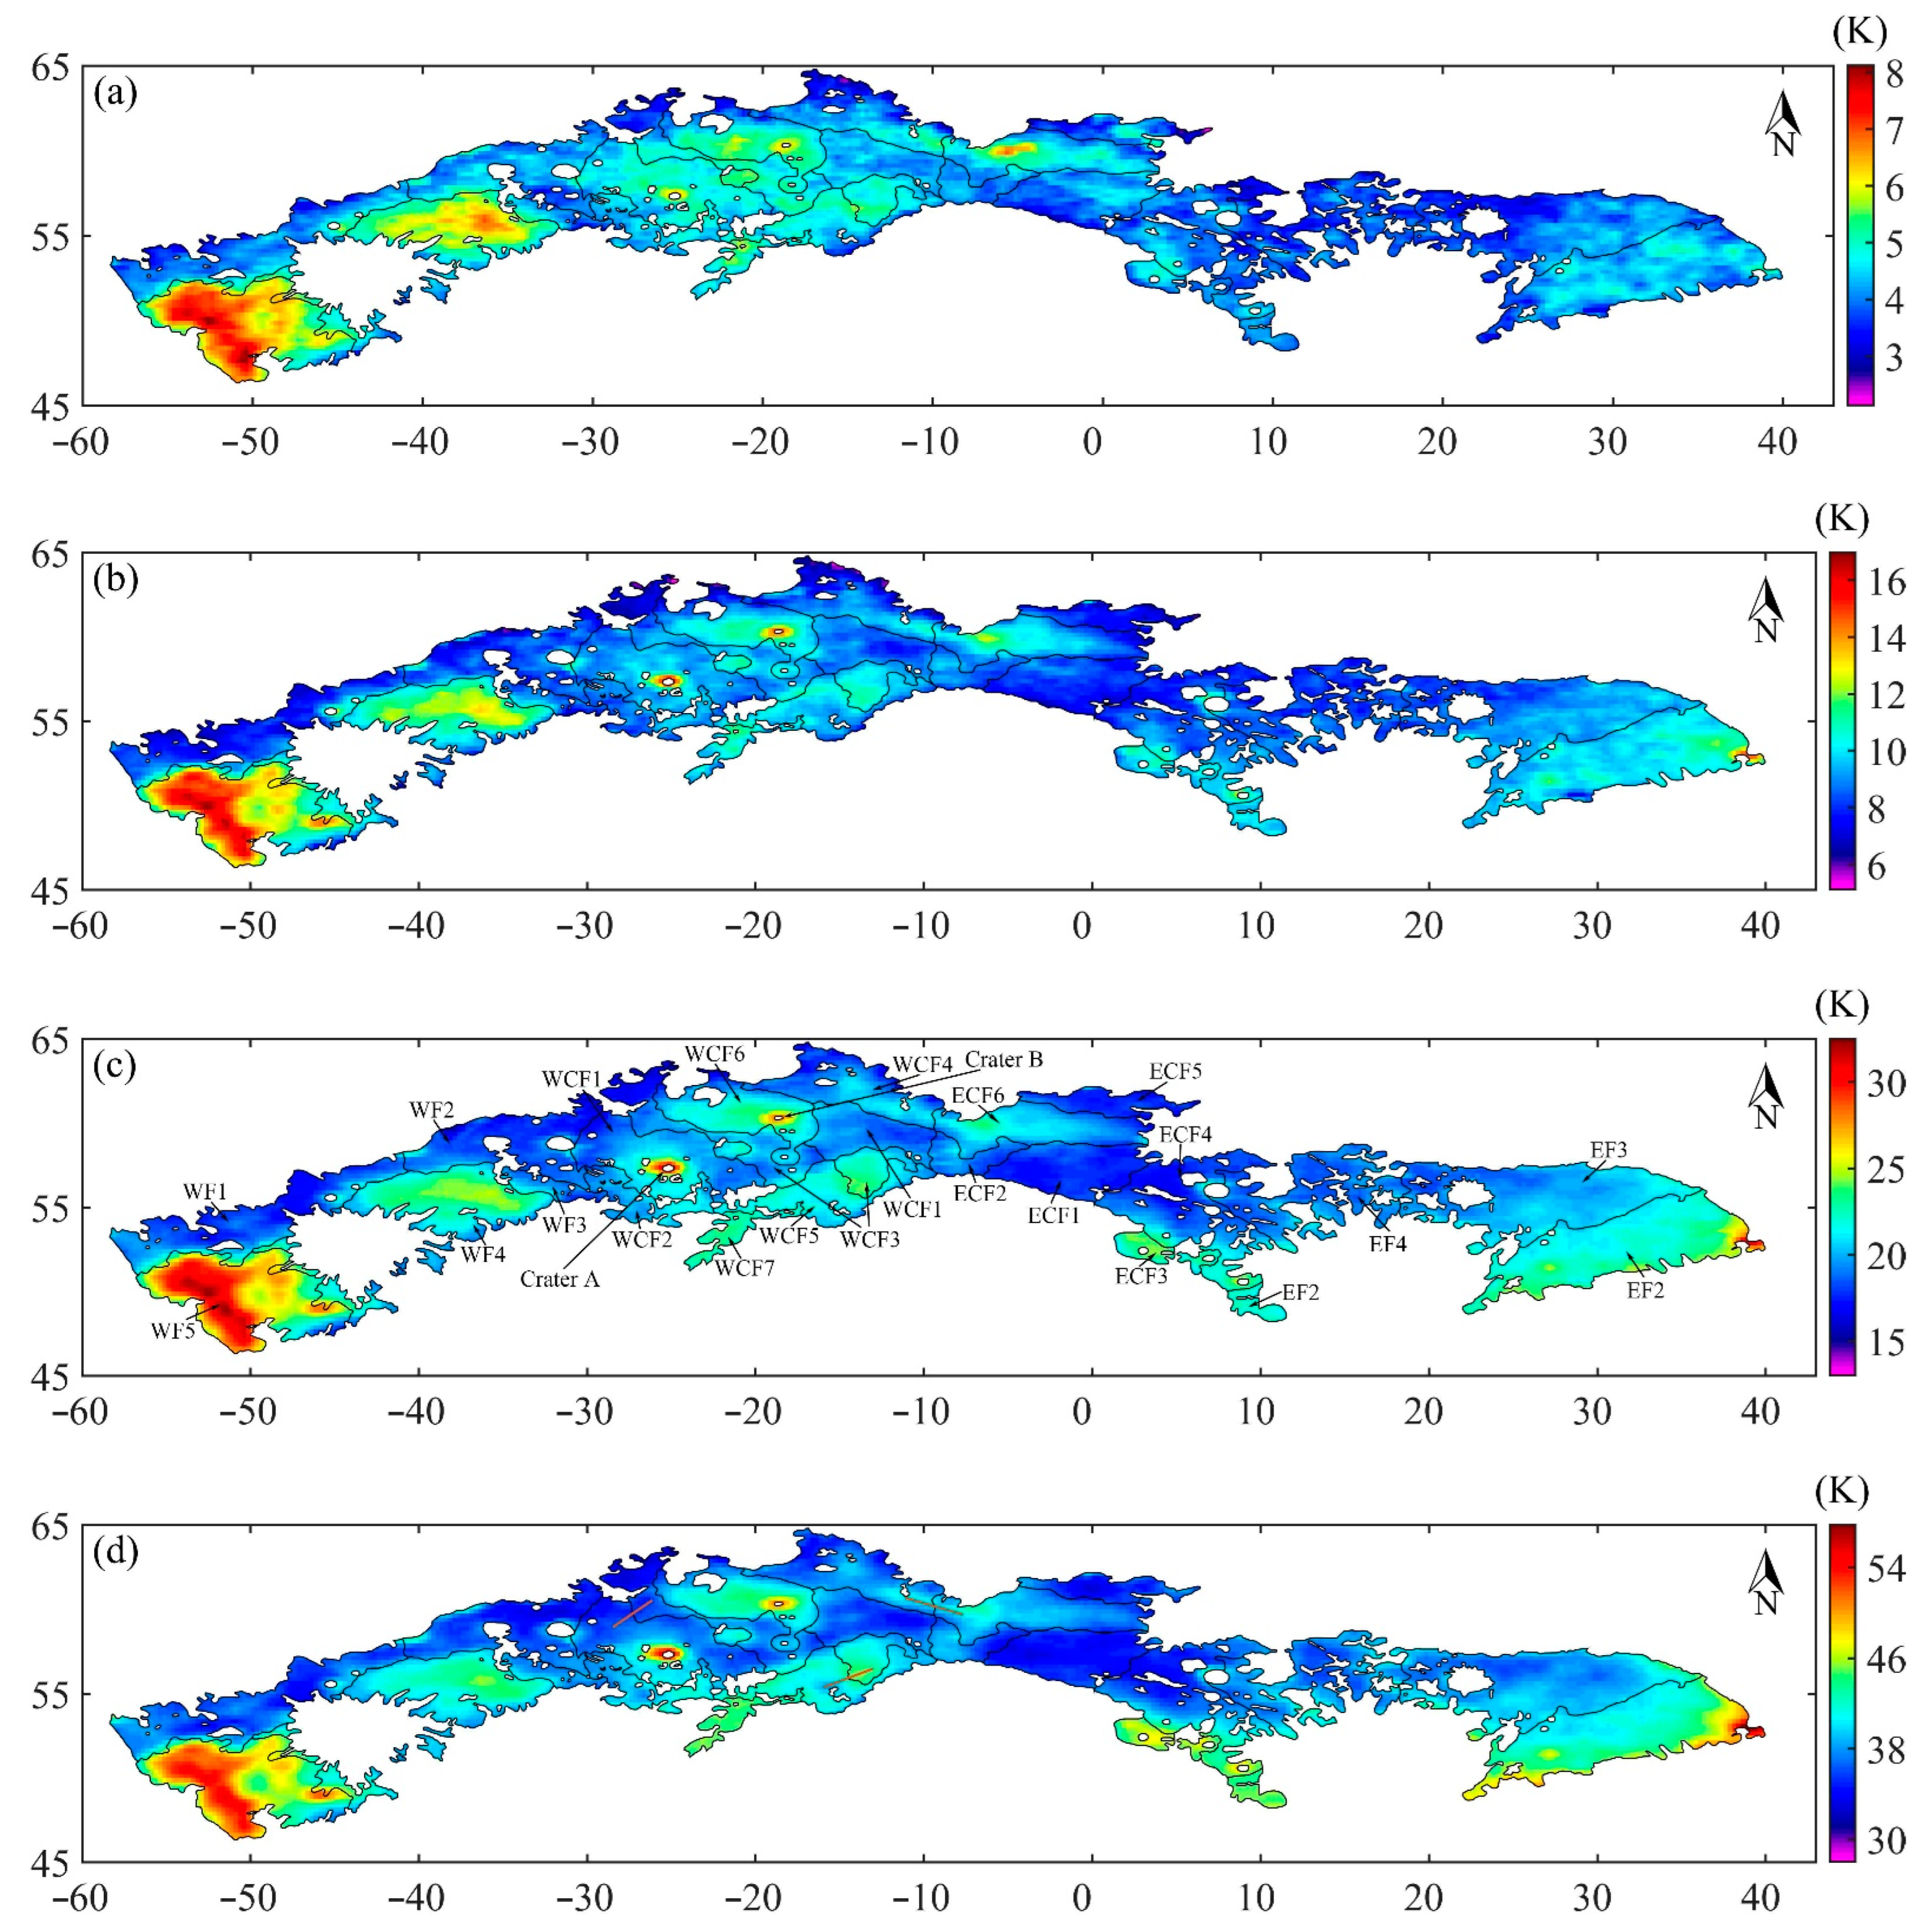
3.2. nTB and TBD Performances of Basaltic units

According to the results in Mare Moscoviense and Mare Australe, Meng et al. [27,28] proposed that TBD values are sensitive to the compositions of the volumetric regolith, which are used in the following analysis. The nTB maps were adopted as references to obtain the dielectric properties of the regolith within the penetration depth of the used microwave.

3.2.1. Western Frigoris

Five basaltic units were mapped by Kramer et al. [2] in the WF quadrant, and these represent the total range in compositions and ages of the basaltic units in Mare Frigoris. Kramer et al. [2] estimated the pristine compositions of the five units, as shown in Table 1.
In the WF quadrant, the TBD is highest in the WF5 unit and second highest in the WF4 unit. Correspondingly, the nTB of the WF5 unit is highest at noon and almost lowest at night, followed by the nTB of the WF4 unit. Here, two issues should be pointed out. The first issue (named Issue 1) concerns the fact that the TBD and nTB results agree with the theoretical simulation finding that the nTB will be higher at noon but lower at night in deposits with higher FTAs compared to those with lower FTAs [24,28]. Correspondingly, the TBD will be considerably high in FTA-rich deposits. The second issue (named Issue 2) is that coincidences occur between the TBD and nTB results and the boundaries outlined by Kramer et al. [2] in the WF4 and WF5 units. Again, these verify that the MRM data are of potential significance in the identification of basaltic units. The two issues are significant in the context of understanding the relationship between TB results and basaltic units in the following analysis. The WF3 unit indicates a relatively low nTB at noon, a high nTB at night, and a low TBD compared with the WF4 unit. The boundary between the WF2 and WF3 units is clear at 19.35- and 37-GHz according to the nTB and TBD maps.
The WF1 and WF2 units are located in the northern section of the WF quadrant, and their TBDs are apparently lower than those of the other units in the WF quadrant. Here, we noticed an abnormal phenomenon: Table 1 shows that the TBD of the WF1 unit is 0.3 K, 0.6 K, 0.6 K, and 0.2 K lower than that of the WF2 unit at 3.0 GHz, at 3.0 GHz, 7.8 GHz, 19.35 GHz, and 37 GHz, respectively, but the FTA of the WF1 unit is 2–3 wt % higher than that of the WF2 unit. According to Issue 1 and the theoretical simulation [24,28], the FTA of the WF1 unit should be lower than that of the WF2 unit, which is opposite of the SCREP-based FTA result.
When referring to the ages estimated by Hiesinger et al. [10], the WF1 unit corresponds to the F3 unit (3.72 Ga) and the F18 unit (3.53 Ga), the WF2 unit mainly includes the F15 unit (3.54 Ga), and the WF3 unit corresponds to the middle of the F32 unit (3.39/4.00 Ga). Thus, combined with the relative ages provided by Kramer et al. [2], the WF1 unit is probably 3.72 Ga in age, older than the WF2 unit, at 3.54 Ga, and the WF3 unit should be younger still, at 3.39 Ga. Considering the superposition relationship of the stratum [2], the WF4 unit should be younger than 3.39 Ga, and the WF5 unit is the youngest in the WF quadrant.

3.2.2. West-Central Frigoris

The WCF1 unit consists of two parts: the western WCF1 and the eastern WCF1. The WCF1 unit is the only “very low-Ti” (VLT) basalt in the quadrant. Table 2 shows that the TBD of the western WCF1 is approximately 0.5 K higher than that of the eastern WCF1 at 3.0 GHz, except for the region surrounding Crater A (La Condamine S crater, 25.22°W, 57.34°N). In the other three channels, the TBD of the eastern WCF1 is consistent with that of the western WCF1, indicating the similarity between the two parts.
Concerning the WCF2 unit, Table 2 shows that the TBD of the WCF2 unit is 0 K at 3.0 GHz and 0.2 K higher at 7.8 GHz than that of the WCF1 unit, while it is 1.5 K at 19.35 GHz and 4.1 K higher at 37 GHz than that of WCF1 unit, which indicates the complexity of the deposits in the vertical direction. Meanwhile, the same problem pointed out in the WF1 and WF2 units also occurs here: the SCREP-based FTA of the WCF2 unit is significantly lower than that of the WCF1 unit; however, the TBD of the WCF2 unit is higher than that of the WCF1 unit. Thus, theoretically, the FTA of the WCF2 unit should be higher than that of the WCF1 unit.
The WCF3 unit includes two parts: the western WCF3 and the eastern WCF3. The TBD maps show that the boundary between the western WCF3 and the nearby WCF6 unit in the north and that between the eastern WCF3 and its nearby WCF1 unit in the north are well mapped by the TBD results. However, the TBD of the eastern WCF3 is clearly higher than that of the western WCF3, and the differences are approximately 0.1 K at 3.0 GHz, 1.3 K at 7.8 GHz, 3.2 K at 19.35 GHz, and up to 5.8 K at 37 GHz (Table 2). Compared with the TBD results of the other units, the differences are considerably large, and, thus, the category of the eastern and western WCF3 units is problematic.
Moreover, the TBD maps show that the difference between the western WCF3 unit and the nearby WCF1 unit is not clear, where the differences are only 0.2 K at 3.0 GHz, 0 K at 7.8 GHz, 0.4 K at 19.35 GHz, and 0.1 K at 37 GHz. Furthermore, according to the TBD profiles (Figure 11), compared with the clear difference between the WCF5 unit and the eastern WCF3 unit, there is no obvious TBD boundary between the western WCF1 unit and the western WCF3. Therefore, the western WCF3 should be includes as part of the WCF1 unit, and they are both clearly different to the eastern WCF3 (Figure 12).
In the case of the WCF4 unit, the four-channel TBDs are significantly lower than those of the WCF6 unit, but higher than those of the eastern WCF1. Compared with the WCF1 unit, the WCF4 unit exhibits a relatively high nTB at noon and a relatively low nTB at night. According to Issue 1 and the theoretical simulation [24,28], such nTB and TBD results indicate that the FTA of the WCF4 unit should be higher than that of the WCF1 unit, which would be inconsistent with the SCREP-based FTA provided by Kramer et al. [2].
One issue that should be noted is the fact that the TBD in the WCF4 unit increases gradually from the northwest to the east, and the TBD in the eastern area is close to that in the west of the ECF6 unit (Figure 6). Here, we ascribed the WCF4 unit to the ECF6 unit, which is discussed further in the following section.
The WCF5 unit is located in the southeast of the WCF quadrant, and the FeO and TiO2 abundances of the pristine basalt were estimated to be 14 wt % and 1 wt % [2]. The WCF5 unit includes the F35 (3.11 Ga) and F37 (2.61 Ga) units mapped by Hiesinger et al. [10]. Here, the TBD maps show that the difference between the F35 and F37 units is almost zero in each channel. It should be noted that the TBD of the WCF5 unit is slightly lower than that of the eastern WCF3 (Figure 11). Meanwhile, the noon nTB is lower and the night nTB is slightly higher in the WCF5 unit compared to the eastern WCF3. Therefore, the FTA of the WCF5 unit should be lower than that of the eastern WCF3.
In WCF6 unit, the TBD is significantly higher than that of the surrounding WCF1, WCF3, and WCF4 units. Although the TBD clearly changes from the north to the southeast of this unit, no clear boundary exists. Meanwhile, the unit has the second highest noon nTB and the second lowest night nTB. These TBD and nTB results are consistent with the SCREP-based FTA of the WCF6 and WCF7 units.
The WCF7 unit has the highest TBD results at 19.35 and 37 GHz, corresponding to the highest FeO and TiO2 abundances here.
Compared with the ages estimated by Hiesinger et al. [10], the ages of the basaltic units mapped by Kramer et al. [2] are complicated. The WCF1 unit is mainly located in the F17 (3.53 Ga), F19 (3.51 Ga), F22 (3.48 Ga), and F23 (3.48 Ga) units. Since the WCF1 unit is the oldest in the WCF quadrant, we set the age of the unit as 3.53 Ga. The WCF2 unit corresponds to the F17 (3.53 Ga) and F21 (3.49) units; therefore, it would be rational to set the WCF2 unit as 3.49 Ga. Most of the western WCF3 unit lies within the F19 (3.51/3.79 Ga), F22 (3.48/3.63 Ga), F24 (3.47/3.70 Ga), F28 (3.45 Ga), and F37 (2.61 Ga) units, while the eastern WCF3 unit is close to the F27 unit (3.46 Ga) and its age was set as 3.46 Ga. The WCF4 unit is located in the F22 (3.48/3.63 Ga), F23 (3.48 Ga), and F30 (3.43 Ga) units, so 3.43 Ga (F30) was set as the age for this unit. The WCF5 unit includes the F35 (3.11 Ga) and F37 (2.61 Ga) units. According to the relative ages provided by Kramer et al. [2], the WCF6 unit is much younger than the WCF5 unit, at 3.48 Ga (F22) and 3.45 Ga (F28). The WCF7 unit should be younger than the WCF6 unit, which is also younger than 3.6 Ga (F10) and 3.51 Ga/3.79 Ga (F19).

3.2.3. East-Central Frigoris

Figure 4, Figure 5 and Figure 6 show that the nTB and TBD performances of the ECF quadrant are complex, or at least they are in the ECF1, ECF2, ECF5, and ECF6 units, all of which show relatively high 3.0-GHz nTBs both at noon and at night. According to previous studies [28], the warm microwave anomaly caused by the higher substrate temperature is likely to exist in the ECF quadrant, which will be discussed further in the next section.
The ECF1 unit has the lowest TBD in the ECF quadrant. The nTB maps show that the ECF1 unit has the lowest noon nTB and the highest night nTB in the ECF quadrant at 37 GHz (representing the mare deposits in the shallow layer). These nTB and TBD results are highly correlated with the lowest FeO and TiO2 abundances in the ECF quadrant.
The TBD of the ECF2 unit is notably higher than the ECF1 unit and lower than the ECF6 unit. The noon nTB of the ECF2 unit is higher than that of the ECF1 unit but lower than that of the ECF6 unit at 37 GHz, and the opposite is true at night.
Compared with the ECF1 and ECF2 units, at 37 GHz, the TBD and the noon nTB of the ECF3 unit are higher but the night nTB is lower.
These nTB and TBD results in the ECF1, ECF2, and ECF3 units agree with their comparative SCREP-based FTA according to the theoretical simulation [24,28].
Table 3 shows that the TBD of the ECF4 unit differs very little from the ECF1 unit: only 0.1 K at 3.0 GHz, 0.4 K at 7.8 GHz, 0.5 K at 19.35 GHz, and 0.4 K at 37 GHz, indicating the homogeneity of mare deposits in the two units. Meanwhile, the ECF4 unit has a relatively low nTB at noon and a relatively high nTB at night at 37 GHz, which is also consistent with the ECF1 unit. Therefore, we combined the ECF4 unit with the ECF1 unit based on the nTB and TBD results (Figure 12). Hiesinger et al. [10] classified the west of the ECF4 unit as the ECF1 unit, which also confirmed the reliability of the nTB and TBD results.
The nTB of the ECF5 unit is very close to that of the ECF1 unit, and the TBD discrepancies between the two units are 0.4 K at 7.8 GHz and 0 K in the other three channels (Table 3). According to the strong relationship between the TBD and the compositions of the mare deposits, the FTA of the ECF5 unit should be consistent with the ECF1 unit. Therefore, considering that the FTA is an important basis for Kramer et al. [2] in the mapping of different units, the ECF1 and ECF5 units should be considered the same unit (Figure 12). The F7 unit mapped by Hiesinger et al. [10] comprises the ECF1 and ECF5 units, validating that the combination is reliable.
The ECF6 unit has the highest TBD, a relatively high nTB at noon, and a low nTB at night in the ECF quadrant, which is consistent with the highest FeO and TiO2 abundances in the unit.
According to the nTB and TBD results, the ECF quadrant contains the new ECF1 unit (the combination of the ECF1, ECF4, and ECF5 units), the ECF2 unit, the ECF3 unit, and the ECF6 unit (Figure 12). The new ECF1 is mainly located in the F5 (3.71 Ga), F7 (3.63 Ga), F8 (3.62/3.76 Ga), F9 (3.62 Ga), F11 (3.58 Ga), and F12 (3.56/3.71 Ga) units. The ECF2 unit includes the southwestern area of the F12 (3.56/3.71 Ga) unit and the F16 (3.54 Ga) unit. The ECF3 unit corresponds to the F25 (3.47 Ga) unit, and the ECF6 unit is located in the F7 (3.63 Ga) and F12 (3.56/3.71 Ga) units. Combined with the relative ages provided by Kramer et al. [2], the ECF1 unit was set as 3.56 Ga, the ECF2 unit as 3.54 Ga, the ECF3 unit as 3.47 Ga, and the ECF6 unit is less than 3.47 Ga in age.

3.2.4. Eastern Frigoris

Kramer et al. [2] mapped the East Frigoris into four basaltic units, but the EF1 unit in Lacus Mortis was not discussed in the study. Compared with the WF quadrant, in which there is an excellent correspondence between WCF and ECF quadrants, with a good agreement between the TBD results and the basaltic units, this relationship is poor in the EF quadrant, and there are no obvious nTB and TBD boundaries between the three units.
Compared with the other basaltic units in the quadrant, the TBD of the EF2 unit is significantly higher and the nTB of the unit is higher at noon but lower at night (Table 4). The nTB of the EF3 unit is similar to that of the EF2 unit at noon, but it is significantly higher than that of the EF2 unit at night (Table 4). Accordingly, the TBD of the EF3 unit is significantly lower than that of the EF2 unit. Figure 4 and Table 4 show that the EF4 unit has the lowest TBD and noon nTB in the EF quadrant.
Generally speaking, the nTB and TBD performances of the EF2, FE3, and EF4 units are consistent with the SCREP-based FTA results according to the theoretical simulation [24,28]. Therefore, the composition features obtained by Kramer et al. [2] in the EF quadrant can be confirmed by the nTB and TBD results, but the boundaries between these units are not clear.
The relative ages provided by Kramer et al. [2] are different from the aging results obtained by Hiesinger et al. [10] and Wilhelms [8]. The EF2 unit is located in the F13 (3.56 Ga), F14 (3.56 Ga), and F34 (3.14 Ga) units, the EF3 unit includes the northeast of the F13 unit (3.56 Ga), and the EF4 unit corresponds to the F9 (3.62 Ga) and F13 (3.56 Ga) units. Boyce [7] and Wilhelms [8] estimated the age of the ECF4 unit to be 3.4 Ga and late Imbrium. Therefore, based on the nTB and TBD results and the age estimated by Hiesinger et al. [10], Boyce [7], and Wilhelms [8], the EF4 unit is older (approximately 3.64 Ga), the EF3 unit is about 3.56 Ga, and the EF2 unit is about 3.14 Ga.

3.3. Redrawing Geologic Sketch of Basaltic Units and Remaining Problems

It is difficult to renew fine geologic maps when only using TB maps because the pixel size of MRM data is 25 km at 3.0 GHz and 17.5 km at other channels. In general, the pristine compositions exposed by SCREP-based craters, particularly FeO and TiO2 abundances, were the most important references for Kramer et al. [2] in their re-evaluation of the basaltic units of Mare Frigoris, and the FeO and TiO2 abundances were also the key regolith parameters of the MRM data when the influence of the surface temperature was weakened in this study. Thus, based on the analysis described above, the basaltic units in Mare Frigoris mapped by Kramer et al. [2] were rearranged to obtain a new geologic sketch (Figure 12). Compared to the geologic map provided by Kramer et al. [2], differences only occur in the following basaltic units: the western WCF3 unit was included in the WCF1 unit, the ECF4 and ECF5 units were combined with the ECF1 unit, and the WCF4 unit was included in the ECF6 unit.
According to the nTB and TBD results for Mare Frigoris, we can find the following three problems:
(1)
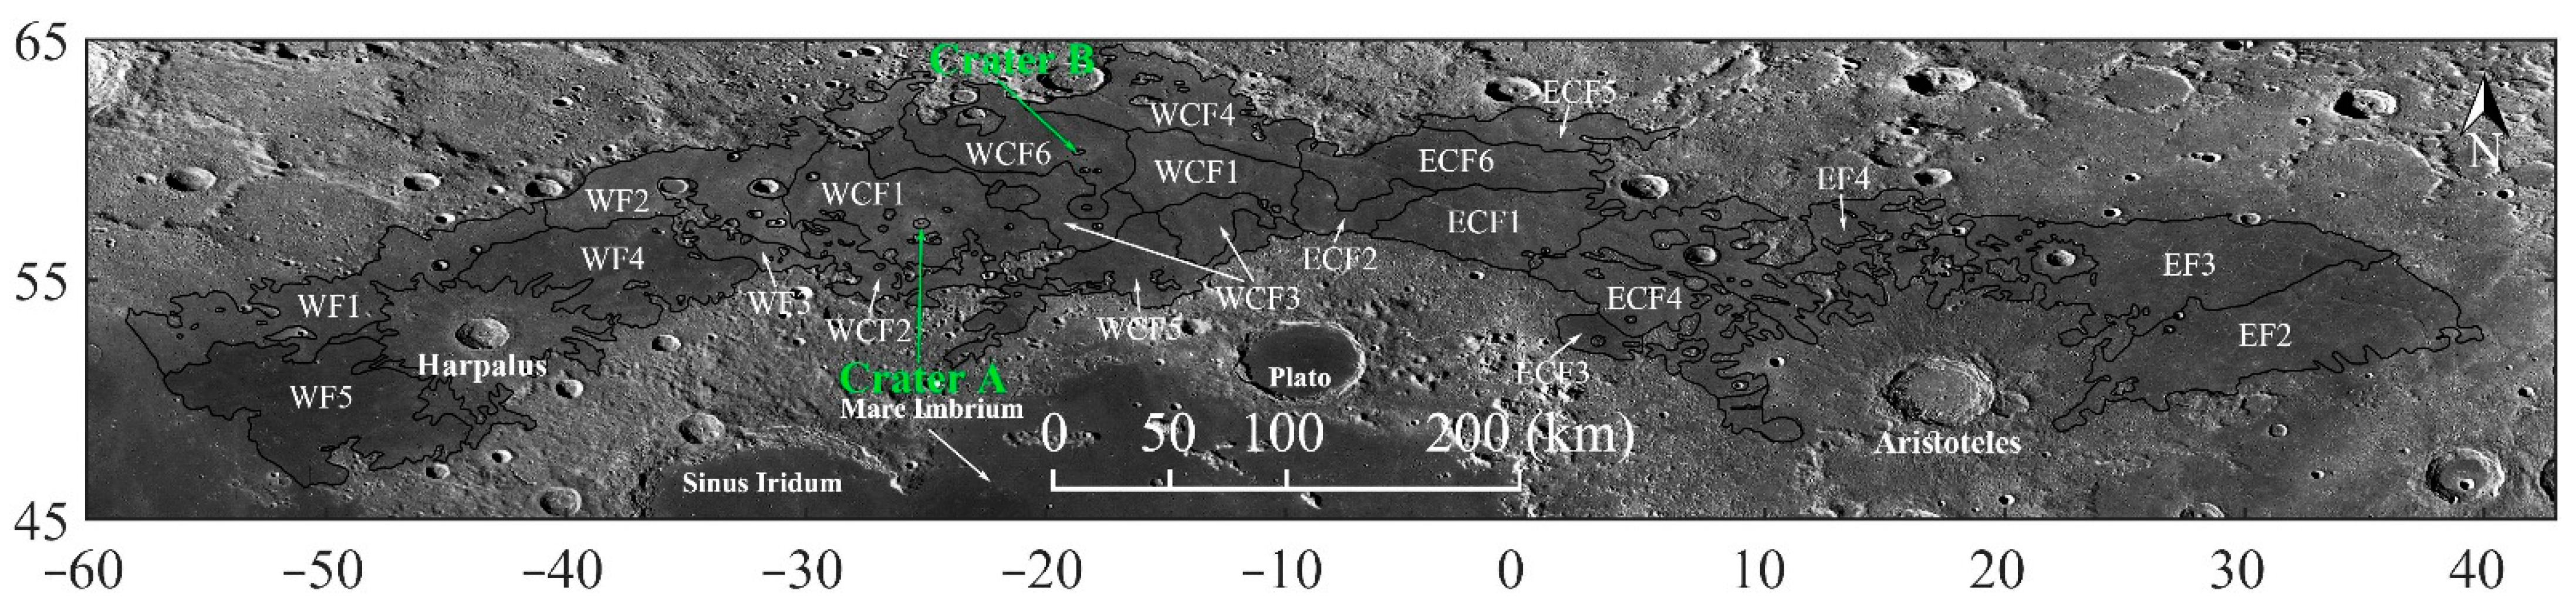
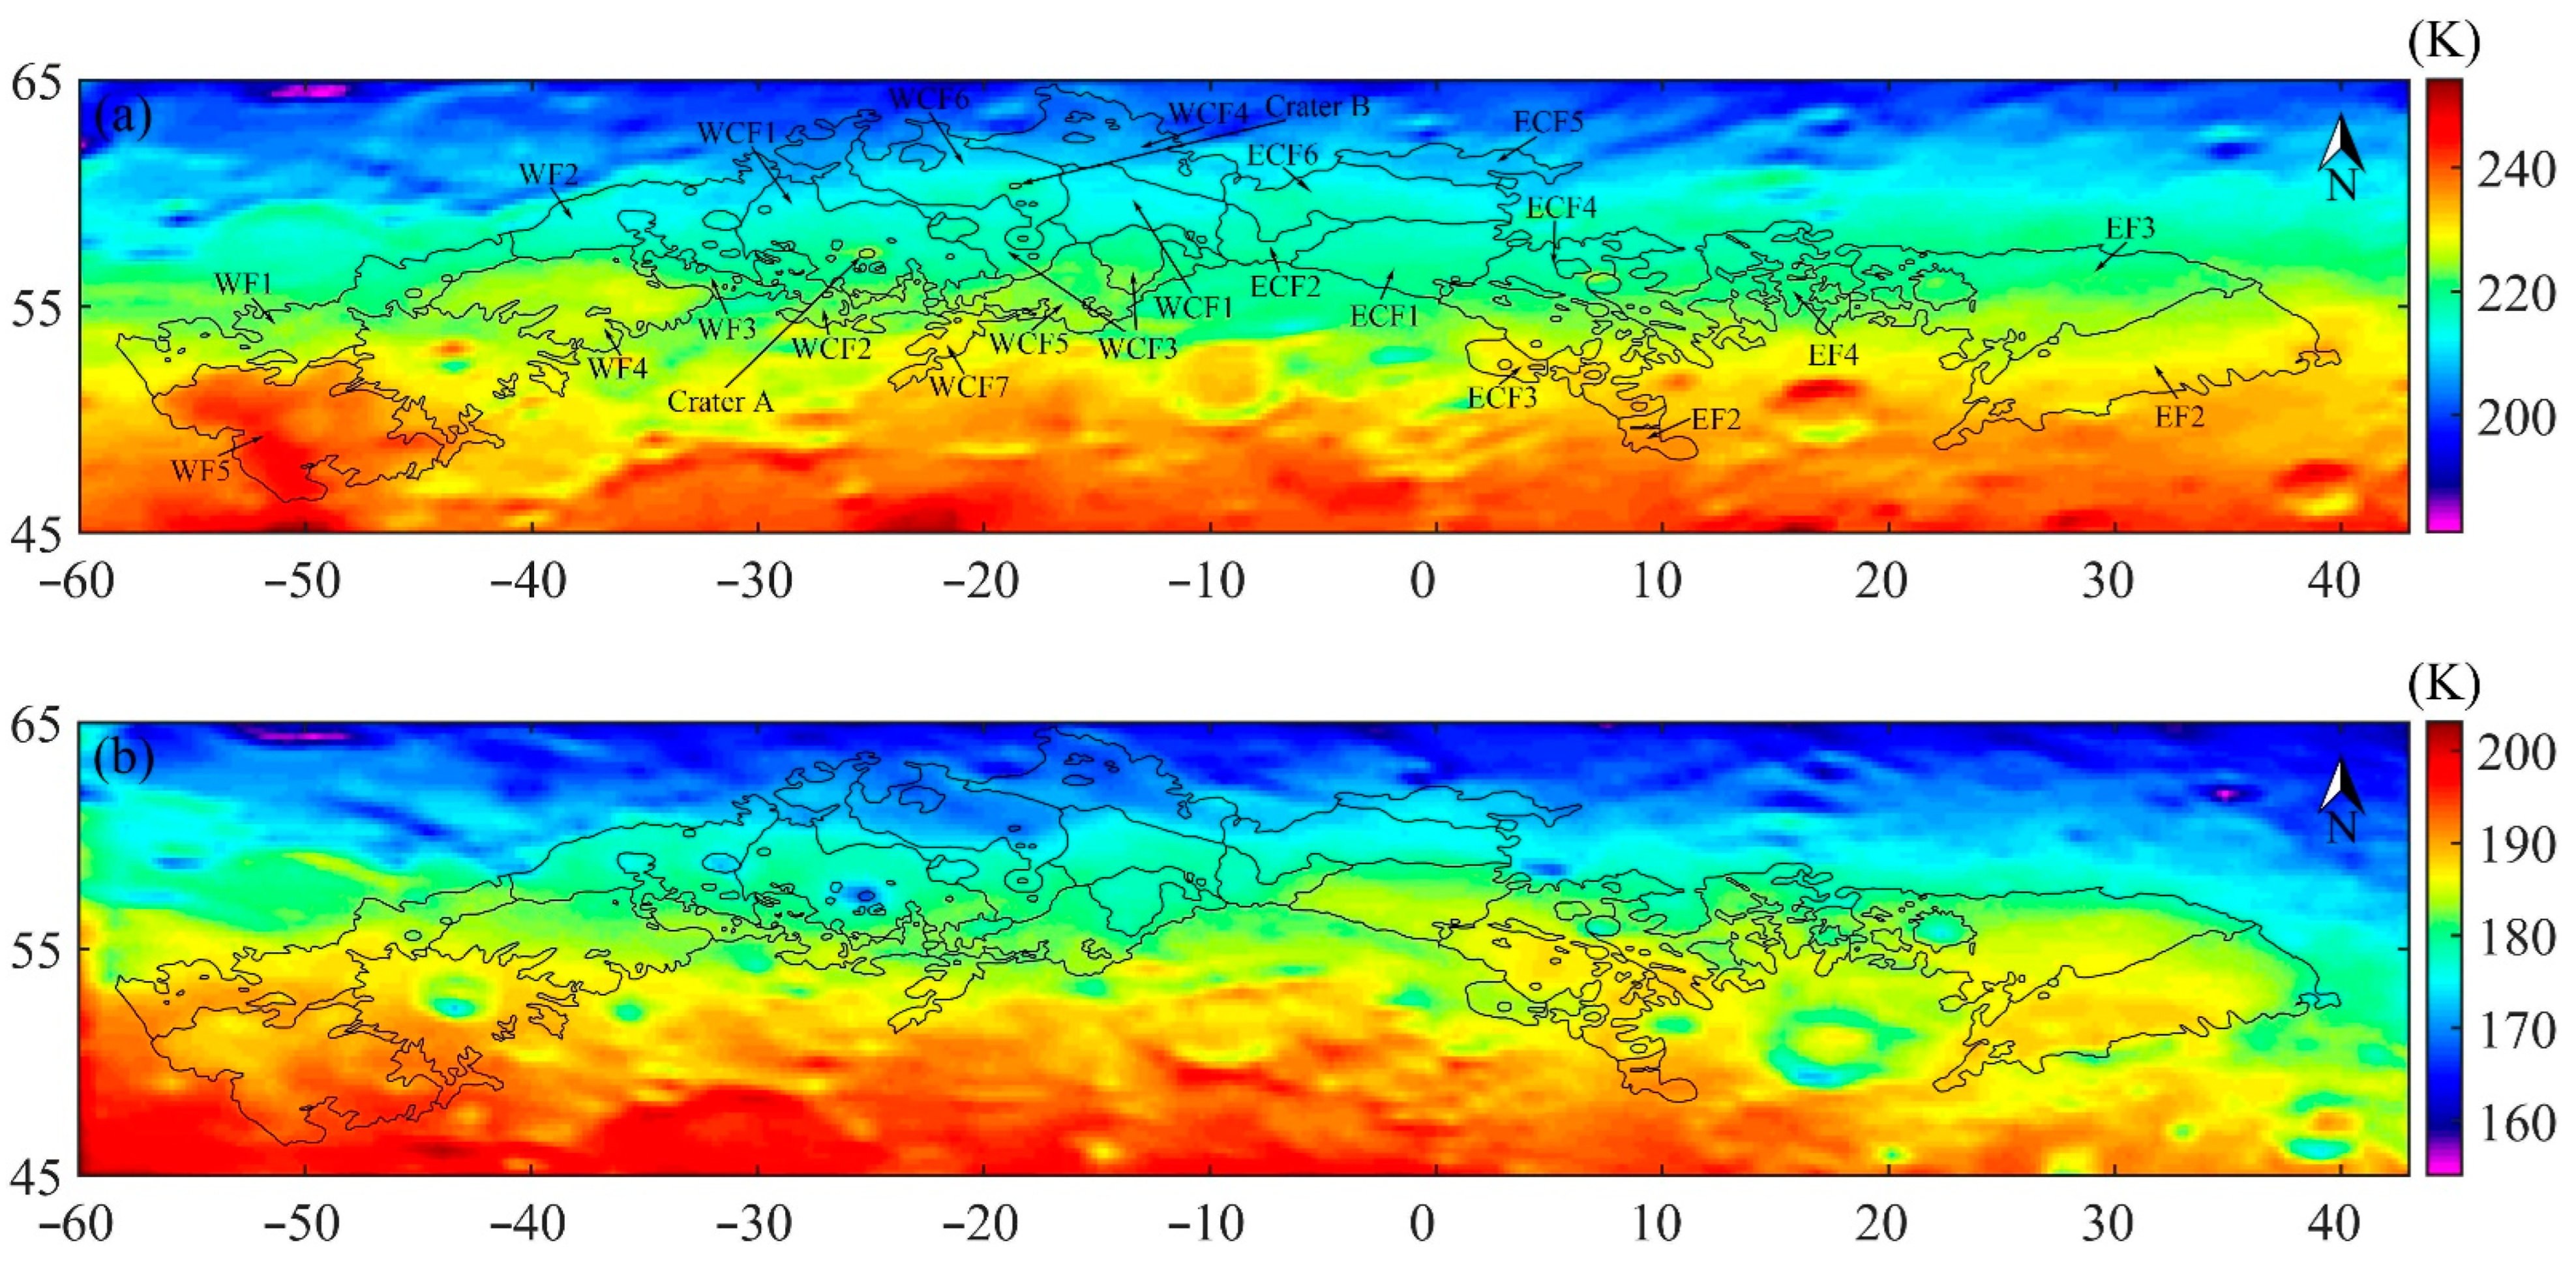
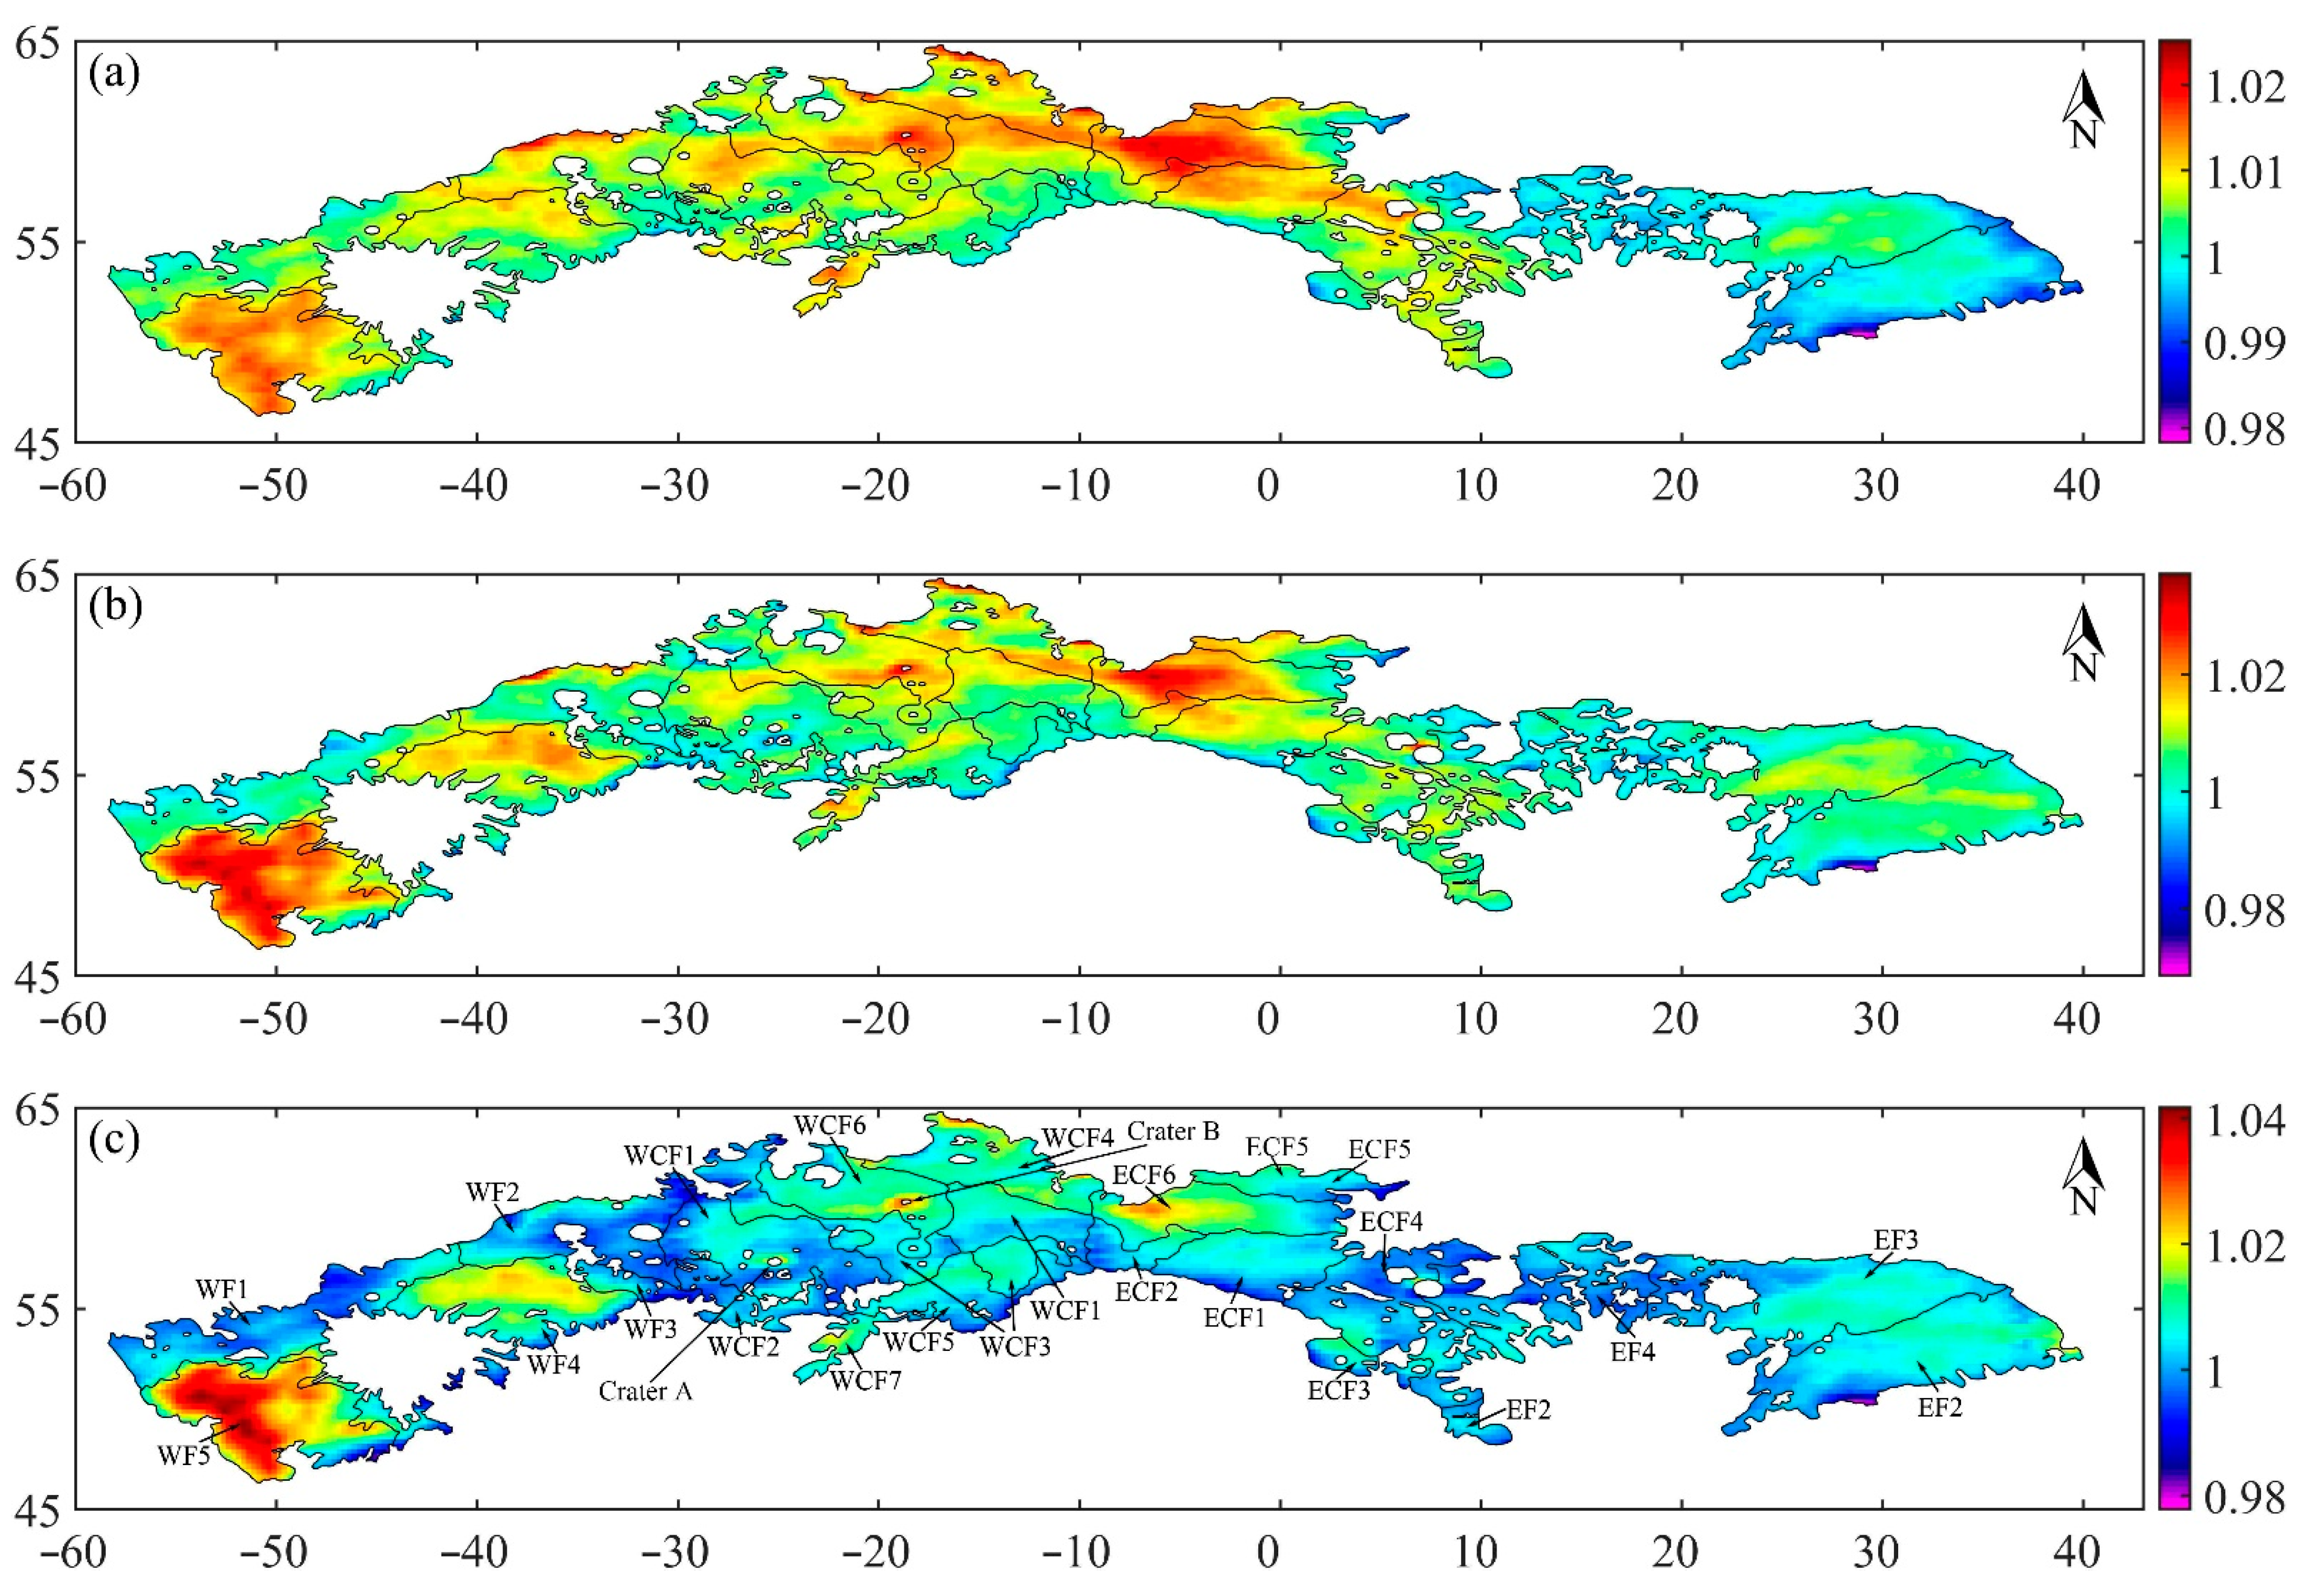
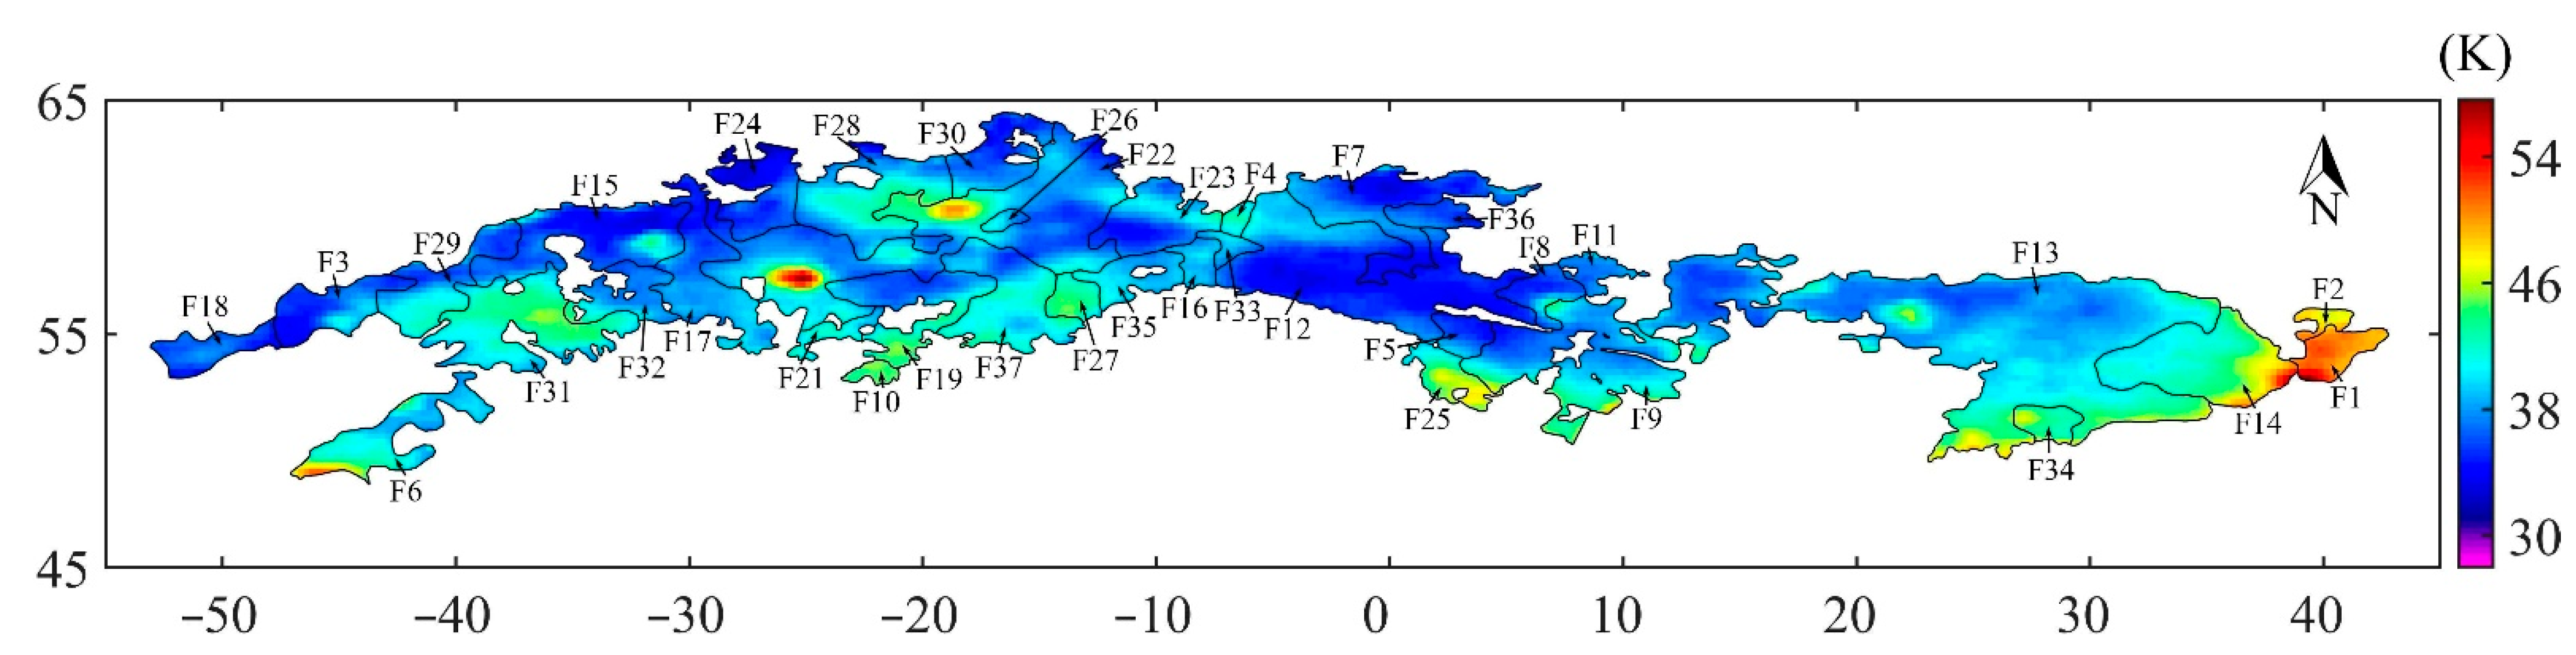
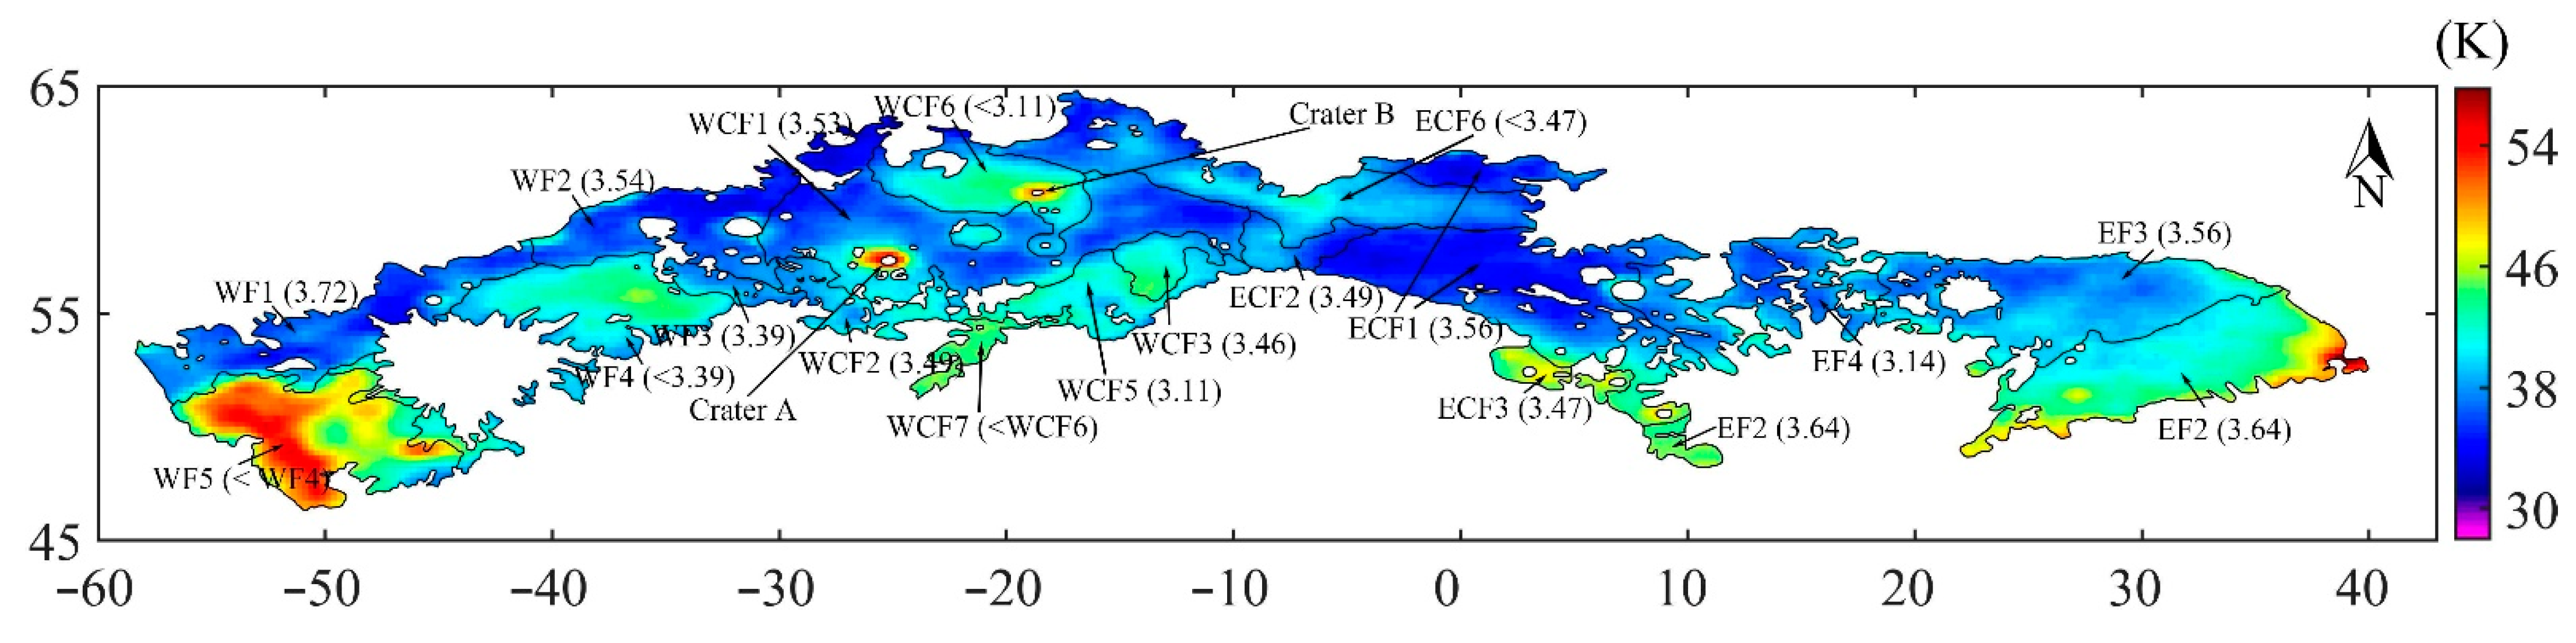
The spatial distributions of the nTB and TBD values are consistent with the boundaries of the basaltic units in the WF, WCF, and ECF quadrants mapped by Kramer et al. [2], as shown in Figure 4, Figure 5 and Figure 6. This comparison hints at the fact that the MRM data have the potential capability to probe the pristine basalt under ejecta, such as that reflected by the SCREP craters.
(2)
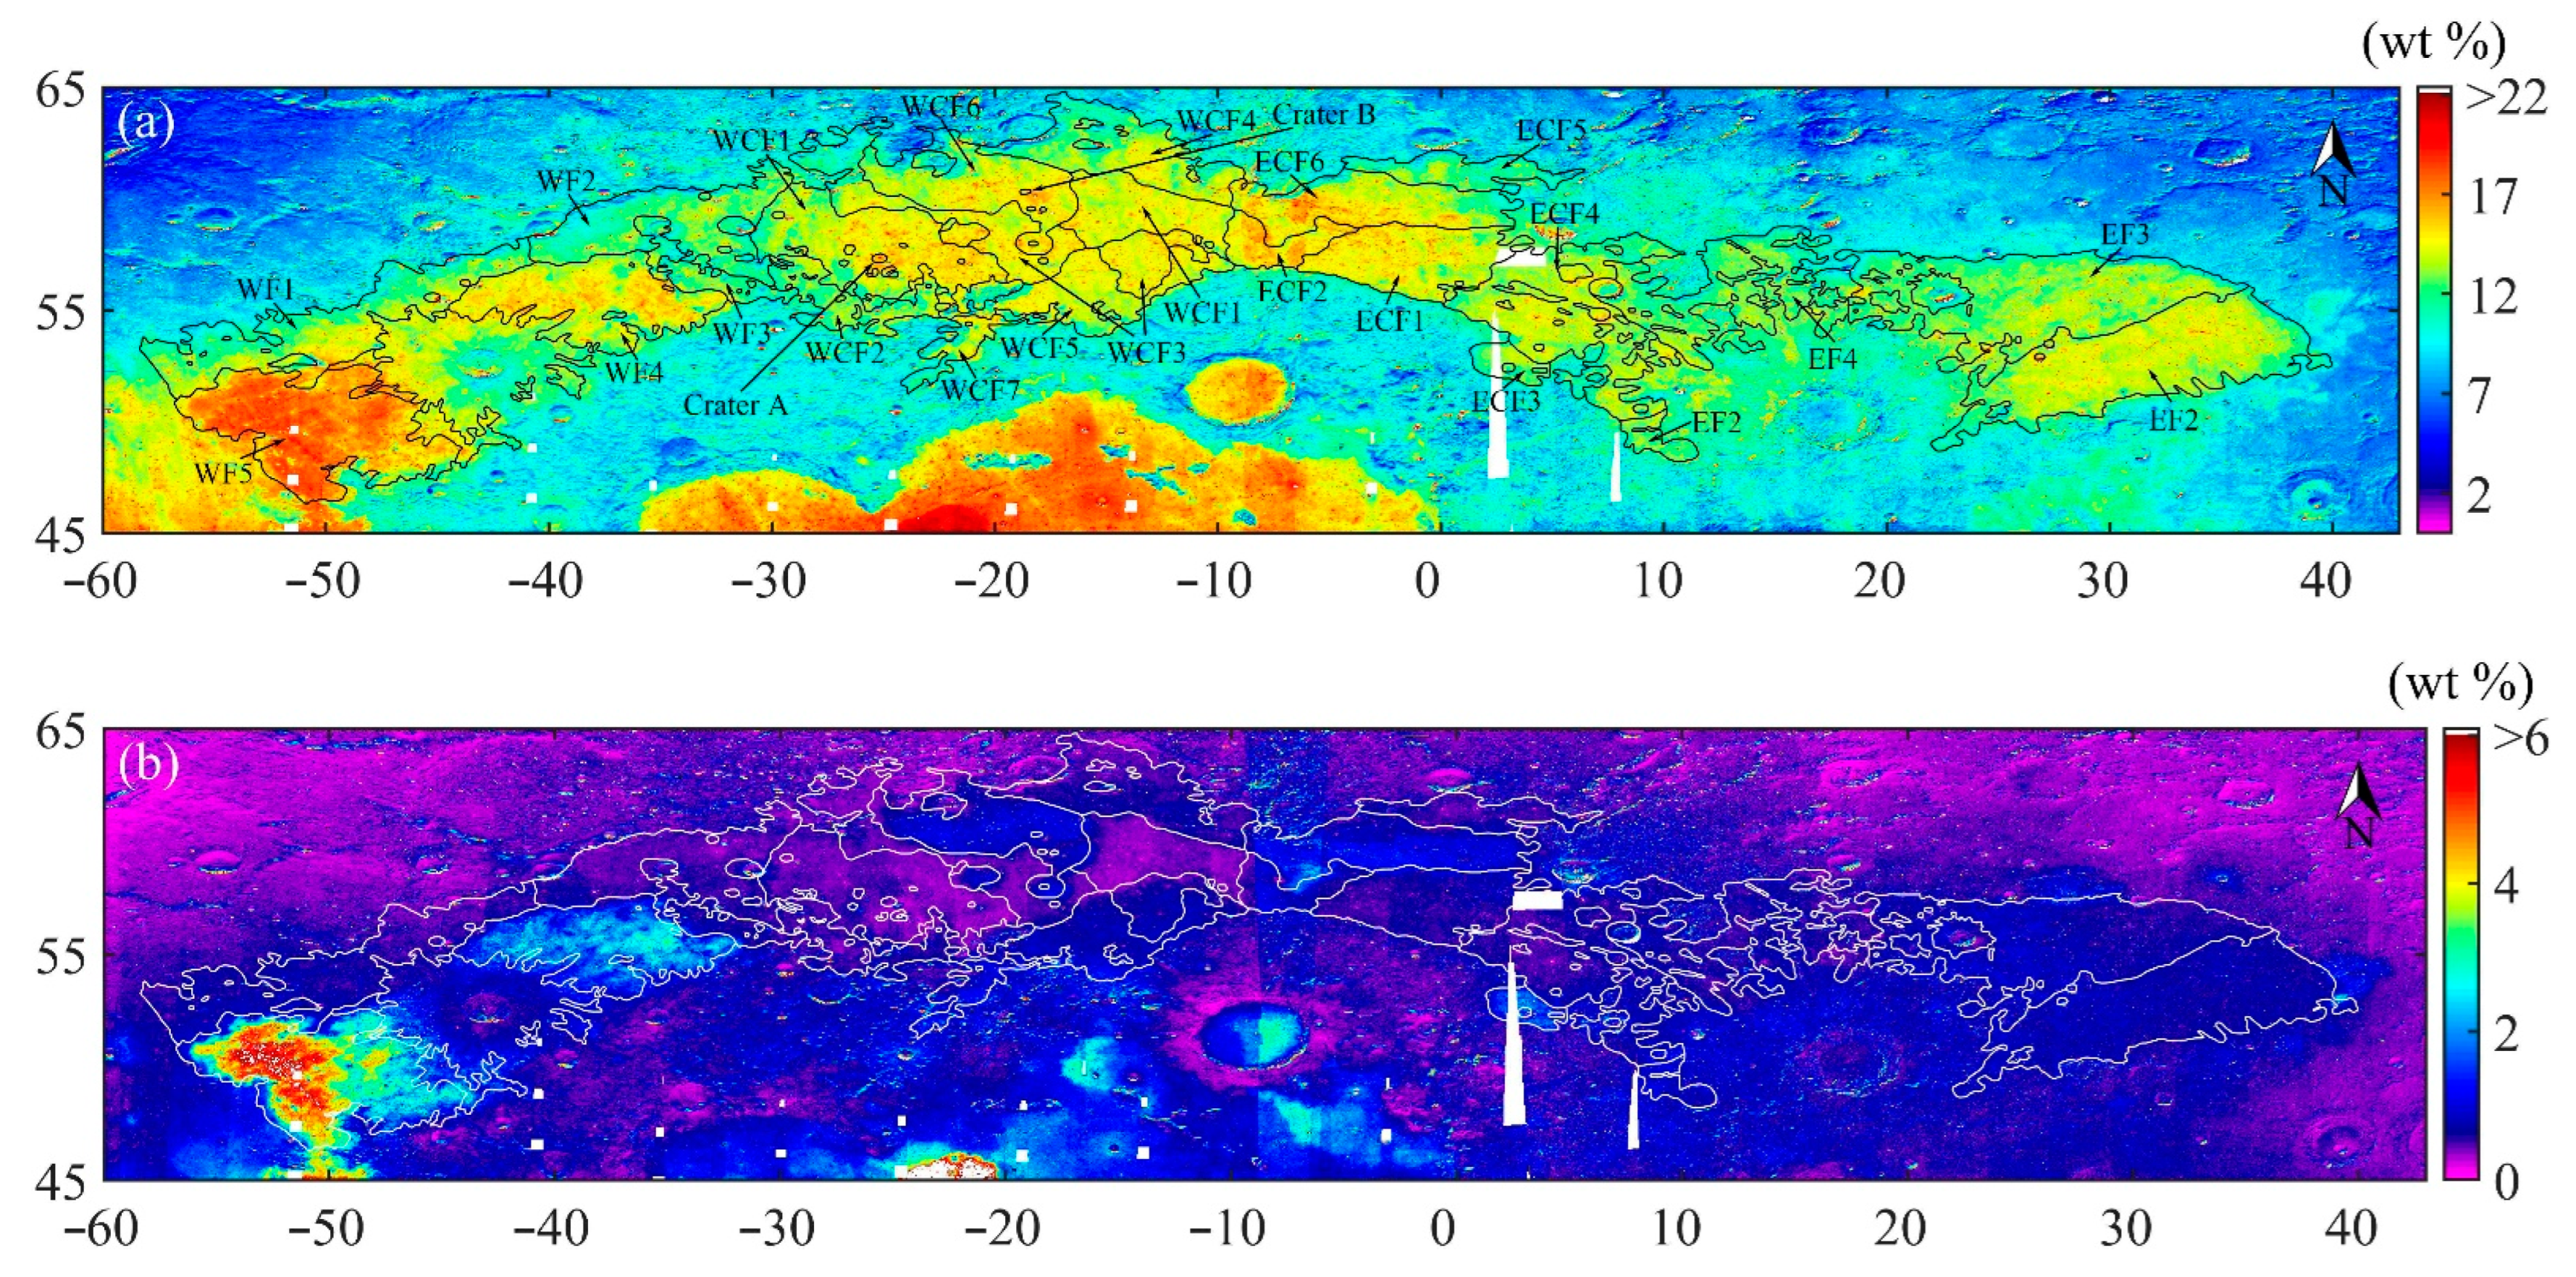
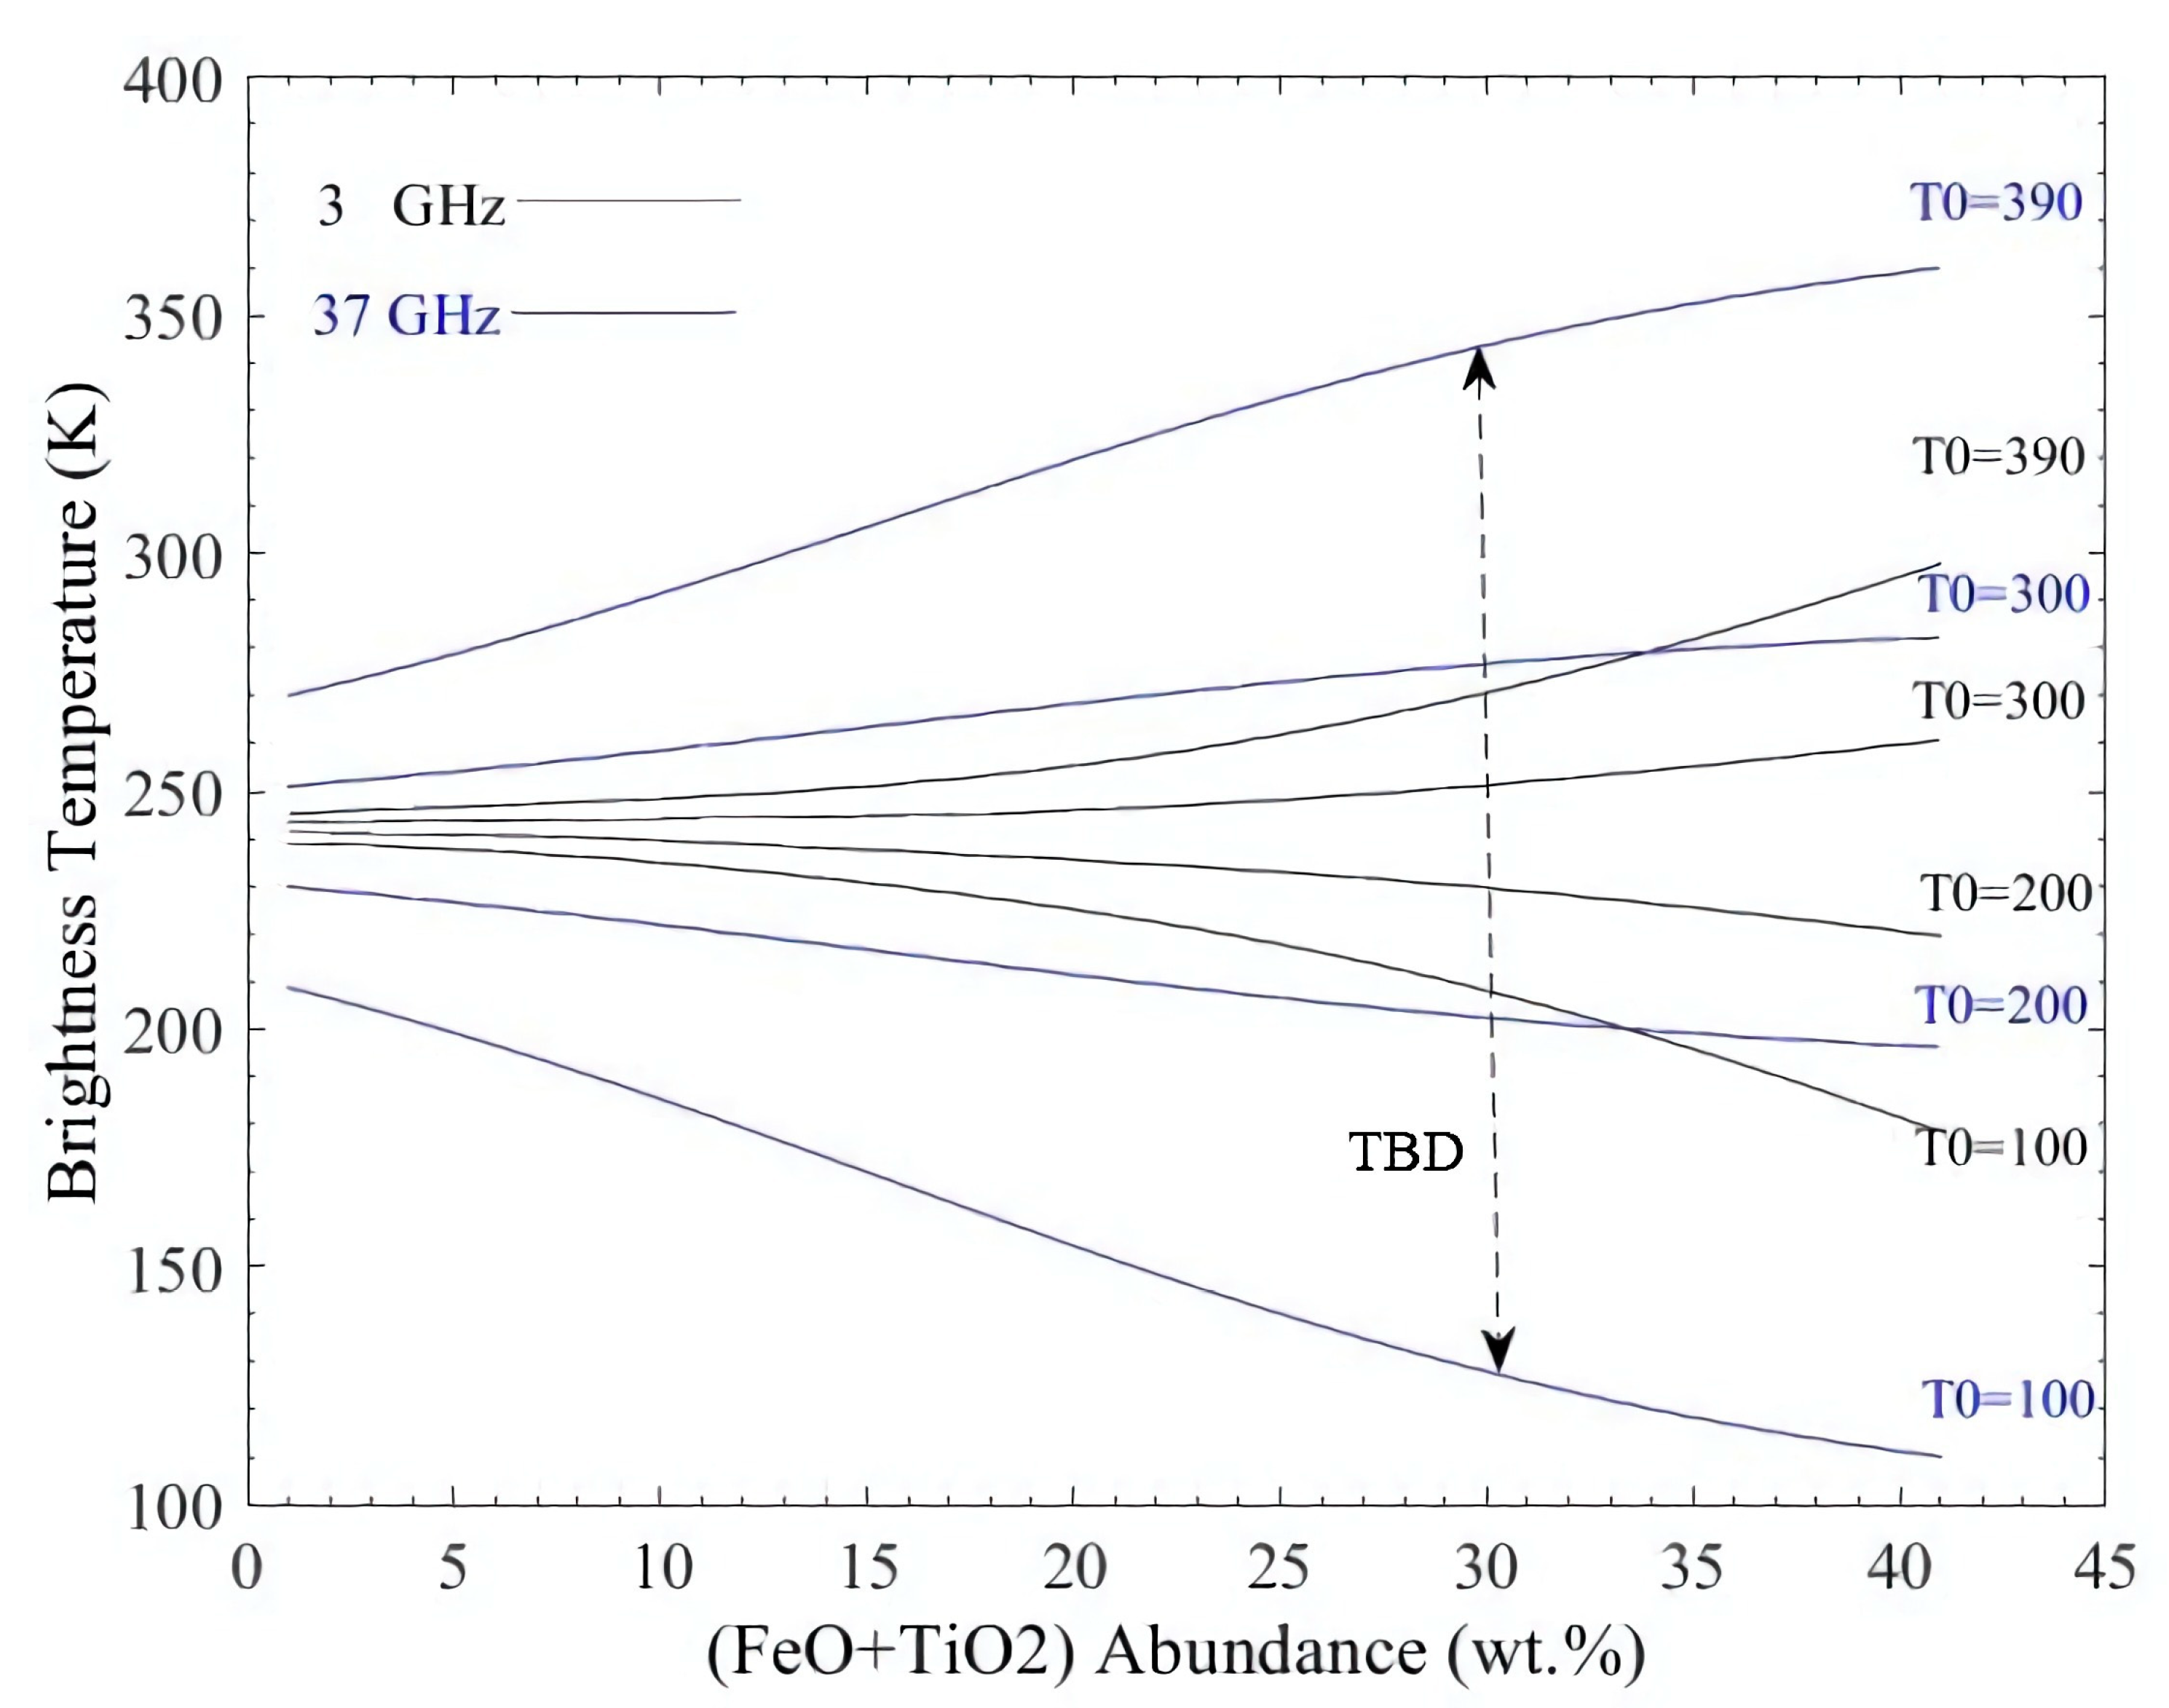
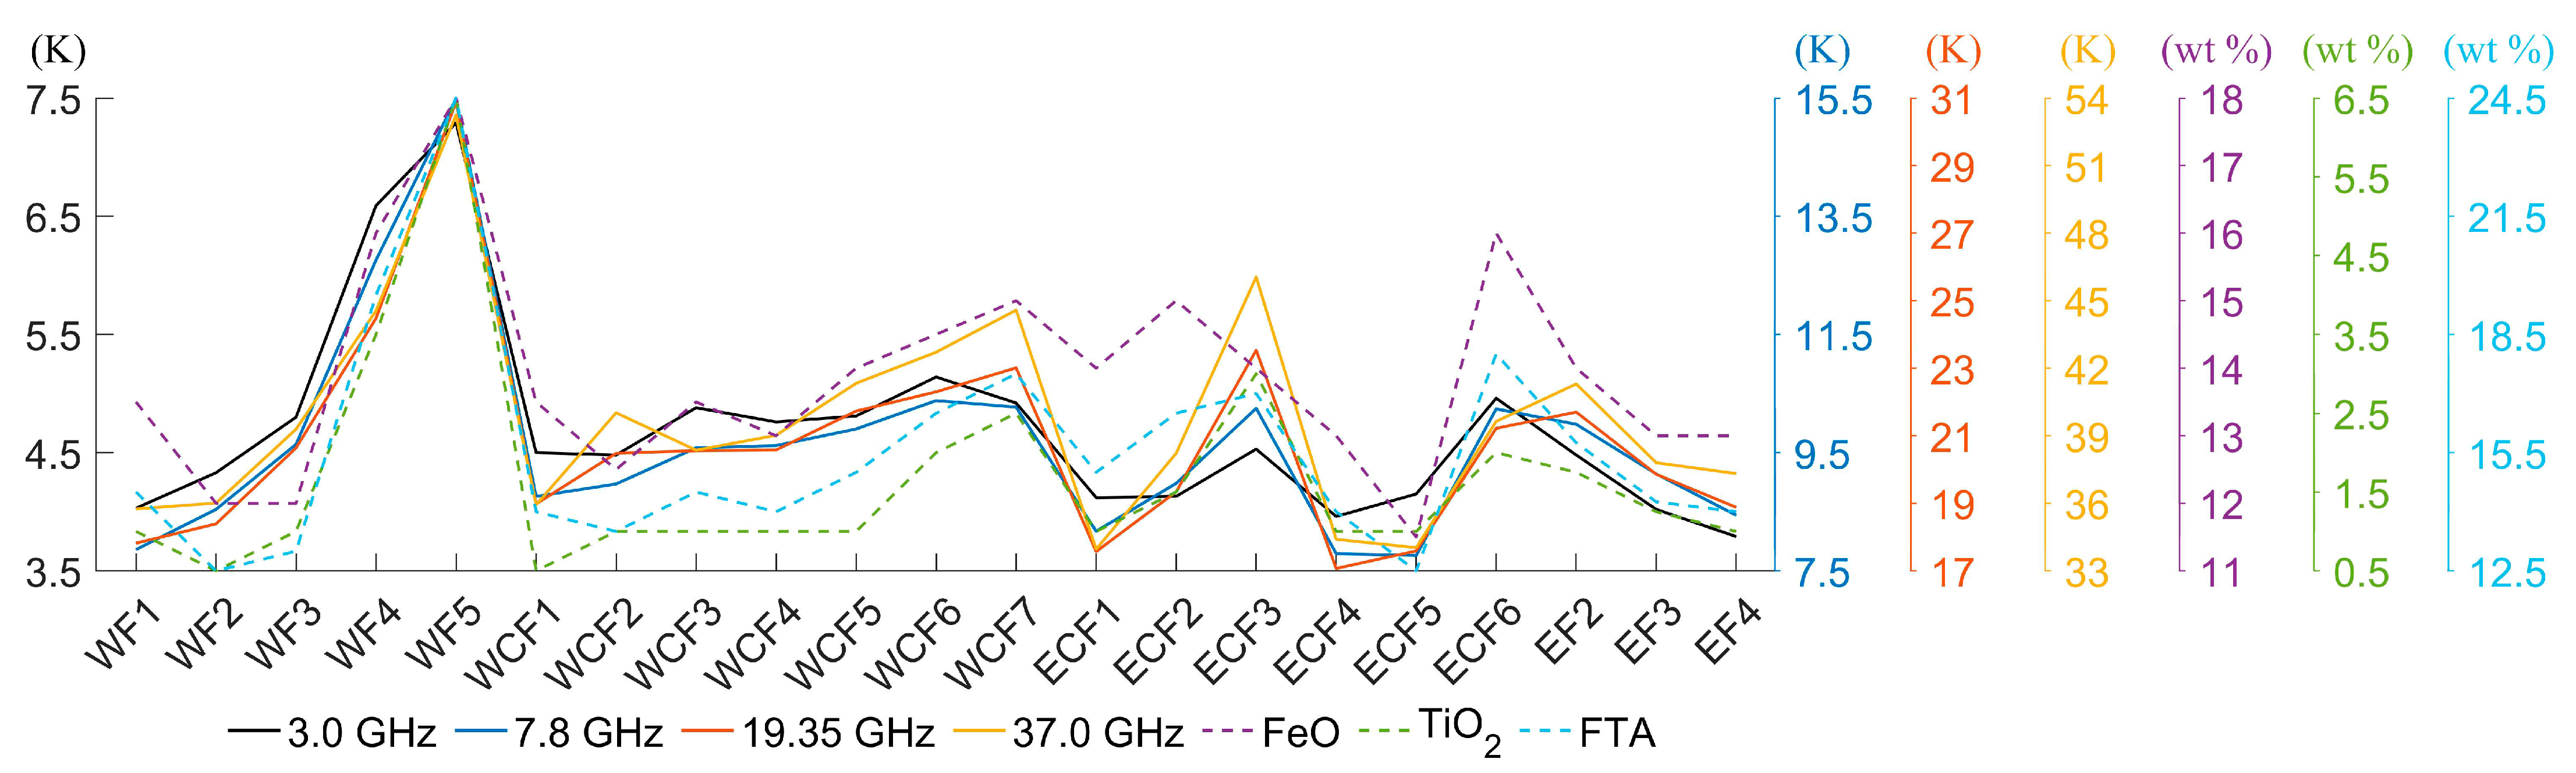
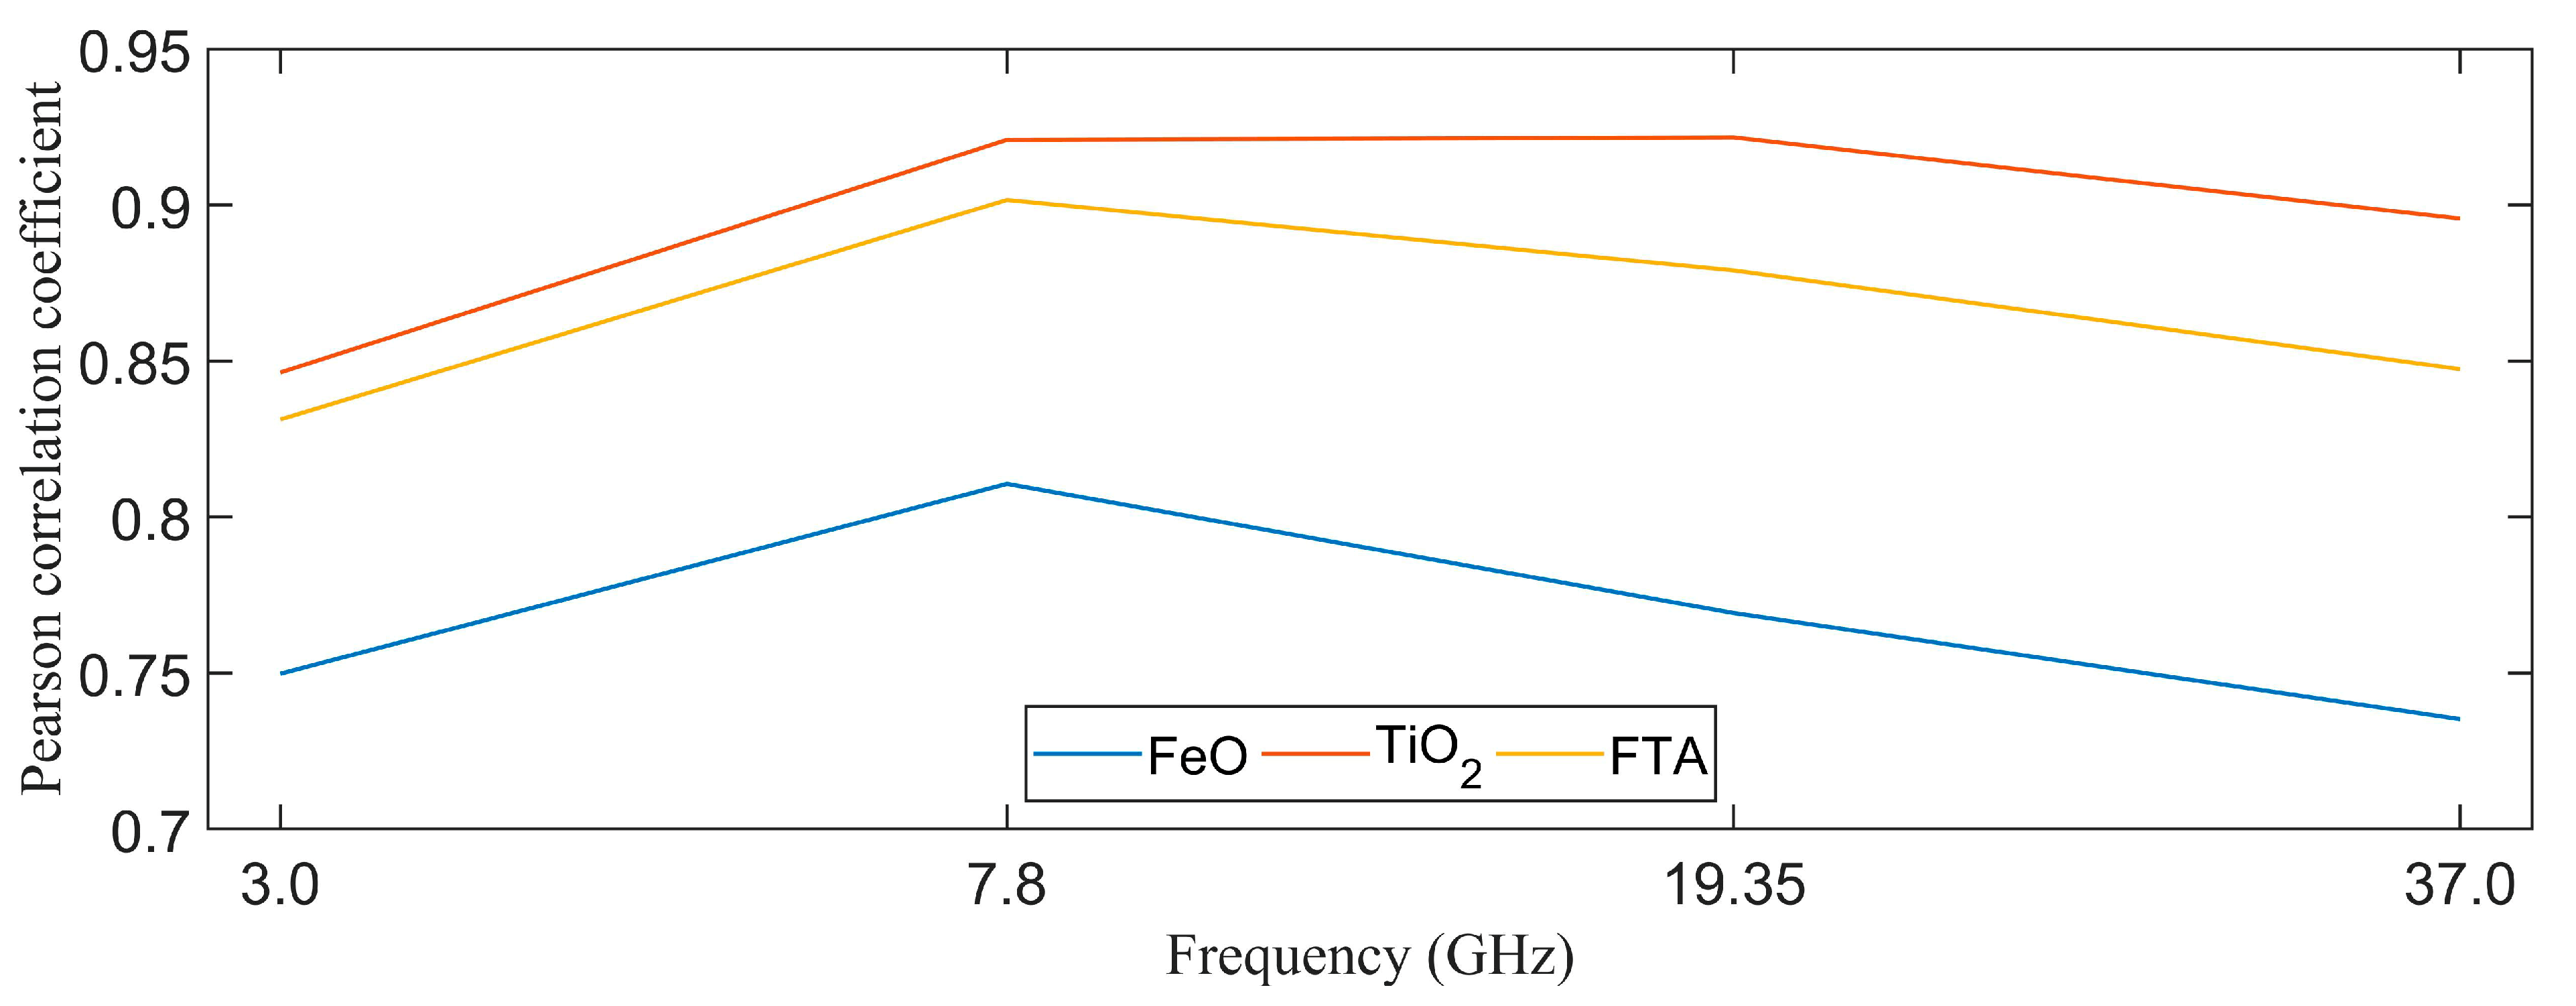
In most of the basaltic units mapped by Kramer et al. [2], the TBD results have a strong relationship with the FTA. Whether this relationship is valid or not should be verified for the whole of Mare Frigoris.
(3)
In most quadrants, the TBD results have a good agreement with the basaltic units. However, there were abnormal 3.0-GHz nTB results for the ECF1, ECF2, ECF5, and ECF6 units, which are relatively high both at noon and at night. The penetration depth of a 3.0-GHz microwave is about 1 m to 2 m [15], and the substrate temperature at this depth is slightly influenced by the surface temperature [30]. The causes of the TB anomaly, which will be discussed further in Section 4.2.

4. Discussion

Air and water are absent on the Moon, and because of this, microwaves can penetrate the regolith up to 10 to 20 times their wavelength [15,16], that is, about 1–2 m at 3.0 GHz, 38.5 cm to 75 cm at 7.8 GHz, 15.5 cm to 31 cm at 19.35 GHz, and 8.1 cm to 16.2 cm at 37 GHz. Therefore, the MRM data provide a fresh view of the surface deposits in Mare Frigoris when compared to the optical observations.

4.1. New Views of Basaltic Volcanism in Mare Frigoris

Although Mare Frigoris has suffered from severe contamination due to impact crater ejecta, the TB results of the basaltic units provide an opportunity to study the lunar basaltic volcanism of the maria.

4.1.1. Representation of TB to Basaltic Units

Mare Frigoris is one of the northmost maria on the lunar nearside, and its special elongated shape means that it has suffered more from severe contamination due to impact crater ejecta than other maria (Figure 1). Boyce et al. [7] and Hiesinger et al. [10] used Lunar Orbiter IV photographs and Clementine UVVIS data, respectively, to divide the basaltic units of Mare Frigoris, and both used the crater size-frequency distribution (CSFD) to determine the ages of the divided basaltic units. Kramer et al. [2] re-evaluated the basaltic units of Mare Frigoris by using the pristine compositions exposed by SCREP craters and the superposition relationship of the stratum. Generally, the results of these studies differ greatly from each other.
Based on the nTB and TBD maps, this study evaluated the basaltic unit result mapped by Kramer et al. [2] with reference to Hiesinger et al. [10]. The nTB and TBD results are consistent with the basaltic units mapped by Kramer et al. [2] (Figure 4, Figure 5 and Figure 6). Among all 21 units (excluding the EF1 unit in Lacus Mortis), most unit boundaries (in the case of 17 units) agree with the TBD results, but the boundaries of the WCF1, WCF3, ECF1, and ECF4 units do not (Figure 6). In particular, the TBD results for the WF4, WF5, WCF4, WCF6, ECF3, and ECF5 units strongly agree with the basaltic units obtained by Kramer et al. [2] (Figure 6). These indicate that the SCREP methodology and MRM data are consistent when it comes to characterizing basaltic units contaminated by impact crater ejecta.
Figure 13 shows the SCREP-based FeO abundances, TiO2 abundances, and FTA estimated by Kramer et al. [2] and the four-channel TBDs of all units. Here, the TBD is strongly correlated with the SCREP-based FTA of the basaltic units, that is, a higher TBD is directly related to a higher FTA.
The Pearson correlation coefficient (PCC) is one of the most widely used measures of relationships, and it can measure the linear correlation of two random variables [37,38]. To further evaluate the consistency of the pristine basalt compositions reflected by the MRM data and SCREP craters, we calculated the PCC between the TBDs and the SCREP-based FeO abundances, the TiO2 abundances, and the FTAs estimated by Kramer et al. [2] (Figure 14). The PCC of two sets of data, X (X1, X2, X3, …, Xn) and Y (Y1, Y2, Y3, …, Yn), is defined as the ratio between the covariance of the two sets of data and the product of their standard deviations, which is expressed as follows:
r x y = x i x ¯ y i y ¯ ( x i x ¯ ) 2 ( y i y ¯ ) 2
where x ¯ = 1 n i = 1 n x i is the mean value of data X and y ¯ = 1 n i = 1 n y i is the mean value of data Y. The coefficient rxy ranges from −1 to 1. If the two sets of data are directly related, rxy is positive; otherwise, it is negative. The closer the absolute value of rxy is to 1, the stronger the correlation between the two sets of data, and the two sets of data do not correlate when rxy = 0 [37,38].
In Figure 14, the average PCC is 0.77 between the four-channel TBDs and the FeO abundances of all units, 0.90 between the four-channel TBDs and the TiO2 abundances of all units, and 0.86 between the four-channel TBDs and the FTAs of all units. Generally, the PCC results indicate that there is a very strong correlation between the TBD and the pristine basalt compositions reflected by SCREP craters.
Therefore, compared with the optical detection results, the TB, especially the TBD, is highly related to the FTAs of the surface deposits and can represent the composition and distribution features of pristine basaltic units contaminated by impact crater ejecta.

4.1.2. New Views of Basaltic Volcanism

By combining the TB results, the SCREP-based FTA, and the superposition relationship of the stratum, two interesting findings related to the basaltic volcanism in Mare Frigoris were provided.
(1) In every quadrant, the younger basaltic units have the larger FTAs.
In the WF quadrant, according to the above discussions, the FTA of the WF1 unit should be lower than that of the WF2 unit. Thus, one conclusion can be obtained: the FTA gradually increases from the oldest WF1 unit to the youngest WF5 unit.
Meanwhile, the same conclusion was not obtained in whole WCF quadrant. As mentioned in Section 3.2.2, the FTA of the WCF1 unit was overestimated and should be smaller than that of the WCF2 unit. Thus, from the younger WCF1 unit to the older WCF3 unit, the FTA gradually increased, and from the younger WCF5 unit to older WCF7 unit, this trend was also detectable. The issue exists from the WCF3 unit to the WCF5 unit, where the FTA shows a trend of initially decreasing and subsequent increasing. Here, the relationship between the compositions and age of the WCF4 unit is problematic in the WCF quadrant. Figure 11 and Figure 12 show that there is no obvious TBD boundary between the WCF4 unit and the ECF6 unit. Therefore, if the WCF4 unit was removed from the WCF quadrant and included in the ECF6 unit, the remaining units in the WCF quadrant would satisfy observation regarding the basaltic volcanism of maria that the younger the age of the unit, the larger the FTA.
In the ECF quadrant, the new ECF1, ECF2, ECF3, and ECF6 units support the same conclusion, that is, the FTAs of older units are apparently lower than those of younger units. In the EF quadrant, if the ages estimated by Hiesinger et al. [10] are adopted, the ages of the three units still satisfy the observation that the younger the age of the basaltic unit, the larger the FTA. Therefore, in every quadrant, the FTA ((FeO + TiO2) abundances) of the basaltic units increases the younger they are.
(2) SCREP-based FTA results cannot completely avoid the influence of ejecta contamination.
As mentioned in Section 3.2, combined with the TB results and the ages obtained by Hiesinger et al. [10] and Kramer et al. [2], we simply counted the age of each unit as shown in Table 1, Table 2, Table 3 and Table 4. However, when combining the age and SCREP-based FTA results of all quadrants together, it was difficult to obtain a similar basaltic volcanism in every quadrant. In this regard, the accuracy of the estimated SCREP-based FTA was still debatable, and this can be explained thanks to the following three aspects.
(i) Table 1 and Table 3 show that the difference in terms of the SCREP-based FTA between the WF3 unit and the ECF6 unit is 5 wt %, while the difference in terms of the 37-GHz TBDs is only 0.4 K. Moreover, the difference in terms of the SCREP-based FTA between the EF1 unit and the ECF1 unit is only 1.5 wt %, but the difference in terms of the 37-GHz TBDs is as much as 4.9 K (Table 3 and Table 4). The same problem also exists in the case of the ECF6 and WF4 units, the EF1 and ECF1 units, and the WCF1 and WCF2 units.
(ii) In the above discussions, the TBD of the WF1 unit is lower than that of the WF2 unit, while Kramer et al. [2] showed that the FTA of the WF1 is higher than that of the WF2 unit. This circumstance also occurs in cases of the WCF1, WCF5, ECF4, and ECF5 units. Based on the theoretical simulation [24,28] and the aforementioned PCC between the TBD and the FTA, a possible reason for this issue is that Kramer et al. [2] overestimated the FTAs of the WF1, WCF1, and WCF5 units and underestimated the FTAs of the ECF4 and ECF5 units.
(iii) It has been noted that there are two large craters in Mare Frigoris: the Harpalus and Aristoteles craters. Apparently, the Harpalus crater has a great impact on the surrounding WF4 and WF5 units, which is reflected in the gradually decreasing TBD of the WF5 unit from west to east. The complex relationship between the TBDs, SCREP-based FTAs, and ages of the EF units is likely brought about by the ejecta from the Aristoteles craters.
Therefore, the TBD results suggest that the SCREP-based FTA results cannot completely avoid the influence of ejecta contamination. The combination of TBD and SCREP methodology likely provides a new way to accurately track the FTAs of basaltic deposits in the context of studying lunar basaltic volcanism in the future.

4.2. TB Anomalies in Mare Frigoris

There are two main types of TB anomalies in Mare Frigoris: the cold microwave anomaly and the warm microwave anomaly.

4.2.1. Cold Microwave Anomaly

Figure 4 and Figure 5 show two obvious nTB anomalies in the WCF1 and WCF6 units. In the WCF1 unit, Crater A indicates low nTB values, 3.0 and 7.8 GHz at noon and at the four channels at night, while Crater B in the WCF6 unit shows low nTB values of 7.8, 19.35, and 37 GHz at night and high nTB values at the four channels at noon. They both present high TBD values. Such TB behaviors are also found in the Necho, King, Giordano Bruno, and Vavilov craters [39], and we have called this the cold microwave anomaly, which is brought about by the existence of surface rocks.
Thus, this brought about a new problem in this study: what was the influence of surface rocks on our understanding of the relationship between the nTB and TBD results and the basaltic units?
This problem was also pointed out by Bugiolacchi et al. [40], who observed that the TBD features of interest are linked to impact craters and their ejecta in the western lunar farside, resulting in a strong relationship between the size of the anomaly and the target’s physical properties. Thus, a comparison between the TB behaviors in Crater A (the La Condamine S crater, 25.22°W, 57.34°N) and Crater B (an unnamed crater, 18.65°W, 60.33°N) provided a new way to evaluate the problem.
To better understand the relationship between the cold microwave anomaly and surface rocks, a rock abundance map was generated with the Diviner Radiometer data onboard the Lunar Reconnaissance Orbiter (LRO) satellite [41]. Figure 15 shows the rock abundance map of Mare Frigoris, which indicates abundant rocks appearing around Craters A and B. When combined with the findings in the Hertzsprung basin with the MRM data and the numerical simulation based on the microwave radiative transfer equations [39], the nTB and TBD results for Crater A are related to the existence of abundant rocks. Therefore, the cold microwave anomaly, which is related to the rocks in lunar highlands, is also relevant to the maria and should be taken into consideration in the study of mare deposits using MRM data.
However, the nTB and TBD results for Crater B are rather complicated. Here, Figure 15 shows that the rock abundance in Crater B is high, while Figure 4 and Figure 5 show an abnormally high 3.0-GHz nTB at night. In addition to this channel, others point towards a high nTB at noon and low nTB at night, which are consistent with the high FTA of the surface deposits in the region [24,28].
Moreover, in addition to the two craters, many craters occur with high rock abundances, but few of them can be identified by the nTB and TBD maps. Therefore, at least in Mare Frigoris, the main influencing factor behind the TB remains the FTAs of surface deposits. This finding also confirms the reliability of the new results regarding the basaltic volcanism of Mare Frigoris based on nTB and TBD performances.
Even so, the influence of rocks on the TB behaviors of surface deposits, as explained by Bugiolacchi et al. [40], should be considered for younger craters and will be further studied on a global scale in future.

4.2.2. Warm Microwave Anomaly

In the above discussion, we mentioned an abnormally high 3.0-GHz nTB in Crater B at night. At 3.0 GHz, high nTB anomalies exist also in the case of the ECF1, ECF6, WCF4, and WCF6 units, which was outlined in Figure 16a. Meanwhile, the 3.0-GHz nTB is still high at noon for these units, which is defined the warm microwave anomaly in this study. In the above section, we provided the abnormal 3.0-GHz nTB results for Crater B. Figure 15 shows that rocks are abundant in Crater B, and, theoretically, the 3.0-GHz nTB should be cold both at noon and at night [39]. However, the 3.0-GHz nTB is actually high both at noon and at night in the observation maps (Figure 4 and Figure 5), validating the rationality of the warm microwave anomaly in the case of Crater B and Mare Frigoris.
The warm microwave anomaly also occurs in Mare Nubium and Mare Moscoviense [28]. Through the use of numerical simulations, Meng et al. [28] eliminated the influences of the FTA of the regolith, surface topography, and surface rocks on the warm microwave anomaly. They hypothesized that the warm microwave anomaly is probably caused by the high substrate temperature, which was always set as a constant in previous studies [18,28]. To determine the cause of the warm microwave anomaly is priority when using passive microwave data [28,42]. The distribution of the warm microwave anomaly in Mare Frigoris provides some useful information related to this work.
Generally, in Mare Frigoris, the high nTB anomaly is mainly distributed in the ECF6 unit and extends from the boundary between the ECF1 and ECF4 units, through the ECF6 and WCF4 units, to the WCF6 unit, with a linear pattern in the NWW direction. When studying the gravity map of Mare Frigoris (Figure 16b), the positive Bouguer gravity anomaly has a clear relationship with the warm microwave anomaly in terms of spatial distribution. Figure 16b shows the Bouguer gravity anomaly derived from the Gravity Recovery and Interior Laboratory (GRAIL) mission, where a positive gravity anomaly extends from the boundary between the ECF1 and ECF4 units, through the ECF6 and WCF4 units, to the WCF6 unit in a linear pattern, with this agreeing with the distribution of the warm microwave anomaly. In particular, the positive Bouguer gravity anomaly occurs at the junction of eastern WCF1 unit and WCF4 unit with a nearly east-west distribution, coinciding with the warm microwave anomaly here. In addition, a positive Bouguer gravity anomaly also occurs in the north of WCF1 unit, which also indicates the high 3.0-GHz nTB anomaly.
Interestingly, Andrews-Hanna et al. [6] indicated the existence of the linear positive gravity anomaly in Mare Frigoris and interpreted it as a part of the huge magma plumbing system located in the Procellarum KREEP Terrane (Figure 16b). Moreover, the TB can reflect the dielectric properties of the regolith within the penetration depth and it is sensitive to the substrate temperature at 3.0 GHz [17,27]. Meanwhile, because there is no air on the Moon, abnormal TB performances are directly related to the thermal state of the shallow lunar crust and are significant in the study of the thermal evolution of the Moon.
Though the relationship between the positive Bouguer gravity anomaly, the magma pluming system, and the warm microwave anomaly is not clear, this possible relationship provides a new, noteworthy avenue of study to pursue in the context of determining the cause of the warm microwave anomaly and its potential geologic significance using the MRM data.

5. Conclusions

In this paper, the microwave thermal emission features of the basaltic units in Mare Frigoris, in addition to their (FeO + TiO2) abundances (FTAs) and ages, were studied using normalized brightness temperature (nTB) and brightness temperature difference (TBD) maps generated from Chang’e-2 microwave radiometer (MRM) data and a Bouguer gravity anomaly map derived from GRAIL data. The main conclusions are as follows:
(1)
The nTB and TBD results agree with the basaltic units based on the small crater rim and ejecta probing (SCREP) methodology. This indicates that MRM data are highly related to the (FeO + TiO2) abundance of pristine basalts and are less influenced by ejecta contamination when compared to SCREP-based FeO and TiO2 abundances.
(2)
Based on the nTB and TBD results, the SCREP-based (FeO + TiO2) abundance, and the superposition relationship of the stratum, it was found that, in most quadrants of Mare Frigoris, the (FeO + TiO2) abundances of basaltic units were higher at younger ages.
(3)
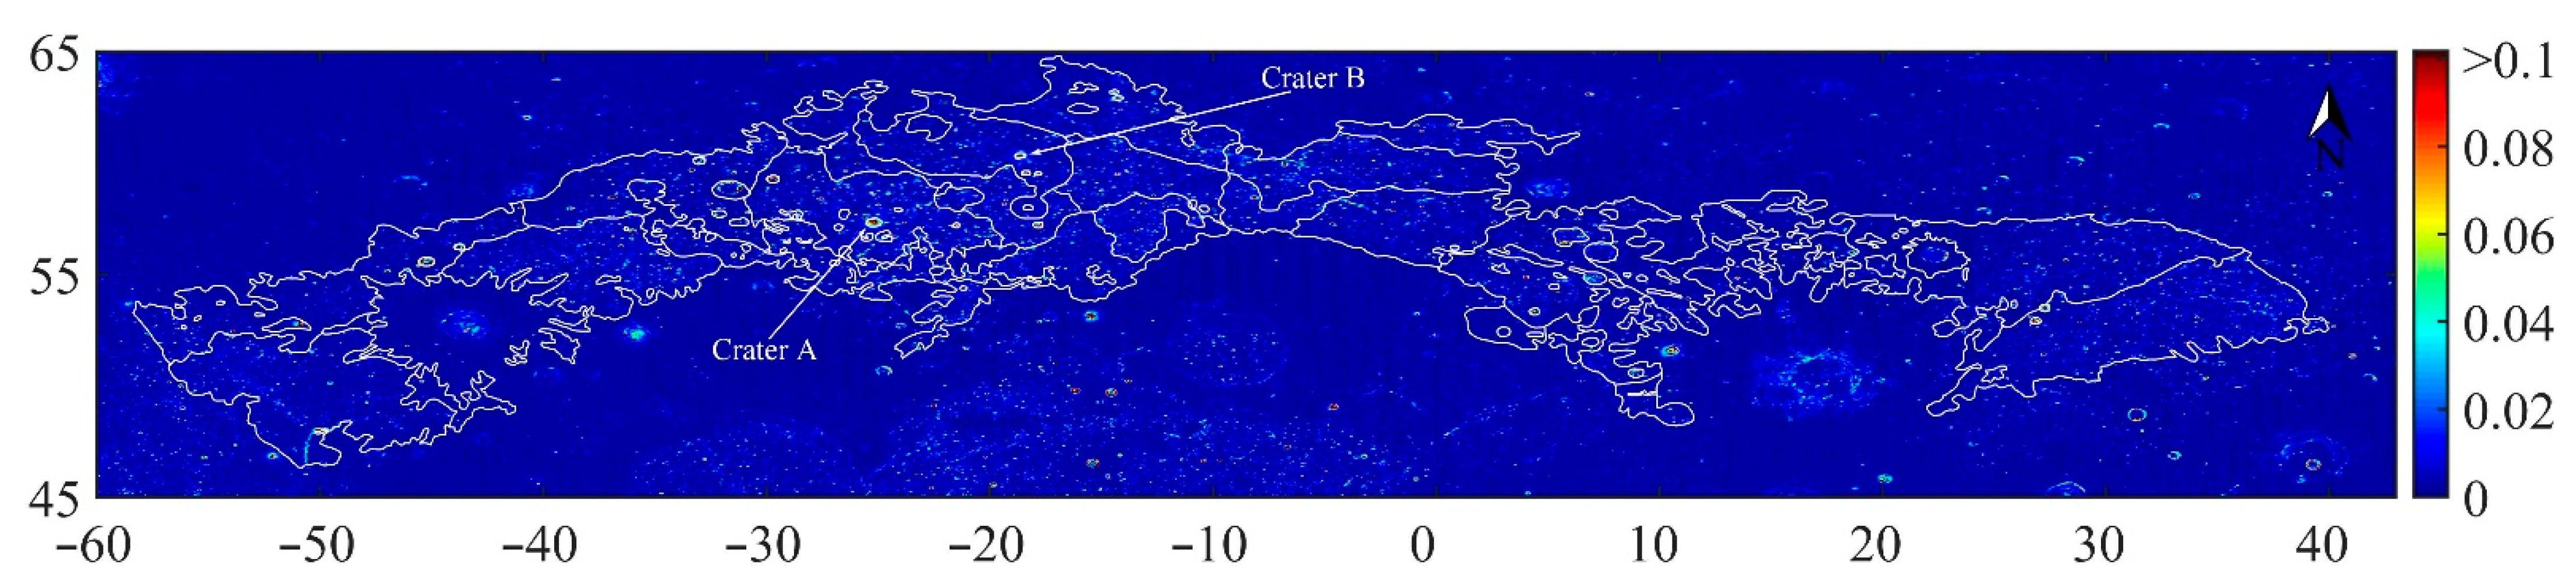
A comparison of the rock abundance map and the nTB and TBD results for Craters A and B indicated that, at least in Mare Frigoris, the (FeO + TiO2) abundances of surface deposits remains the main influencing factor behind the TB.
(4)
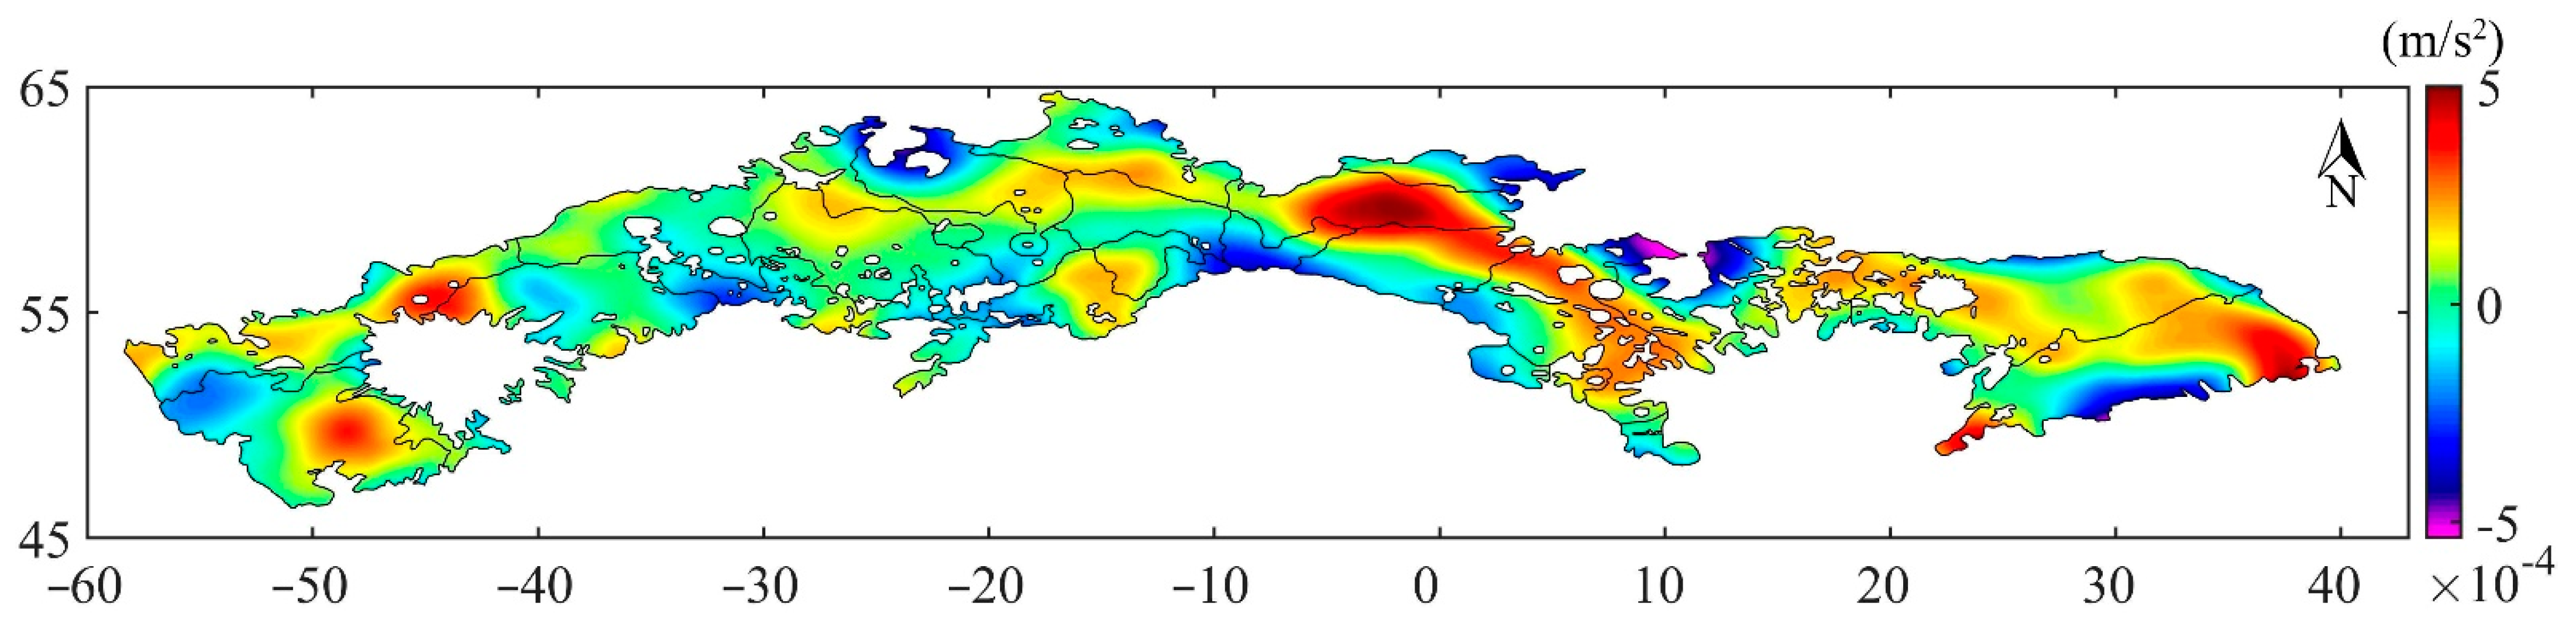
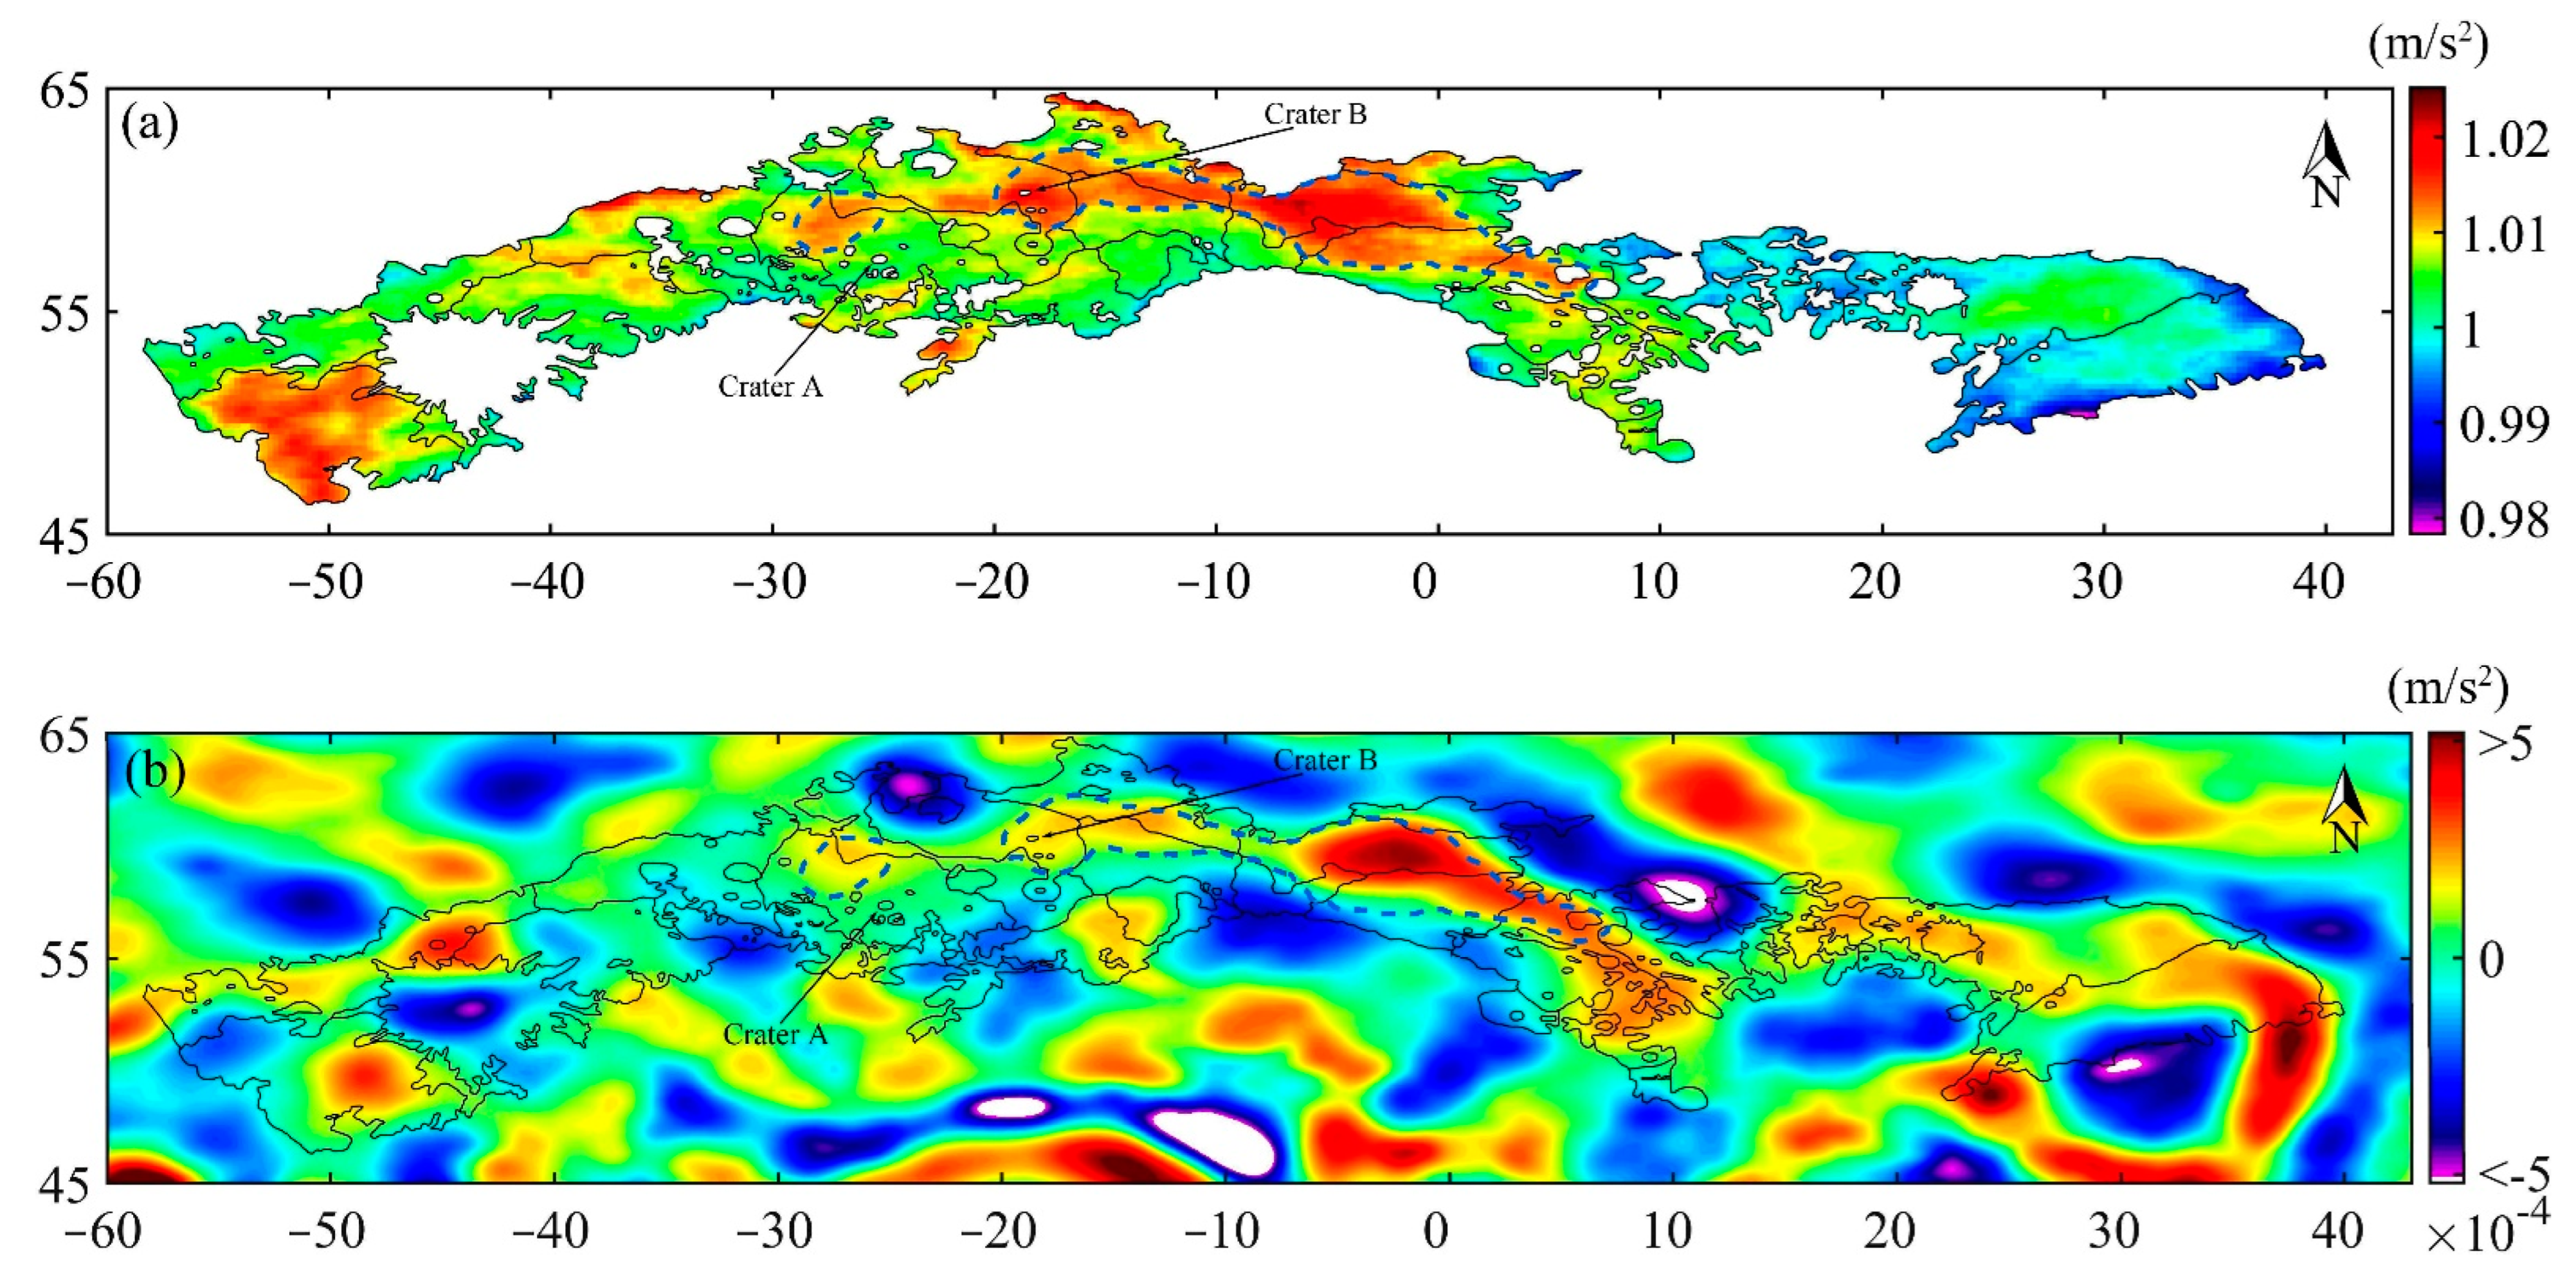
The warm microwave anomaly was revealed in the case of the ECF1, ECF6, WCF4, and WCF6 units, and showed a similar distribution to the Bouguer gravity anomaly derived from GRAIL data. This provides useful information in the context of determining the cause of the warm microwave anomaly.
Generally, in Mare Frigoris, in the context of heavy contamination due to impact crater ejecta, the MRM data verified the discoveries of Kramer et al. [2] concerning pristine basaltic deposits using SCREP craters, which are difficult to locate directly using optical data. Moreover, the MRM data provided a new description of the (FeO + TiO2) abundances of basaltic units and indicated their possible relationship with the deep information revealed by the Bouguer gravity anomaly. More work should be undertaken to further understand the relationship between brightness temperature performances and surface deposits on the Moon.

Author Contributions

Conceptualization, Z.M. and J.L.; methodology, Z.M. and Y.W.; software, J.L.; validation, Y.W., S.H. and J.P.; formal analysis, Z.M. and Z.C.; data curation, Z.M. and Y.W.; writing—original draft preparation, J.L. and Z.M.; writing—review and editing, J.L., Z.M., Y.W., S.H., J.P., Z.C. and Y.Z.; visualization, Z.M. and Y.Z.; supervision, Y.W. and S.H.; project administration, Z.M.; funding acquisition, Z.M. and Y.W. All authors have read and agreed to the published version of the manuscript.

Funding

This research was funded by the National Key R & D Program of China (No. 2021YFA0715104), the National Natural Science Foundation of China (No. 42071309), the Strategic Priority Research Program of the Chinese Academy of Sciences (No. XDB 41000000), the Opening Fund of the State Key Laboratory of Lunar and Planetary Sciences (Macau University of Science and Technology), Macau FDCT grant number 119/2017/A3, and the Science and Technology Development Fund (FDCT) of Macau (No. 0059/2020/A2).

Data Availability Statement

In this study, the MRM data were downloaded from https://moon.bao.ac.cn/ce5web/moonGisMap.search (accessed on 1 September 2019), the Clementine UVVIS data were downloaded from https://astrogeology.usgs.gov/search/map/Moon/Clementine/UVVIS/Lunar_Clementine_UVVIS_WarpMosaic_5Bands_200m (accessed on 9 February 2022), the WAC images were downloaded from https://wms.lroc.asu.edu/lroc/search (accessed on 20 June 2010), the GRAIL data were downloaded from https://pds-geosciences.wustl.edu/grail/grail-l-lgrs-5-rdr-v1/grail_1001/shadr/ (accessed on 27 April 2016), and the Rock abundance data were downloaded from https://ode.rsl.wustl.edu/moon/index.aspx (accessed on 21 February 2013).

Acknowledgments

The authors express their thanks to the people who aided this work, the providers of the data used in this article, and acknowledge the valuable suggestions provided by the peer reviewers.

Conflicts of Interest

The authors declare no conflict of interest regarding the publication of this paper.

References

  1. Whitford-Stark, J.L. The volcanotectonic evolution of Mare Frigoris. In Proceedings of the Lunar and Planetary Science Conference, Houston, TX, USA, 12–16 March 1990; pp. 175–185. [Google Scholar]
  2. Kramer, G.; Jaiswal, B.; Hawke, B.; Öhman, T.; Giguere, T.; Johnson, K. The basalts of mare Frigoris. J. Geophys. Res. Planets 2015, 120, 1646–1670. [Google Scholar] [CrossRef] [Green Version]
  3. Williams, N.R.; Bell, J.F., III; Watters, T.R.; Banks, M.E.; Daud, K.; French, R.A. Evidence for recent and ancient faulting at Mare Frigoris and implications for lunar tectonic evolution. Icarus 2019, 326, 151–161. [Google Scholar] [CrossRef]
  4. Giguere, T.; Hawke, B.R.; Gaddis, L.; Gustafson, J.; Lawrence, S.; Stopar, J.; Mattson, S.; Robinson, M. Geologic studies of volcanic constructs in eastern Mare Frigoris. In Proceedings of the Lunar and Planetary Science Conference, The Woodlands, TX, USA, 17–21 March 2014; p. 1318. [Google Scholar]
  5. Albin, E.; Harris, R. Volcanism Within Mare Frigoris: Further Evidence for Recent Eruptions on the Moon. In Proceedings of the Lunar and Planetary Science Conference, The Woodlands, TX, USA, 16–20 March 2015; p. 2633. [Google Scholar]
  6. Andrews-Hanna, J.C.; Besserer, J.; Head, J.W., III; Howett, C.J.; Kiefer, W.S.; Lucey, P.J.; McGovern, P.J.; Melosh, H.J.; Neumann, G.A.; Phillips, R.J. Structure and evolution of the lunar Procellarum region as revealed by GRAIL gravity data. Nature 2014, 514, 68–71. [Google Scholar] [CrossRef]
  7. Boyce, J.M. Ages of flow units in the lunar nearside maria based on Lunar Orbiter IV photographs. In Proceedings of the Lunar and Planetary Science Conference, Houston, TX, USA, 15–19 March 1976; pp. 2717–2728. [Google Scholar]
  8. Wilhelms, D.E.; John, F.; Trask, N.J. The Geologic History of the Moon; USGS: Reston, VA, USA, 1987; pp. 2330–7102. [Google Scholar]
  9. Staid, M.I.; Pieters, C.M. Integrated spectral analysis of mare soils and craters: Applications to eastern nearside basalts. Icarus 2000, 145, 122–139. [Google Scholar] [CrossRef]
  10. Hiesinger, H.; Head, J., III; Wolf, U.; Jaumann, R.; Neukum, G. Ages and stratigraphy of lunar mare basalts in Mare Frigoris and other nearside maria based on crater size-frequency distribution measurements. J. Geophys. Res. Planets 2010, 115, E03003. [Google Scholar] [CrossRef] [Green Version]
  11. Morota, T.; Haruyama, J.; Ohtake, M.; Matsunaga, T.; Honda, C.; Yokota, Y.; Kimura, J.; Ogawa, Y.; Hirata, N.; Demura, H. Timing and characteristics of the latest mare eruption on the Moon. Earth Planet. Sci. Lett. 2011, 302, 255–266. [Google Scholar] [CrossRef]
  12. Kramer, G.Y. Characterizing bedrock lithologies using small crater rims and ejecta probing (SCREP). Adv. Space Res. 2010, 45, 1257–1267. [Google Scholar] [CrossRef]
  13. Kramer, G.Y.; Combe, J.P.; Harnett, E.M.; Hawke, B.R.; Noble, S.K.; Blewett, D.T.; McCord, T.B.; Giguere, T.A. Characterization of lunar swirls at Mare Ingenii: A model for space weathering at magnetic anomalies. J. Geophys. Res. Planets 2011, 116, E04008. [Google Scholar] [CrossRef] [Green Version]
  14. Weider, S.Z.; Crawford, I.A.; Joy, K.H. Individual lava flow thicknesses in Oceanus Procellarum and Mare Serenitatis determined from Clementine multispectral data. Icarus 2010, 209, 323–336. [Google Scholar] [CrossRef] [Green Version]
  15. Campbell, B.A.; Carter, L.M.; Hawke, B.R.; Campbell, D.B.; Ghent, R.R. Volcanic and impact deposits of the Moon’s Aristarchus Plateau: A new view from Earth-based radar images. Geology 2008, 36, 135–138. [Google Scholar] [CrossRef]
  16. Fang, T.; Fa, W. High frequency thermal emission from the lunar surface and near surface temperature of the Moon from Chang’E-2 microwave radiometer. Icarus 2014, 232, 34–53. [Google Scholar] [CrossRef]
  17. Meng, Z.; Hu, S.; Wang, T.; Li, C.; Cai, Z.; Ping, J. Passive microwave probing mare basalts in mare imbrium using CE-2 CELMS data. IEEE J. Sel. Top. Appl. Earth Obs. Remote Sens. 2018, 11, 3097–3104. [Google Scholar] [CrossRef]
  18. Jin, Y.; Yan, F.; Liang, Z. Simulation of brightness temperature from the lunar surface using multi-channels microwave radiometers. Chin. J. Radio Sci. 2003, 18, 477–486. [Google Scholar]
  19. Hu, G.; Chan, K.L.; Zheng, Y.; Tsang, K.T.; Xu, A. Comparison and evaluation of the Chang’E microwave radiometer data based on theoretical computation of brightness temperatures at the Apollo 15 and 17 sites. Icarus 2017, 294, 72–80. [Google Scholar] [CrossRef]
  20. Mustard, J.F.; Head, J.W. Buried stratigraphic relationships along the southwestern shores of Oceanus Procellarum: Implications for early lunar volcanism. J. Geophys. Res. Planets 1996, 101, 18913–18925. [Google Scholar] [CrossRef]
  21. Xie, M.; Xiao, Z.; Zhang, X.; Xu, A. The provenance of regolith at the Chang’e-5 candidate landing region. J. Geophys. Res. Planets 2020, 125, e2019JE006112. [Google Scholar] [CrossRef]
  22. Zheng, Y.; Tsang, K.; Chan, K.; Zou, Y.; Zhang, F.; Ouyang, Z. First microwave map of the Moon with Chang’E-1 data: The role of local time in global imaging. Icarus 2012, 219, 194–210. [Google Scholar] [CrossRef]
  23. Zheng, Y.; Chan, K.L.; Tsang, K.T.; Zhu, Y.; Hu, G.P.; Blewett, D.T.; Neish, C. Analysis of Chang’E-2 brightness temperature data and production of high spatial resolution microwave maps of the Moon. Icarus 2019, 319, 627–644. [Google Scholar] [CrossRef]
  24. Fa, W.; Jin, Y. A primary analysis of microwave brightness temperature of lunar surface from Chang-E 1 multi-channel radiometer observation and inversion of regolith layer thickness. Icarus 2010, 207, 605–615. [Google Scholar] [CrossRef]
  25. Cai, Z.; Lan, T. Lunar brightness temperature model based on the microwave radiometer data of Chang’E-2. IEEE Trans. Geosci. Remote Sens. 2017, 55, 5944–5955. [Google Scholar] [CrossRef]
  26. Chan, K.L.; Tsang, K.T.; Kong, B.; Zheng, Y. Lunar regolith thermal behavior revealed by Chang’E-1 microwave brightness temperature data. Earth Planet. Sci. Lett. 2010, 295, 287–291. [Google Scholar] [CrossRef]
  27. Meng, Z.; Chen, S.; Zheng, Y.; Cheng, W.; Zhu, Y.; Cai, Z.; Zhang, Y.; Cao, W.; Hou, L. Mare Deposits Identification and Feature Analysis in Mare Australe Based on CE-2 CELMS Data. J. Geophys. Res. Planets 2020, 125, e2019JE006330. [Google Scholar] [CrossRef]
  28. Meng, Z.; Chen, S.; Wang, Y.; Wang, T.; Cai, Z.; Zhang, Y.; Zheng, Y.; Hu, S. Reevaluating Mare Moscoviense and its vicinity using Chang’E-2 microwave sounder data. Remote Sens. 2020, 12, 535. [Google Scholar] [CrossRef] [Green Version]
  29. Hu, G.; Chan, K.L.; Zheng, Y.; Xu, A. A rock model for the cold and hot spots in the Chang’E microwave brightness temperature map. IEEE Trans. Geosci. Remote Sens. 2018, 56, 5471–5480. [Google Scholar] [CrossRef]
  30. Heiken, G.H.; Vaniman, D.T.; French, B.M. Lunar Sourcebook, a User’s Guide to the Moon; Cambridge University Press: New York, NY, USA, 1991. [Google Scholar]
  31. Whitford-Stark, J.L.; Fryer, R. Origin of Mare Frigoris. Icarus 1975, 26, 231–242. [Google Scholar] [CrossRef]
  32. Hiesinger, H.; Head, J., III; Wolf, U.; Jaumann, R.; Neukum, G. Ages and stratigraphy of mare basalts in oceanus procellarum, mare nubium, mare cognitum, and mare insularum. J. Geophys. Res. Planets 2003, 108, 5065. [Google Scholar] [CrossRef] [Green Version]
  33. Lucey, P.G.; Blewett, D.T.; Jolliff, B.L. Lunar iron and titanium abundance algorithms based on final processing of Clementine ultraviolet-visible images. J. Geophys. Res. Planets 2000, 105, 20297–20305. [Google Scholar] [CrossRef]
  34. Meng, Z.; Yang, G.; Ping, J.; Cai, Z.; Gusev, A.; Osei, E.M. Influence of (FeO+ TiO2) abundance on the microwave thermal emissions of lunar regolith. Sci. China Earth Sci. 2016, 59, 1498–1507. [Google Scholar] [CrossRef]
  35. Meng, Z.; Lei, J.; Qian, Y.; Xiao, L.; Head, J.W.; Chen, S.; Cheng, W.; Shi, J.; Ping, J.; Kang, Z. Thermophysical Features of the Rümker Region in Northern Oceanus Procellarum: Insights from CE-2 CELMS Data. Remote Sens. 2020, 12, 3272. [Google Scholar] [CrossRef]
  36. Campbell, B.A.; Hawke, B.; Campbell, D.B. Surface morphology of domes in the Marius Hills and Mons Rümker regions of the Moon from Earth-based radar data. J. Geophys. Res. Planets 2009, 114, E01001. [Google Scholar] [CrossRef] [Green Version]
  37. Lee Rodgers, J.; Nicewander, W.A. Thirteen ways to look at the correlation coefficient. Am. Stat. 1988, 42, 59–66. [Google Scholar] [CrossRef]
  38. Zhou, H.; Deng, Z.; Xia, Y.; Fu, M. A new sampling method in particle filter based on Pearson correlation coefficient. Neurocomputing 2016, 216, 208–215. [Google Scholar] [CrossRef]
  39. Meng, Z.; Lei, J.; Xiao, Z.; Cao, W.; Cai, Z.; Cheng, W.; Feng, X.; Ping, J. Re-Evaluating Influence of Rocks on Microwave Thermal Emission of Lunar Regolith Using CE-2 MRM Data. IEEE Trans. Geosci. Remote Sens. 2022, 60, 1–12. [Google Scholar] [CrossRef]
  40. Bugiolacchi, R.; Hu, G.P. The Moon in the Microwave: Shedding New Light on the Lunar Farside. J. Geophys. Res. Planets 2022, 127, e2021JE007039. [Google Scholar] [CrossRef]
  41. Bandfield, J.L.; Ghent, R.R.; Vasavada, A.R.; Paige, D.A.; Lawrence, S.J.; Robinson, M.S. Lunar surface rock abundance and regolith fines temperatures derived from LRO Diviner Radiometer data. J. Geophys. Res. Planets 2011, 116, E00H02. [Google Scholar] [CrossRef]
  42. Keihm, S.J. Interpretation of the lunar microwave brightness temperature spectrum: Feasibility of orbital heat flow mapping. Icarus 1984, 60, 568–589. [Google Scholar] [CrossRef]
Figure 1. A wide-angle camera image of Mare Frigoris from the Lunar Reconnaissance Orbiter Camera (Equidistant Cylindrical projection), which was downloaded from https://wms.lroc.asu.edu/lroc/search (accessed on 20 June 2010). The black lines are the geologic boundaries and the abbreviations marked WCF5 in the west to EF2 in the east are the basaltic units of Mare Frigoris mapped by Kramer et al. [2]. The geologic boundaries were vectorized from the geologic map provided by Kramer et al. [2] and overlaid on this map and the following Figures 3–7, 9, 15, and 16. Crater A and Crater B are the two craters with brightness temperature anomalies, as discussed in Section 3.2.2 and Section 4.2.1.
Remotesensing 14 02725 g001
Figure 2. (a) The histogram of MRM data points in one lunation (24 h), (b) the scatter map of the MRM data points from 12:26 to 13:08, and (c) the scatter map of the MRM data points from 0:00 to 0:39 in Mare Frigoris (equidistant cylindrical projection).
Remotesensing 14 02725 g002
Figure 3. TB maps of Mare Frigoris at 37 GHz (equidistant cylindrical projection): (a) noon and (b) night. The black lines are the geologic boundaries of Mare Frigoris mapped by Kramer et al. [2].
Remotesensing 14 02725 g003
Figure 4. Normalized TB maps of Mare Frigoris at noon: (a) 3.0 GHz, (b) 7.8 GHz, (c) 19.35 GHz, and (d) 37 GHz (equidistant cylindrical projection). The black lines are the geologic boundaries of Mare Frigoris mapped by Kramer et al. [2]. Crater A and Crater B are two craters with TB anomalies, as discussed in Section 3.2.2 and Section 4.2.1.
Remotesensing 14 02725 g004aRemotesensing 14 02725 g004b
Figure 5. Normalized TB maps of Mare Frigoris at night: (a) 3.0 GHz, (b) 7.8 GHz, (c) 19.35 GHz, and (d) 37 GHz (equidistant cylindrical projection). The black lines are the geologic boundaries of Mare Frigoris mapped by Kramer et al. [2]. Crater A and Crater B are two craters with TB anomalies, as discussed in Section 3.2.2 and Section 4.2.1.
Remotesensing 14 02725 g005
Figure 6. TB difference maps of Mare Frigoris: (a) 3.0 GHz, (b) 7.8 GHz, (c) 19.35 GHz, and (d) 37 GHz (equidistant cylindrical projection). The black lines are the geologic boundaries of Mare Frigoris mapped by Kramer et al. [2]. The orange lines are the profiles from the western WCF1 unit to the western WCF3 unit, from the WCF4 unit to the ECF6 unit, and from the WCF5 unit to the eastern the WCF3 unit. Crater A and Crater B are two craters with TB anomalies, as discussed in Section 3.2.2 and Section 4.2.1.
Remotesensing 14 02725 g006
Figure 7. (a) FeO and (b) TiO2 abundance maps of Mare Frigoris (equidistant cylindrical projection). The (a) black and (b) white lines are the geologic boundaries of Mare Frigoris mapped by Kramer et al. [2].
Remotesensing 14 02725 g007
Figure 8. Change in simulated TB with (FeO + TiO2) abundance and surface temperature [34,35]. T0 is the supposed surface temperature (unit: K), which is given as 390 K and 300 K (typical daytime temperatures) and 200 K and 100 K (typical nighttime temperatures).
Remotesensing 14 02725 g008
Figure 9. Bouguer gravity anomaly of Mare Frigoris (equidistant cylindrical projection). The black lines are the basaltic unit boundaries of Mare Frigoris mapped by Kramer et al. [2].
Remotesensing 14 02725 g009
Figure 10. TB difference map of Mare Frigoris at 37 GHz (equidistant cylindrical projection). The black lines are the geologic boundaries determined by Hiesinger et al. [10].
Remotesensing 14 02725 g010
Figure 11. The profiles of the 37-GHz TBD from the western WCF1 (WCF1 (W)) to the western WCF3 (WCF3 (W)), from the WCF4 unit to the ECF6 unit, and from the WCF5 unit to the eastern WCF3 (WCF3 (E)). The black dashed line represents the boundary between the basaltic units mapped by Kramer et al. [2]. The locations of the profiles are shown in Figure 6d (orange lines).
Remotesensing 14 02725 g011
Figure 12. New geologic sketch of basaltic units in Mare Frigoris (equidistant cylindrical projection). The numbers after the unit names represent the ages in Ga. The base map is the TBD at 37 GHz.
Remotesensing 14 02725 g012
Figure 13. The SCREP-based FeO, TiO2, and FTA values mapped by Kramer et al. [2] and the four-channel TBDs of all units.
Remotesensing 14 02725 g013
Figure 14. Pearson correlation coefficients between the TBD and the SCREP-based FeO, TiO2, and FTA values of the basaltic units mapped by Kramer et al. [2].
Remotesensing 14 02725 g014
Figure 15. Rock abundance map of Mare Frigoris (equidistant cylindrical projection). The white lines are the geologic boundaries of Mare Frigoris mapped by Kramer et al. [2]. The rock abundance data were downloaded from https://ode.rsl.wustl.edu/moon/index.aspx (accessed on 21 February 2013).
Remotesensing 14 02725 g015
Figure 16. (a) 3.0-GHz normalized TB map at noon and (b) Bouguer gravity anomaly map of Mare Frigoris (equidistant cylindrical projection). The blue dash lines indicate the range of the warm microwave anomaly in Mare Frigoris. The black lines are the geologic boundaries of Mare Frigoris mapped by Kramer et al. [2].
Remotesensing 14 02725 g016
Table 1. The SCREP-based FeO, TiO2, and FTA values mapped by Kramer et al. [2] and the four-channel TBDs of the WF1, WF2, WF3, WF4, and WF5 units.
UnitsTBD (K)FeO (wt %)TiO2 (wt %)FTA (wt %)Age (Ga)
3.0 GHz7.8 GHz19.35 GHz37 GHz
WF14.0 7.9 17.8 35.8 13–14114–153.72
WF24.3 8.5 18.4 36.0 12<112–133.54
WF34.2 8.8 19.5 38.0 121 133.39
WF46.6 12.8 24.5 44.5 163–419–20<3.39
WF57.3 15.5 30.9 53.2 186–724–25<WF4
Table 2. The SCREP-based FeO, TiO2, and FTA values mapped by Kramer et al. [2] and the four-channel TBDs of the WCF1, WCF2, WCF3, WCF4, WCF5, WCF6, and WCF7 units.
UnitsTBD (K) FeO (wt %)TiO2 (wt %)FTA (wt %)Age (Ga)
3.0 GHz7.8 GHz19.35 GHz37 GHz
WCF14.5 8.8 19.0 35.9 13–14<113–153.53
WCF1 (W)4.79.119.136.313–14<113–153.53
WCF1 (E)4.28.318.835.413–14<113–153.53
WCF24.5 9.0 20.5 40.0 12–13113–143.49
WCF34.9 9.6 20.6 38.4 13–14114–153.46
WCF3 (W)4.99.119.536.413–14114–153.46
WCF3 (E)4.910.422.742.213–14114–153.46
WCF44.8 9.6 20.6 39.0 131143.43
WCF54.8 9.9 21.7 41.3 141153.11
WCF65.1 10.4 22.3 42.7 14–15216–17<3.11
WCF74.9 10.3 23.0 44.6 152–317–18<WCF6
Table 3. The SCREP-based FeO, TiO2, and FTA values mapped by Kramer et al. [2] and the four-channel TBDs of the ECF1, ECF2, ECF3, ECF4, ECF5, and ECF6 units.
UnitsTBD (K)FeO (wt %)TiO2 (wt %)FTA (wt %)Age (Ga)
3.0 GHz7.8 GHz19.35 GHz37 GHz
ECF14.18.217.634141153.56
ECF24.1919.338.2151.516.53.54
ECF34.510.223.546.1143173.47
ECF447.817.134.4131143.56
ECF54.17.817.63411–12112–133.56
ECF6510.221.239.616218<3.47
Table 4. The SCREP-based FeO, TiO2, and FTA values mapped by Kramer et al. [2] and the four-channel TBDs of the EF2, EF3, and EF4 units.
UnitsTBD (K)FeO (wt %)TiO2 (wt %)FTA (wt %)Age (Ga)
3.0 GHz7.8 GHz19.35 GHz37 GHz
EF24.51021.741.3141.5–215.5–163.64
EF349.119.937.8131–1.514–14.53.56
EF43.88.118.536.2131143.14
Publisher’s Note: MDPI stays neutral with regard to jurisdictional claims in published maps and institutional affiliations.

