Article

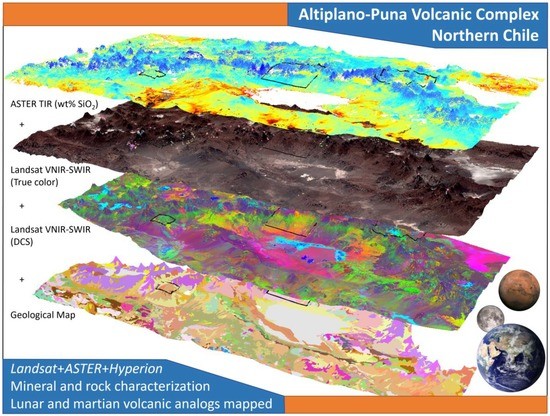
Remote Sensing Survey of Altiplano-Puna Volcanic Complex Rocks and Minerals for Planetary Analog Use

1
Centre de Recherche Pétrographiques et Géochimiques (CRPG), Centre National de la Recherche Scientifique (CNRS)/Université de Lorraine, 15 Rue Notre Dame des Pauvres, 54500 Vandoeuvre-lès-Nancy, France
2
Department of Geological Sciences, University of Cape Town, Rondebosch 7700, South Africa
3
Centro de Excelencia en Geotermia de los Andes and Departamento de Geología, Universidad de Chile, Plaza Ercilla, Santiago 803, Chile
4
Institut Pierre Simon Laplace, Centre National de la Recherche Scientifique (CNRS), 91120 Palaiseau, France
*
Author to whom correspondence should be addressed.
Remote Sens. 2022, 14(9), 2081; https://doi.org/10.3390/rs14092081
Submission received: 24 January 2022 / Revised: 25 February 2022 / Accepted: 2 March 2022 / Published: 26 April 2022
(This article belongs to the Special Issue Planetary Geologic Mapping and Remote Sensing)

Abstract

:
The Altiplano-Puna Volcanic Complex (APVC) of the Central Andes is an arid region with extensive volcanism, possessing various geological features comparable to those of other solar system objects. The unique features of the APVC, e.g., hydrothermal fields and evaporite salars, have been used as planetary analogs before, but the complexity of the APVC presents a wealth of opportunities for more analog studies that have not been exploited previously. Motivated by the potential of using the APVC as an analog of the volcanic terrains of solar system objects, we mapped the mineralogy and silica content of the APVC up to ~100,000 km2 in northern Chile based on a combination of remote sensing data resembling those of the Moon and Mars. The band ratio indices of Landsat 8 Operational Land Imager multispectral images and mineral classifications based on spectral hourglass approach using Earth Observing-1 Hyperion hyperspectral images (both in the visible to shortwave infrared wavelengths) were used to map iron-bearing and alteration minerals. We also used Hyperion imagery to detect feldspar spectral signatures and demonstrated that feldspar minerals can be detected on non-anorthosites, which may influence interpretations of feldspar spectral signatures on Mars. From the Terra Advanced Spaceborne Thermal Emission and Reflection Radiometer Global Emissivity Dataset, we derived the silica percentage of non-evaporite rocks within errors of approximately 2–3 wt.% SiO2 for those in the 60–70 wt.% range (about 8 wt.% errors for the 50–60 wt.% range). Based on an integrated assessment of the three datasets, we highlighted three regions of particular interest worthy of further field investigation. We also evaluated the benefits and limitations of all three remote sensing methods for mapping key minerals and capturing rock diversity, based on available samples and existing geological maps.

Graphical Abstract

1. Introduction

Planetary analog studies are comparisons of properties of areas on Earth that have similar characteristics as extraterrestrial bodies in order to gain insights about solar system objects and beyond. Analogs on Earth are often the only opportunity for researchers to conduct rigorous investigations with a suite of advanced instruments, test models, and verify remote sensing observations with ground-truth experiments; thus, planetary analog studies have been one of the crucial methods for understanding extraterrestrial bodies. As new missions to various solar system objects by multiple countries progress this decade [1,2,3,4], new questions that cannot be answered by spacecraft alone are expected to arise, and to respond to them, planetary analog studies will continue to play an important role.
Many planetary analog studies with a variety of objectives have been conducted invarious parts of the world since the beginning of the modern exploration of extraterrestrial bodies. One of the most often-used terrain types for analog studies are volcanic fields, as large proportions of lunar and Martian surfaces are volcanic in nature [5,6,7]. In recent years, multi-institutional programs, such as NASA Desert Research and Technology Studies (Desert RATS), Solar System Exploration Research Virtual Institute (SSERVI), and Planetary Science and Technology from Analog Research (PSTAR), have made considerable progress at volcanic analog sites including the Hawaiian Islands and lava fields in the western United States (e.g., Craters of the Moon National Monument, Idaho) [8,9,10,11,12]. These large programs used the analog sites for scientific investigations, technology developments, and operations testing. Other analog studies focused on the geochemical aspects of volcanic fields, mainly alterations in minerals and rocks. For example, at the Atacama Desert of northern Chile, Ruff et al. [13] investigated the silica deposits of the El Tatio hydrothermal field, which closely resembled observations made by the Mars Exploration Rover. Flahaut et al. [14] and Yant et al. [15] compared the Solfatara volcanic crater in central Italy and Kilauea’s December 1974 Flow in Hawaii, respectively, to fumarolic alterations on Mars. For astrobiology, alteration and other extreme environments are relevant for life-supporting conditions on extraterrestrial bodies, and altered and evaporite areas such as those in the Central Andes and Australia have been used for astrobiology analog studies [16,17]. The cold environments found in Antarctica are also studied often for gully geomorphology comparisons with their Martian counterparts [18].
The Altiplano-Puna Volcanic Complex (APVC) [19] of the Central Andes is one of the volcanic analog sites that contains a variety of evaporite deposits, alteration minerals, and a diverse range of mafic-to-silicic volcanic features suited for comparisons to the surfaces of the Moon and Mars. Comparisons of the APVC to the Moon and Mars in recent works (e.g., Ruff et al. [13], Aerts et al. [17], Flahaut et al. [20,21]) gave insights into major questions of these bodies (e.g., silica deposits and salars on Mars, dome formation on the Moon), and they have re-emphasized the strong potential of the APVC to better understand the Moon and Mars. There is an interest in the use of the variety of features available at the APVC for further analog studies; however, this region is still not fully characterized and has unexplored areas due to harsh conditions for field expeditions. For this reason, we used a set of orbital multispectral and hyperspectral images to map the minerals of the APVC to survey areas of interest for ongoing and future analog studies and field expeditions. We used Landsat 8 Operational Land Imager (OLI) visible near-infrared (VNIR; 0.5–0.9 µm) and shortwave infrared (SWIR; 1.2–2.5 µm) bands, Terra Advanced Spaceborne Thermal Emission and Reflection Radiometer (ASTER) thermal infrared (TIR; 8–15 µm) bands, and Earth Observing-1 (EO-1) Hyperion VNIR-SWIR bands to simulate a set of instruments available on lunar and Martian orbiters. This set of instruments covers wide ranges of wavelength, spectral resolution, spatial coverage, and spatial resolution, and the instruments complement each other’s strengths and weaknesses.

The Altiplano-Puna Volcanic Complex

The Atacama Desert of northern Chile, the driest non-polar desert on Earth, is a natural laboratory to study the diversity of volcanic geoforms. Given the relative scarcity of vegetation and clouds and the low atmospheric water content during the four seasons of the year, it is very plausible to obtain detailed insights from orbit. The Atacama Desert has thus been proposed as an excellent analog environment for some planetary bodies due to its comparable climate, volcanic structures, and lava flow morphologies (e.g., Flahaut et al. [20]). A wide range of volcanic edifices has been found, particularly in the modern volcanic arc of the Central Andes, including stratovolcanoes, calderas, monogenetic cones, and domes, which are frequently very well-preserved due to the hyperarid climate of the region [22,23]. Remarkable compositional heterogeneity (from ca. 48 to 80 wt.% SiO2) defines Central Andean volcanism, with andesites and dacites being the most common erupted materials at many volcanoes [24]. Basalts and basaltic andesites are rare and concentrated only in a few areas of the main arc and the Altiplano-Puna back-arc [25]. Rhyolite lavas, on the other hand, are unusual in stratovolcanoes, but ignimbrite deposits related to the APVC are commonly dacitic-to-rhyolitic in composition [26]. The APVC is one of the largest ignimbrite provinces in the world, covering a surface area greater than 70,000 km2 [19]. Our study area covers the western boundary of the APVC between 21°30′S, 67°00′W and 24°30′S, 69°00′W (Figure A1a). Within this area, common volcanic centers include Miocene-to-Quaternary andesitic-to-dacitic stratovolcanoes (e.g., Carcanal, San Pedro, Lascar), low-silica monogenetic edifices (e.g., La Poruña scoria cone; El Negrillar), and small-volume silicic domes (e.g., Chanka) that overlie more voluminous Miocene rhyodacitic-to-rhyolitic ignimbrite sheets. This area also includes closed basins infilled by groundwater (e.g., Lake Tuyajto) and/or covered by non-consolidated-salts-to-hard-saline-crusts that may form extensive evaporite deposits (e.g., Salar de Atacama).
Hubbard and Crowly [27] demonstrated a mineral mapping methodology using a combination of EO-1 Advanced Land Imager (ALI), EO-1 Hyperion, and Terra ASTER imageries in the VNIR and SWIR wavelengths at the APVC. This study succeeded in qualitatively identifying and mapping the distribution of alteration and evaporite minerals at Azufre Volcano (21°47′S, 68°13′W) and Salar de Ascotan (21°34′S, 68°16′W), although it stopped shy of deriving quantitative abundances and analyzing outside of the two example areas.
Motivated by this work, we used similar instruments to map the abundance and distribution of minerals and bulk-rock properties of mainly volcanic surfaces useful for ongoing volcanology field campaigns [28,29,30], analog studies of the Moon and Mars [21,31,32], and future studies.

2. Materials and Methods

2.1. Landsat 8 Operational Land Imager (OLI)

Landsat 8 began operations in 2013 and is one of the latest satellites in the Landsat series [33]. Its OLI sensor possesses 9 spectral bands in the VNIR-SWIR (0.4–2.5 µm; Figure 1). The OLI operates in the push-broom imaging method and has a spatial resolution of 30 m/pixel. Landsat 8 satellite flies in sequence with EO-1 (prior to decommission) and Terra satellites, known as the morning constellation [34]. Further specifications of the OLI can be found in Irons et al. [33].
We downloaded three Landsat 8 OLI level 2 reflectance data from the U.S. Geological Survey (USGS) EarthExplorer (file names available in Table A1). Bands 1–7 are appropriate bands for mineralogical analysis; Bands 8 and 9 are panchromatic and cirrus (cloud) sensors, respectively, and not used in this study. Landsat 8 also possesses a thermal infrared sensor, but it was not used in this study because it only contains two bands, which were mainly intended to study surface temperatures. For analysis using TIR wavelengths, we use ASTER data.
The three selected images were combined using the mosaic tool of the ENVI 5.6 software from L3Harris Geospatial (https://www.l3harrisgeospatial.com/Software-Technology/ENVI, accessed on 24 January 2022). To remove shadows and other dark areas from analysis, pixels with reflectance less than 0.1 in all bands 1–7 were masked. Band ratio 1/6 was computed to capture the high spectral contrast of snow and water, and pixels with values greater than 1.0 were masked. The selected images were almost free of clouds; a small cloud and its shadow found at 23°67′S, 67°47′W was manually masked. Pixels with Band 2 reflectance greater than 0.19 were also masked as they corresponded to salars, which are not the focus of this study.
First, we applied the decorrelation stretch (DCS [35]) technique to obtain a general idea of the variabilities within the scene (Figure A1c). Next, band ratios based on Rockwell et al. [36] were computed to map iron-bearing and alteration mineral groups (Table 1). Ferric iron 1 index captures the stronger absorption of blue/green light with respect to orange/red light that arises from charge transfer, and it is widely used to map ferric iron minerals [37]. Ferric iron 2 index also captures blue/green absorption but also crystal-field absorptions in the near-infrared. This index is more sensitive to minerals with greater abundance of ferric iron than the ferric iron 1 index [37]. In the ferrous/coarse-ferric iron index, the broad absorption characteristic of ferrous iron is captured. Additionally, oxidizing basalts leaving behind hematite in volcanic flows and cinder cones are captured [37]. The clay-sulfate-mica index captures the diagnostic absorption bands in the SWIR of these minerals. The band ratio 5/4 is an index of green vegetation, and this is subtracted from the 6/7 band ratio in order to reduce the effect of green vegetation (although green vegetation is sparse at the APVC). Landsat 8 OLI has only one band in the 2.0–2.5 µm range; thus, the distinction among clay, sulfate, and mica was not made; this was instead performed with the more appropriate hyperspectral EO-1 Hyperion. The iron-sulfate mineral index captured the strong absorption of light in Band 1 (0.43–0.45 µm) in comparison to Band 2 (0.45–0.51 µm), which is not a characteristic of other iron-bearing minerals (oxide and hydroxide minerals [36]). As with index 4, the green vegetation band ratio was subtracted from the 2/1 band ratio to further mitigate effects of vegetation.
Figure 1. Overview of selected spectral bands of remote sensing instruments for the Earth, Moon, and Mars mentioned in this work in VNIR-SWIR and TIR ranges. Blue, orange, and gray colors correspond to instruments for the Earth, Mars, and the Moon, respectively. For the Earth component, the atmospheric transmittance computed with MODerate resolution atmospheric TRANsmission (MODTRAN) for one-way US standard 1976 model [38] is also shown. Band numbers for Landsat 8 OLI and Terra ASTER TIR are indicated at the bottom.
Remotesensing 14 02081 g001

2.2. Terra Advanced Spaceborne Thermal Emission and Reflection Radiometer (ASTER)

ASTER, one of the five instruments of the satellite Terra, was built by Japan Ministry of Economy, Trade, and Industry in collaboration with NASA and launched in 1999, mainly for studying land surfaces [39]. ASTER has 15 spectral bands that span the 0.5–12 µm wavelength range, covering the VNIR, SWIR, and TIR. Bands 10–14 (8.1–11.7 µm; Figure 1) are TIR and have a spatial resolution of 90 m/pixel [39]. We used the TIR bands to retrieve a bulk-rock property, i.e., silica percentage, as a complement to mineralogy derived from VNIR and SWIR data of Landsat 8 OLI and EO-1 Hyperion. The VNIR-SWIR bands of ASTER were not used in this work because the mineralogical information that can be derived from them is redundant to or, at least, less informative than the OLI+Hyperion combination in terms of spectral resolution, wavelength coverage, spatial resolution, and spatial coverage (one minor benefit is 15 m/pixel resolution, but only in bands 1–3; other bands have 30 m/pixel resolution).
From USGS EarthExplorer, we downloaded ASTER Global Emissivity Dataset (GED; files names available in Table A1). ASTER GED was released by NASA Jet Propulsion Laboratory and is the most extensive and accurate emissivity product of the Earth’s land surface to date [40]. Emissivity is derived from the mean of cloud-free ASTER observations during the 2000–2008 period, and this dataset covers all land surfaces with spatial resolution of 100 m/pixel (coarser resolution data are also available [40]).
First, we applied the DCS technique to obtain a general idea of the variabilities. Surfaces of water and water-bearing minerals (e.g., gypsum) in salars appeared in green color with this DCS band combination (R:14 G:12 B:10; Figure A1d), and they were masked and removed from further analysis. Parts of salars that were not masked with this approach were later captured using the Spectral Angle Mapper (SAM) tool [41] in ENVI, and these pixels were also masked.
In the TIR, emissivity spectra of silicate minerals generally exhibit major absorption features in the 8–13 µm wavelength range because vibrational frequencies of Si–O bond in silicate mineral structures match the frequencies of electromagnetic energy in this wavelength range [42,43,44]. These absorption bands are known as reststrahlen bands, and the minima of reststrahlen bands occur at progressively longer wavelengths as the SiO2 content of a rock decreases [42,43,44,45,46,47,48]. This relationship allows the derivation of silica content of rocks if the wavelength of the reststrahlen band minima can be retrieved from TIR emissivity spectra.
We used the technique of Hook et al. [45], who determined a quantitative relationship between silica percentage and minimum position of reststrahlen bands from the ASTER spectral library [49,50], to determine the silica percentage. Minima of reststrahlen bands were determined by fitting a four-term Gaussian function
f(λ) = A0 exp(−z2/2) + A3
to emissivity spectra, where λ is the wavelength, A0 is the amplitude, and A3 is the offset. In the exponent, z is expressed as
z = (λ − A1)/A2
where A1 and A2 are the wavelength position of the minimum value and the area enclosed by the function, respectively. For the ASTER dataset without ultramafics (which is appropriate for the APVC) the relationship between weight percent silica (y) and wavelength of minimum of the Gaussian function (A1) is known as
y = −16.203 A1 + 213.97
with r2 of 0.7615 [45].
The computations involved in silica percentage derivation from ASTER GED were accomplished with a Python routine implemented as part of the CRPG spectral processing software, Mineral Recognizer [51]. Spectra with no distinguishable reststrahlen bands were not processed.

2.3. Earth Observing-1 (EO-1) Hyperion
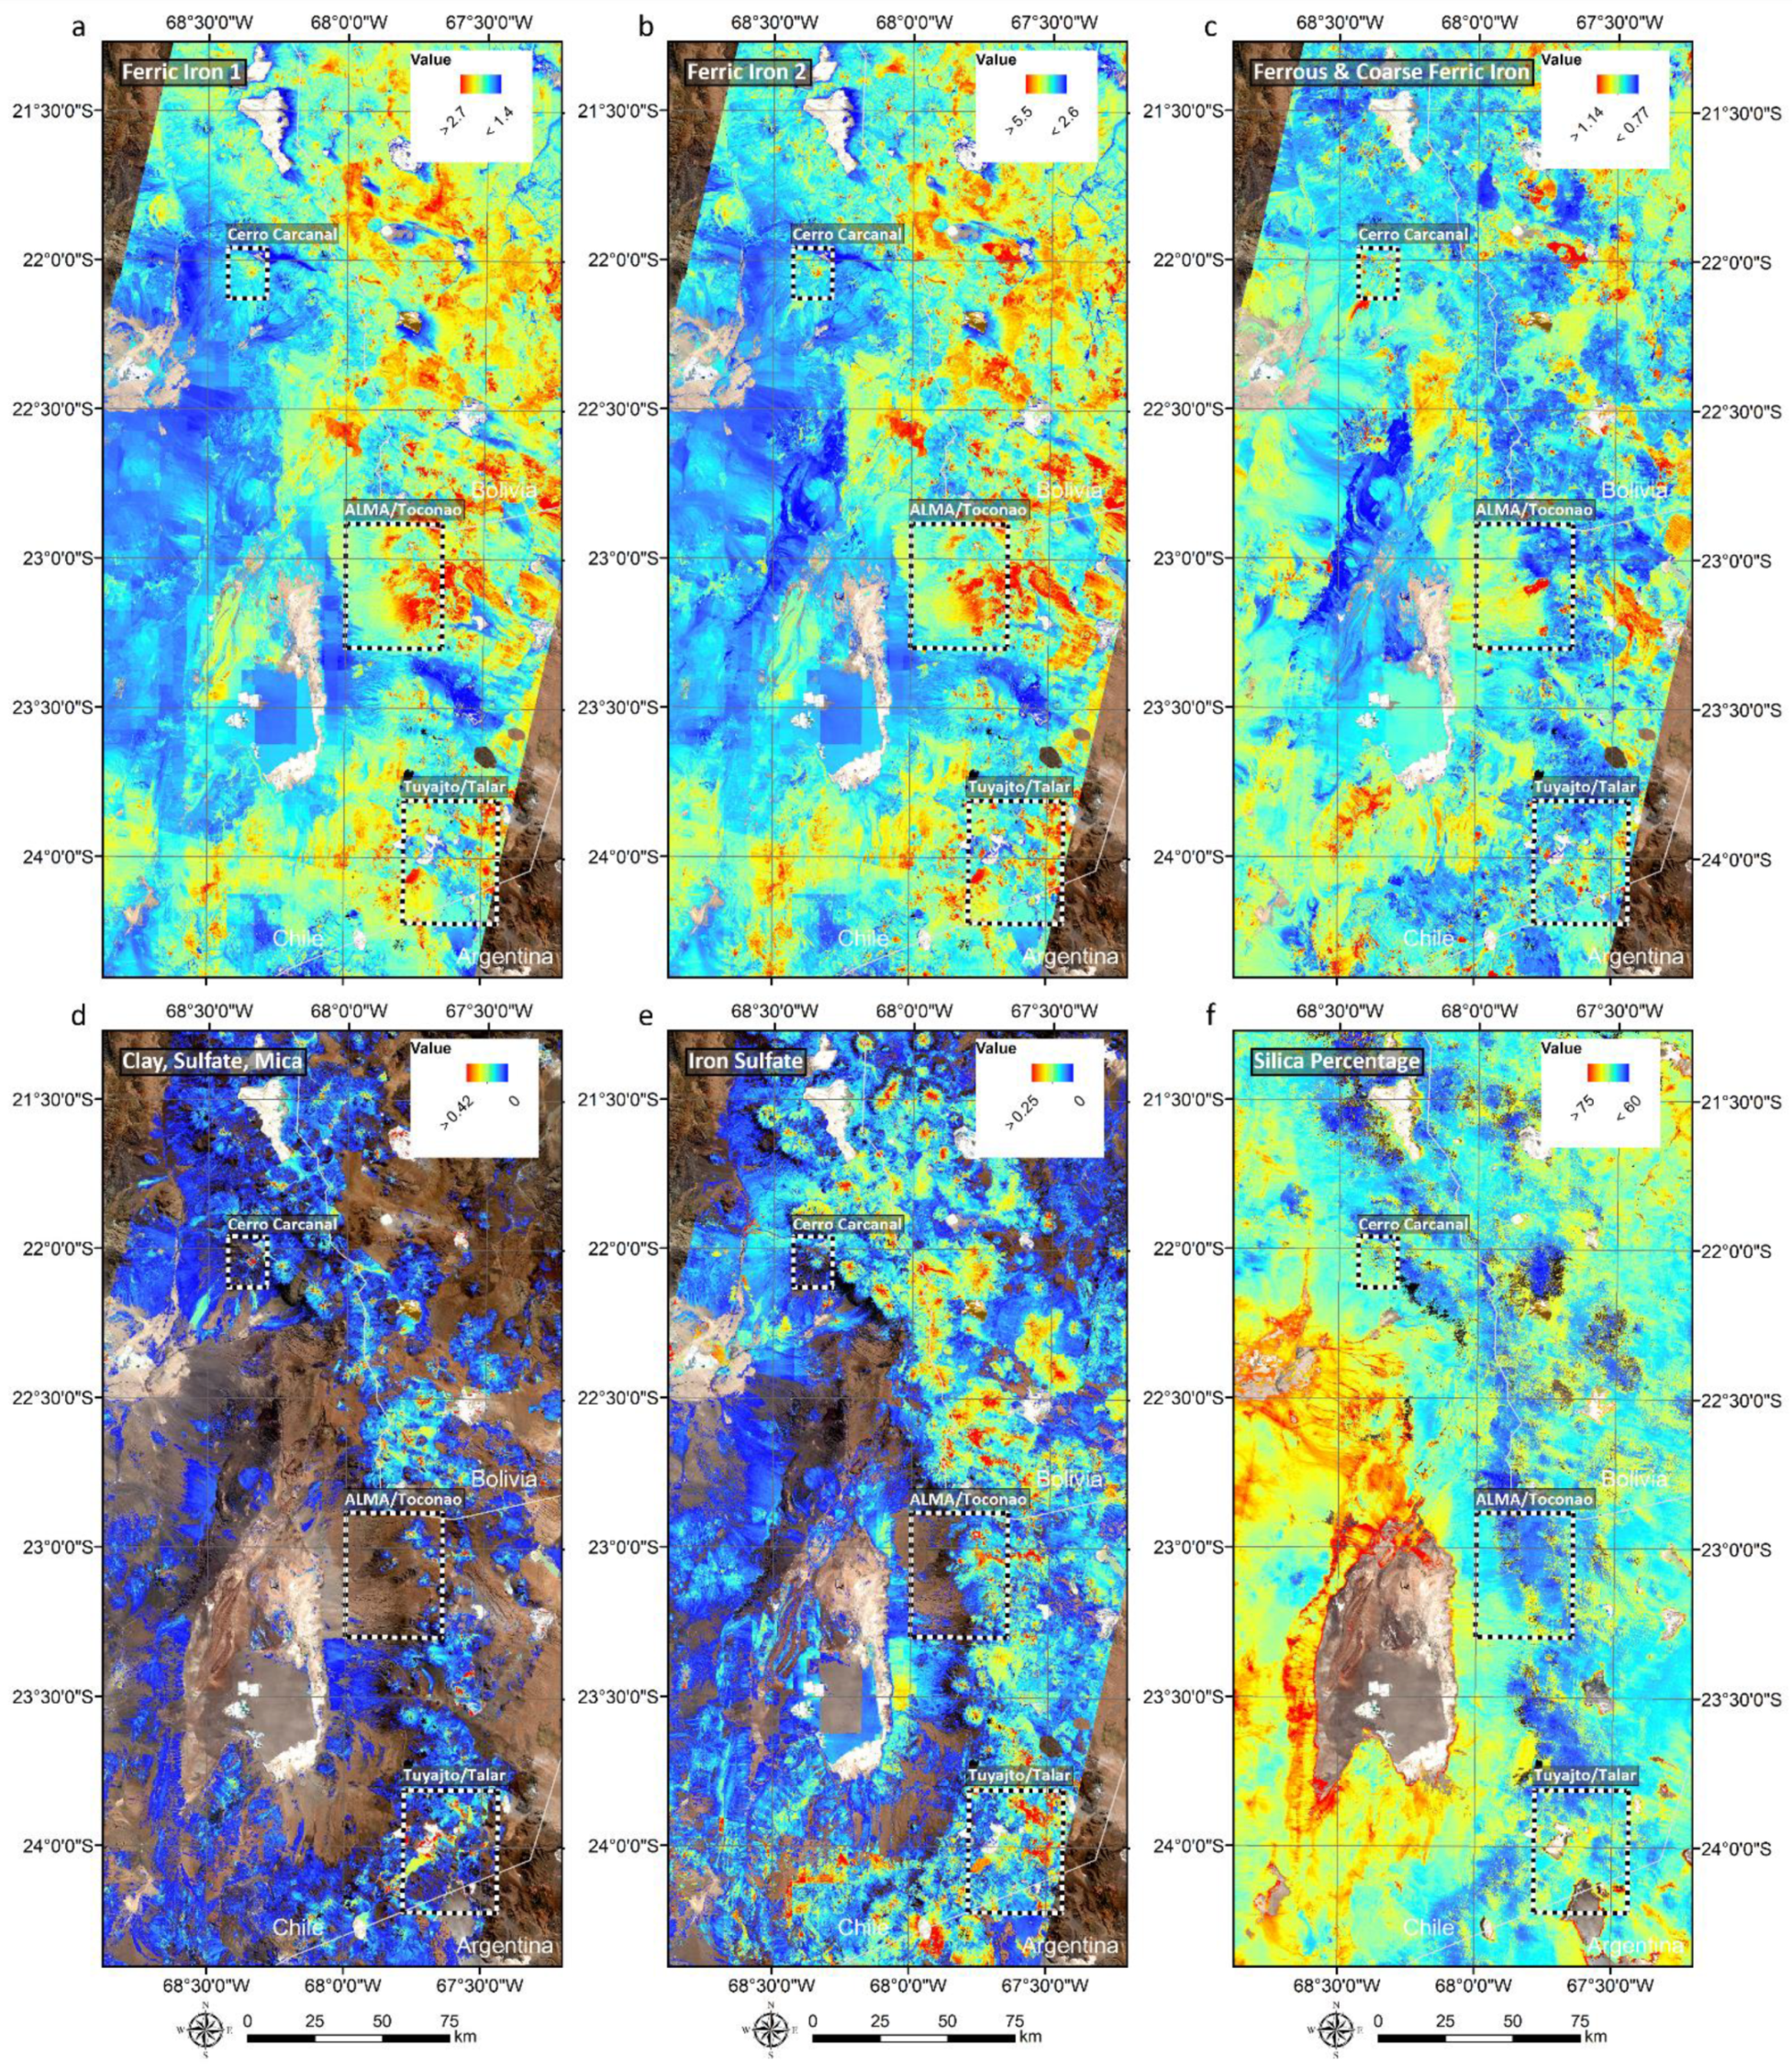
Hyperion, which was decommissioned in 2017, contained 220 spectral bands in the 0.4–2.5 µm wavelength range (Figure 1), and it had a spatial resolution of 30 m/pixel [52]. Hyperion products are long, narrow strips of hyperspectral cubes with standard scene width and length of 7.7 km and 42 km, respectively (the length can extend up to 185 km) [52]. This makes Hyperion complementary to Landsat 8 OLI, which has lower spectral resolution but greater spatial coverage.
Six Hyperion radiance images available on USGS EarthExplorer were downloaded (Table A1) and converted to reflectance using the ENVI FLASSH module [53,54,55]. The selection of Hyperion images was first guided by areas of mineralogical interest determined from the Landsat and ASTER maps and further constrained by the availability and quality of images. The derived reflectance spectra were noisy with occasional spikes in spectra. This was expected as Hyperion data have comparatively low signal-to-noise ratio (150:1 to 60:1 for Hyperion but above 200:1 for Landsat 8 OLI [33,52,56]). We used the Mineral Recognizer denoising algorithm to eliminate spikes using a combination of percentile and z-score techniques [51].
The selected Hyperion images were processed to retrieve mineral classes using the spectral hourglass approach [57]. Data were first transformed using the Minimum Noise Fraction (MNF) technique [58]. To separate useful signals from noise, the first 18 MNF bands were kept for Inverse MNF and further processing, which is a consistent number of bands with Hubbard and Crowley [27]. Next, Pixel Purity Index [59] was computed, and pixels with potential endmember spectra were identified. Upon manual inspection, obvious spectra of non-minerals (e.g., snow, image edges) were removed. For the remaining endmember spectra, Spectral Analyst Tool based on the USGS Spectral Library version 7 Beckman group [60] was used with SAM and Spectral Feature Fitting (SFF) techniques [41,61] to identify minerals or mineral groups. The Spectral Analyst tool is sensitive to the input wavelength range; thus, we searched for consistent matches after applying it to the 0.4–2.5 µm, 0.4–1.2 µm, and 2.0–2.5 µm ranges. Next, pixels in the scene matching the selected endmember spectra were identified using the SAM technique with the default threshold angle of 0.1. Similar or redundant SAM classes were merged based on geospatial and spectral similarities and irrelevant SAM classes (e.g., shadows) were omitted upon manual inspection.
Additionally, we specifically searched for feldspar minerals, as the geological interpretation of remote sensing detection of feldspar minerals in the VNIR-SWIR on Mars is a currently debated topic [31,32,62,63,64,65]; thus, a comparable detection of feldspars at the APVC is eminently beneficial. The VNIR-SWIR reflectance spectra of feldspar minerals are mostly featureless, however, for those containing minor amounts of iron, a broad absorption band center around 1.25 µm can be detected (e.g., Adams and Goulaud [66], Cheek and Pieters [67]). Capturing this broad absorption feature requires Hyperion’s spectral coverage and resolution. We computed the spectral index of feldspar minerals in a similar way as for the index BD1300 in Viviano-Beck et al. [68] as
B = 1 − Rc/(a × Rs + b × Rl)
where B is the feldspar band depth index, Rc, Rs, and Rl are the reflectance at the center, the short wavelength edge, and the long wavelength edge of the band, respectively. Wavelength parameters a and b are derived as
b = (λc − λs)/(λl − λs)
a = 1 − b
where λc, λs, and λl are the wavelength of the center, the short edge, and the long edge of the band, respectively. For reflectances Rc, Rs, and Rl, means were taken from reflectances at several wavelengths for each of λc, λs, and λl to reduce noise (exact wavelengths are indicated in Table A2). Useable Hyperion spectral bands were limited around the typical feldspar band center (around 1.25 µm); therefore, we actually computed two values of B for each spectrum using two different λc that together captured the feldspar band. We then computed the mean of the two preceding B values to derive the final value for B. In order to reduce false positives, first and second derivatives of the reflectances were computed to eliminate spectra without distinguished concave shapes centered around 1.25 µm. Shadows and other dark materials with low spectral reflectance (<1.5) were also removed from analysis. The computations of spectral indices were performed using Mineral Recognizer.

3. Results

The main objective of this study was to conduct a mineralogical survey of the non-evaporite surfaces of the APVC, to identify potential areas of interest to use as planetary analogs, and to support geological field expeditions in subsequent works. We determined three regions of interest that showed potential and had at least some availability of Hyperion imagery. In this process, mineral and rock characterizations capitalize on the advantage of synthesizing multiple datasets and techniques that are different and complementary to one another (Section 2). The assessment of the utilization of multiple remote sensing datasets is itself noteworthy, and it is discussed in Section 4.2.

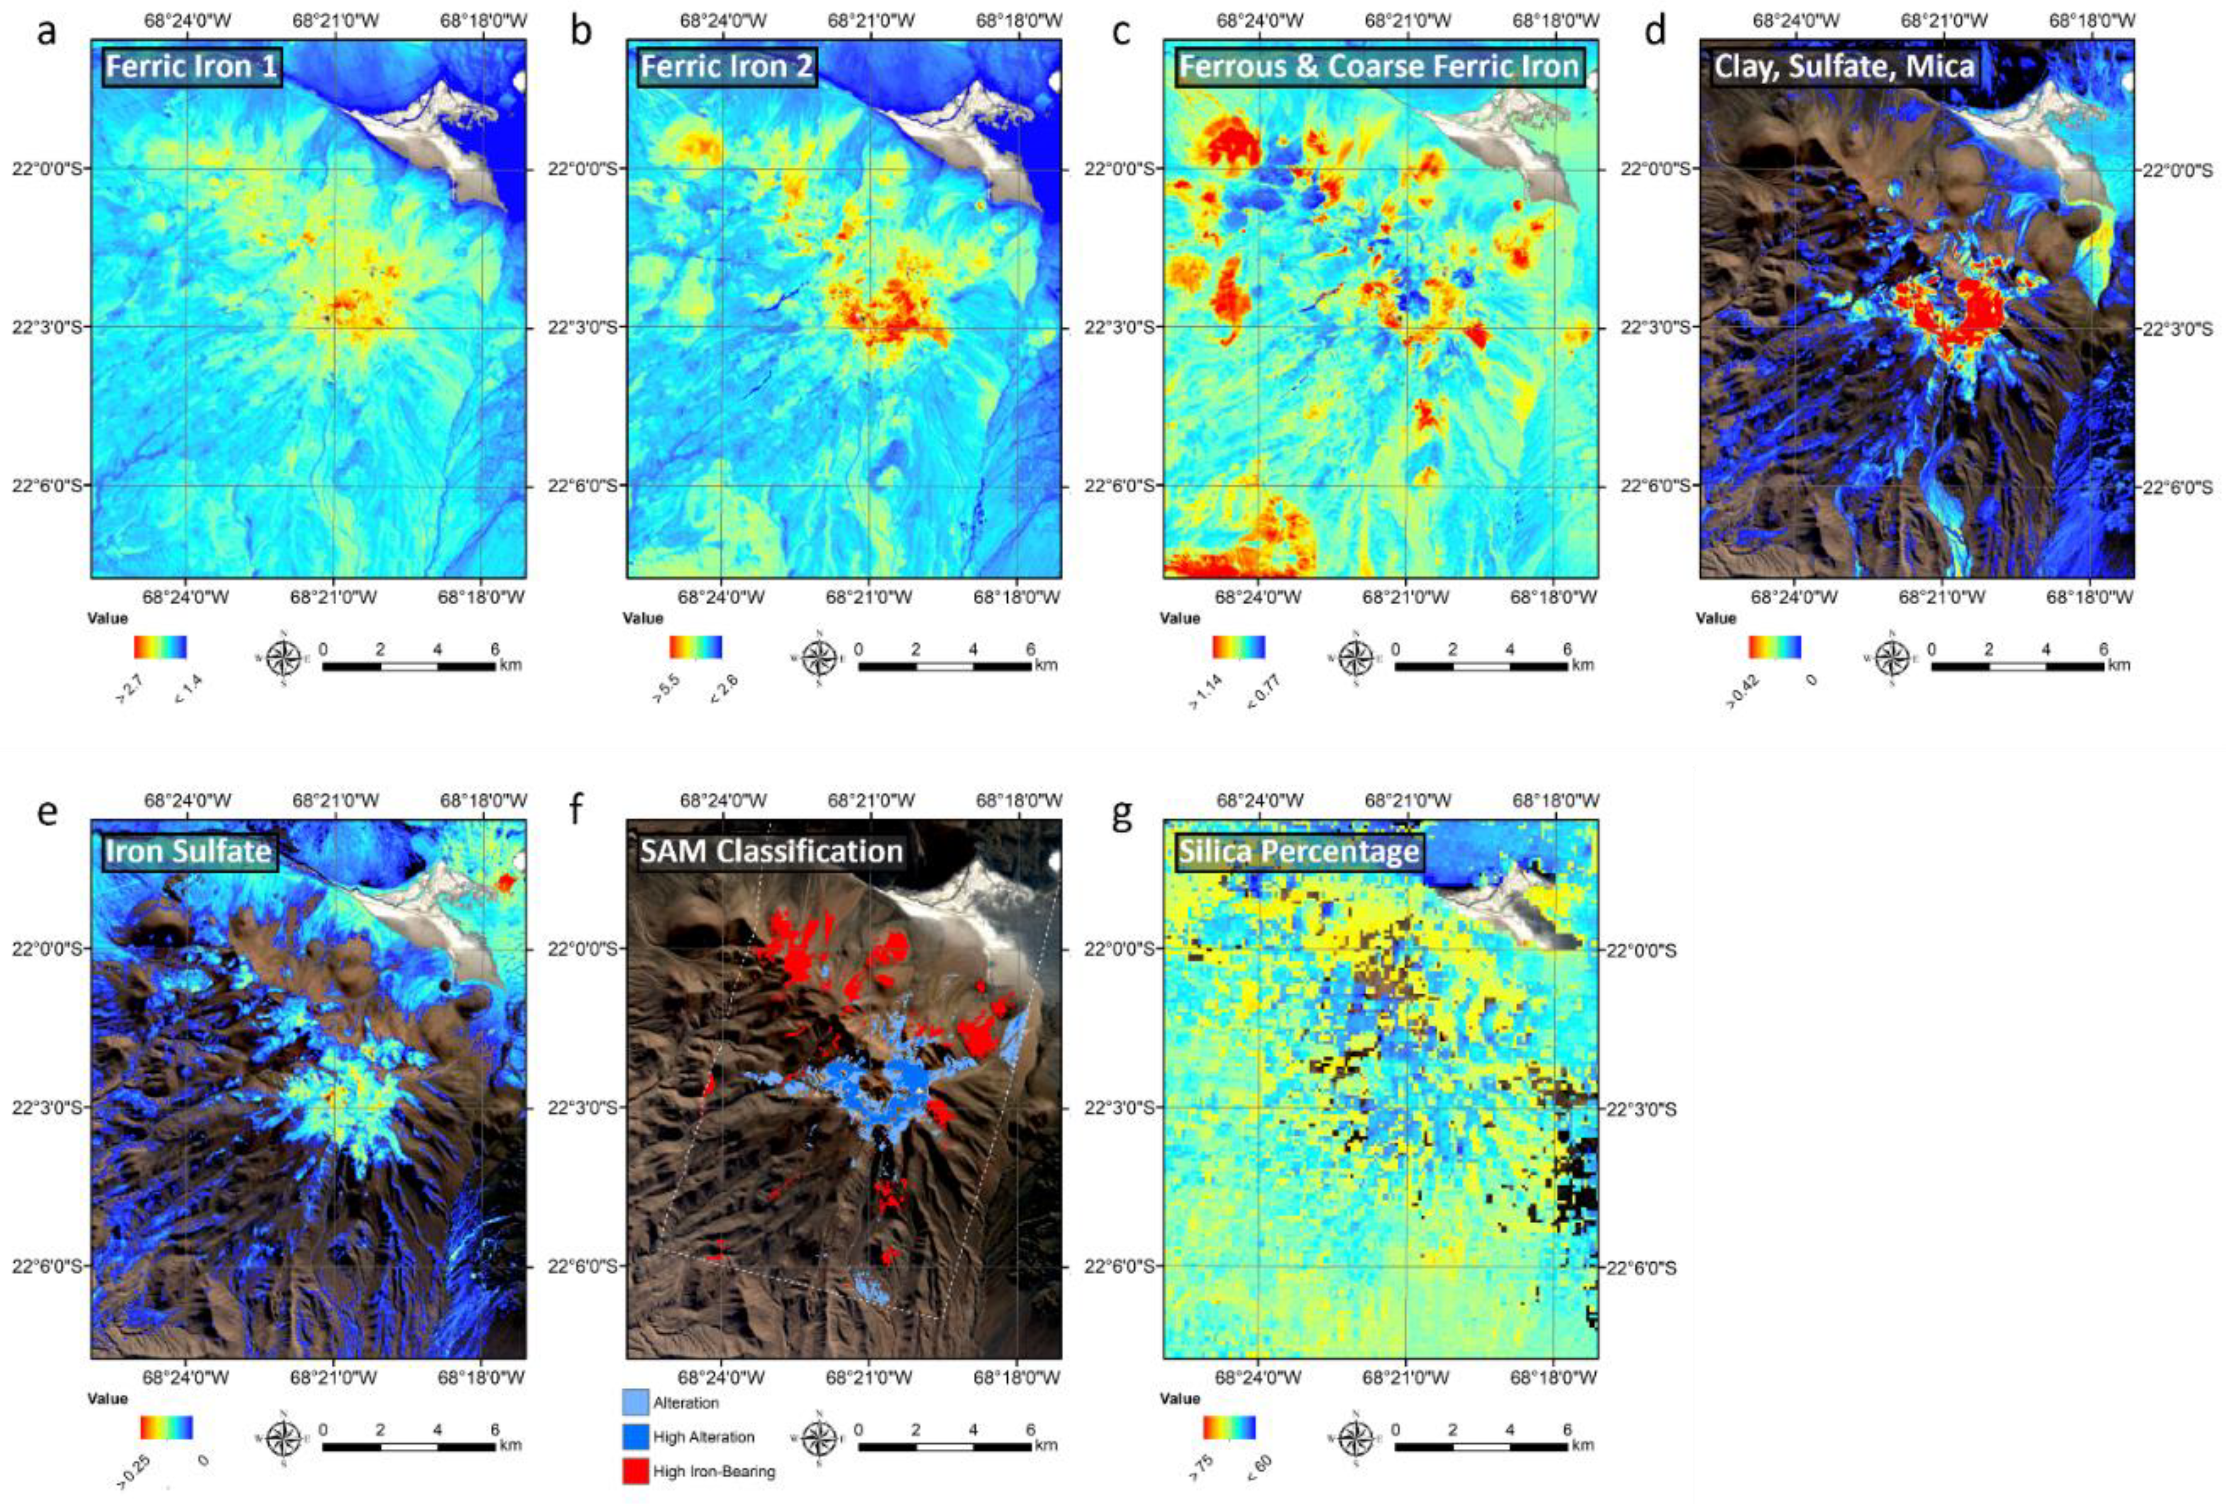
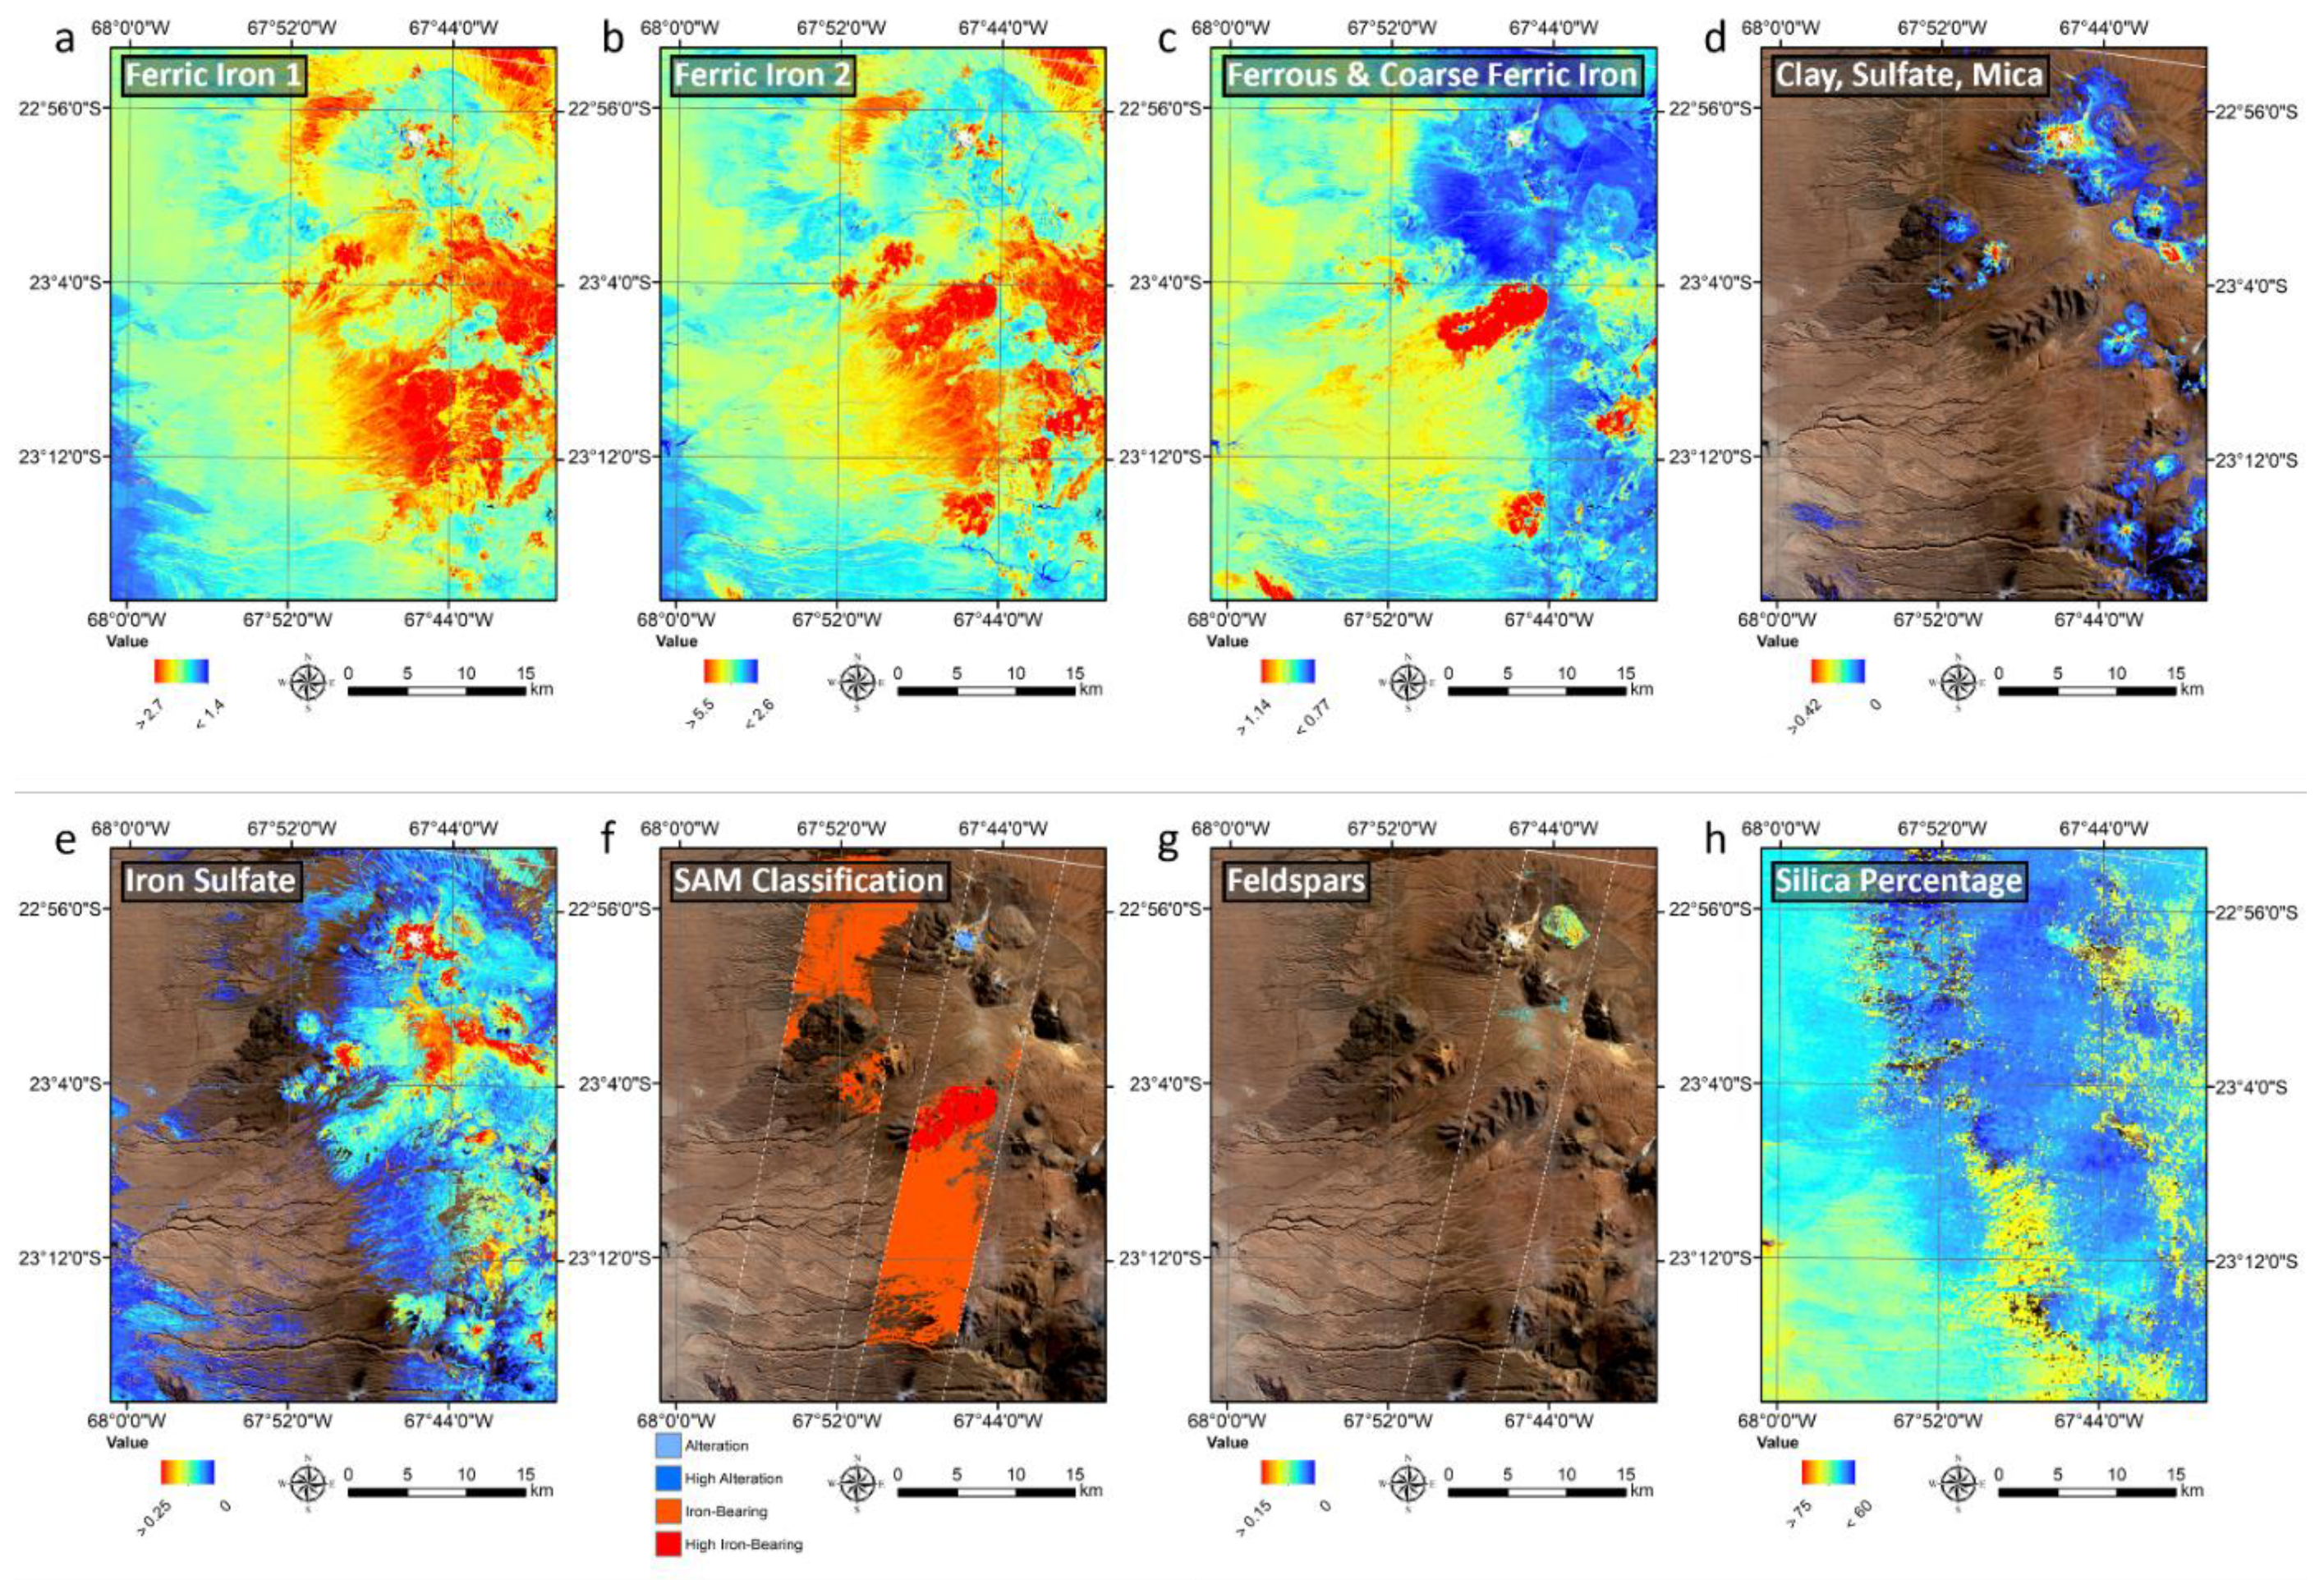
3.1. Cerro Carcanal and Vicinity

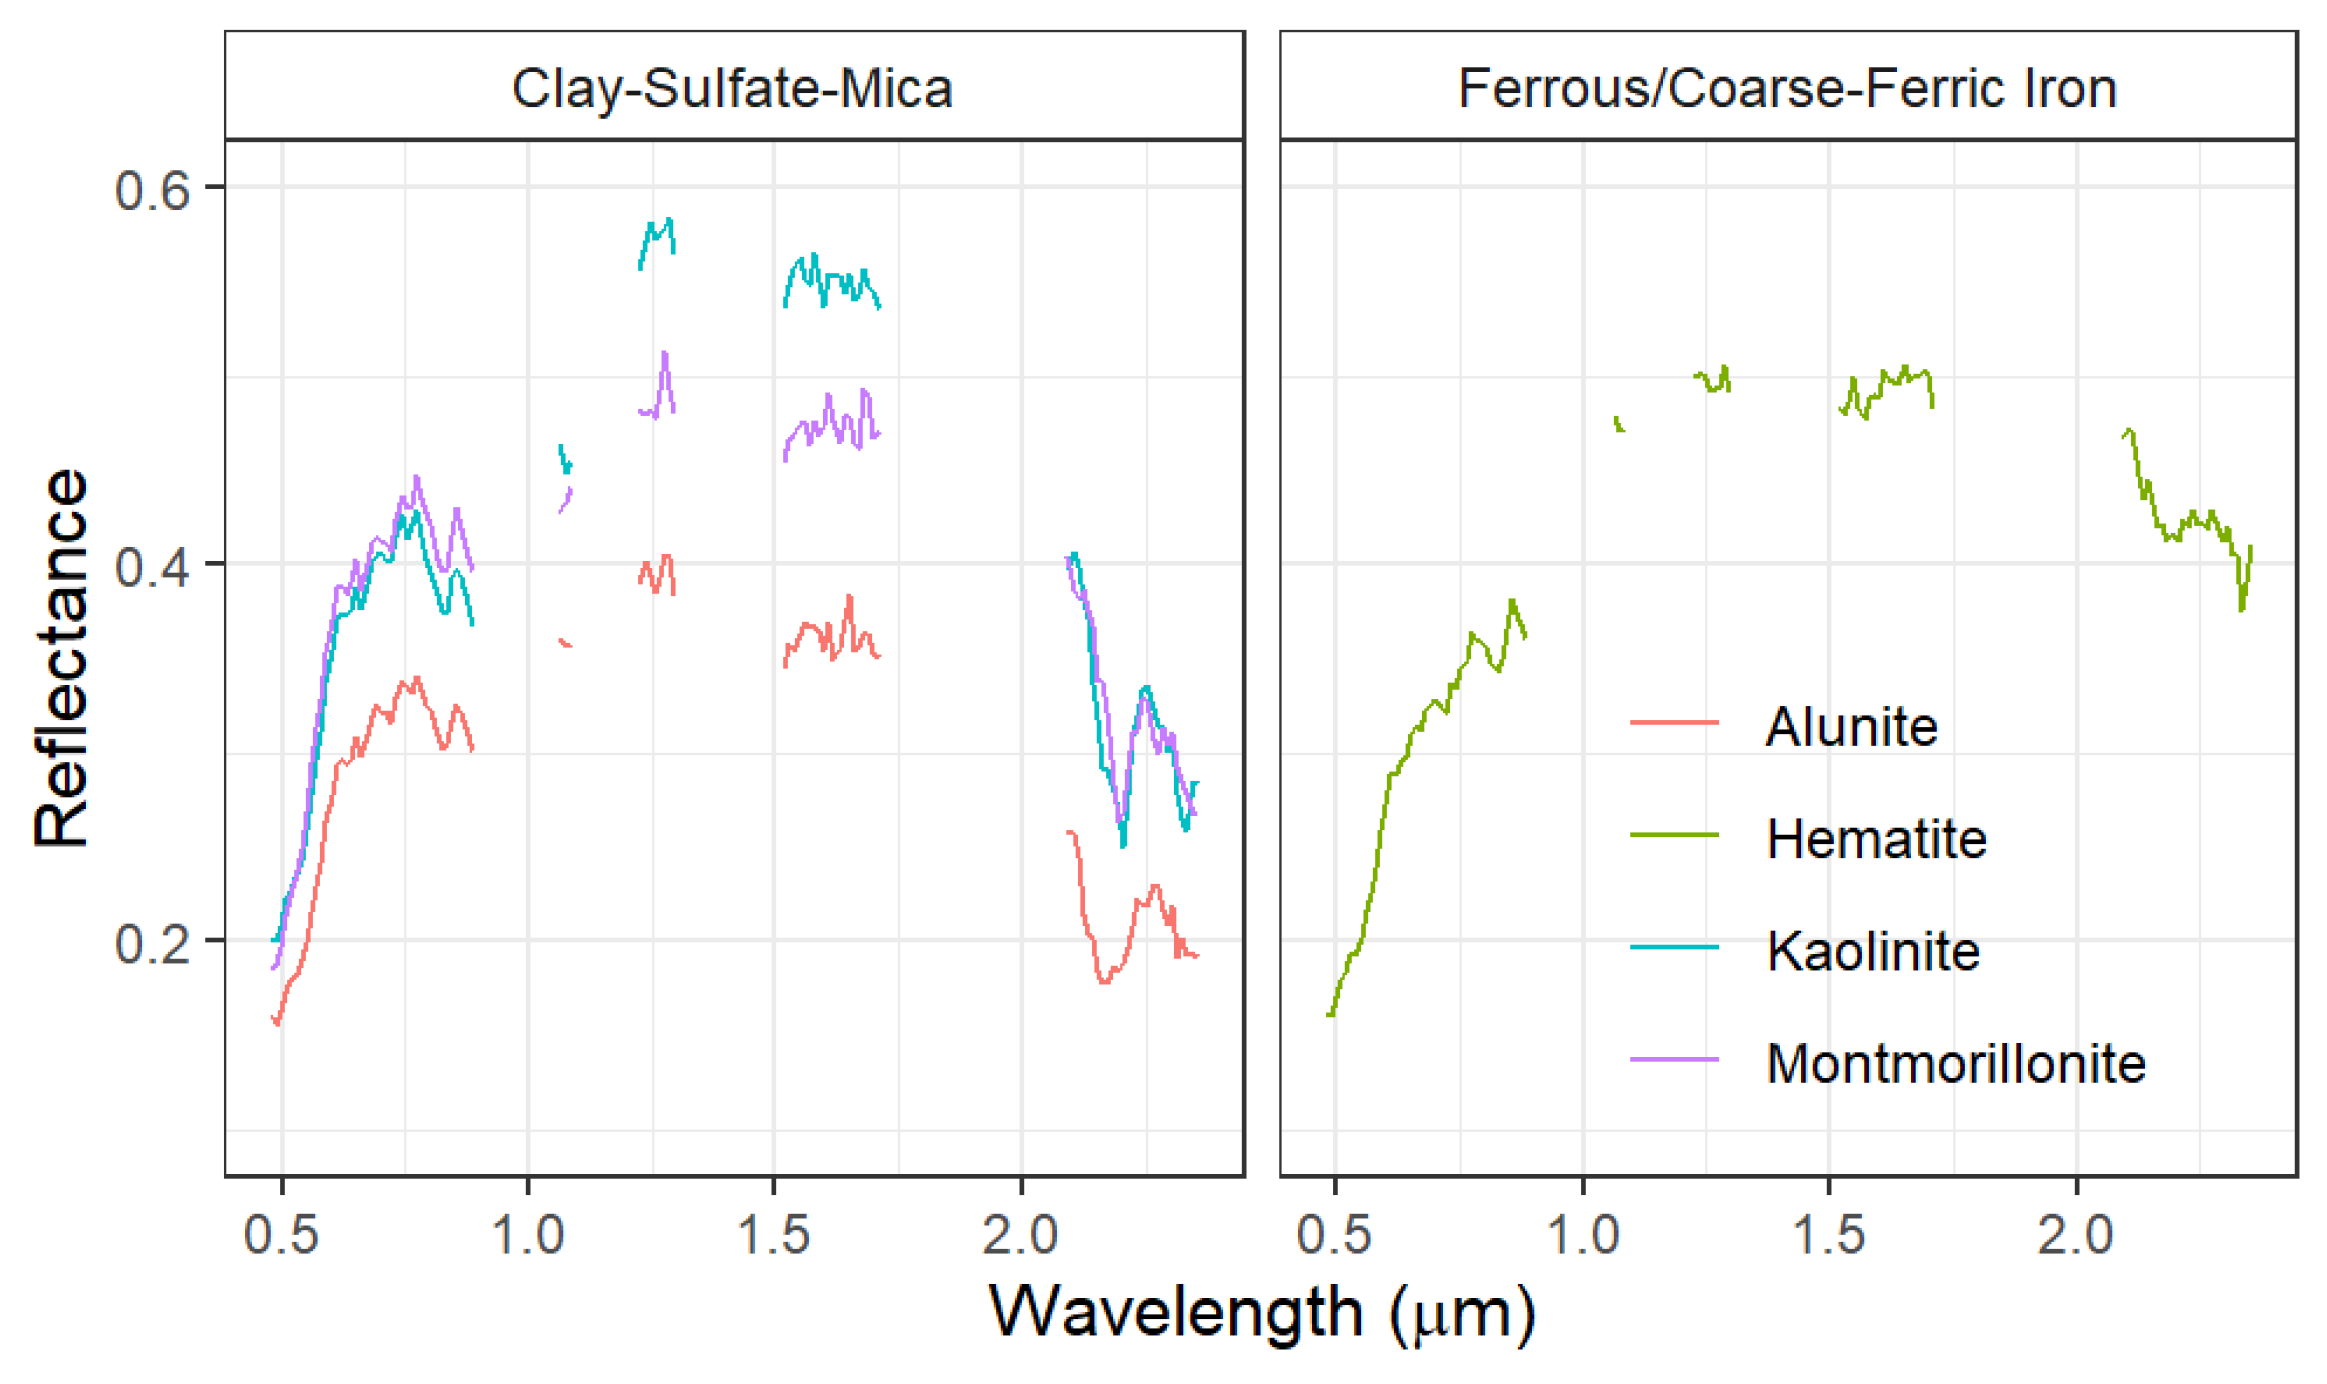
3.1.1. Alteration Minerals

The first area of interest is Cerro Carcanal and its vicinity (Figure 2; 21°57′36″S, 68°25′48”W to 22°7′48″S, 68°17′24″W), which is a stratovolcano from the Miocene age [69]. Landsat index 4 showed elevated levels of the clay-sulfate-mica mineral group, and especially high index values were found at the summit of Carcanal volcano (Figure 3d). The Hyperion hyperspectral analysis captured the various shapes of the spectral bands in the 2.0–2.5 µm region and indicated that the summit contains argillic alteration minerals, mainly montmorillonite, alunite, and kaolinite (Figure 4). Alunite and kaolinite minerals typically indicate advanced argillic alteration states more than montmorillonite [70]; thus, pixels with spectra closely matching alunite and kaolinite in the 2.0–2.5 µm region were grouped as “High Alteration” to distinguish them from the other pixels matching montmorillonite, which were classified as “Alteration.” The clay-sulfate-mica material at the summit seems to have flown down the volcano slope, and the “High Alteration” class became scarce further from the summit (Figure 3f). The flows continued beyond the coverage of the Hyperion imagery and made particularly large deposits to the south of the volcano (e.g., 68°31′12″S, 22°11′60″W; Figure 2d). Landsat index 5 showed that moderate amounts of iron-sulfate minerals were also found at the summit (Figure 3e), but the iron-sulfate index values were comparatively low in relation to those of the nearby volcanoes (Figure 2e), such as Paniri (22°3′34″S, 68°13′48″W) and Cerro del Leon (22°8′0″S, 68°6′36″W).

3.1.2. Iron-Bearing Minerals

Especially high values of the Landsat ferrous/coarse-ferric iron mineral group were found sparingly at the summit, slope, and base of Carcanal volcano (Figure 3c). The Hyperion analysis found that the spectra of these pixels highly matched hematite spectra (Figure 3f and Figure 4), and these pixels were classified as “High-Iron-Bearing” class. One of these features, known as El Rojo III scoria cone (22°0′35″S, 68°18′46″W), has been geochemically analyzed before and was identified as a deeply weathered and oxidized basaltic-andesite deposit containing approximately 8.35 wt.% FeO [71]. This is consistent with Hyperion’s spectrum-based identification as hematite and high Landsat ferrous/coarse-ferric iron mineral index. Other pixels high in Landsat ferrous/coarse-ferric iron mineral group and Hyperion “High-Iron-Bearing” class are expected to be of similar materials. In particular, outside of the Hyperion imagery coverage, Landsat index 3 highlighted a large deposit of this material to the south of Carcanal volcano (22°8′60″S, 68°24′36″W; Figure 2c). These features, however, were not highlighted by high values of ferric iron index 1 and 2 (Figure 3a,b).

3.1.3. Silica Percentage

Overall, the ASTER silica percentage map (Figure 2f and Figure 3g) indicated that Carcanal volcano is enriched in silica compared to the volcanoes in its immediate surroundings, San Pedro (21°53′17″S, 68°23′32″W), San Pablo (21°52′41″S, 68°21′49″W), and Paniri, which suggests that Carcanal volcano experienced greater alteration (silicic and argillic) than its neighbors. This is consistent with the fact that Carcanal is older (Miocene) than others (Quaternary) [69] and thus has had more time for alteration to advance.

3.2. ALMA/Toconao Village Region

3.2.1. Alteration Minerals

The second region of interest lies in the area near Atacama Large Millimeter Array (ALMA) and Toconao village (Figure 2; 22°53′0”S, 68°0′0″W to 23°18′0″S, 67°39′0″W). Cerro Toco (22°57′36″S, 67°46′12″W) showed high Landsat clay-sulfate-mica and iron-sulfate mineral index values (Figure 5d,e). Hyperion analysis also indicated the presence of the argillic alteration minerals, montmorillonite, kaolinite, and alunite (Figure 5f).

3.2.2. Iron-Bearing Minerals

This region was characterized by large extents of moderately-high-to-very-high iron-bearing minerals. The Landsat ferrous/coarse-ferric iron mineral index highlighted a few volcanic centers (23°5′24″S, 67°46′12″W; 23°10′12″S, 67°40′48″W; 23°14′24″S, 67°45′0″W), which were further found to possess hematite and hornblende with Hyperion hyperspectral analysis and classified as “High-Iron-Bearing.” Similar to the iron-rich basaltic-andesite features at the Cerro Carcanal area, these iron-bearing features are likely oxidized basaltic-andesite volcanic deposits as well. The Landsat ferric iron 1 “redness” index (Figure 5a) was not high. The geological map (Figure A1b) indicates that these features are Pliocene volcanic centers with andesite, dacite, basalt, and basaltic-andesite composition, indicating younger age compared to the similar features at Cerro Carcanal.
The Hyperion hyperspectral analysis also identified pixels with hematite spectra but to a lower degree of agreement than the “High-Iron-Bearing” class, which were labeled as “Iron-Bearing” (Figure 5f). The Iron-Bearing pixels corresponded to moderately high Landsat ferrous/coarse-ferric iron index values (Figure 5c), and on the geological map, these regions were indicated as ignimbrites and pyroclastic flow deposits (Figure A1b). Furthermore, Landsat ferric iron index 1 and 2 also showed moderate-to-very-high values. Not all parts of the ignimbrites and pyroclastic flow deposits exhibited overall high iron-bearing mineral spectral signatures, however. The ignimbrites in the northern part of this location (23°0′36″S,”67°48′36″W) showed low values of Landsat ferric iron 1 and 2 index and very low values of ferrous/coarse-ferric iron index, and hematite (and other iron-bearing mineral) spectra were not identified with the Hyperion analysis.

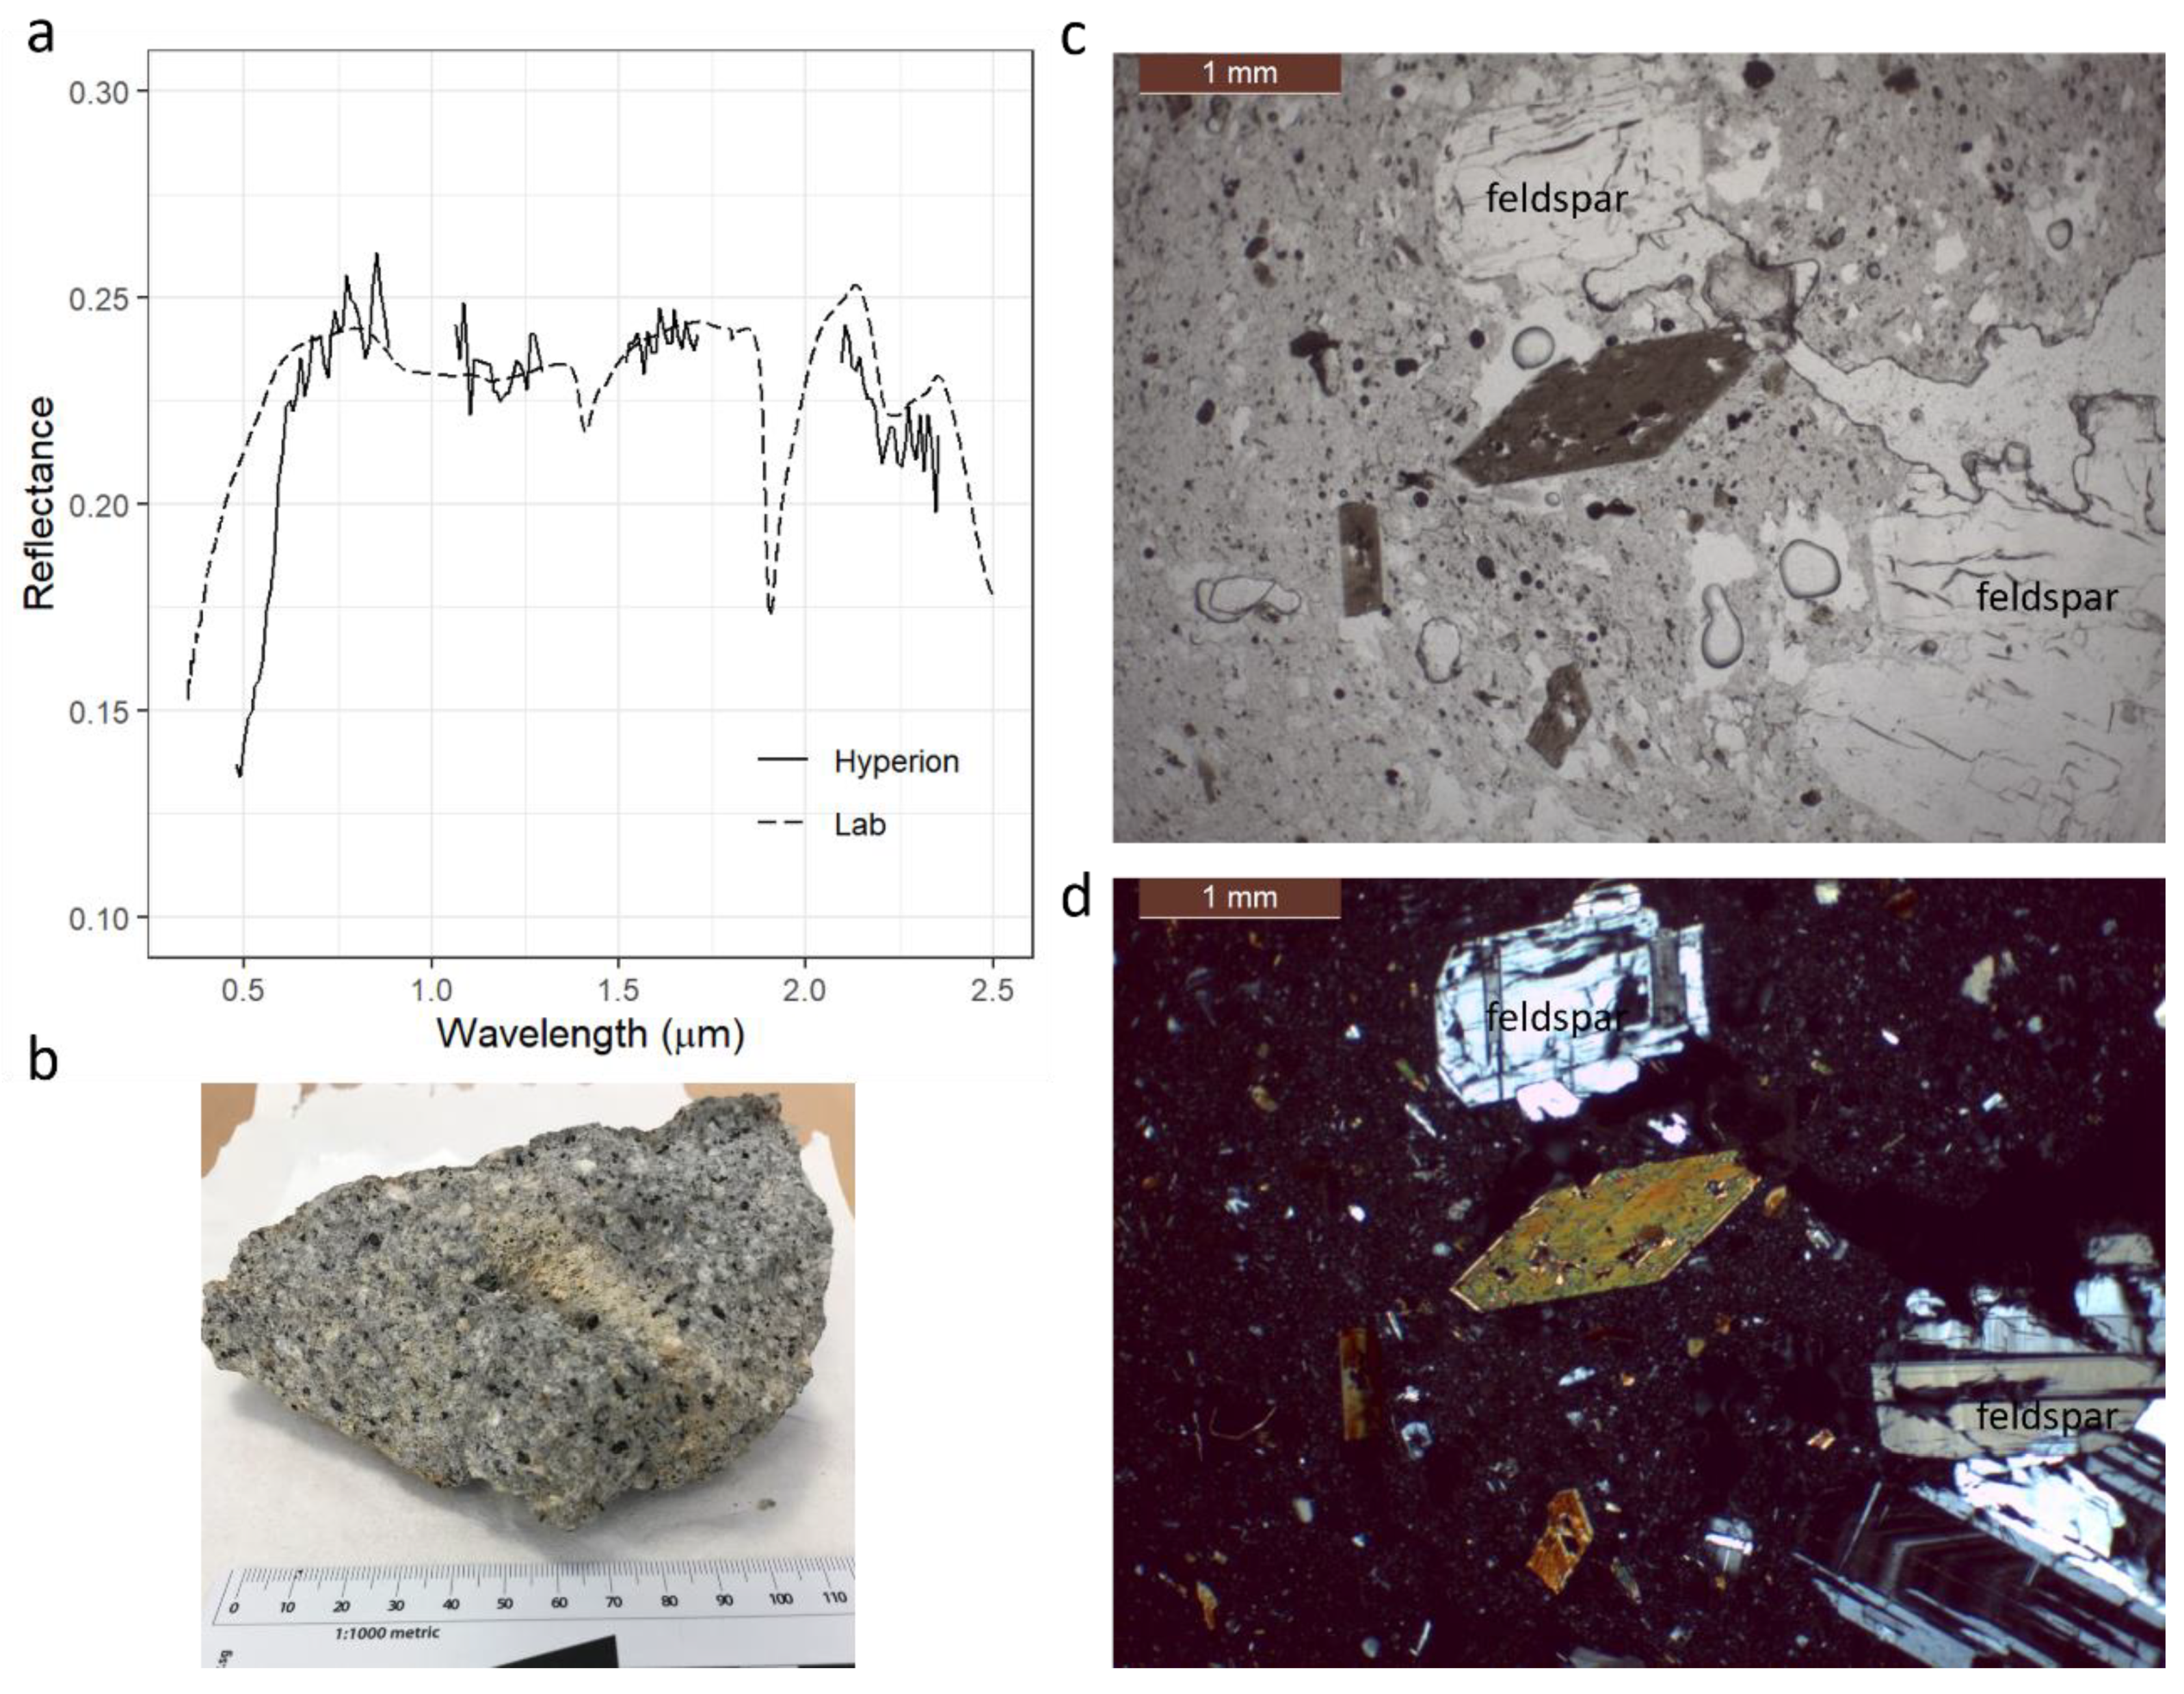
3.2.3. Silica Percentage and Feldspar Minerals

The parts of ignimbrites and pyroclastic flow deposits that have high iron-bearing mineral spectral signatures were mostly more consistent with higher silica percentages than the parts with low iron-bearing mineral spectral signatures (Figure 5h). However, “High-Iron-Bearing” basaltic-andesite volcanic deposits exhibited low silica percentages (Figure 5h).
High values of Hyperion feldspar mineral index were found at Dacite Dome D of the Purico Complex (22°56′60″S,”67°43′12″W; Figure 5g [71,72]). For this dome, the ASTER silica percentage map indicated mostly average values (~62 wt.% SiO2) but sometimes ranged up to nearly 70 wt.% SiO2. Low feldspar index values were also found in the Purico ignimbrite located to the south of El Cerrillo dome.

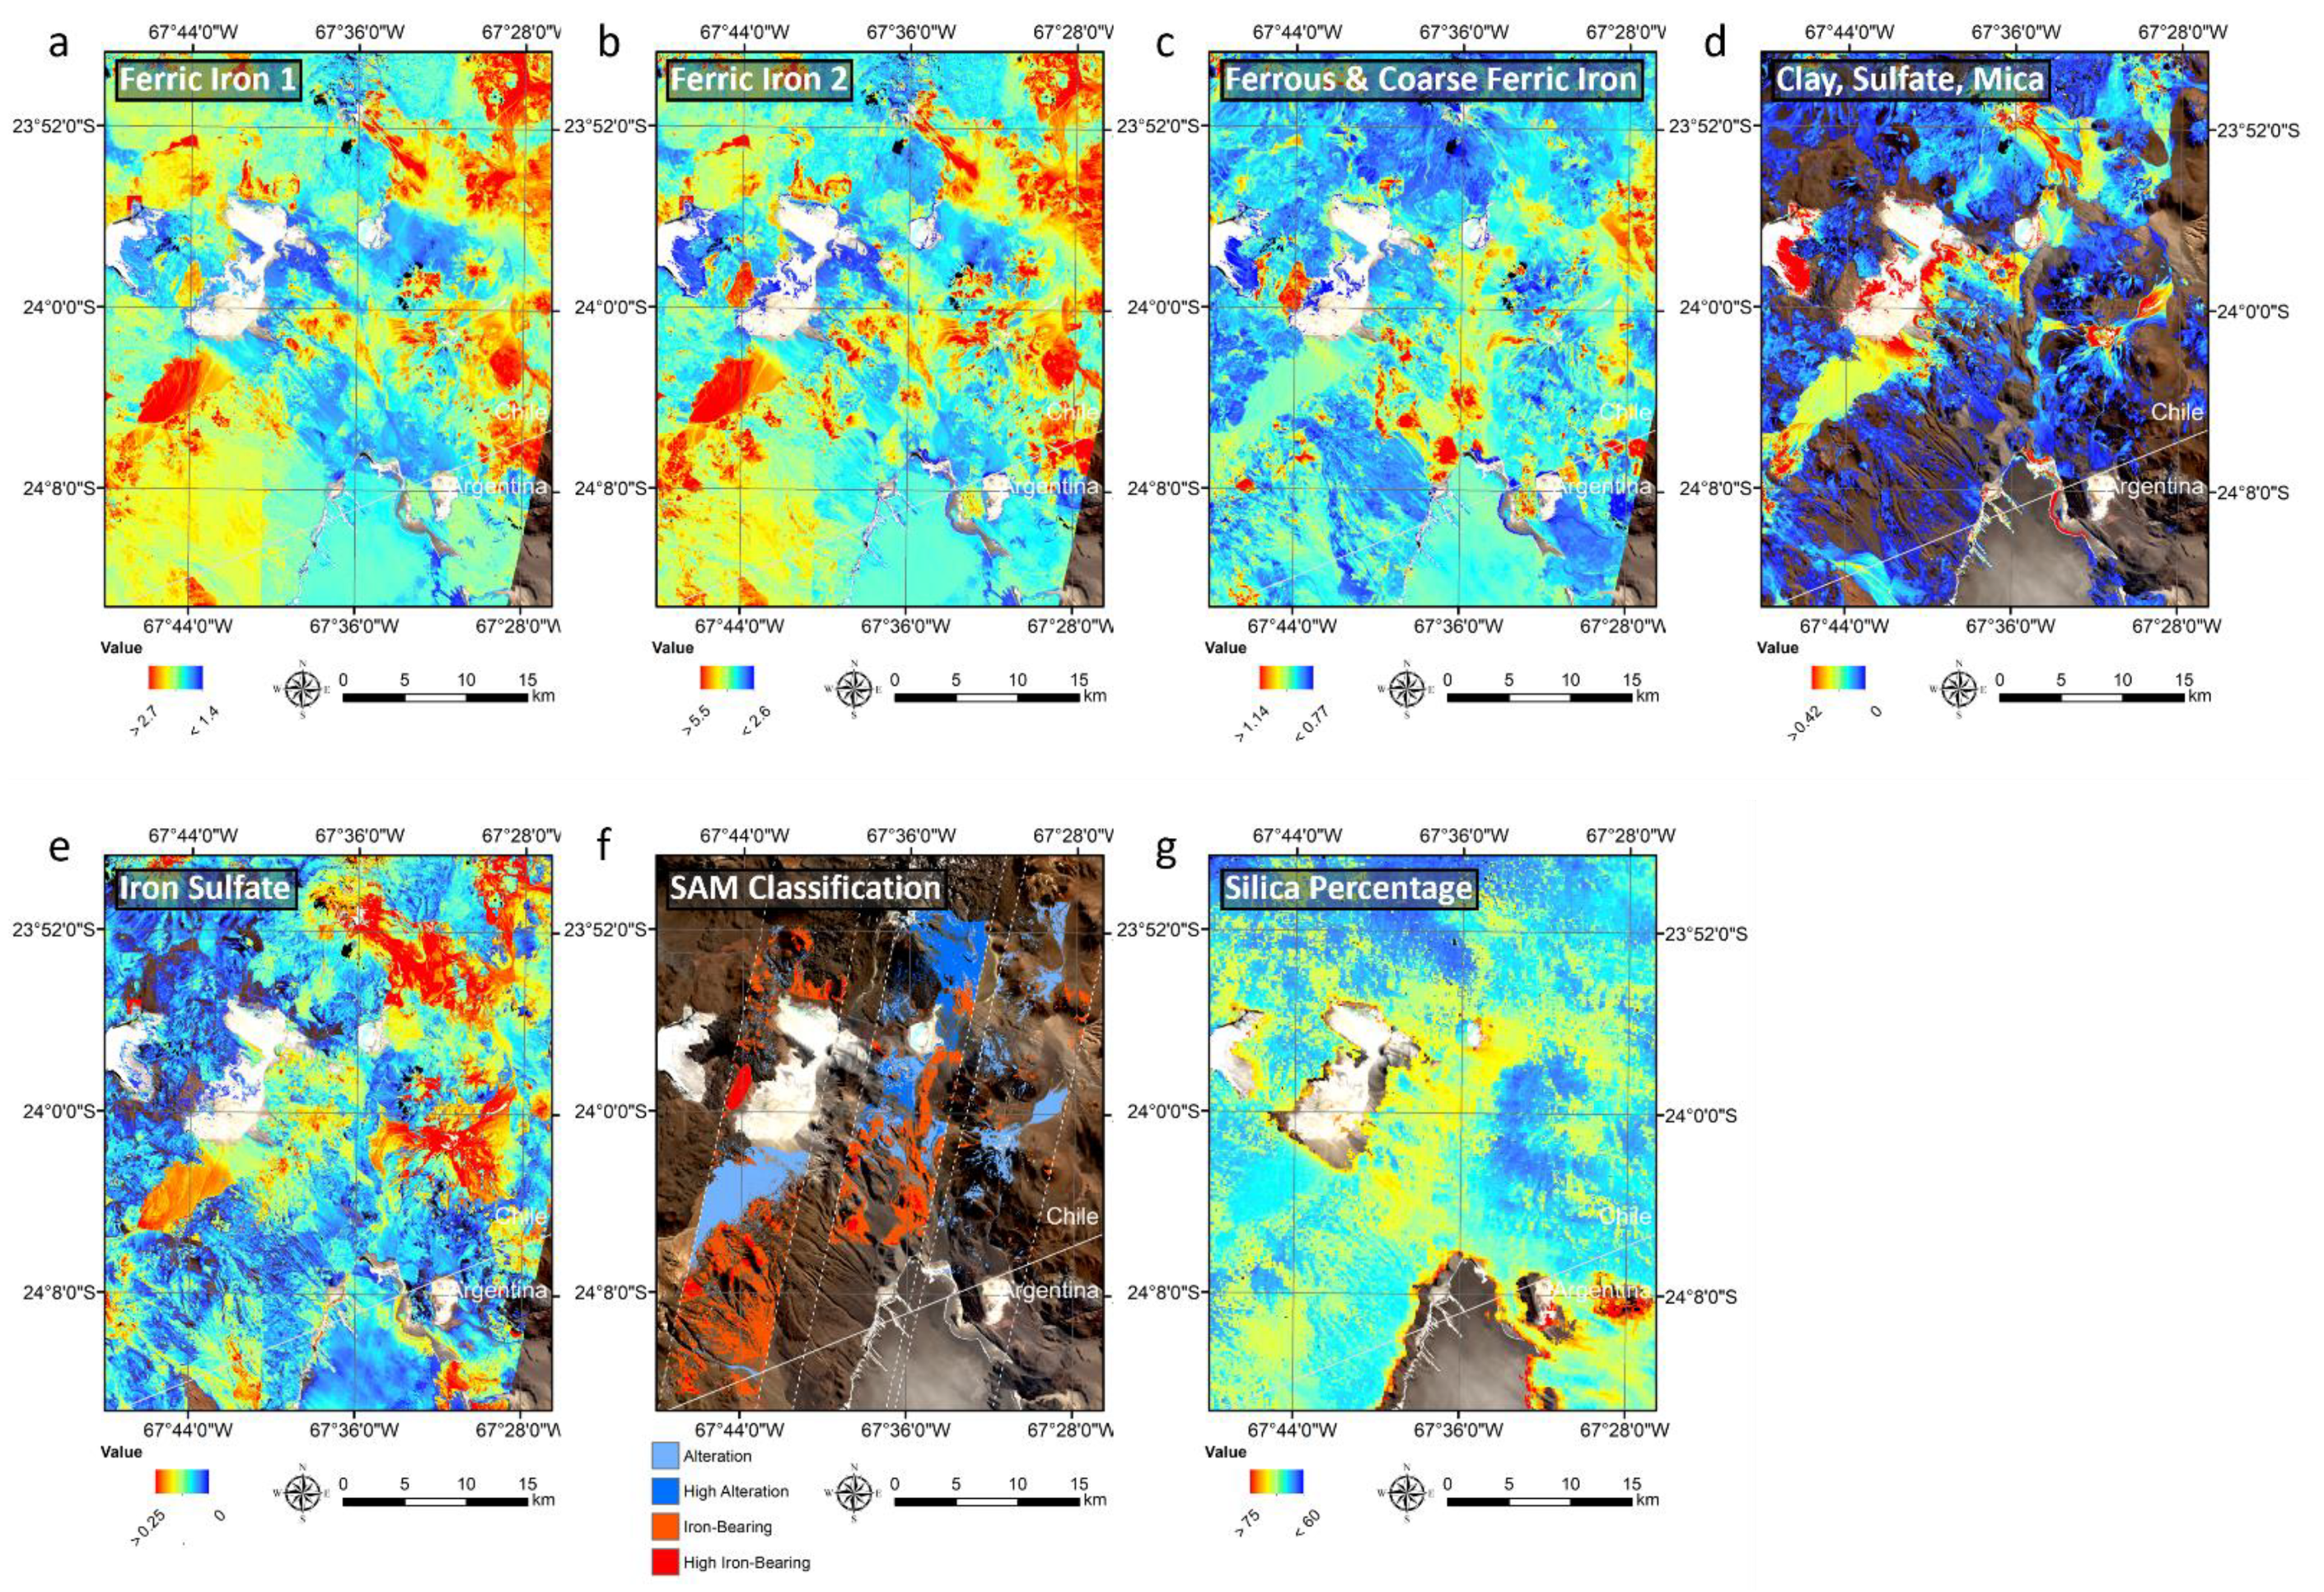
3.3. Lake Tuyajto/Salar de Talar Region

3.3.1. Alteration Minerals

The third area of interest covers the vicinity of Lake Tuyajto and Salar de Talar (Figure 2; 23°48′36″S, 67°47′60″W to 24°13′12″S, 67°26′24″W). A similar assemblage of mineral groups to that seen at the previous two sites was found here. The volcanoes Incahuasi Sur (24°1′12″S, 67°31′12″W), Tuyajto (23°51′0″S, 67°35′60″W), and Cordón Purichare (24°8′60″S, 67°49′48″W) were highlighted by very high Landsat clay-sulfate-mica mineral index values (Figure 6d). They also showed high iron-sulfate mineral index values (Figure 6e), which is similar to the ALMA/Toconao village area but different from the Cerro Carcanal area. The flow deposits on the slopes and base of the volcanoes also showed high clay-sulfate-mica and iron-sulfate index values. The Hyperion analysis indicated that these areas contain montmorillonite, kaolinite, and alunite minerals. The flow materials of the Tuyajto volcano showed strong spectral signatures of alunite and kaolinite, suggesting advanced argillic alteration to greater extents (Figure 6d,f).

3.3.2. Iron-Bearing Minerals

Volcanic deposits with very high Landsat ferrous/coarse-ferric iron indices and strong Hyperion hematite spectral signatures interpreted as basaltic-andesite deposits at the previous two locations were also present (“High-Iron-Bearing” class, e.g., 23°58′48″S, 67°43′48″W). The Hyperion analysis also determined a class with a moderate hematite spectral signature (labeled “Iron-Bearing”). As observed in the ignimbrites and pyroclastic flow deposits of the ALMA/Toconao village region, the “Iron-Bearing” class showed moderate-to-very-high values of Landsat ferric iron 1 and 2 index values. On the geological map, “High-Iron-Bearing” deposits corresponded to ignimbrites, volcanic centers, and partially eroded volcanic centers Miocene to Pliocene in age (Figure A1b). The “Iron-Bearing” class corresponded largely to ignimbrites and volcanic centers but also to partially eroded volcanic centers and secondary sedimentary deposits (e.g., alluvial). As seen previously, the Landsat ferrous/coarse-ferric iron index did not highlight the “Iron-Bearing” mineral class, but it was highlighted in the ferric iron 1 and 2 indices (Figure 6a–c).

4. Discussion

4.1. Evaluation of Mapping Results

4.1.1. Iron-Bearing and Alteration Minerals

The distribution of iron-bearing and alteration mineral groups highlighted by the Landsat band ratio indices corresponded to the mineral maps made from the ALI-ASTER fused images by Hubbard and Crowley [27] at the area around Azufre Volcano (21°47′0″S, 68°13′0″W). The argillic alteration minerals represented by Landsat index 4 (clay-sulfate-mica) showed high abundance values at Azufre Volcano and the flow deposits surrounding the volcano (Figure 2d). These areas also showed high abundance values of index 5, iron sulfates. The ferric and ferrous iron mineral indices (index 1, 2, and 3; Figure 2a–c) also highlighted areas indicated as hematite in Hubbard and Crowley [27]. A spectrum of a sample of red scoria at El Rojo III (22°0′5″S, 68°18′46″W) showed consistency in general shape and ferrous/coarse-ferric iron index with the Landsat spectrum from a pixel containing these coordinates (Figure 7a), and Spectral Analyst confirmed the presence of hematite. The geochemical analysis at CRPG of El Rojo III confirmed nearly 10 wt.% Fe2O3, which was the highest iron oxide content among 155 APVC silicate rocks compiled from published data and CRPG measurements (Supplementary Material).
The Hyperion SAM classification map at Cerro Carcanal for iron-bearing and alteration minerals also indicated consistency with the results of Hubbard and Crowley [27], who identified hematite, aluminous clays, and alunite (mixed). Despite the low signal-to-noise ratio of Hyperion, the distinct absorption features of alunite, kaolinite, and montmorillonite in the 2.0–2.5 µm wavelength region were captured (Figure 4) and allowed further constraining of the mineral groups within the alteration mineral group, which was not possible with the Landsat clay-sulfate-mica index. Within the alteration mineral group, we distinguished between pixels dominated by montmorillonite and by alunite/kaolinite, indicating argillic alteration or advanced argillic alteration, respectively. The spatial correlation of the alteration minerals identified in the Hyperion analysis was in visually good agreement with the Landsat clay-sulfate-mica index (Figure 3d,f, Figure 5d,f and Figure 6d,f). Similarly, for iron-bearing minerals, the distinction between the strong and weak presence of iron was possible with Hyperion; pixels with a strong hematite spectral signature were classified as “High-Iron-Bearing” class (Figure 3f, Figure 5f and Figure 6f), and pixels with a weaker hematite spectral signature were classified as “Iron-Bearing” class (Figure 5f and Figure 6f). Both of these iron-bearing mineral classes showed high spatial correlation with the Landsat ferrous/coarse-ferric iron index (Figure 3c,f, Figure 5c,f and Figure 6c,f).

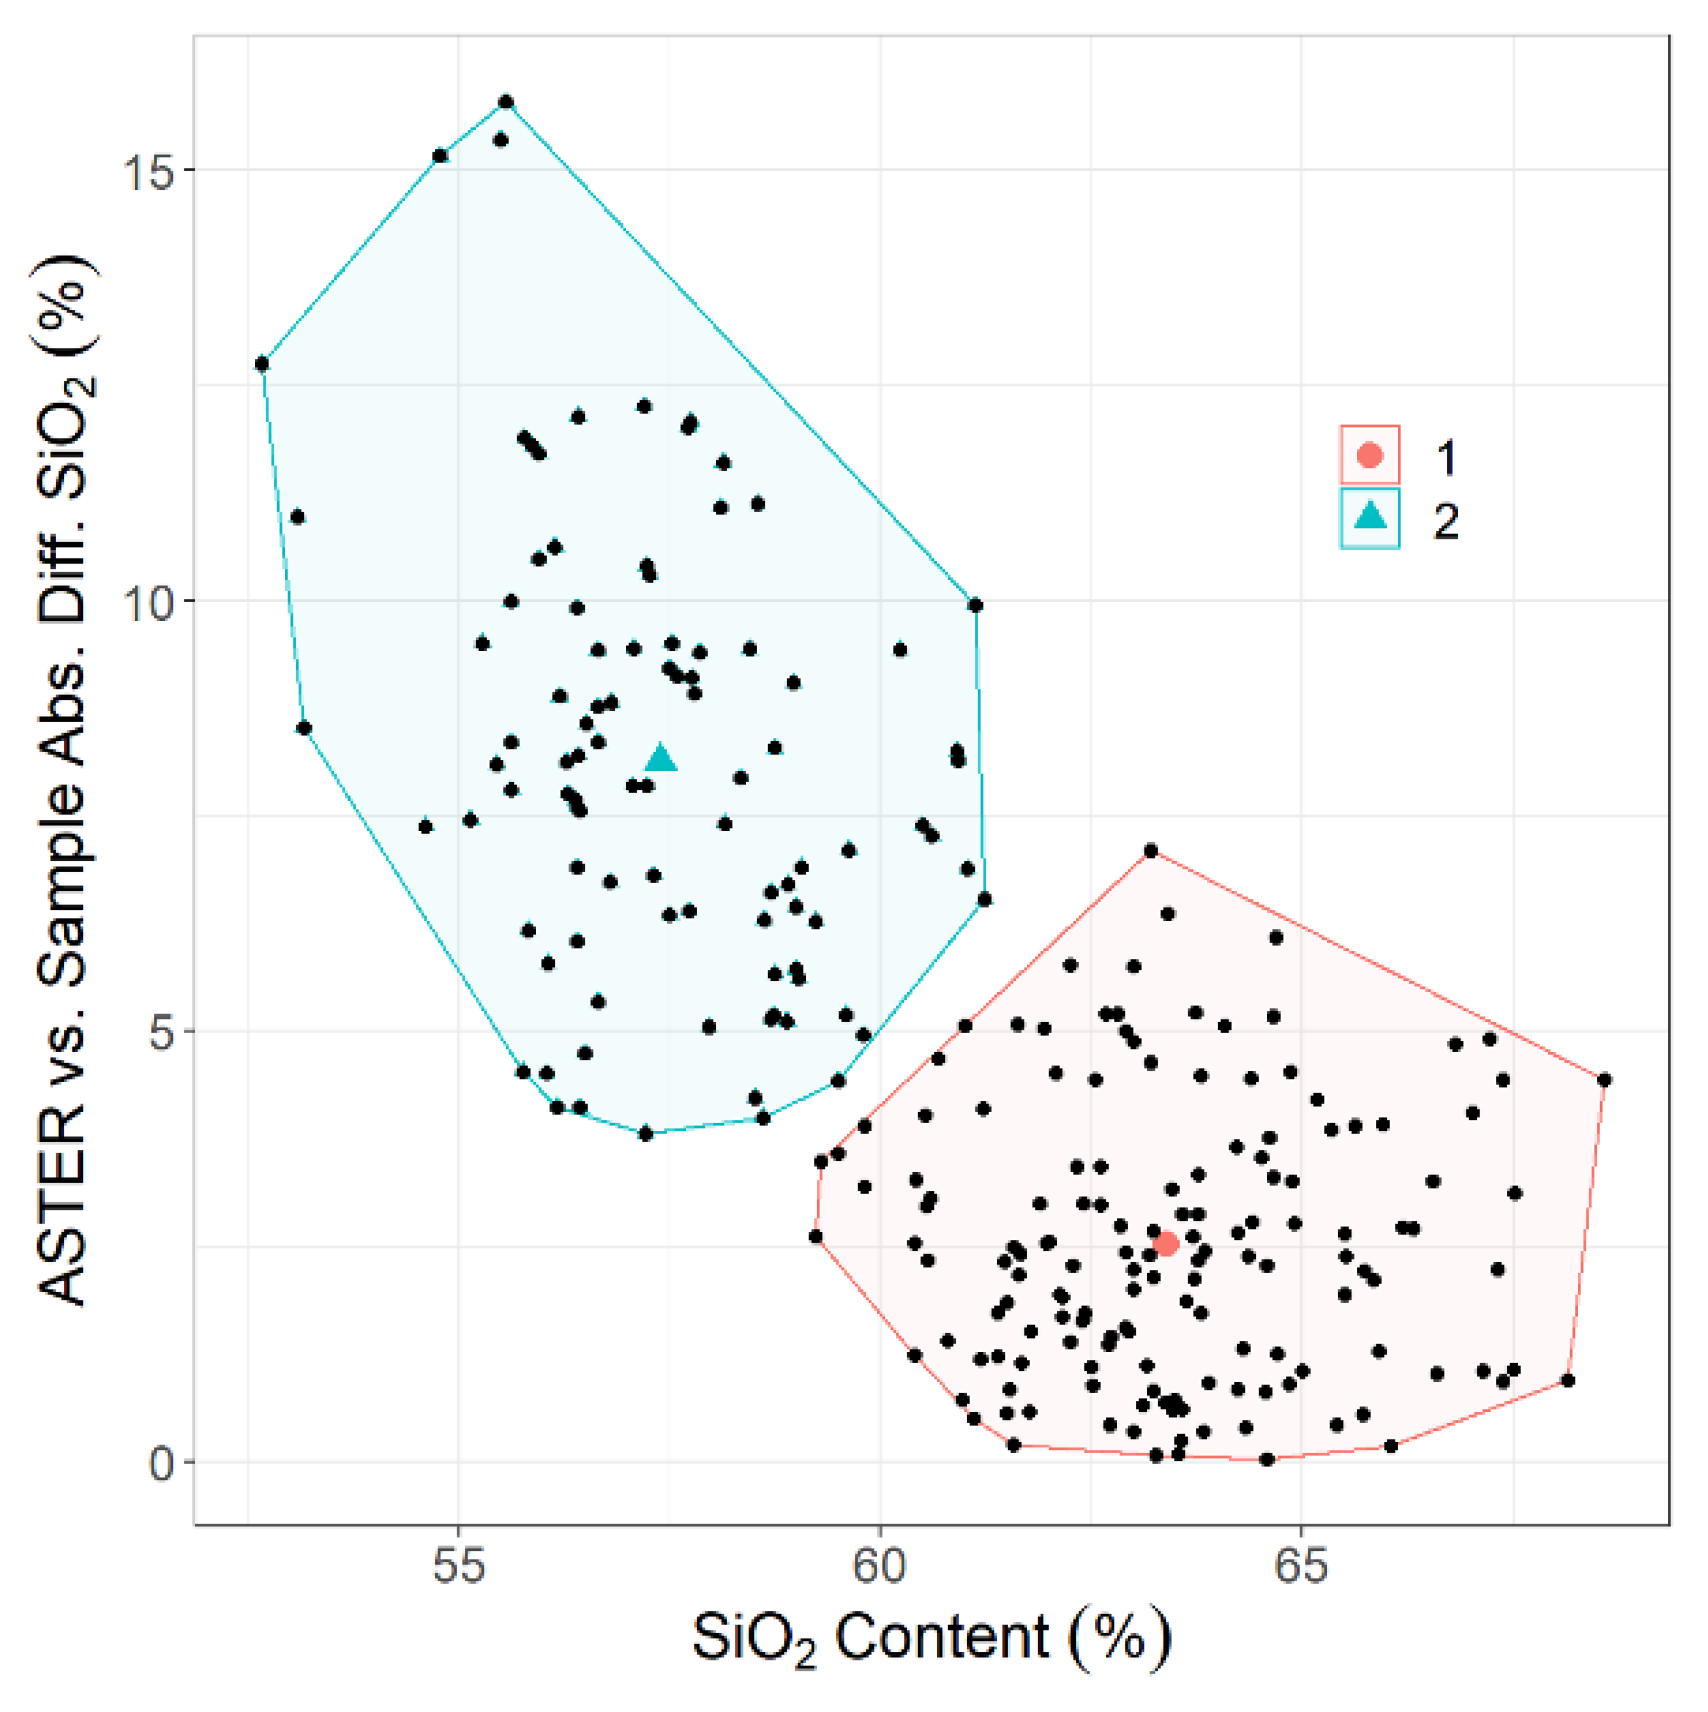
4.1.2. Silica Percentage

Overall, the silica percentages derived from the ASTER GED highlighted roughly two main groups: secondary sedimentary deposits and primary volcanic deposits/centers high and low in silica, respectively. The absolute error in ASTER GED is reported as 1.24% [40,73], and using this, we estimated that uncertainties in the weight percentage of silica, calculated as in Section 2.3, were generally 0.5 wt.% SiO2 or lower for over 90% of pixels in both categories (high and low silica content).
We gathered the published silica contents of samples of the APVC and also measured the silica content of the available APVC rock samples at the CRPG geochemistry laboratory for ground-truth comparison to the silica content derived from the ASTER GED (Appendix D and the Supplementary Material). In total, the locations of 251 samples corresponded to the ASTER silica content pixels, but four mafic samples with silica content of 50% SiO2 or below were removed from further consideration (247 total). Assuming that the samples are representative of the surface seen from orbit, the ASTER GED silica content estimations were within a 6 wt.% SiO2 difference for about two-thirds of the samples and within a 3 wt.% SiO2 difference for 40% of the samples (Table 2). We found that there was a trend in the absolute differences as a function of silica content, according to which samples above approximately 60 wt.% SiO2 had lower differences than those below 60 wt.% SiO2 (Figure 8). Two groups, with high (group 1) and low (group 2) silica content, were distinguished using the k-means clustering method. Group 1 had a center point at 63 wt.% SiO2 with a 2.5 wt.% SiO2 difference and group 2 had a center point at 57 wt.% SiO4 with an 8.1 wt.% SiO2 difference (Figure 8). Approximately 90% of the measurements in group 1 and group 2 were below 5 and 12 wt.% SiO2 difference, respectively. The silica content derived from ASTER GED was lower than that of the samples (i.e., underestimation) for 15% of the samples, and furthermore, these underestimations only occurred in group 1, which accounts for one-quarter of the group 1 samples.
Based on the ground-truth comparison, we believe that silica content estimation with ASTER GED is reasonable for deriving the silica content of APVC rocks within roughly 2–3 wt.% SiO2 of the true value if they are above 60 wt.% SiO2 (group 1). For a study dealing with rocks below 60 wt.% SiO2 (group 2) where an average difference of 8.1 wt.% SiO2 is not sufficient, we suggest a simple qualitative approach, e.g., high vs. low silica content comparison, which can still be valuable for remote locations.
We suspected that the larger deviations of the ASTER-derived silica content from those of the samples could be attributed to Equation (3), where we assumed the exclusion of ultramafic rocks. Thus, we derived the silica content from the ASTER GED using the four-term Gaussian parameters of Hook et al. [45] that includes ultramafic rocks as
y = −10.548 A1 + 160.25
where A1 is from Equation (2). The result did not yield a significant trend in ASTER vs. sample differences as a function of silica content, and the overall agreement was lower than Equation (3), which excluded ultramafics (Table A3). For this reason, estimations based on Equation (3) are preferred. Although beyond the scope of this study, measuring the thermal emissivity spectra of the APVC samples and deriving the APVC’s unique relationship between the wavelength of the minimum of the reststrahlen bands and the silica content of the rocks instead of using Equation (3) could lead to improvements. Additionally, the samples should ideally come from spatially representative locations rather than spatially biased locations (Figure A1a); however, the conditions of the APVC did not easily permit this (i.e., the purpose of using remote sensing techniques).

4.1.3. Feldspar Minerals

The feldspar spectra detected with Hyperion near the Chanka dome (21°45′0″S, 68°18′58″W) matched the spectra of a sample of feldspar-bearing rock collected at this location (Figure 9a). A visual inspection of the sample and optical microscope observations of a thin section indicated the presence of optically visible feldspar grains with sizes approximately 3 cm and smaller (Figure 9b–d). Additionally, the space between distinguishably large grains in the microscope image appeared to be composed of very small (roughly < 1 µm) feldspar and other mineral grains (Figure 9c,d). These observations give confidence to feldspar detections based on the 1.3 µm spectral feature.
For Dacite Dome D, which showed strong feldspar spectral signatures in the ALMA/Toconao village region (22°56′0″S, 67°43′12″W; Figure 5g), the computed feldspar index values (>0.4) substantially exceeded the typical values for the Chanka dome (0.03). Samples of Dacite Dome D analyzed by Schmitt et al. [72] indicated that plagioclase feldspars accounted for 66–80% of the minerals (33–40% of the entire sample total when accounting for the presence of glass). According to Schmitt et al. [72], dacite pumice from the Purico ignimbrite surrounding Dacite Dome D closely resembles that of Dacite Dome D, with similar abundances of plagioclase feldspars, but curiously, we observed that only a small portion of the Purico ignimbrite to the South of El Cerrillo dome showed low feldspar index values.

4.2. Assessment of Different Datasets and Mapping Techniques

First, the Landsat 8 OLI DCS map, which is not quantitative but is computationally fast and suited for the initial evaluation of a large area, captured the diversity of the volcanic features, namely, the relative differences between the ignimbrites, low-silica volcanic centers, silicic domes, alteration areas, and sedimentary deposits (Figure A1c). Compositional variations were also observed within volcanic centers (e.g., Carcanal volcano versus the neighboring San Pedro and San Pablo volcanoes) or within ignimbrite bodies, which may appear in tones of yellow, orange, green, or purple in the Landsat DCS image (Figure A1c). Although the geological map did not distinguish them, possible differences may have arisen from the iron content, iron oxidation level, weathering, and compactness of the sediments.
After grasping the general pattern of the study site with the DCS technique, we applied semi-quantitative techniques to measure the presence of selected minerals. The band ratio indices for six mineral groups (Table 1) were computed with Landsat 8 OLI, which was fast and particularly effective at mapping a semi-quantitative distribution of key mineral groups, thereby capturing evidence of volcanic activities, such as iron-bearing and alteration minerals. A caveat of the band depth index approach, however, is that it targets a known mineral with a known absorption feature, which may in fact vary depending on its exact composition, structure, or environmental parameters. Therefore, the band depth index approach is not suitable for finding unexpected/unknown minerals. However, this limitation can be remedied to some extent by being aware of the variabilities shown with the DCS map and other sources of information, such as the geologic map. Another limitation is that the mineral groups were not precise enough, particularly for the clay-sulfate-mica group. The low spectral resolution of the Landsat 8 OLI does not allow the distinction among different minerals within each group. On the other hand, hyperspectral images are able to capture narrow spectral features and are better suited for more precise mineral characterizations; thus, we utilized EO-1 Hyperion hyperspectral imagery to obtain more definitive mineral characterizations. The spectral hourglass technique was used to derive mineral identification and distribution from the scene, and it distinguished alunite, kaolinite, and montmorillonite spectra within the Landsat clay-sulfate-mica group. This is a complementary approach to the spectral indices used with the Landsat dataset, and it is a means to achieve more precise mineral characterizations and cross-check the results from the Landsat analysis. In spite of that, precise distinctions were still not easy, since the minerals had overlapping or close spectral features, and spectral features were masked by other minerals. For this reason, we did not attempt to map alunite, kaolinite, and montmorillonite separately but rather distinguished only between alunite and a group of kaolinite and montmorillonite.
Band-depth indices can also be computed from Hyperion. This was necessary for the feldspar identification, where the diagnostic spectral feature is weak, and the spectral feature range is not adequately captured by Landsat 8 OLI (or other multispectral datasets). For weak spectral features such as those of feldspars, masking and inadequate absorption depth are especially problematic, even for hyperspectral datasets. We detected high feldspar index values from Dacite Dome D, but the Chanka dome had much lower index values and the felsic ignimbrites did not have significant values at all, even though they were expected to have feldspars. The spectral signature of feldspars is influenced by multiple parameters, including the mineral assemblage, the mineral’s composition, its grain size, and the rock texture [64,66,67]. Spectral unmixing methods could resolve at least some of these problems.
Hyperion and other hyperspectral imaging techniques are usually spatially limited, only covering a fraction of Landsat 8 OLI imagery, with considerable spatial gaps among available images. For this reason, Hyperion is better suited to the study of small regions of interest already identified with Landsat or other datasets.
The ASTER GED in the TIR was highly complementary to the mineral analysis performed with the Landsat and Hyperion dataset in the VNIR-SWIR. Initially, the ASTER DCS map (Figure A1d) qualitatively revealed the relative distribution of high silica content (red), low silica content (blue), and non-silicates (green). Next, the quantitative silica percentages derived from the wavelengths of the minimum of reststrahlen bands followed the general spatial pattern seen in the ASTER DCS map and showed reasonable, albeit variable, errors when compared to the ground-truth samples. The mapping of the silica percentage of the silicate rocks at the APVC in the order of 10,000 s to 100,000 km2 spatial extents is beneficial for volcanological studies of the APVC, and for our future work, it could define the lithological contexts of minerals and mineral groups identified with VNIR-SWIR spectra, especially feldspars.

4.3. Re-Emphasis of the APVC for Planetary Analog Use

Previously, water-related features, such as salars and hydrothermal fields, have been popular targets for planetary analog studies at the APVC. However, the remote sensing survey conducted in this study revealed other geological features, to large spatial extents, relevant for comparisons to those on other solar system bodies. Notably, the detection of the feldspar spectral signatures of non-anorthosite rocks with Hyperion could impact on the direction of research in Mars volcanism, in which recent works (e.g., Barthez et al. [31], Flahaut et al. [32]) have demonstrated alternative views to the hypothesis that feldspar spectral signature detections are likely anorthosites (which is the hypothesis of Carter and Poulet [62] and others). The detection of strong feldspar spectral signatures at Dacite Dome D in the ALMA/Toconao village region offers the potential for deeper insights into this problem, and it also is relevant for comparisons to silicic domes on the Moon (e.g., Flahaut et al. [21], Glotch et al. [74]). Questions remain over this dome as the ASTER silica percentage estimation yielded a range of 62–69 wt.% SiO2 and the majority of nearby Purico ignimbrite did not show high feldspar spectral index values, despite it being mineralogically and chemically similar to Dacite Dome D. Often, the preferred approach for identifying feldspars or other silicate minerals is to detect the diagnostic reststrahlen bands in high-spectral-resolution TIR spectra (e.g., Lyon [42]); however, for both the Earth and Mars, orbital TIR hyperspectral imagery with sufficiently high spatial resolution (10′s of m/pixel) does not currently exist. The combination of feldspar detections with the 1.3 µm spectral feature in hyperspectral VNIR-SWIR imagery and the silica percentages derived from multispectral TIR imagery is currently viewed as a robust approach (e.g., Rogers and Nekvasil [64]). The outcome of the preferred interpretations of feldspar detections on Mars has a major impact on our understanding of Martian geological history; thus, follow-up investigations of the feldspar detections demonstrated in this work are crucial. We plan to send a geological field expedition to the Dacite Dome D area to gather further ground-truth data.
Ignimbrites in the ALMA/Toconao village region are another feature worthy of more detailed investigations. Parts of ignimbrites were highlighted by high silica percentages (~70%) according to ASTER, and the ignimbrite samples contained feldspar grains; however, although we did not find feldspar spectral signatures with Hyperion, we found moderate iron spectral signatures. In addition, the detection of high-iron-bearing mineral deposits at all three presented regions that were interpreted as basaltic-andesites is remarkable for research on mafic volcanism in the APVC [30,71,75].
Abundant alteration minerals were identified at the APVC, particularly in the Cerro Carcanal and Lake Tuyajto/Salar de Talar regions. Alteration analog studies have been important for understanding alterations on other planetary bodies (e.g., Mars; Carter et al. [76], Murchie et al. [77]), and they have also been conducted at other volcanic regions on Earth (e.g., Hawaii, Italy). The Landsat clay-sulfate-mica index and Hyperion alteration mineral maps contribute to this large-scale effort and will be useful for continued analog studies of alterations; moreover, they could play a major role in mineral resource assessments at the APVC, as argillic alterations are often associated with economically valuable minerals.
The methodology adopted in this work is commonly used in Earth and planetary remote sensing studies. We first used Landsat and ASTER, which are multispectral instruments and have large spatial coverage but low spectral resolution, to identify smaller regions of interest. Next, the minerals within those smaller regions were further analyzed with Hyperion hyperspectral imagery. Although it is not new, we emphasize that the dataset and mapping approach adopted in this work resemble those available for the Moon and Mars, and thus, our work is transferable to the analysis of the analogous terrains of these planetary bodies. The three satellite imagery datasets of the Earth, Landsat 8 OLI, Terra ASTER, and EO-1 Hyperion, are comparable to the Mars Odyssey (MO) Thermal Emission Imaging System (THEMIS) VNIR bands [78], the Mars Reconnaissance Orbiter Compact Reconnaissance Imaging Spectrometer for Mars (CRISM) [79], and MO THEMIS TIR bands [78]. For the Moon, they are comparable to Clementine multispectral imaging cameras (ultraviolet/visible camera, near-infrared camera) [80], the SELENE/Kaguya Multiband Imager [81], the Chandrayaan-1 Moon Mineralogy Mapper (M3) [82], and the Lunar Reconnaissance Orbiter (LRO) Diviner [83]. Figure 1 shows the comparison of the instruments. Future orbiter missions, such as the Lunar Trailblazer [84], will carry similar but enhanced spectral instruments operating in both the VNIR-SWIR and TIR ranges.
Some limitations to this methodology, which is mainly based on the Earth’s differences to other planetary bodies, must be understood. The atmosphere is a major factor in orbital remote sensing, and the Earth’s atmosphere has strong absorptions arising from water, which is a dominant molecule on Earth, but not in other solar system bodies. This substantially impacts the usable wavelengths on Earth in both VNIR-SWIR and TIR and limits the constraining of some minerals, such as the clay-sulfate-mica group. Although Hyperion captured important spectral features in the 2.0–2.5 µm region, other major bands in the 1.0–2.0 µm would have helped with further constraining. On the other hand, the lack of atmosphere on some planetary bodies leads to spectral effects from space weathering in VNIR-SWIR [85] and thermal gradient in the TIR [86,87], which lead to difficulties in the interpretation of spectra. Additionally, the designs of existing instruments were intended for accomplishing the specific scientific objectives of a mission; thus, different instruments have different caveats, even if equivalent geological information can be retrieved. For instance, the LRO Diviner can retrieve silica content, but this is achieved by using the Christiansen feature of TIR spectra rather than reststrahlen bands, which was the case in this work [74,88,89].

5. Conclusions

The remote sensing data from various instruments (ASTER, Hyperion, Landsat) were used to map the mineral groups of mainly volcanic and secondary volcanic surfaces of the Altiplano-Puna Volcanic Complex, which are sound analogs of these types of surface on the Moon and Mars. Although mineral maps covering 10,000 s to 100,000 km2 scales of the APVC are some of the fundamental resources used to conduct geological field work and planetary analog studies, they have not been created before. Using a combination of Earth observation instruments with comparable characteristics to lunar and Martian orbital instruments, we characterized, with different techniques, the alteration minerals, iron-bearing minerals, feldspar minerals, and silica percentages of bulk rocks. Three areas of particular interest for planetary analog studies were highlighted in this work, although other areas not mentioned in detail were also noteworthy for further investigations. The results of our maps were consistent with existing geological maps and a previous study performed locally at the Azufre volcano, and they also showed consistency, to varying degrees, with the geochemical analysis of samples compiled from past studies and measurements performed at CRPG. The benefits and limitations of each dataset and method were evaluated, and we observed that synthetically analyzing remote sensing datasets with different characteristics (e.g., wavelength range, spatial extent, spectral resolution) leads to more confident qualitative and quantitative interpretations of minerals and rocks over large areas.
One immediate impact of this work on the current state of planetary analog studies is the detection of feldspar spectral signatures on non-anorthositic rocks. Our feldspar detections at Chanka dome and Dacite Dome D influenced on-going efforts to refine the spectral detection of feldspar minerals on rocks other than anorthosites through laboratory measurements [31] and Mars CRISM hyperspectral imagery [32]. A laboratory analysis, by Barthez et al. [31], of entire feldspathic rocks of varied nature indicated that volcanic, plutonic, and metamorphic feldspathic rocks all show the spectral signature of plagioclase feldspars. Our observation of feldspar spectral signatures at Chanka dome (dacitic volcanic rock) and its sample analysis is consistent with their study. This supports the detection of the feldspar spectral signatures of non-anorthositic rocks on Mars by Flahaut et al. [32].

Supplementary Materials

The following supporting information can be downloaded at: https://www.mdpi.com/article/10.3390/rs14092081/s1.

Author Contributions

Conceptualization, J.F. and G.I.; methodology, J.F. and G.I.; software, V.P. and G.I.; validation, J.F., O.G.-M., B.G., M.B. and G.I.; formal analysis, J.F., O.G.-M., B.G., M.B. and G.I.; investigation, J.F., O.G.-M., B.G., M.B. and G.I.; resources, J.F., O.G.-M., B.G., M.B., V.P. and G.I.; data curation, J.F. and G.I.; writing—original draft preparation, J.F., O.G.-M., B.G., M.B. and G.I.; writing—review and editing, J.F., O.G.-M., B.G., M.B. and G.I.; visualization, J.F., M.B. and G.I.; supervision, J.F.; project administration, J.F.; funding acquisition, J.F. All authors have read and agreed to the published version of the manuscript.

Funding

This research was funded by CNRS Momentum grant, the LUE future leader ‘Viscous’, and the ANR ‘Mars-Spec’ projects attributed to J. Flahaut. Financial support by FONDAP Folio 15090013 and 15200001 (Centro de Excelencia and Geotermia de los Andes) was attributed to B. Godoy.

Data Availability Statement

The remote sensing data listed in Table A1 are available on USGS EarthExplorer, https://earthexplorer.usgs.gov/, (accessed on 24 January 2022). The geochemistry analysis results are available in the Supplementary Material. The spectra of the samples are available on SSHADE, https://www.sshade.eu/db/mirabelle, (accessed on 24 January 2022).

Acknowledgments

The authors thank the NASA Hyperion team for acquiring dedicated targets prior to the instrument decommissioning. We are also thankful to Mélissa Martinot and Pascal Allemand for fruitful discussions. The authors are also grateful to the SARM Nancy, and in particular Delphine Yeghicheyan and Christophe Cloquet, for performing sample analyses. This is CRPG contribution N°2816.

Conflicts of Interest

The authors declare no conflict of interest.

Appendix A

Table A1. Summary of remote sensing-data used in this work.
InstrumentData TypeID 1Map
Landsat 8 OLILevel 1 RadianceLC08_L1TP_001075_20200727_20200807_01_T1Background imagery
LC08_L1TP_001076_20200727_20200807_01_T1
LC08_L1TP_001077_20200727_20200807_01_T1
LC08_L1TP_233075_20200618_20200625_01_T1
LC08_L1TP_232076_20200729_20200807_01_T1
LC08_L1TP_233076_20200805_20200821_01_T1
LC08_L1TP_232077_20200729_20200807_01_T1
LC08_L1TP_233077_20200805_20200821_01_T1
Level 2 ReflectanceLC08_L2SP_233075_20141125_20200910_02_T1Iron-bearing minerals,
alteration minerals
LC08_L2SP_233076_20141109_20200910_02_T1
LC08_L2SP_233077_20141109_20200910_02_T1
EO-1 HyperionLevel 1 RadianceEO1H2320772002361111PPIron-bearing minerals,
alteration minerals,
feldspar minerals
EO1H2330752011245110KF
EO1H2330762008075110P2
EO1H2330762012034110KF
EO1H2330762016250110PF
EO1H2330762016269110PF
Terra ASTERGED AG 100AG100.v003.-21.-068.0001.h5Silica percentage
AG100.v003.-21.-069.0001.h5
AG100.v003.-22.-068.0001.h5
AG100.v003.-22.-069.0001.h5
AG100.v003.-23.-068.0001.h5
AG100.v003.-23.-069.0001.h5
AG100.v003.-24.-068.0001.h5
AG100.v003.-24.-069.0001.h5
1 “Landsat Product Identifier”, “Entity ID”, and “Local Granule ID” for Landsat 8 OLI, EO-1 Hyperion, and Terra ASTER data, respectively.

Appendix B

Table A2. Wavelengths used for computing the feldspar band-depth index with EO-1 Hyperion. The last row shows the mean.
λsλcλl
0.7831.0031.2251.548
0.7931.0131.2351.558
0.8031.0231.2451.568
0.8131.0331.2551.578
0.8241.0441.2661.588
0.8441.0641.2861.609
0.8541.0741.2961.619
0.8641.084 1.629
0.875 1.639
0.884 1.649
1.659
1.669
1.679
1.689
1.699
1.709
0.8341.0431.2611.629

Appendix C

Table A3. Summary of the differences in silica content derived from ASTER GED using Equation (7) and measured in geochemical laboratories.
SiO2 Abs. Diff.0–55–1010–1515–20+20
% of samples382522510
no. samples at CRPG04102

Appendix D

Rock samples from previous field campaigns were ground in an agate mortar. Major element analyses were performed by ICP-OES at the Service d’Analyse des Roches et des Minéraux (SARM) facility in Nancy, France (https://sarm.cnrs.fr/index.html, (accessed on 24 January 2022)). Data can be found in the Supplementary Material.

Appendix E

Figure A1. (a) Landsat 8 OLI radiance true color imagery of the APVC. Sampling locations used for comparison to ASTER silica content map are shown and grouped by source reference. The group “Godoy references” includes Godoy [90] and Godoy et al. [28,71,91]. The group “Multiple references” includes Francis et al. [92], Freymuth et al. [93], Mamani et al. [94], and Rogers and Hawkesworth [95]. (b) Geological map of Chile from Servicio Nacional de Geología y Minería [69]. Some geological units and features mentioned in the main text are indicated. Red triangles indicate volcanoes: 1 Azufre and Chanka, 2 San Pedro-San Pablo and La Poruña, 3 Lascar, 4 El Negrillar. Full descriptions of the geological units are extensive, and the reader is referred to [69]. (c) Landsat 8 OLI reflectance DCS using bands 7, 6, and 4 as red, green, and blue, respectively. (d) ASTER DCS using bands 14, 12, and 10 as red, green, and blue, respectively. On all four maps, three regions selected in this study are indicated by rectangles, and the approximate APVC boundary is shown.
Remotesensing 14 02081 g0a1

References

  1. Farley, K.A.; Williford, K.H.; Stack, K.M.; Bhartia, R.; Chen, A.; de la Torre, M.; Hand, K.; Goreva, Y.; Herd, C.D.; Hueso, R.; et al. Mars 2020 Mission Overview. Space Sci. Rev. 2020, 216, 142. [Google Scholar] [CrossRef]
  2. Grasset, O.; Dougherty, M.K.; Coustenis, A.; Bunce, E.J.; Erd, C.; Titov, D.; Blanc, M.; Coates, A.; Drossart, P.; Fletcher, L.N.; et al. JUpiter ICy moons Explorer (JUICE): An ESA mission to orbit Ganymede characterise the Jupiter system. Planet. Space Sci. 2013, 78, 1–21. [Google Scholar] [CrossRef]
  3. Howell, S.M.; Pappalardo, R.T. NASA’s Europa Clipper—A mission to a potentially habitable ocean world. Nat. Commun. 2020, 11, 1311. [Google Scholar] [CrossRef] [PubMed]
  4. International Space Exploration Coordination Group. The Global Exploration Roadmap. Washington, DC, USA. 2018. Available online: http://www.globalspaceexploration.org (accessed on 1 September 2021).
  5. Carr, M.H. The Surface of Mars; Cambridge University Press: New York, NY, USA, 2006; pp. 43–76. [Google Scholar]
  6. Chapman, M. The Geology of Mars Evidence of Earth-Based Analogs; Cambridge University Press: London, UK, 2009; p. 484. [Google Scholar]
  7. Hörz, F.; Grieve, R.; Heiken, G.; Spudis, P.; Binder, A. Lunar Surface Processes. In Lunar Sourcebook; Heiken, G.H., Vaniman, D.T., French, B.M., Eds.; Cambridge University Press: New York, NY, USA, 1991; pp. 61–120. [Google Scholar]
  8. Abercromby, A.F.J.; Gernhardt, M.L.; Jadwick, J. Evaluation of dual multi-mission space exploration vehicle operations during simulated planetary surface exploration. Acta Astronaut. 2013, 90, 203–214. [Google Scholar] [CrossRef]
  9. Eppler, D.; Adams, B.; Archer, D.; Baiden, G.; Brown, A.; Carey, W.; Cohen, B.; Condit, C.; Evans, C.; Fortezzo, C.; et al. Desert Research and Technology Studies (DRATS) 2010 science operations: Operational approaches and lessons learned for managing science during human planetary surface missions. Acta Astronaut. 2013, 90, 224–241. [Google Scholar] [CrossRef] [Green Version]
  10. Lim, D.S.S.; Abercromby, A.F.J.; Nawotniak, S.E.K.; Lees, D.S.; Miller, M.J. The BASALT research program: Designing and developing mission elements in support of human scientific exploration of Mars. Astrobiology 2019, 19, 245–261. [Google Scholar] [CrossRef]
  11. Lim, D.S.S.; Heldmann, J.L. Exploring our Solar System through inter-disciplinary, analog research: An overview of the FINESSE, BASALT and SUBSEA programs. Planet. Space Sci. 2021, 199, 105187. [Google Scholar] [CrossRef]
  12. Young, K.E.; Bleacher, J.E.; Rogers, A.D.; Schmitt, H.H.; McAdam, A.C.; Gary, W.B.; Whelley, P.L.; Scheidt, S.P.; Ito, G.; Knudson, C.A.; et al. The incorporation of field portable instrumentation into human planetary surface exploration. Earth Space Sci. 2018, 5, 697–720. [Google Scholar] [CrossRef] [Green Version]
  13. Ruff, S.W.; Farmer, J.D. Silica deposits on Mars with features resembling hot spring biosignatures at El Tatio in Chile. Nat. Commun. 2016, 7, 13554. [Google Scholar] [CrossRef]
  14. Flahaut, J.; Bishop, J.L.; Silvestro, S.; Tedesco, D.; Daniel, I.; Loizeau, D. The Italian Solfatara as an analog for Mars fumarolic alteration. Am. Mineral. 2019, 104, 1565–1577. [Google Scholar] [CrossRef]
  15. Yant, M.; Young, K.E.; Rogers, A.D.; McAdam, A.C.; Bleacher, J.E.; Bishop, J.L.; Mertzman, S.A. Visible, near-infrared, and mid-infrared spectral characterization of Hawaiian fumarolic alteration near Kilauea’s December 1974 flow: Implications for spectral discrimination of alteration environments on Mars. Am. Mineral. 2018, 103, 11–25. [Google Scholar]
  16. Aerts, J.W.; van Spanning, R.J.M.; Flahaut, J.; Molenaar, D.; Bland, P.H.; Genge, M.J.; Ehrenfreund, P.; Martins, Z. Microbial communities in sediments from four mildly acidic ephemeral salt lakes in the Yilgarn Craton (Australia)—Terrestrial analogs to ancient Mars. Front. Microbiol. 2019, 10, 779. [Google Scholar] [CrossRef] [PubMed]
  17. Aerts, J.W.; Riedo, A.; Melton, D.J.; Martini, S.; Flahaut, J.; Meierhenrich, U.J. Biosignature analysis of Mars soil analogs from the Atacama Desert: Challenges and implications for future missions to Mars. Astrobiology 2020, 20, 766–784. [Google Scholar] [CrossRef] [PubMed]
  18. Dickson, J.L.; Head, J.W.; Levy, J.S.; Morgan, G.A.; Marchant, D.R. Gully formation in the McMurdo Dry Valleys, Antarctica: Multiple sources of water, temporal sequence and relative importance in gully erosion and deposition processes. In Martian Gullies and Their Earth Analogues; Conway, S.J., Carrivick, J.L., Carling, P.A., De Haas, T., Harrison, T.N., Eds.; The Geological Society of London: London, UK, 2018. [Google Scholar]
  19. De Silva, S.L. Altiplano-Puna volcanic complex of the central Andes. Geology 1989, 17, 1102–1106. [Google Scholar] [CrossRef]
  20. Flahaut, J.; Martinot, M.; Bishop, J.L.; Davies, G.R.; Potts, N. Remote sensing and in situ mineralogic survey of the Chilean salars: An analog to Mars evaporate deposits? Icarus 2017, 282, 152–173. [Google Scholar] [CrossRef] [Green Version]
  21. Flahaut, J.; González-Maurel, O.; Godoy, B.; Martinot, M.; Guitreau, M. Rheology of the Andean domes as an analog for lunar silicic constructs. In Proceedings of the European Geoscience Union General Assembly, Online, 19–30 April 2021. [Google Scholar]
  22. Hartley, A.J.; Chong, G. Late Pliocene age for the Atacama Desert: Implications for the desertification of western South America. Geology 2002, 30, 43–46. [Google Scholar] [CrossRef]
  23. Placzek, C.; Quade, J.; Betancourt, J.L.; Patchett, P.J.; Rech, J.A.; Latorre, C.; Matmon, A.; Holmgren, C.; English, N.B. Climate in the dry central Andes over geologic, millennial, and interannual timescales. Ann. Mo. Bot. Gard. 2009, 96, 386–397. [Google Scholar] [CrossRef]
  24. Wörner, G.; Schildgen, T.F.; Reich, M. The Central Andes: Elements of an extreme land. Elements 2018, 14, 225–230. [Google Scholar] [CrossRef]
  25. González-Maurel, O.; Godoy, B.; Le Roux, P.; Rodríguez, I.; Marín, C.; Menzies, A.; Bertin, D.; Morata, D.; Vargas, M. Magmatic differentiation at La Poruña scoria cone, Central Andes, northern Chile: Evidence for assimilation during turbulent ascent processes, and genetic links with mafic eruptions at adjacent San Pedro volcano. Lithos 2019, 338, 28–140. [Google Scholar] [CrossRef]
  26. De Silva, S.L.; Self, S.; Francis, P.W.; Drake, R.E.; Ramirez, C.R. Effusive silicic volcanism in the Central Andes: The Chao dacite and other young lavas of the Altiplano-Puna Volcanic Complex. J. Geophys. Res. 1994, 99, 17805–17825. [Google Scholar] [CrossRef] [Green Version]
  27. Hubbard, B.E.; Crowley, J.K. Mineral mapping on the Chilean–Bolivian Altiplano using co-orbital ALI, ASTER and Hyperion imagery: Data dimensionality issues and solutions. Remote Sens. Environ. 2005, 99, 173–186. [Google Scholar] [CrossRef]
  28. Godoy, B.; Lazcano, J.; Rodríguez, I.; Martínez, P.; Parada, M.A.; Le Roux, P.; Wilke, H.-G.; Polanco, E. Geological evolution of Paniri volcano, Central Andes, northern Chile. J. S. Am. Earth Sci. 2018, 84, 184–200. [Google Scholar] [CrossRef]
  29. Godoy, B.; Taussi, M.; González-Maurel, O.; Renzulli, A.; Hernández-Prat, L.; Le Roux, P.; Morata, D.; Menzies, A. Linking the mafic volcanism with the magmatic stages during the last 1 Ma in the main volcanic arc of the Altiplano-Puna Volcanic Complex (Central Andes). J. S. Am. Earth Sci. 2019, 95, 102295. [Google Scholar] [CrossRef]
  30. González-Maurel, O.; Le Roux, P.; Godoy, B.; Troll, V.R.; Deegan, F.; Menzies, A. The great escape: Petrogenesis of low-silica volcanism of Pliocene to Quaternary age associated with the Altiplano-Puna Volcanic Complex of northern Chile (21°10′–22°50′S). Lithos 2019, 105162, 346–347. [Google Scholar] [CrossRef]
  31. Barthez, M.; Flahaut, J.; Ito, G.; Guitreau, M.; Pik, R. Near-infrared laboratory measurements of feldspathic rocks as a reference for hyperspectral Martian remote sensing data interpretation. In Proceedings of the Europlanet Science Congress, Online, 21 September–9 October 2020. [Google Scholar]
  32. Flahaut, J.; Barthez, M.; Payet, V.; Fueten, F.; Guitreau, M.; Ito, G.; Allemand, P.; Quantin-Nataf, C. Identification and characterization of new feldspar-bearing rocks in the walls of Valles Marineris, Mars. In Proceedings of the Eleventh Moscow Solar System Symposium, Online, 5–9 October 2020. [Google Scholar]
  33. Irons, J.R.; Dwyer, J.L.; Barsi, J.A. The next Landsat satellite: The Landsat Data Continuity Mission. Remote Sens. Environ. 2012, 122, 11–21. [Google Scholar] [CrossRef] [Green Version]
  34. Hilsenrath, E.; Ward, A. Earth science mission operations, Part I: Flight operations—Orchestrating NASA’s fleet of Earth observing satellites. Earth Obs. 2016, 28, 4–13. [Google Scholar]
  35. Gillespie, A.R.; Kahle, A.B.; Walker, R.E. Color enhancement of highly correlated images. I. Decorrelation and HSI contrast stretches. Remote Sens. Environ. 1986, 20, 209–235. [Google Scholar] [CrossRef]
  36. Rockwell, B.W.; Gnesda, W.R.; Hofstra, A.H. Improved Automated Identification and Mapping of Iron Sulfate Minerals, Other Mineral Groups, and Vegetation Using Landsat 8 Operational Land Imager Data, San Juan Mountains, Colorado, and Four Corners Region; U.S. Geological Survey Scientific Investigations Map 3466, 1 Sheet, Scale 1:325,000, 37-p. Pamphlet; US Geological Survey: Reston, VA, USA, 2021. [CrossRef]
  37. Rockwell, B.W. Automated Mapping of Mineral Groups and Green Vegetation from Landsat Thematic Mapper Imagery with an Example from the San Juan Mountains; Colorado. U.S. Geological Survey Scientific Investigations Map 3252, 25-p. Pamphlet, 1 Map Sheet, Scale 1:325,000; US Geological Survey: Reston, VA, USA, 2012. [CrossRef]
  38. Berk, A.; Conforti, P.; Kennett, R.; Perkins, T.; Hawes, F.; van den Bosch, J. MODTRAN6: A major upgrade of the MODTRAN radiative transfer code. In Proceedings of the SPIE 9088, Algorithms and Technologies for Multispectral, Hyperspectral, and Ultraspectral Imagery XX, 90880H, Baltimore, MA, USA, 13 June 2014. [Google Scholar]
  39. Yamaguchi, Y.; Kahle, A.B.; Tsu, H.; Kawakami, T.; Pniel, M. Overview of Advanced Spaceborne Thermal Emission and Reflection Radiometer (ASTER). IEEE Trans. Geosci. Remote Sens. 1998, 36, 1062–1071. [Google Scholar] [CrossRef] [Green Version]
  40. Hulley, G.C.; Hook, S.J.; Abbot, E.; Malakar, N.; Islam, T.; Abrams, M. The ASTER Global Emissivity Dataset (ASTER GED): Mapping Earth’s emissivity at 100 meter spatial scale. Geophys. Res. Lett. 2015, 42, 7966–7976. [Google Scholar] [CrossRef]
  41. Kruse, F.A.; Lefkoff, A.B. Knowledge-based geologic mapping with imaging spectrometers. Remote Sens. Rev. 1993, 8, 3–28. [Google Scholar] [CrossRef]
  42. Lyon, R.J.P. Evaluation of Infrared Spectrophotometry for Compositional Analysis of Lunar and Planetary Soils: Rough and Powdered Surfaces, Final Report, Part 2; NASA contract NASr-49(04); Stanford Research Institute: Menlo Park, CA, USA, 1964. [Google Scholar]
  43. Lyon, R.J.P. Analysis of rocks by spectral infrared emission (8–25 µm). Econ. Geol. 1965, 60, 715–736. [Google Scholar] [CrossRef]
  44. Vincent, R.K.; Thomson, F. Spectral compositional imaging of silicate rocks. J. Geophys. Res. 1972, 17, 2465–2473. [Google Scholar] [CrossRef]
  45. Hook, S.J.; Dmochowski, J.E.; Howard, K.A.; Rowan, L.C.; Karlstrom, K.E.; Stock, J.M. Mapping variations in weight percent silica measured from multispectral thermal infrared imagery—Examples from the Hiller Mountains, Nevada, USA and Tres Virgenes-La Reforma, Baja California Sur, Mexico. Remote Sens. Environ. 2005, 95, 273–289. [Google Scholar] [CrossRef]
  46. Pan, C.; Rogers, A.D.; Michalski, J.R. Thermal and near-infrared analyses of central peaks of Martian impact craters: Evidence for a heterogeneous Martian crust. J. Geophys. Res. Planets 2015, 120, 662–688. [Google Scholar] [CrossRef]
  47. Sabine, C.; Realmuto, V.J.; Taranik, J.V. Quantitative estimation of granitoid composition from thermal infrared multispectral scanner (TIMS) data, Desolation Wilderness, northern Sierra Nevada, California. J. Geophys. Res. 1994, 99, 4261–4271. [Google Scholar] [CrossRef]
  48. Smith, M.R.; Bandfield, J.L.; Cloutis, E.A.; Rice, M.S. Hydrated silica on Mars: Combined analysis with near-infrared and thermal-infrared spectroscopy. Icarus 2013, 223, 633–648. [Google Scholar] [CrossRef]
  49. Baldridge, A.M.; Hook, S.J.; Grove, C.I.; Rivera, G. The ASTER Spectral Library Version 2.0. Remote Sens. Environ. 2009, 113, 711–715. [Google Scholar] [CrossRef]
  50. Meerdink, S.K.; Hook, S.J.; Roberts, D.A.; Abbott, E.A. The ECOSTRESS spectral library version 1.0. Remote Sens. Environ. 2019, 230, 111196. [Google Scholar] [CrossRef]
  51. Payet, V.; Flahaut, J.; Ito, G.; Barthez, M.; Breton, S. Automated denoising for mineral identification on hyperspectral data. In Proceedings of the 11th Moscow International Symposium, Moscow, Russia, 5–9 October 2020; Available online: https://ms2020.cosmos.ru/docs/11M-S3-Abstract_book_full_version_04.pdf (accessed on 1 April 2021).
  52. Middleton, E.M.; Ungar, S.G.; Mandl, D.J.; Ong, L.; Frye, S.W.; Campbell, P.E.; Landis, D.R.; Young, J.P.; Pollack, N.H. The Earth Observing One (EO-1) satellite mission: Over a decade in space. IEEE J. Sel. Top. Appl. Earth Obs. Remote Sens. 2013, 6, 243–256. [Google Scholar] [CrossRef]
  53. Berk, A.; Bernstein, L.S.; Robertson, D.C. MODTRAN®: A Moderate Resolution Model for LOWTRAN 7; GL-TR-89-0122; Geophysics Laboratory: Hanscom Air Force Base, MA, USA, 1989. [Google Scholar]
  54. Berk, A.; Bernstein, L.S.; Anderson, G.P.; Acharya, P.K.; Robertson, J.H.; Chetwynd, J.H., Jr.; Adler-Golden, S.M. MODTRAN® cloud and multiple scattering upgrades with application to AVIRIS. Remote Sens. Environ. 1998, 65, 367–375. [Google Scholar] [CrossRef]
  55. Berk, A.; Acharya, P.K.; Bernstein, L.S.; Anderson, G.P.; Chetwynd, J.H., Jr.; Hoke, M.L. Reformulation of the MODTRAN® band model for finer spectral resolution. In Proceedings of the SPIE, Orlando, FL, USA, 27 March 2000; Volume 4049. [Google Scholar]
  56. Morfitt, R.; Barsi, J.; Levy, R.; Markham, B.; Micijevic, E.; Ong, L.; Scaramuzza, P.; Vanderwerff, K. Landsat-8 Operational Land Imager (OLI) radiometric performance on-orbit. Remote Sens. 2015, 7, 2208–2237. [Google Scholar] [CrossRef] [Green Version]
  57. Wolfe, J.D.; Black, S.R. Hyperspectral Analytics in ENVI Target Detection and Spectral Mapping Methods. 2018. Available online: http://www.spectroexpo.com/wp-content/uploads/2021/03/Hyperspectral_Whitepaper.pdf (accessed on 1 March 2021).
  58. Green, A.A.; Berman, M.; Switzer, R.; Craig, M.D. A transformation for ordering multispectral data in terms of image quality with implications for noise removal. IEEE Trans. Geosci. Remote Sens. 1988, 56, 65–74. [Google Scholar] [CrossRef] [Green Version]
  59. Boardman, J.W.; Kruse, F.A.; Green, R.O. Mapping target signatures via partial unmixing of AVIRIS data. In Summaries of the Fifth Annual JPL Airborne Geosciences Workshop. Jet Propuls. Lab. Spec. Publ. 1995, 95, 23–26. [Google Scholar]
  60. Kokaly, R.F.; Clark, R.N.; Swayze, G.A.; Livo, K.E.; Hoefen, T.M.; Pearson, N.C.; Wise, R.A.; Benzel, W.M.; Lowers, H.A.; Driscoll, R.L.; et al. USGS Spectral Library Version 7; U.S. Geological Survey Data Series 1035; US Geological Survey: Reston, VA, USA, 2017; p. 61.
  61. Kruse, F.A.; Lefkoff, A.B.; Boardman, J.W.; Heidebrecht, K.B.; Shapiro, A.T.; Barloon, P.J.; Goetz, A.F.H. The spectral image processing system (SIPS)—Interactive visualization and analysis of imaging spectrometer data. Remote Sens. Environ. 1993, 44, 145–163. [Google Scholar] [CrossRef]
  62. Carter, J.; Poulet, F. Ancient plutonic processes on Mars inferred from the detection of possible anorthositic terrains. Nat. Geosci. 2013, 6, 1008–1012. [Google Scholar] [CrossRef]
  63. Wray, J.J.; Hansen, S.T.; Dufek, J.; Swayze, G.A.; Murchie, S.L.; Seelos, F.P.; Skok, J.R.; Irwin, R.P., III; Ghiorso, M.S. Prolonged magmatic activity on Mars inferred from the detection of felsic rocks. Nat. Geosci. 2013, 6, 1013–1017. [Google Scholar] [CrossRef]
  64. Rogers, A.D.; Nekvasil, H. Feldspathic rocks on Mars: Compositional constraints from infrared spectroscopy and possible formation mechanisms. Geophys. Res. Lett. 2015, 42, 2619–2626. [Google Scholar] [CrossRef] [Green Version]
  65. Rogers, A.D.; Farrand, W.H. Spectral evidence for alkaline rocks and compositional diversity among feldspathic light-toned terrains on Mars. Icarus 2022, 376, 114883. [Google Scholar] [CrossRef]
  66. Adams, J.B.; Goullaud, L.H. Plagioclase feldspars: Visible and near infrared diffuse reflectance as applied to remote sensing. In Proceedings of the 9th Lunar and Planetary Science Conference, 2901–2909, Houston, TX, USA, 13–17 March 1978. [Google Scholar]
  67. Cheek, L.C.; Pieters, C.M. Reflectance spectroscopy of plagioclase-dominated mineral mixtures: Implications for characterizing lunar anorthosites remotely. Am. Mineral. 2014, 99, 1871–1892. [Google Scholar] [CrossRef]
  68. Viviano-Beck, C.E.; Seelos, F.P.; Murchie, S.L.; Kahn, E.G.; Seelos, K.D.; Taylor, H.W.; Taylor, K.; Ehlmann, B.L.; Wiseman, S.M.; Mustard, J.F.; et al. Revised CRISM spectral parameters and summary products based on the currently detected mineral diversity on Mars. J. Geophys. Res. Planets 2014, 119, 1403–1431. [Google Scholar] [CrossRef] [Green Version]
  69. Servicio Nacional de Geología y Minería. Mapa Geológico de Chile: Versión Digital; Publicación Geológica Digital, No. 7, Versión 1.0, 2004 [CD-ROM]; Servicio Nacional de Geología y Minería: Santiago, Chile, 2004. [Google Scholar]
  70. Thompson, A.J.B.; Thompson, J.F.H. Atlas of Alteration a Field and Petrographic Guide to Hydrothermal Alteration Minerals; Geological Association of Canada: St. John’s, NL, Canada, 1996. [Google Scholar]
  71. Godoy, B.; Wörner, G.; Kojima, S.; Aguilera, F.; Simon, K.; Hartmann, G. Low-pressure evolution of arc magmas in thickened crust: The San Pedro–Linzor volcanic chain, Central Andes, Northern Chile. J. South Am. Earth Sci. 2014, 52, 24–42. [Google Scholar] [CrossRef]
  72. Schmitt, A.K.; de Silva, S.L.; Trumbull, R.B.; Emmermann, R. Magma evolution in the Purico ignimbrite complex, northern Chile: Evidence for zoning of a dacitic magma by injection of rhyolitic melts following mafic recharge. Contrib. Mineral. Petrol. 2001, 140, 680–700. [Google Scholar] [CrossRef]
  73. Hulley, G.C.; Hughes, C.G.; Hook, S.J. Quantifying uncertainties in land surface temperature and emissivity retrievals from ASTER and MODIS thermal infrared data. J. Geophys. Res. 2012, 117, D23113. [Google Scholar] [CrossRef] [Green Version]
  74. Glotch, T.D.; Lucey, P.G.; Bandfield, J.L.; Greenhagen, B.T.; Thomas, I.R.; Elphic, R.C.; Bowles, N.; Wyatt, M.B.; Allen, C.C.; Donaldson Hanna, K.; et al. Highly silicic compositions on the Moon. Science 2010, 329, 1510–1513. [Google Scholar] [CrossRef] [Green Version]
  75. Marín, C.; Rodríguez, I.; Godoy, B.; González-Maurel, O.; Le Roux, P.; Medina, E.; Bertín, D. Eruptive history of La Poruña scoria cone, Central Andes, Northern Chile. Bull. Volcanol. 2020, 82, 74. [Google Scholar] [CrossRef]
  76. Carter, J.; Poulet, F.; Bibring, J.-P.; Mangold, N.; Murchie, S. Hydrous minerals on Mars as seen by the CRISM and OMEGA imaging spectrometers: Updated global view. J. Geophys. Res. Planets 2013, 118, 831–858. [Google Scholar] [CrossRef]
  77. Murchie, S.; Mustard, J.F.; Ehlmann, B.L.; Milliken, R.E.; Bishop, J.L.; McKeown, N.K.; Noe Dobrea, E.Z.; Seelos, F.P.; Buczkowski, D.L.; Wiseman, S.M.; et al. A synthesis of Martian aqueous mineralogy after 1 Mars year of observations from the Mars Reconnaissance Orbiter. J. Geophys. Res. Planets 2009, 114, E00D06. [Google Scholar] [CrossRef]
  78. Christensen, P.R.; Jakosky, B.M.; Kieffer, H.H.; Malin, M.C.; McSween, H.Y., Jr.; Nealson, K.; Mehall, G.L.; Silverman, S.H.; Ferry, S.; Caplinger, M.; et al. The Thermal Emission Imaging System THEMIS for the Mars 2001 Odyssey mission. Space Sci. Rev. 2004, 110, 85–130. [Google Scholar] [CrossRef]
  79. Murchie, S.; Arvidson, R.; Bedini, P.; Beisser, K.; Bibring, J.-P.; Bishop, J.; Boldt, J.; Cavender, P.; Choo, T.; Clancy, R.T.; et al. Compact Reconnaissance Imaging Spectrometer for Mars (CRISM) on Mars Reconnaissance Orbiter (MRO). J. Geophys. Res. 2007, 112, E05S03. [Google Scholar] [CrossRef]
  80. McEwen, A.S.; Robinson, M.S. Mapping of the Moon by Clementine. Adv. Space Res. 1997, 19, 1523–1533. [Google Scholar] [CrossRef]
  81. Ohtake, M.; Haruyama, J.; Matsunaga, T.; Yokota, Y.; Morota, T.; Honda, C.; LISM Team. Performance and scientific objectives of the SELENE (KAGUYA) Multiband Imager. Earth Planets Space 2008, 60, 257–264. [Google Scholar] [CrossRef] [Green Version]
  82. Green, R.O.; Pieters, C.; Mouroulis, P.; Eastwood, M.; Boardman, J.; Glavich, T.; Isaacson, P. The Moon Mineralogy Mapper (M3) imaging spectrometer for lunar science: Instrument description, calibration, on-orbit measurements, science data calibration and on-orbit validation. J. Geophys. Res. 2011, 116, E00G19. [Google Scholar] [CrossRef] [Green Version]
  83. Paige, D.A.; Foote, M.C.; Greenhagen, B.T.; Schofield, J.T.; Calcutt, S.; Vasavada, A.R.; Preston, D.J.; Taylor, F.W.; Allen, C.C.; Snook, K.J.; et al. The Lunar Reconnaissance Orbiter Diviner Lunar Radiometer Experiment. Space Sci. Rev. 2010, 150, 125–160. [Google Scholar] [CrossRef] [Green Version]
  84. Ehlmann, B.L.; Klima, R.I.; Bennett, C.L.; Blaney, D.; Bowles, N.; Calcutt, S.; Dickson, J.; Donaldson Hanna, K.; Edwards, C.S.; Green, R.; et al. Lunar Trailblazer: A pioneering smallsat for lunar water and lunar geology. In Proceedings of the 52nd Lunar and Planetary Science Conference, 2548, Virtual, 15–19 March 2021. [Google Scholar]
  85. Pieters, C.M.; Noble, S.K. Space weathering on airless bodies. J. Geophys. Res. Planets 2016, 121, 1865–1884. [Google Scholar] [CrossRef]
  86. Henderson, B.G.; Jakosky, B.M. Near-surface thermal gradients and their effects on mid-infrared emission spectra of planetary surfaces. J. Geophys. Res. 1994, 99, 19063–19073. [Google Scholar] [CrossRef]
  87. Logan, L.M.; Hunt, G.R. Emission spectra of particulate silicates under simulated lunar conditions. J. Geophys. Res. 1970, 75, 6539–6548. [Google Scholar] [CrossRef]
  88. Arnold, J.A.; Glotch, T.D.; Lucey, P.G.; Song, E.; Thomas, I.R.; Bowles, N.E.; Greenhagen, B.T. Constraints on olivine-rich rock types on the Moon as observed by Diviner and M3: Implications for the formation of the lunar crust. J. Geophys. Res. Planets 2016, 121, 1342–1361. [Google Scholar] [CrossRef]
  89. Greenhagen, B.T.; Lucey, P.G.; Wyatt, M.B.; Glotch, T.D.; Allen, C.C.; Arnold, J.A.; Bandfield, J.L.; Bowles, N.E.; Donaldson Hanna, K.L.; Hayne, P.O.; et al. Global silicate mineralogy of the Moon from the Diviner Lunar Radiometer. Science 2010, 329, 1507–1509. [Google Scholar] [CrossRef] [Green Version]
  90. Godoy, B. Evolución Petrológica de la Cadena Volcánica San Pedro-Linzor (21°30′S–22°10′S), Norte de Chile, y Su Relación con la Geodinámica Andina. Ph.D. Thesis, Universidad Católica del Norte, Antofagasta, Chile, 2014. [Google Scholar]
  91. Godoy, B.; Wörner, G.; Le Roux, P.; de Silva, S. Sr- and Nd- isotope variations along the Pleistocene San Pedro—Linzor volcanic chain, N. Chile: Tracking the influence of the upper crustal Altiplano-Puna Magma Body. J. Volcanol. Geotherm. Res. 2017, 341, 172–186. [Google Scholar] [CrossRef]
  92. Francis, P.W.; Roobol, M.J.; Walker, G.P.L.; Cobbold, P.R.; Coward, M. The San Pedro and San Pablo volcanoes of northern Chile and their hot avalanche deposits. Geol. Rundsch. 1974, 63, 357–388. [Google Scholar] [CrossRef]
  93. Freymuth, H.; Brandmeier, M.; Wörner, G. The origin and crust/mantle mass balance of Central Andean ignimbrite magmatism constrained by oxygen and strontium isotopes and erupted volumes. Contrib. Mineral. Petrol. 2015, 169, 58. [Google Scholar] [CrossRef]
  94. Mamani, M.; Tassara, A.; Wörner, G. Composition and structural control of crustal domains in the Central Andes. Geochem. Geophys. Geosyst. 2008, 9. [Google Scholar] [CrossRef]
  95. Rogers, G.; Hawkesworth, C.J. A geochemical traverse across the North Chilean Andes: Evidence for crust generation from the mantle wedge. Earth Planet. Sci. Lett. 1989, 91, 271–285. [Google Scholar] [CrossRef]
Figure 2. (a) Landsat index 1 “ferric iron 1 redness”. (b) Landsat index 2 “ferric iron 2”. (c) Landsat index 3 “ferrous and coarse ferric iron”. (d) Landsat index 4 “clay, sulfate, and mica”. (e) Landsat index 5 “iron sulfate”. (f) Estimated silica percentage from ASTER imagery. Three regions selected in this study are indicated with rectangles. For Landsat index maps (ae), pixels with negative values were masked. For ASTER silica percentage map (f), pixels corresponding to salars were masked (Section 2.2).
Remotesensing 14 02081 g002
Figure 3. Maps of Cerro Carcanal and vicinity (21°57′36″S, 68°25′48″W to 22°7′48″S, 68°17′24″W). (a) Landsat 8 OLI ferric iron 1 “redness” band ratio index. (b) Landsat 8 OLI ferric iron 2 band ratio index. (c) Landsat 8 OLI ferrous/coarse-ferric iron band ratio index. (d) Landsat 8 OLI clay-sulfate-mica band ratio index. (e) Landsat 8 OLI iron-sulfate band ratio index. (f) EO-1 Hyperion SAM classification result. “Alteration” and “High Alteration” groups are based on montmorillonite and alunite/kaolinite minerals, respectively. “High-Iron-Bearing” group is based on high hematite spectral signature. (g) Estimated silica percentage from ASTER imagery.
Remotesensing 14 02081 g003
Figure 4. Hyperion spectra of alunite, kaolinite, montmorillonite, and hematite found at Cerro Carcanal and vicinity. The identification of minerals is the overall result of SAM and SFF methods in ENVI Spectral Analyst tool. The entire 0.48–2.5 µm wavelength range was used for hematite spectrum identification, and both 0.48–2.5 and 2.0–2.5 µm wavelength ranges were used for alunite/kaolinite/montmorillonite spectrum identification.
Remotesensing 14 02081 g004
Figure 5. Maps of the region surrounding ALMA and Toconao Village (22°53′0″S, 28°0′0″W to 23°18′0″S, 67°39′0″W). (a) Landsat 8 OLI ferric iron 1 “redness” band ratio index. (b) Landsat 8 OLI ferric iron 2 band ratio index. (c) Landsat 8 OLI ferrous/coarse-ferric iron band ratio index. (d) Landsat 8 OLI clay-sulfate-mica band ratio index. (e) Landsat 8 OLI iron-sulfate band ratio index. (f) EO-1 Hyperion SAM classification result. “Alteration” and “High Alteration” groups are based on montmorillonite and alunite/kaolinite minerals, respectively. “Iron-Bearing” and “High-Iron-Bearing” groups are based on moderate hematite and high hematite/hornblende spectral signatures, respectively. (g) EO-1 Hyperion feldspar band depth index. (h) Estimated silica percentage from ASTER imagery.
Remotesensing 14 02081 g005
Figure 6. Maps of the region near Lake Tuyajto and Salar de Talar (67°47′60″S, 23°48′36″W to 67°26′24″S, 24°13′12″W). (a) Landsat 8 OLI ferric iron 1 “redness” band ratio index. (b) Landsat 8 OLI ferric iron 2 band ratio index. (c) Landsat 8 OLI ferrous/coarse-ferric iron band ratio index. (d) Landsat 8 OLI clay-sulfate-mica band ratio index. (e) Landsat 8 OLI iron-sulfate band ratio index. (f) EO-1 Hyperion SAM classification result. “Alteration” and “High Alteration” groups are based on montmorillonite and alunite/kaolinite minerals, respectively. “Iron-Bearing” and “High-Iron-Bearing” groups are based on moderate hematite and high hematite/hornblende spectral signatures, respectively. (g) Estimated silica percentage from ASTER imagery.
Remotesensing 14 02081 g006
Figure 7. (a) Comparison of remote sensing spectra of El Rojo III location to a spectrum acquired in the laboratory of El Rojo III red scoria sample. (b) Image of the sample used for spectral measurement. (c) The view of El Rojo III scoria cone in the field (22°0′5″S, 68°18′46″W). Minor amounts of white minerals in (c) are alteration minerals, which contributed to the discrepancy of spectra in (a), in which the sample lacks this white mineral.
Remotesensing 14 02081 g007
Figure 8. Absolute differences in silica content between ASTER and sample measurements as a function of silica content of the samples. Group 1 and group 2 from k-means clustering are indicated in red and blue boundaries, respectively. Center points of each group are shown in red circle and blue triangle for group 1 and group 2, respectively.
Remotesensing 14 02081 g008
Figure 9. (a) Comparison of an EO-1 Hyperion spectrum to a spectrum acquired in the laboratory of feldspar-bearing rock from the Chanka dome (21°45′0″S, 68°18′58″W). (b) Image of the sample used for the measurement. White grains are feldspar. (c) Microscope image of a thin section of the sample. Feldspar grains are labeled. (d) Microscope image of a thin section of the sample in cross-polarized light. Twinning typical of plagioclase feldspars can be observed on feldspar grains.
Remotesensing 14 02081 g009
Table 1. Landsat 8 OLI band ratios from Rockwell et al. [36] used to characterize iron-bearing and alteration minerals.
Index NumberIndex NameFormula 1
1Ferric iron 1 “redness”4/2
2Ferric iron 24/2 × (4 + 6)/5
3Ferrous iron, coarse-grained ferric iron, fire ash 2(3 + 6)/(4 + 5)
4Clay, sulfate, mica, marble 26/7 − 5/4
5Iron sulfate2/1 − 5/4
1 Numbers correspond to Landsat 8 OLI band numbers (see Figure 1). 2 Fire ash and marble are rarely found at the field site and, thus, omitted from interpretation.
Table 2. Summary of the differences in silica content derived from ASTER GED using Equation (3) and measured in geochemical laboratories. Bold numbers highlight the percentage of best estimations.
SiO2 Abs. Diff.0–33–66–99–12+12
% of samples402818103
no. samples at CRPG53212
Publisher’s Note: MDPI stays neutral with regard to jurisdictional claims in published maps and institutional affiliations.

