
Two-Stepwise Hierarchical Adaptive Threshold Method for Automatic Rapeseed Mapping over Jiangsu Using Harmonized Landsat/Sentinel-2

 , ,
, ,
Abstract
:
1. Introduction
2. Materials
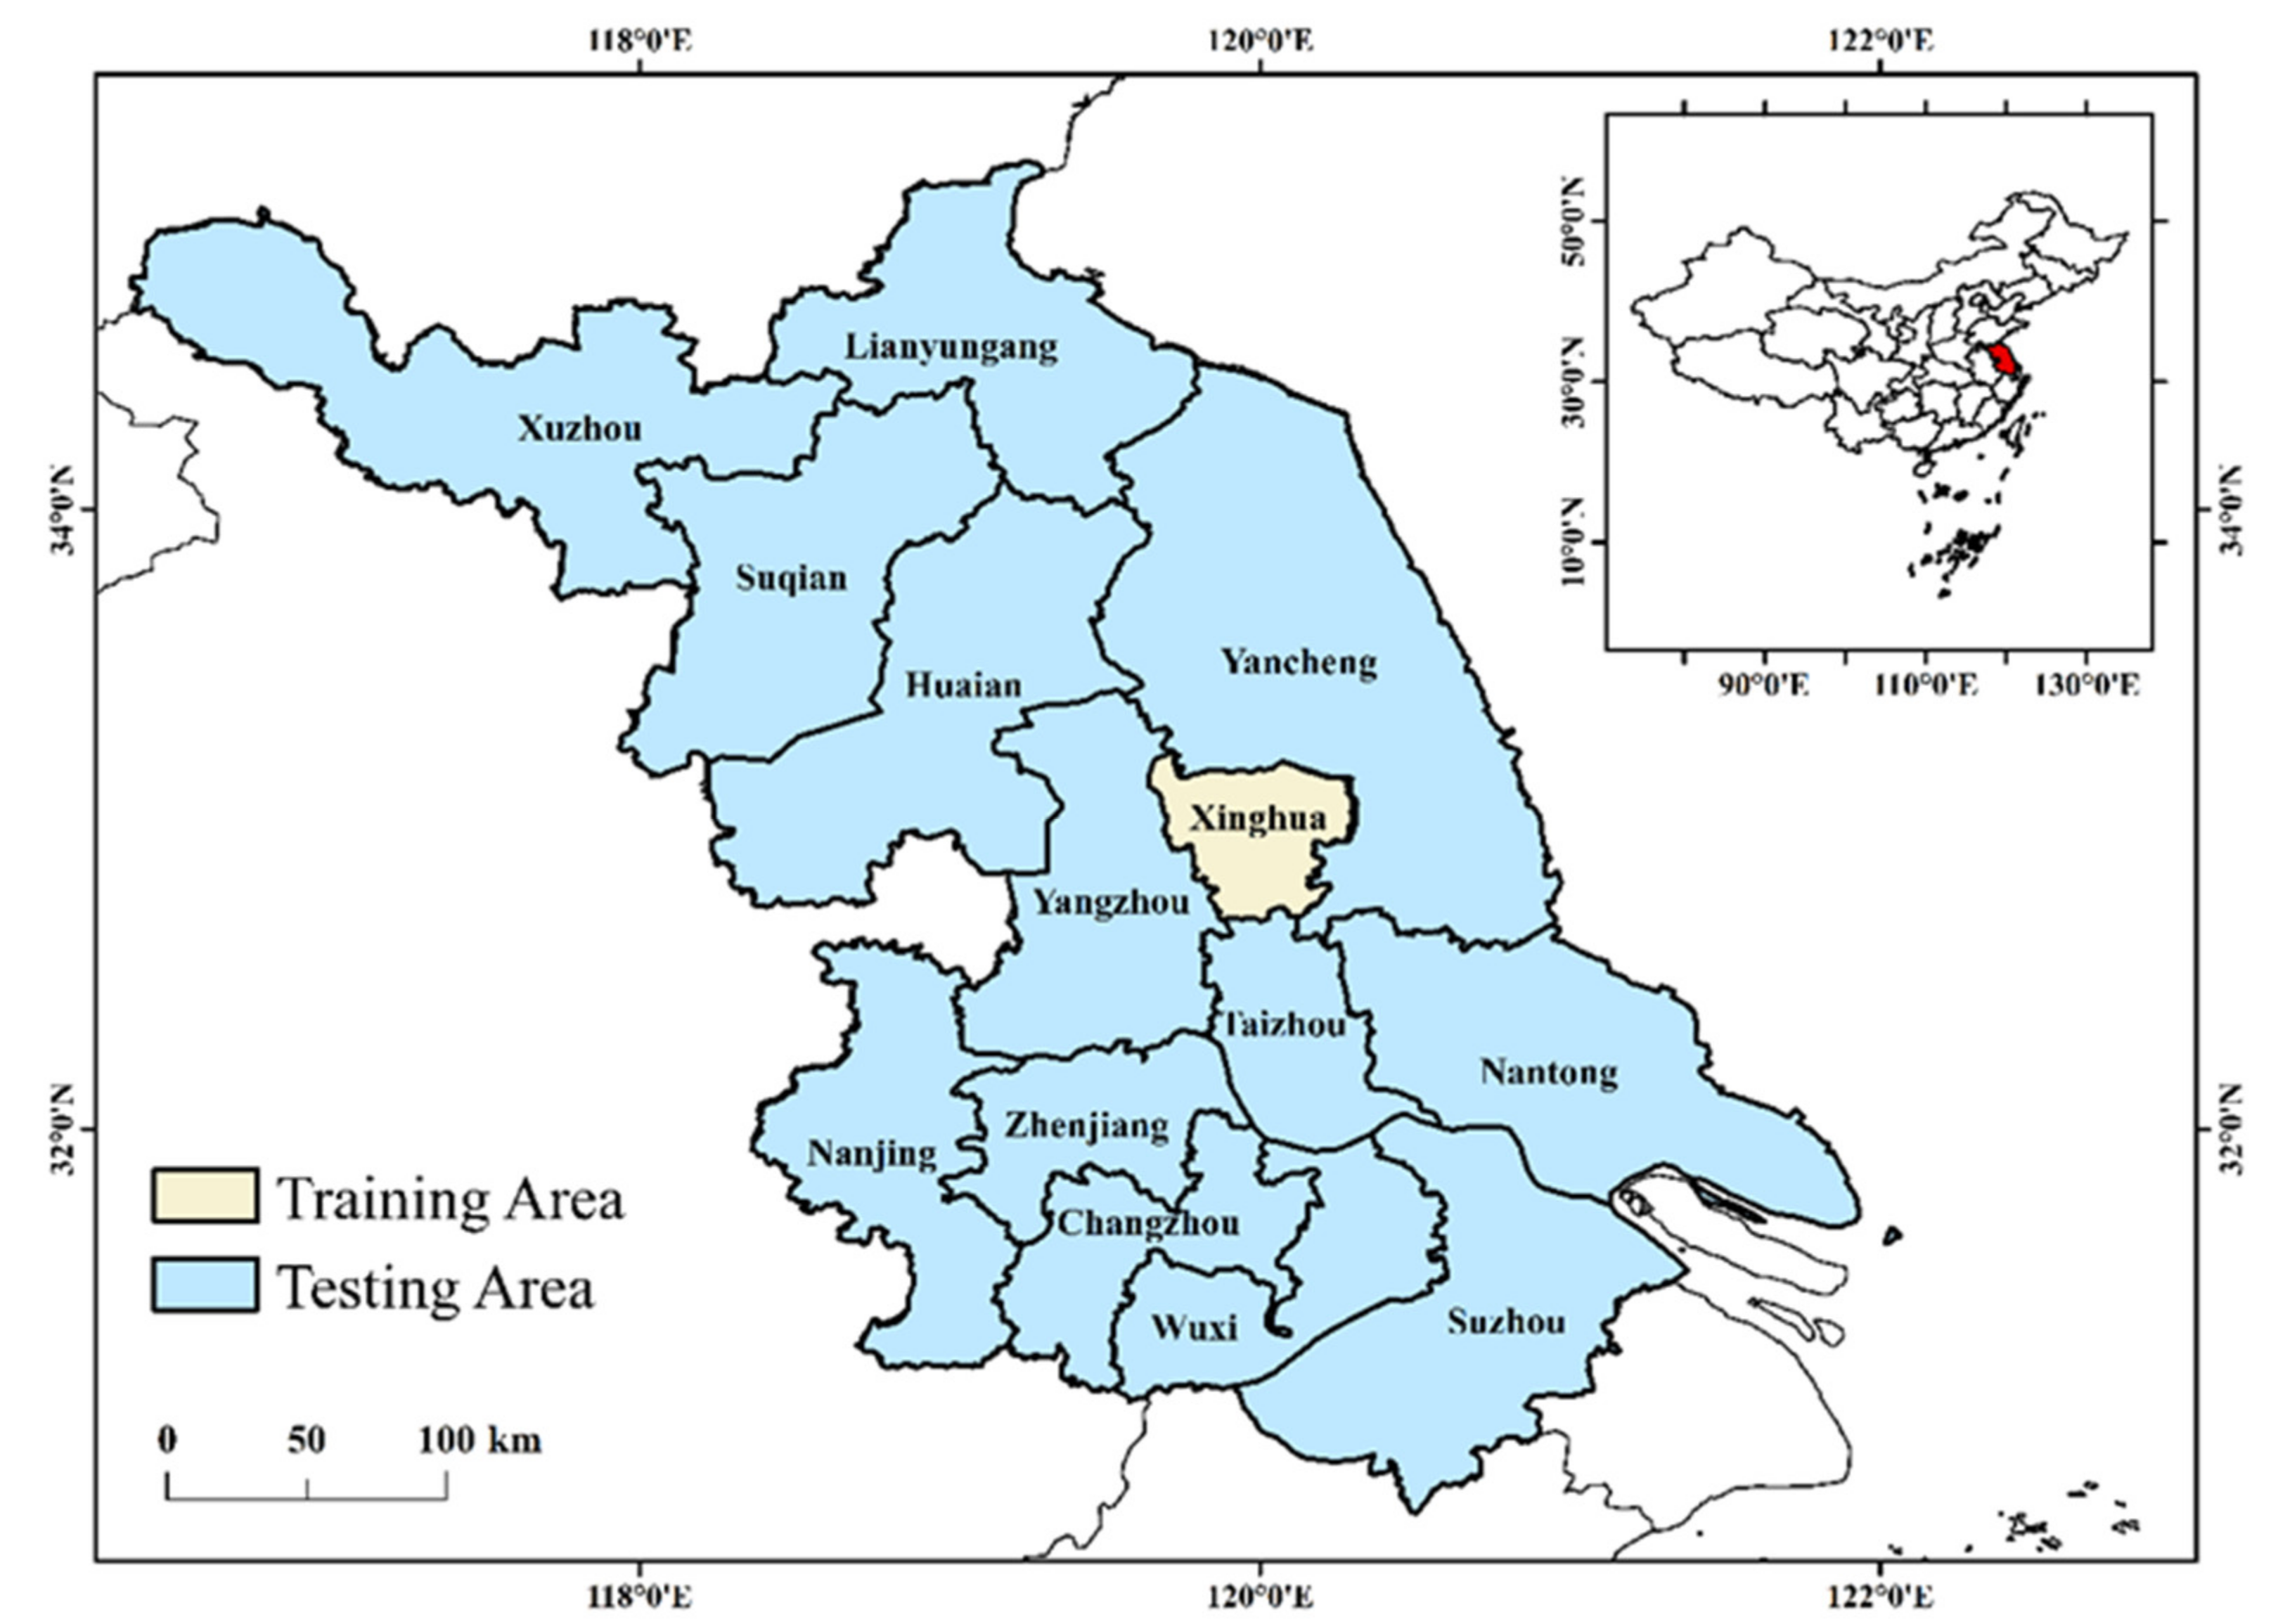
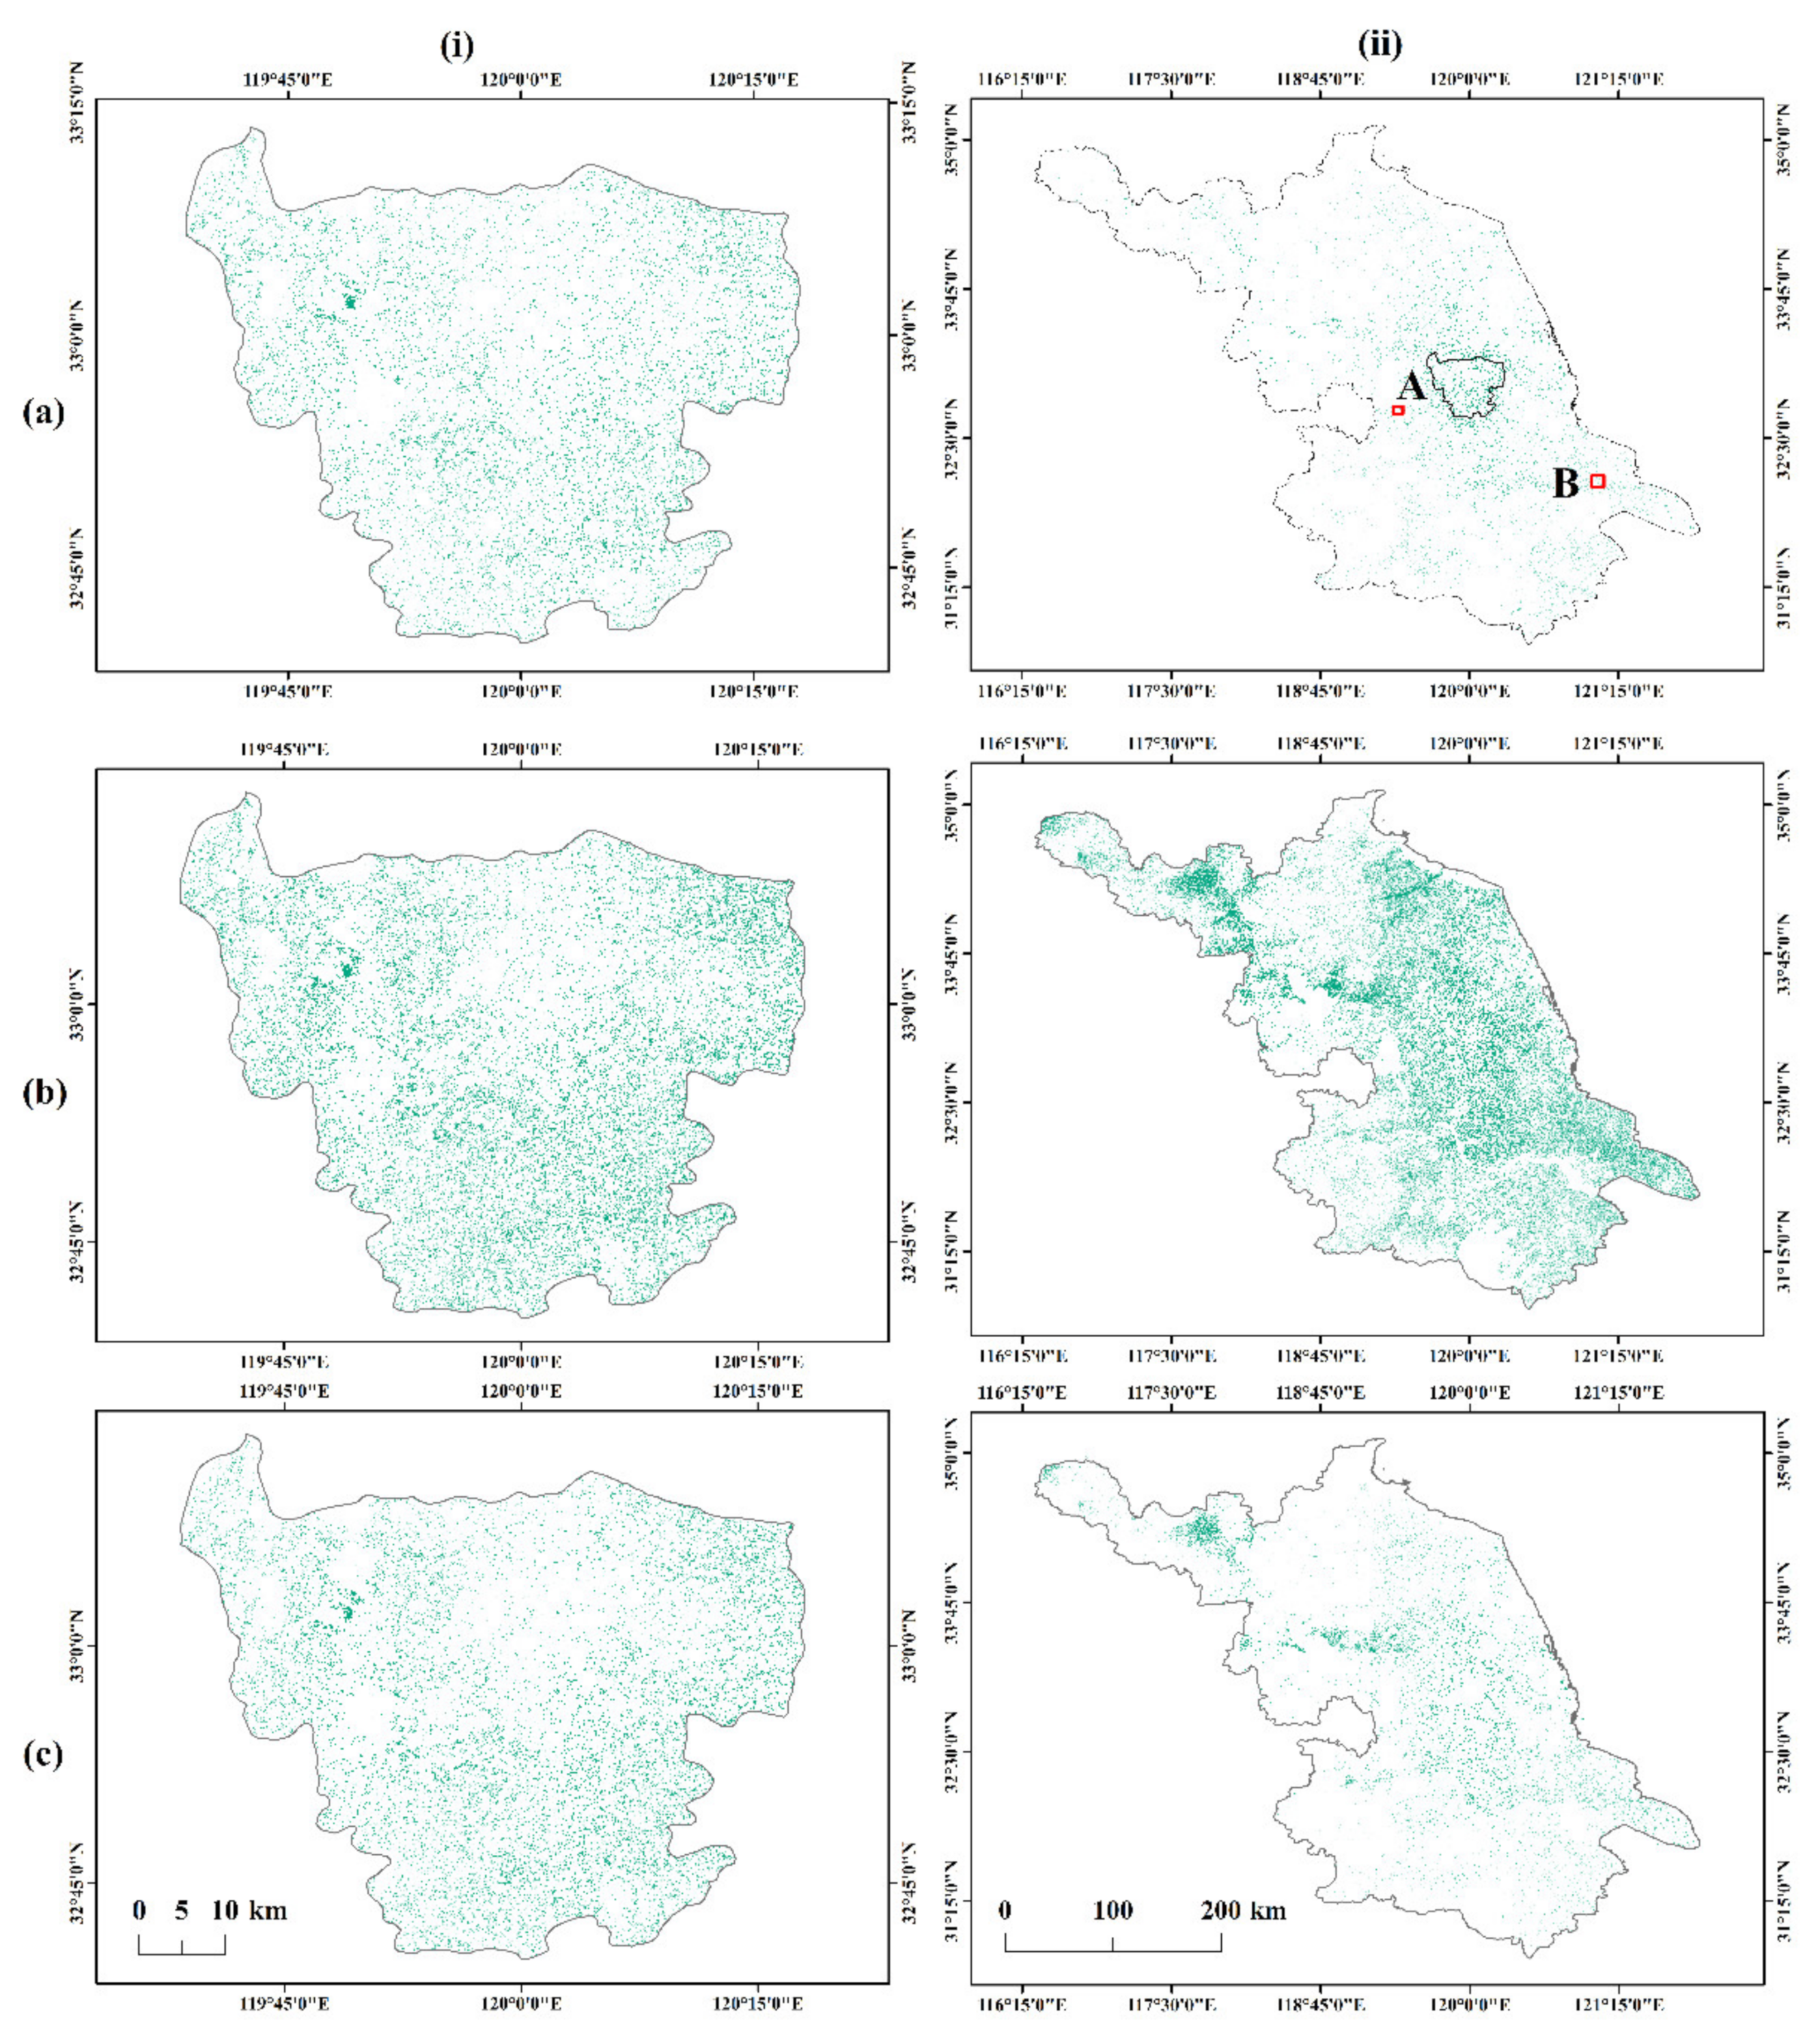
2.1. Study Area
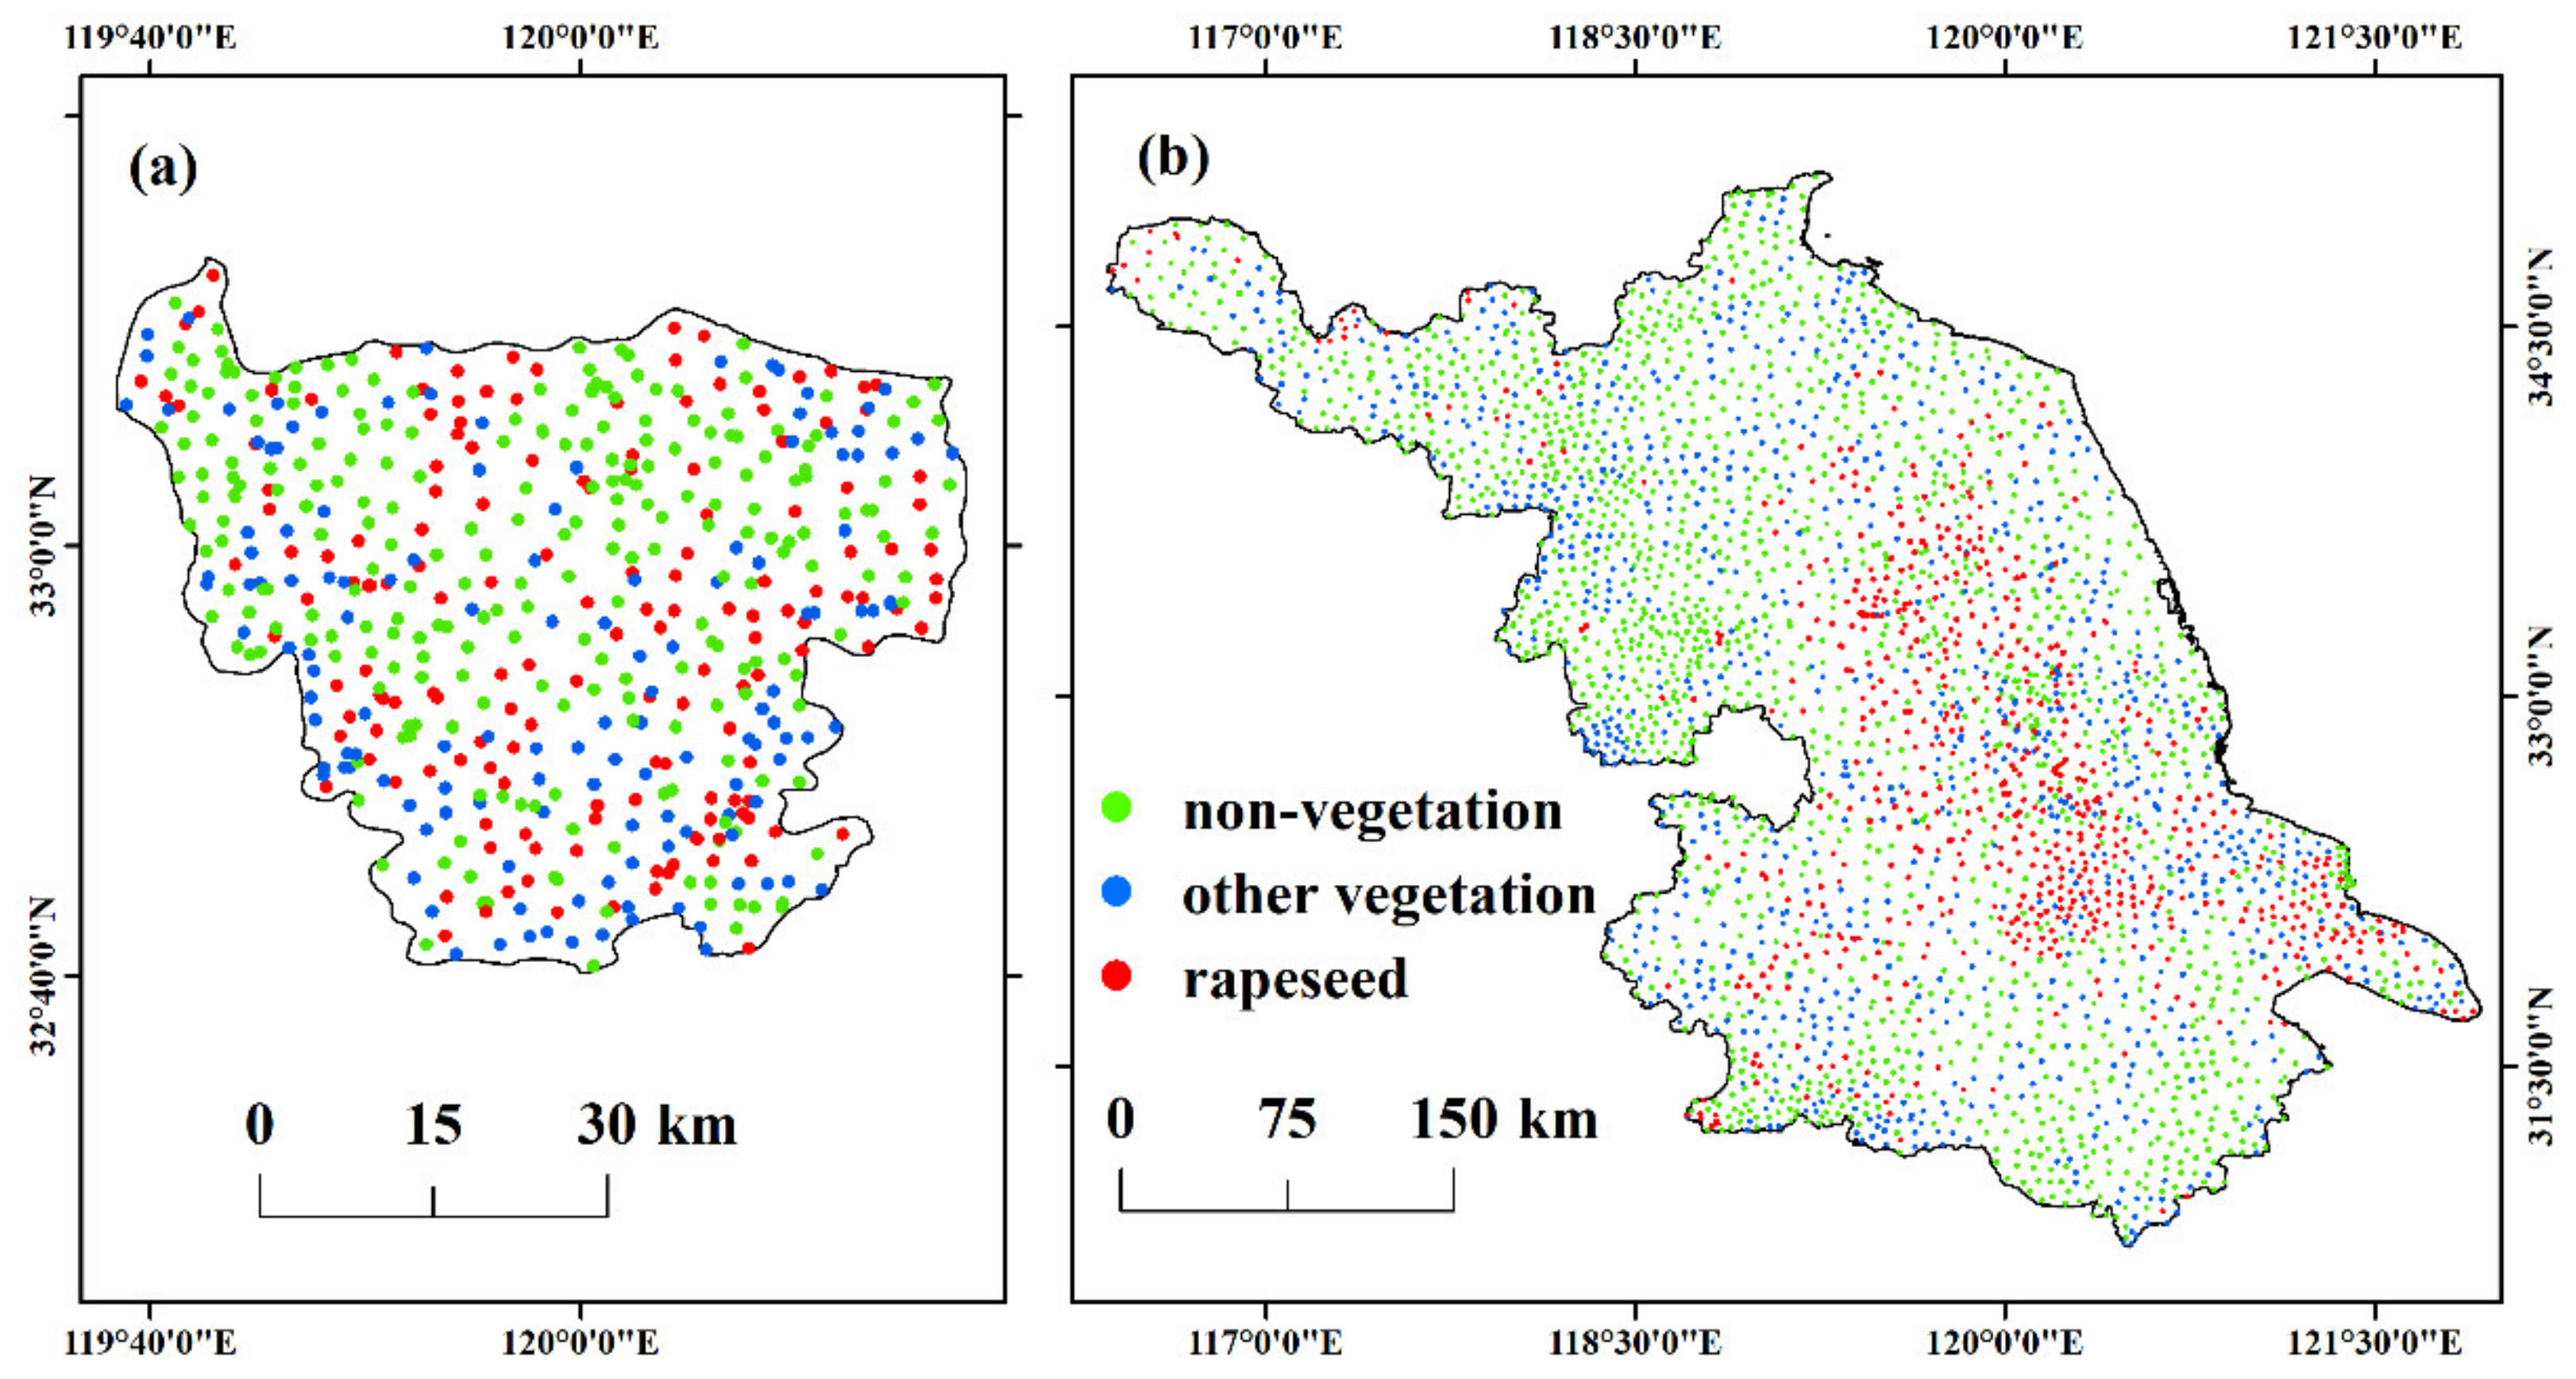
2.2. Sample Data Acquisition
2.3. Remote Sensing Data
2.4. Data Preprocessing
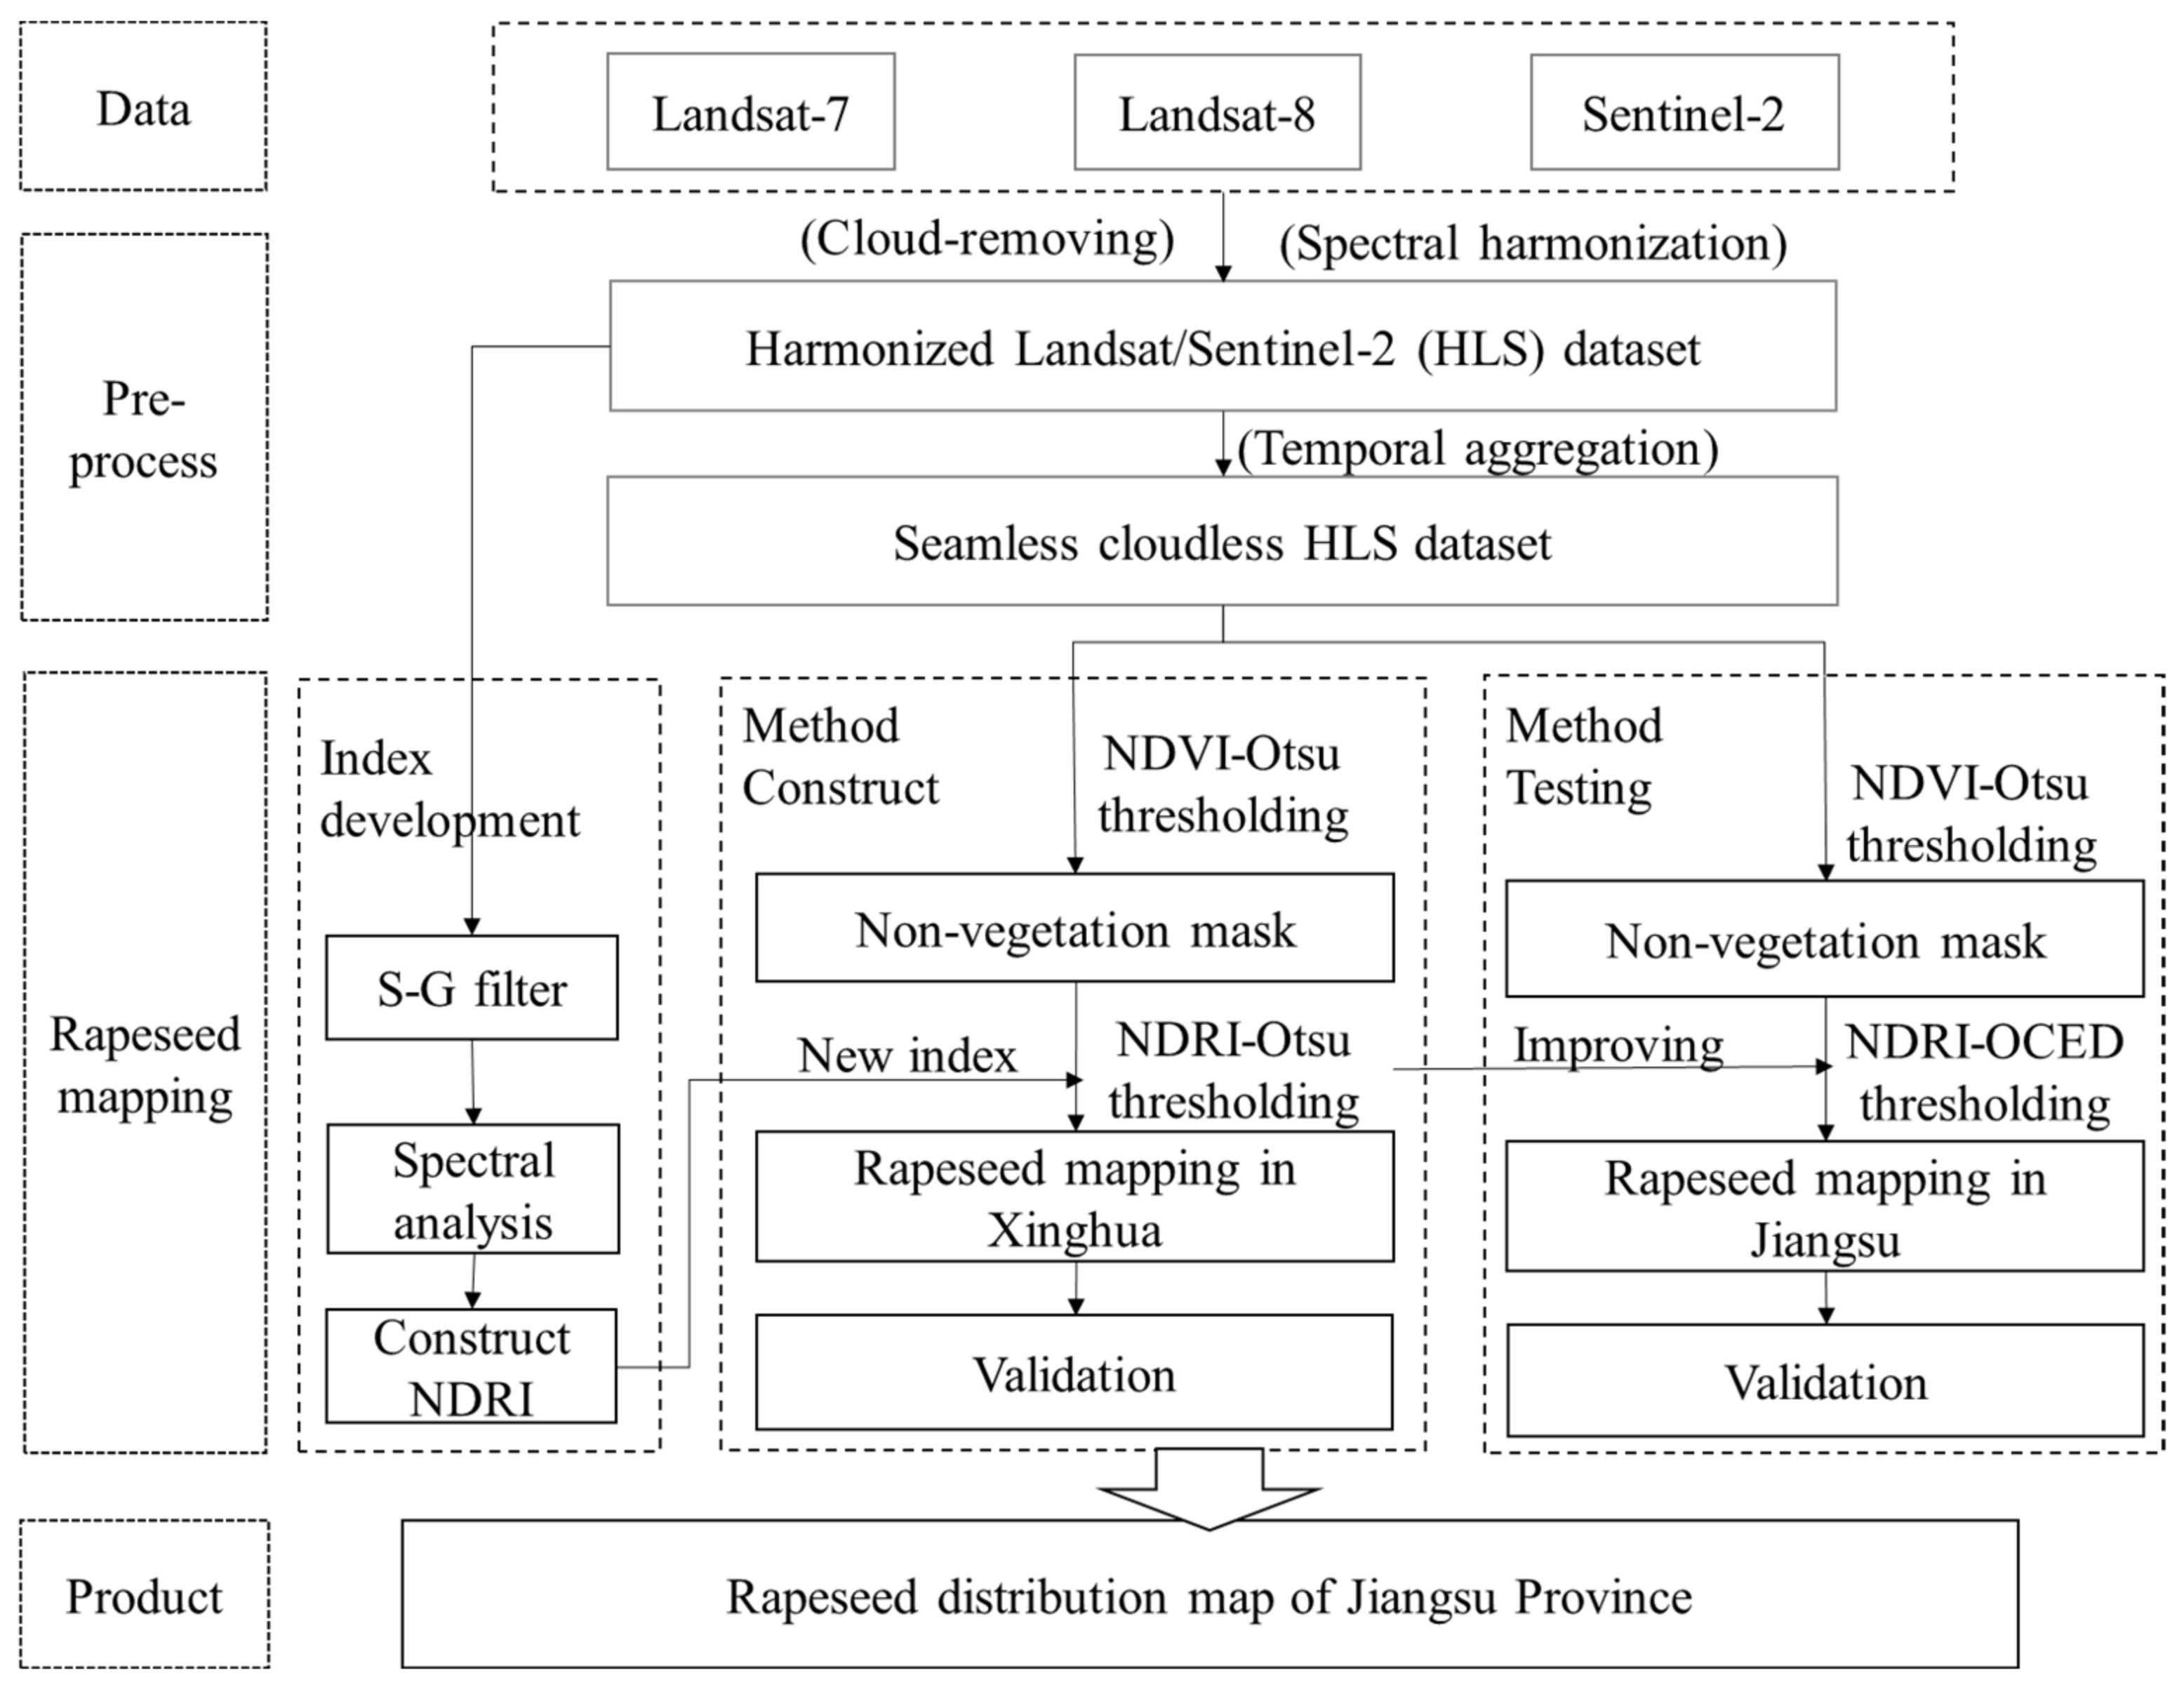
3. Two-Stepwise Hierarchical Adaptive-Threshold-Based Rapeseed Mapping Model
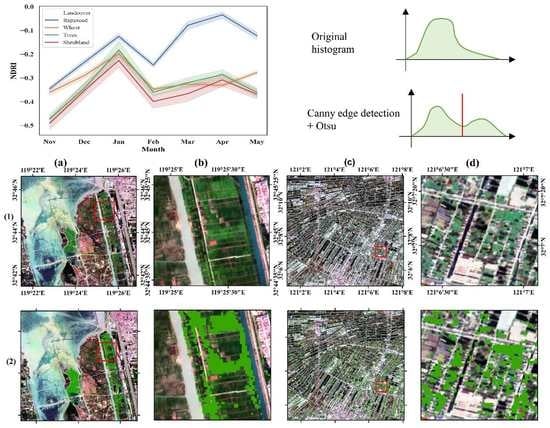
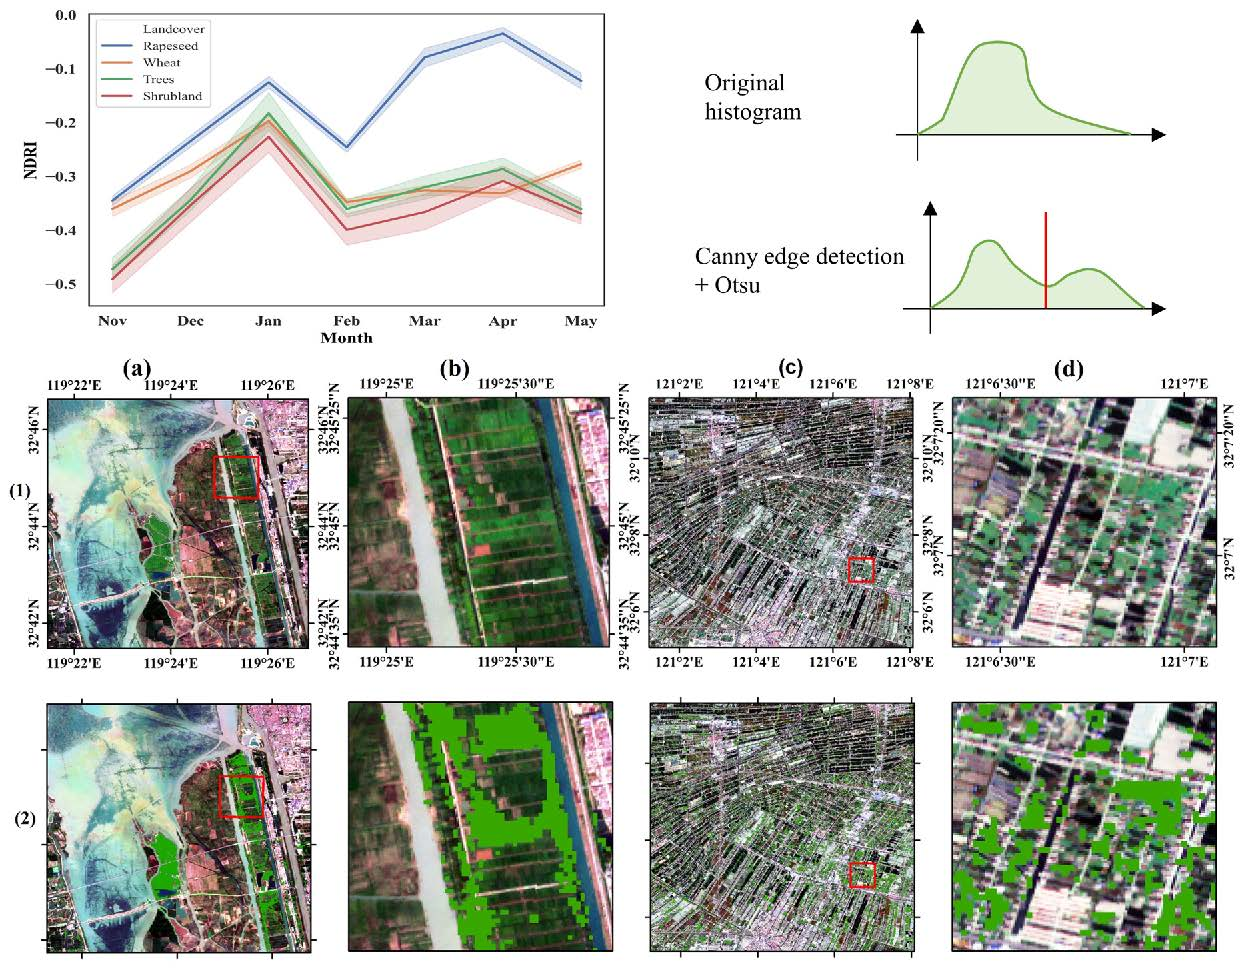
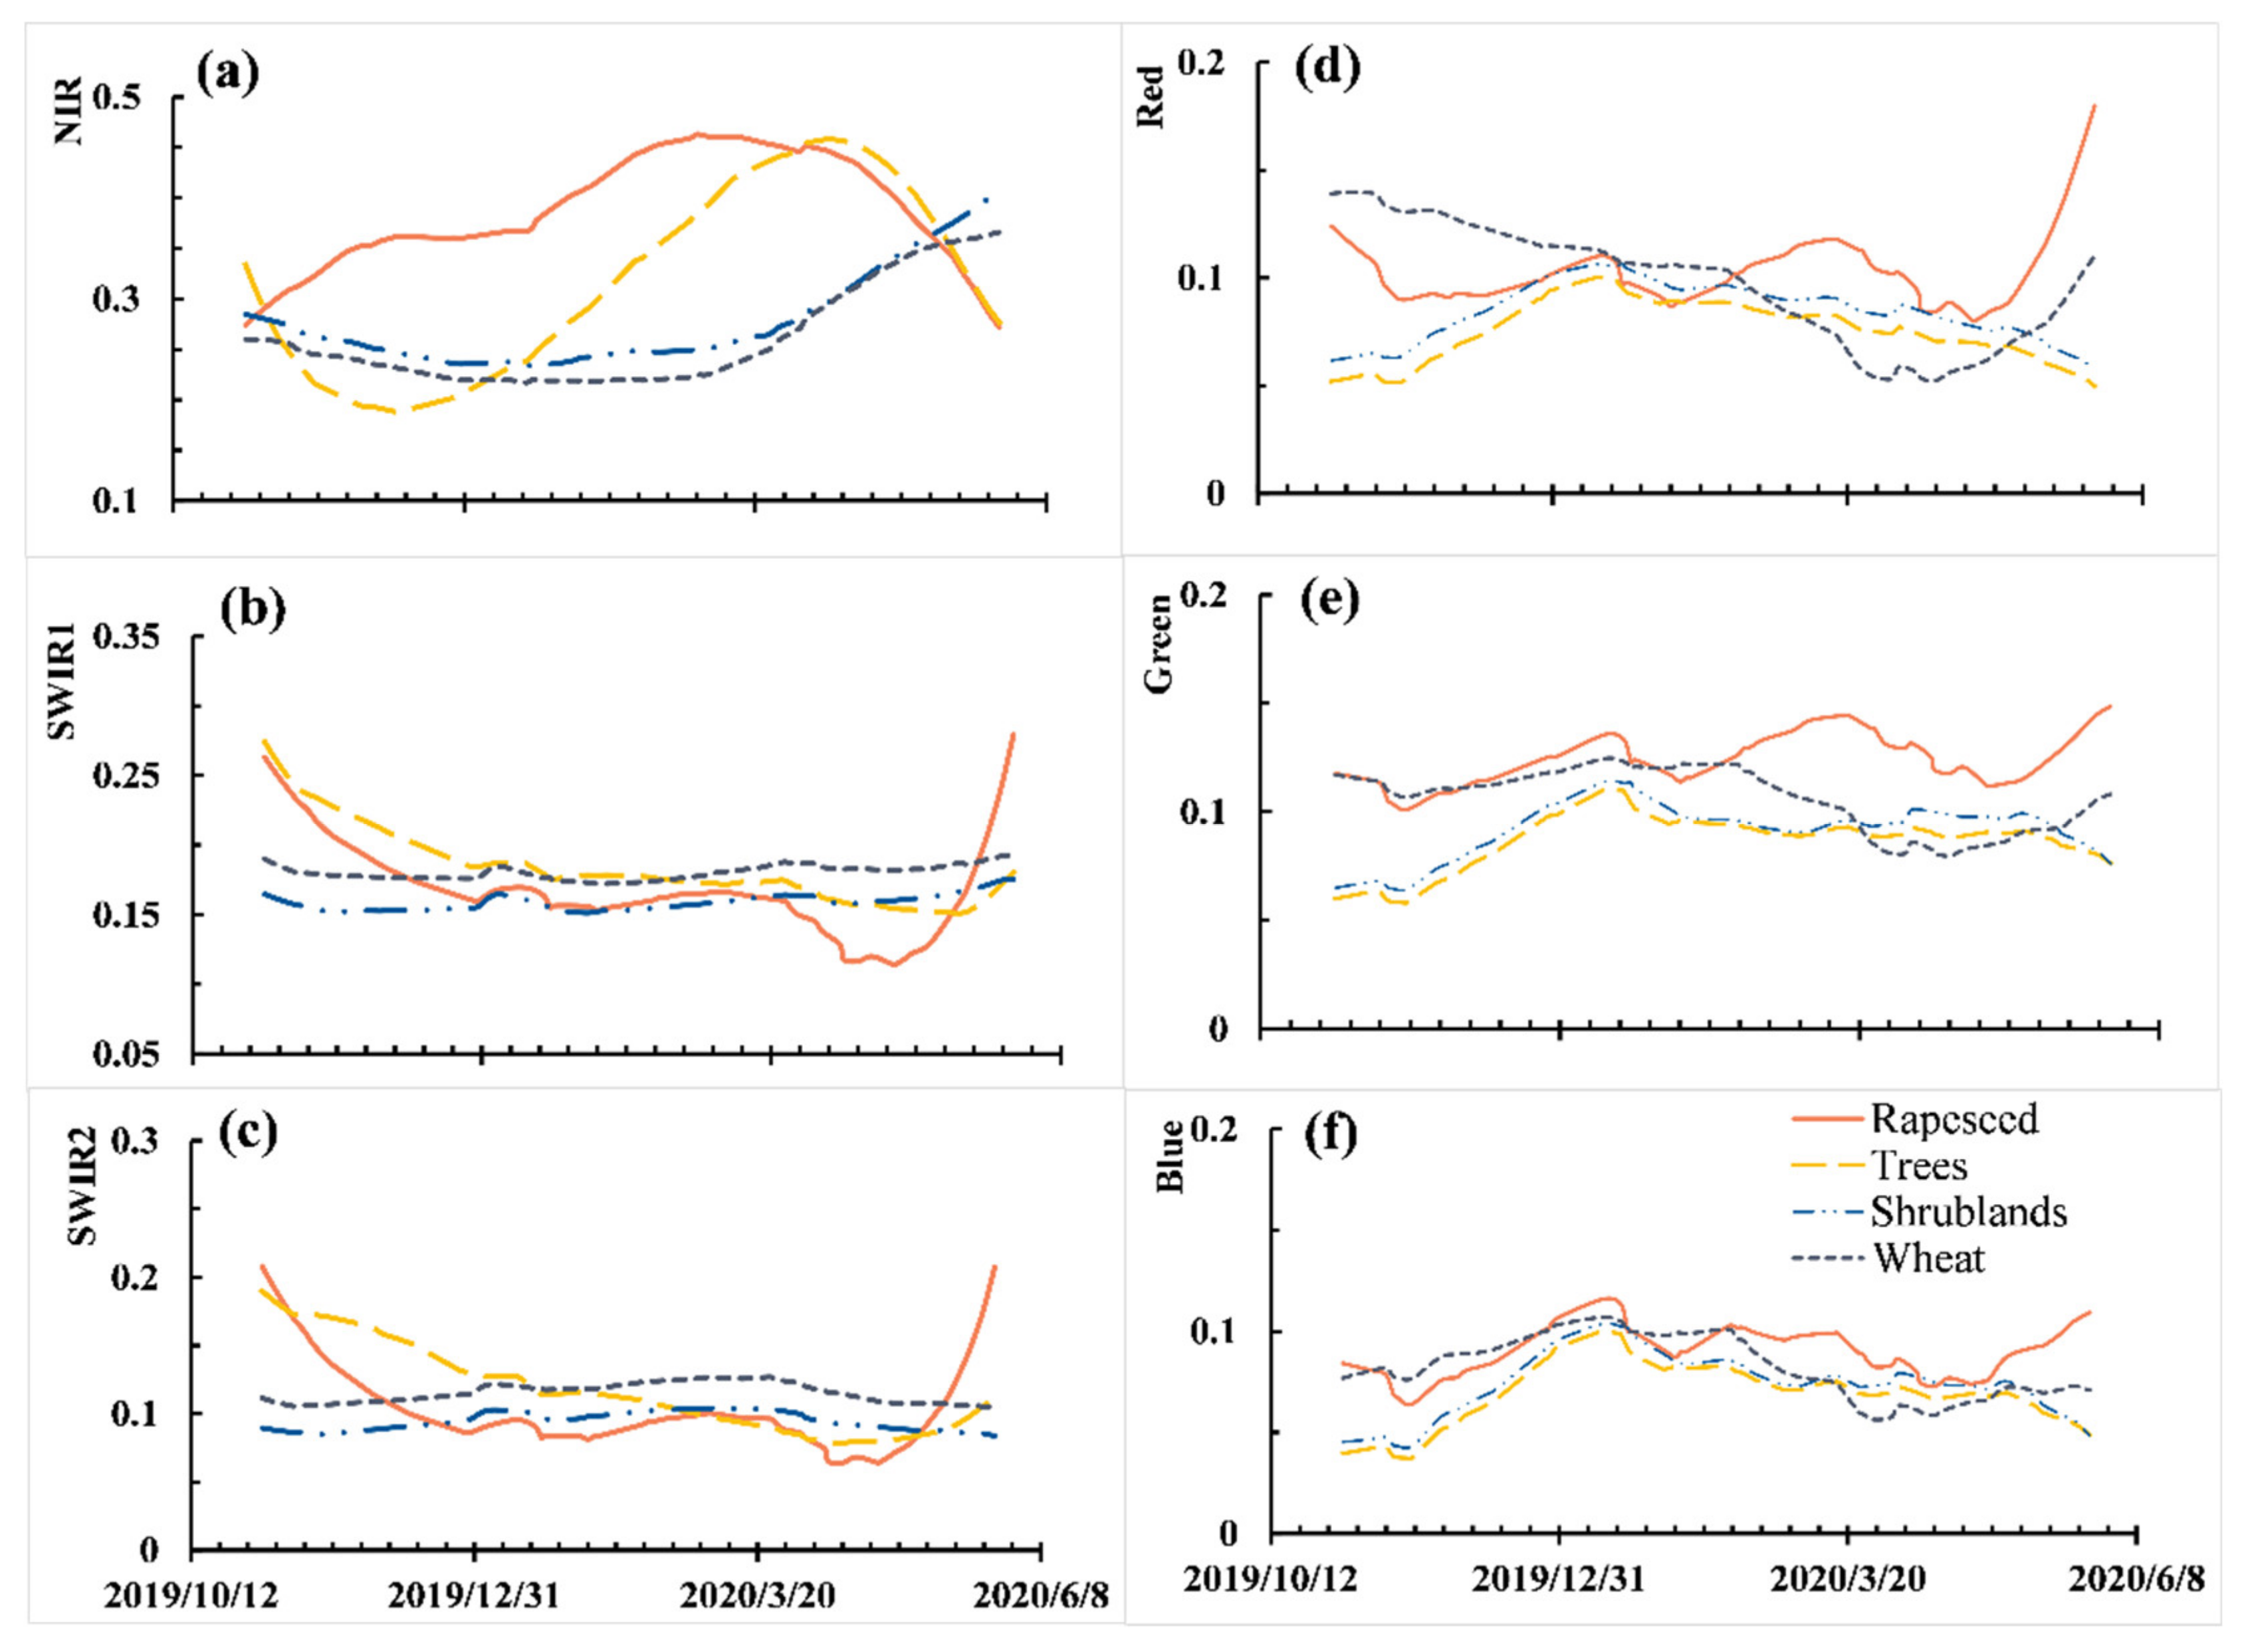
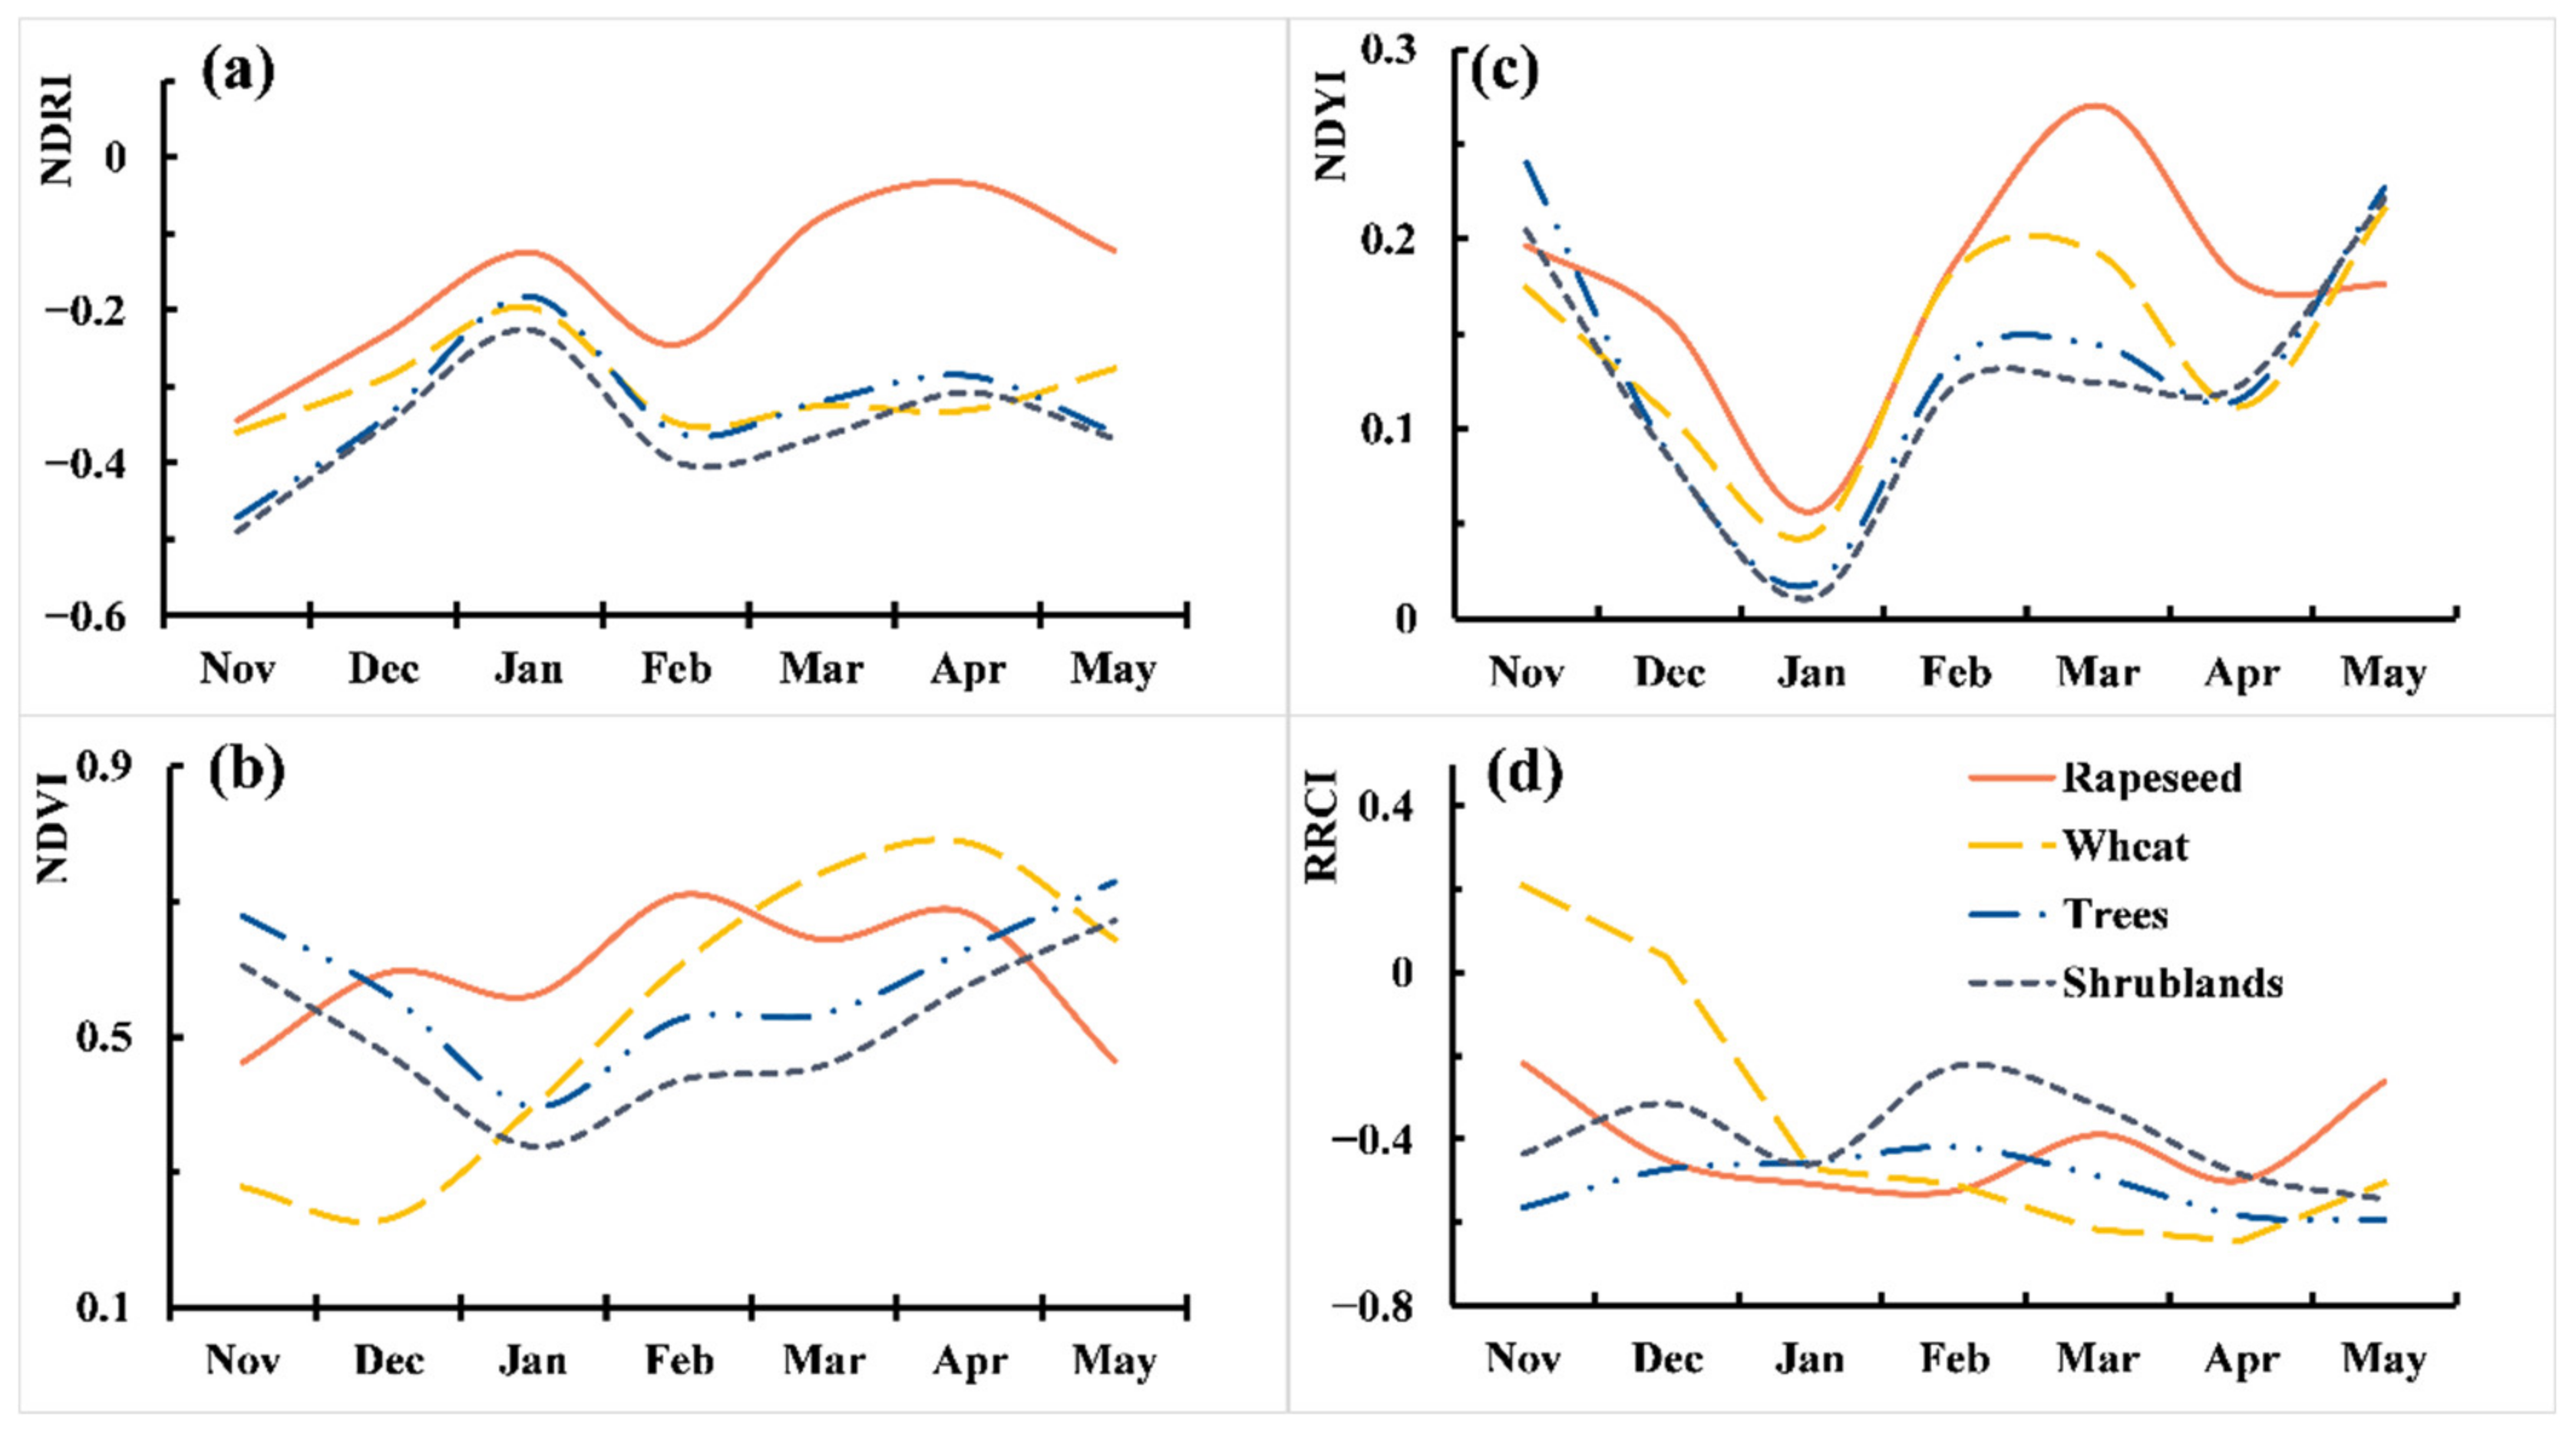
3.1. Construction of Normalized Difference Rapeseed Index Using Temporal Spectral Analysis
3.2. NDVI-Otsu Thresholding Method for Non-Vegetation Masking
3.3. Adaptive Thresholding Method to Extract Rapeseed
3.4. Validation to Evaluate the Ability of the THAT Method
4. Results
4.1. Development of New Feature for Rapeseed Extraction
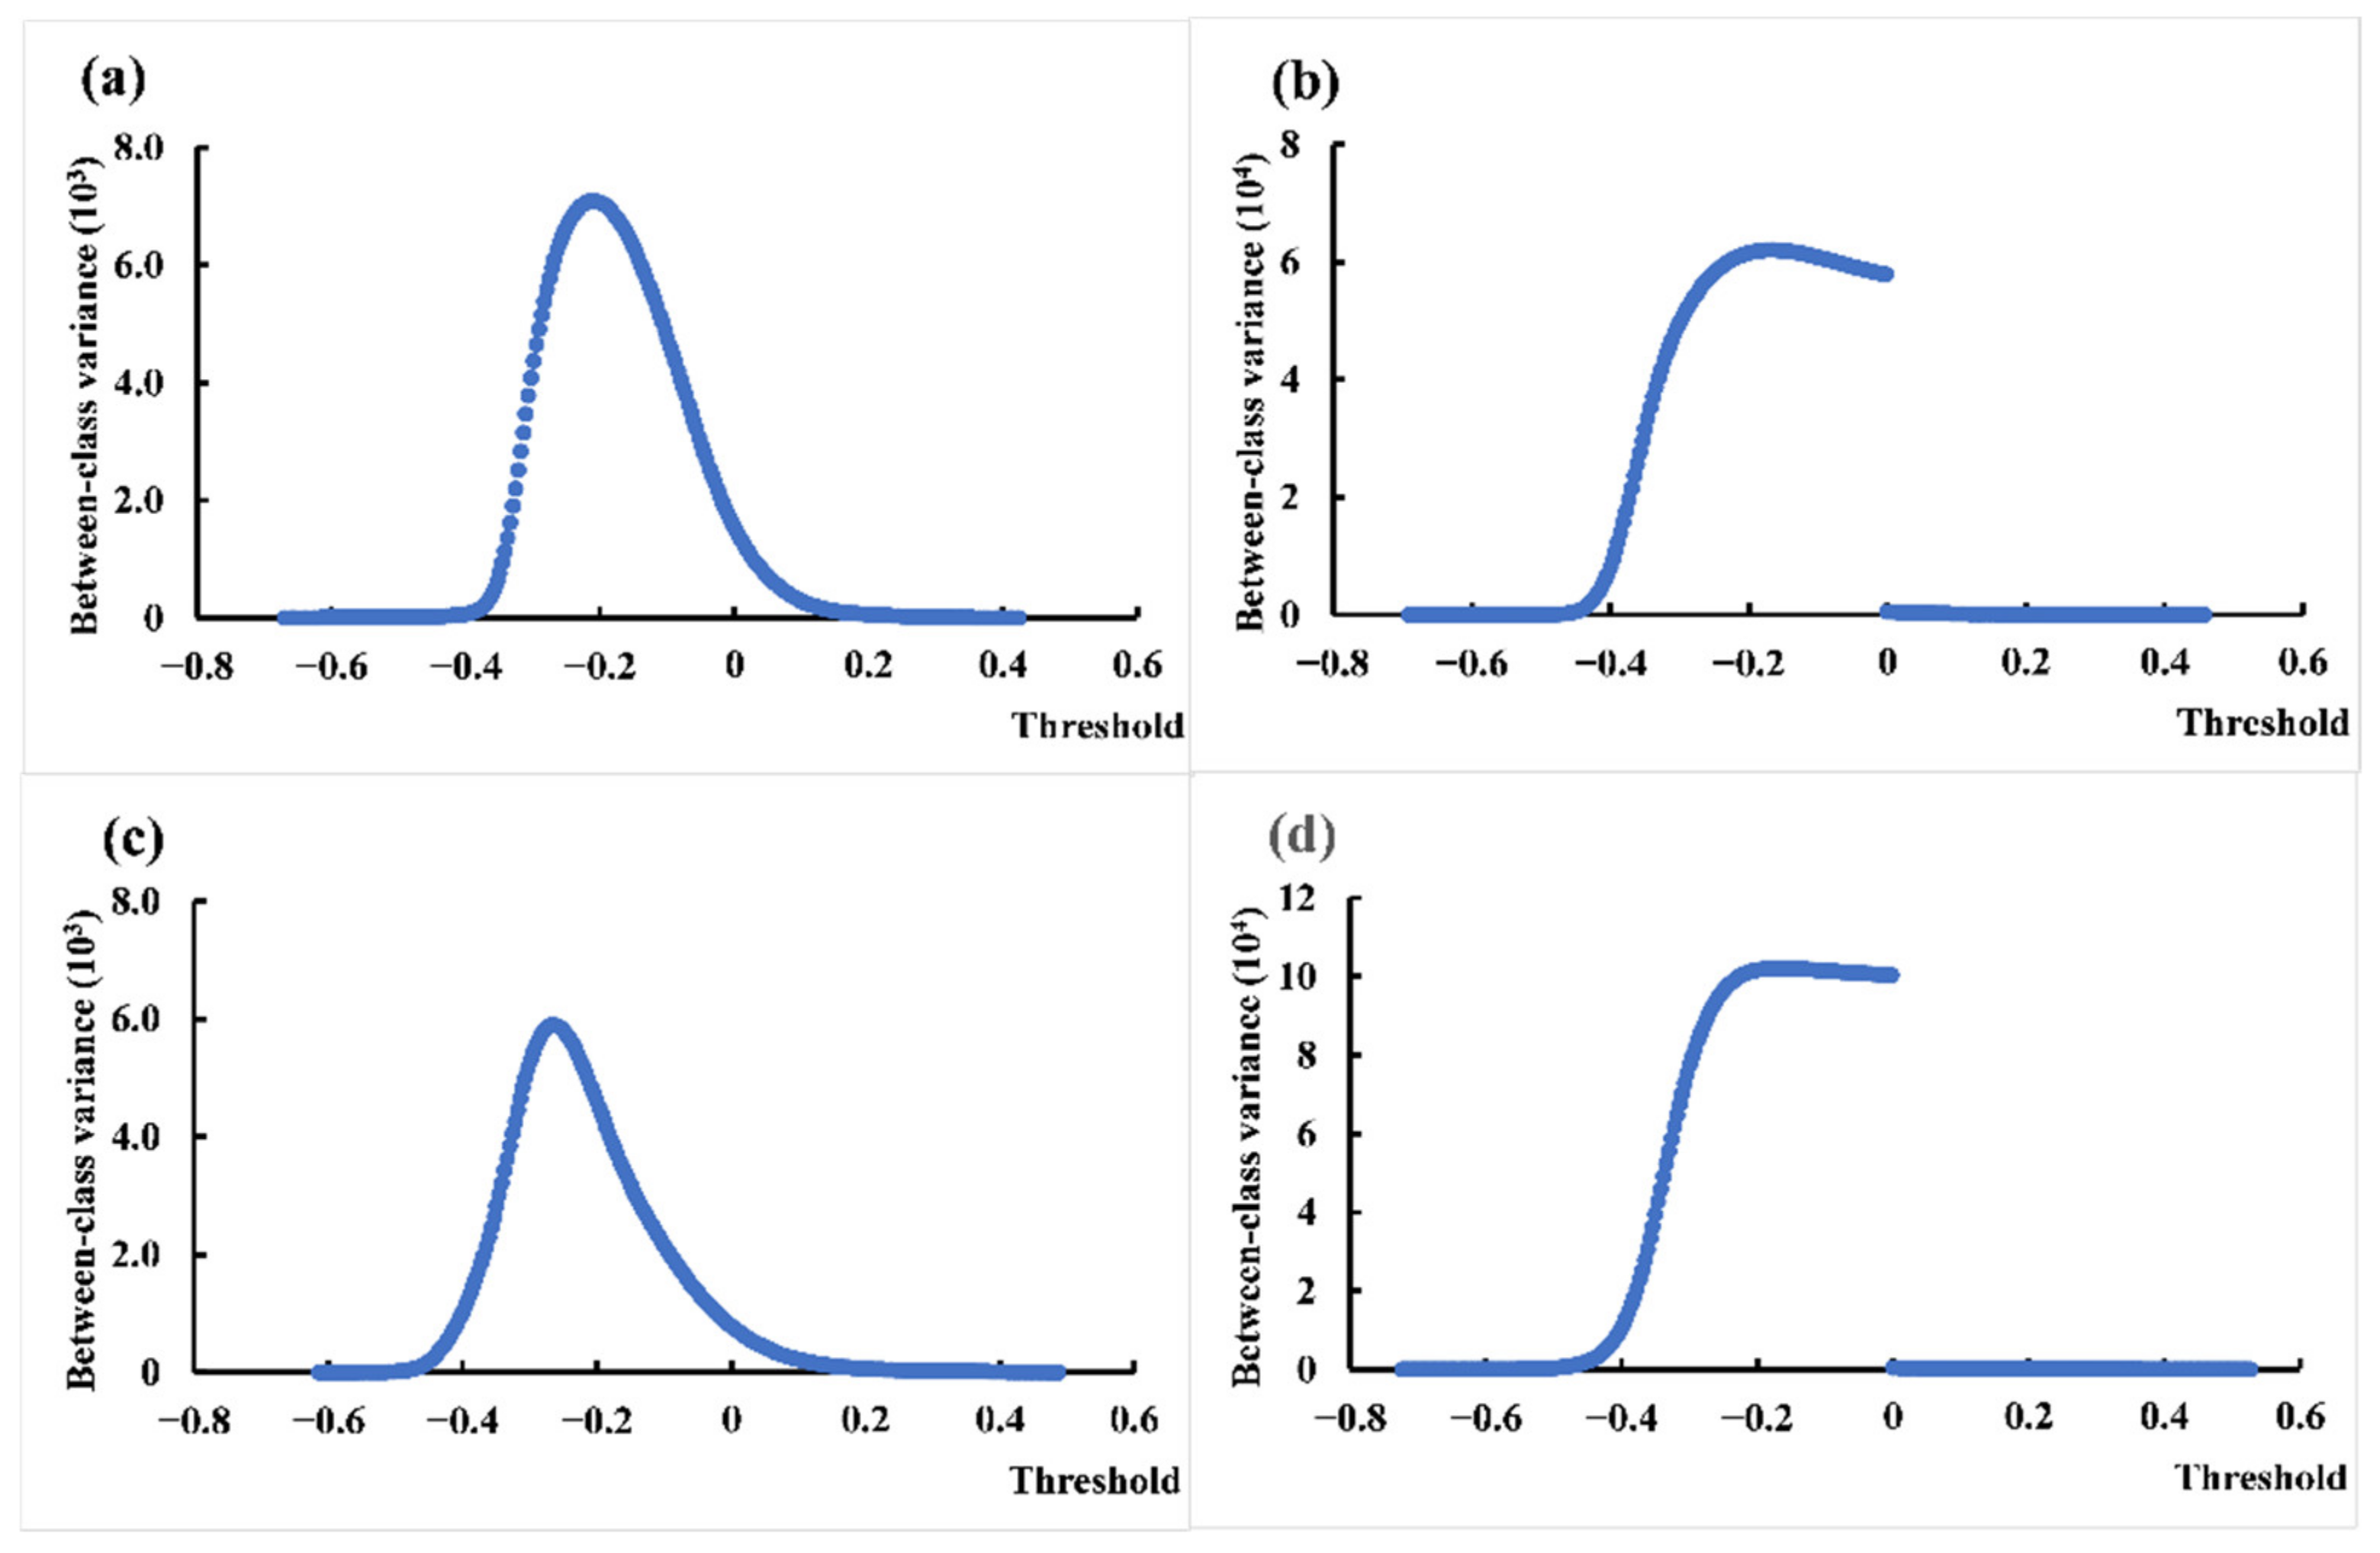
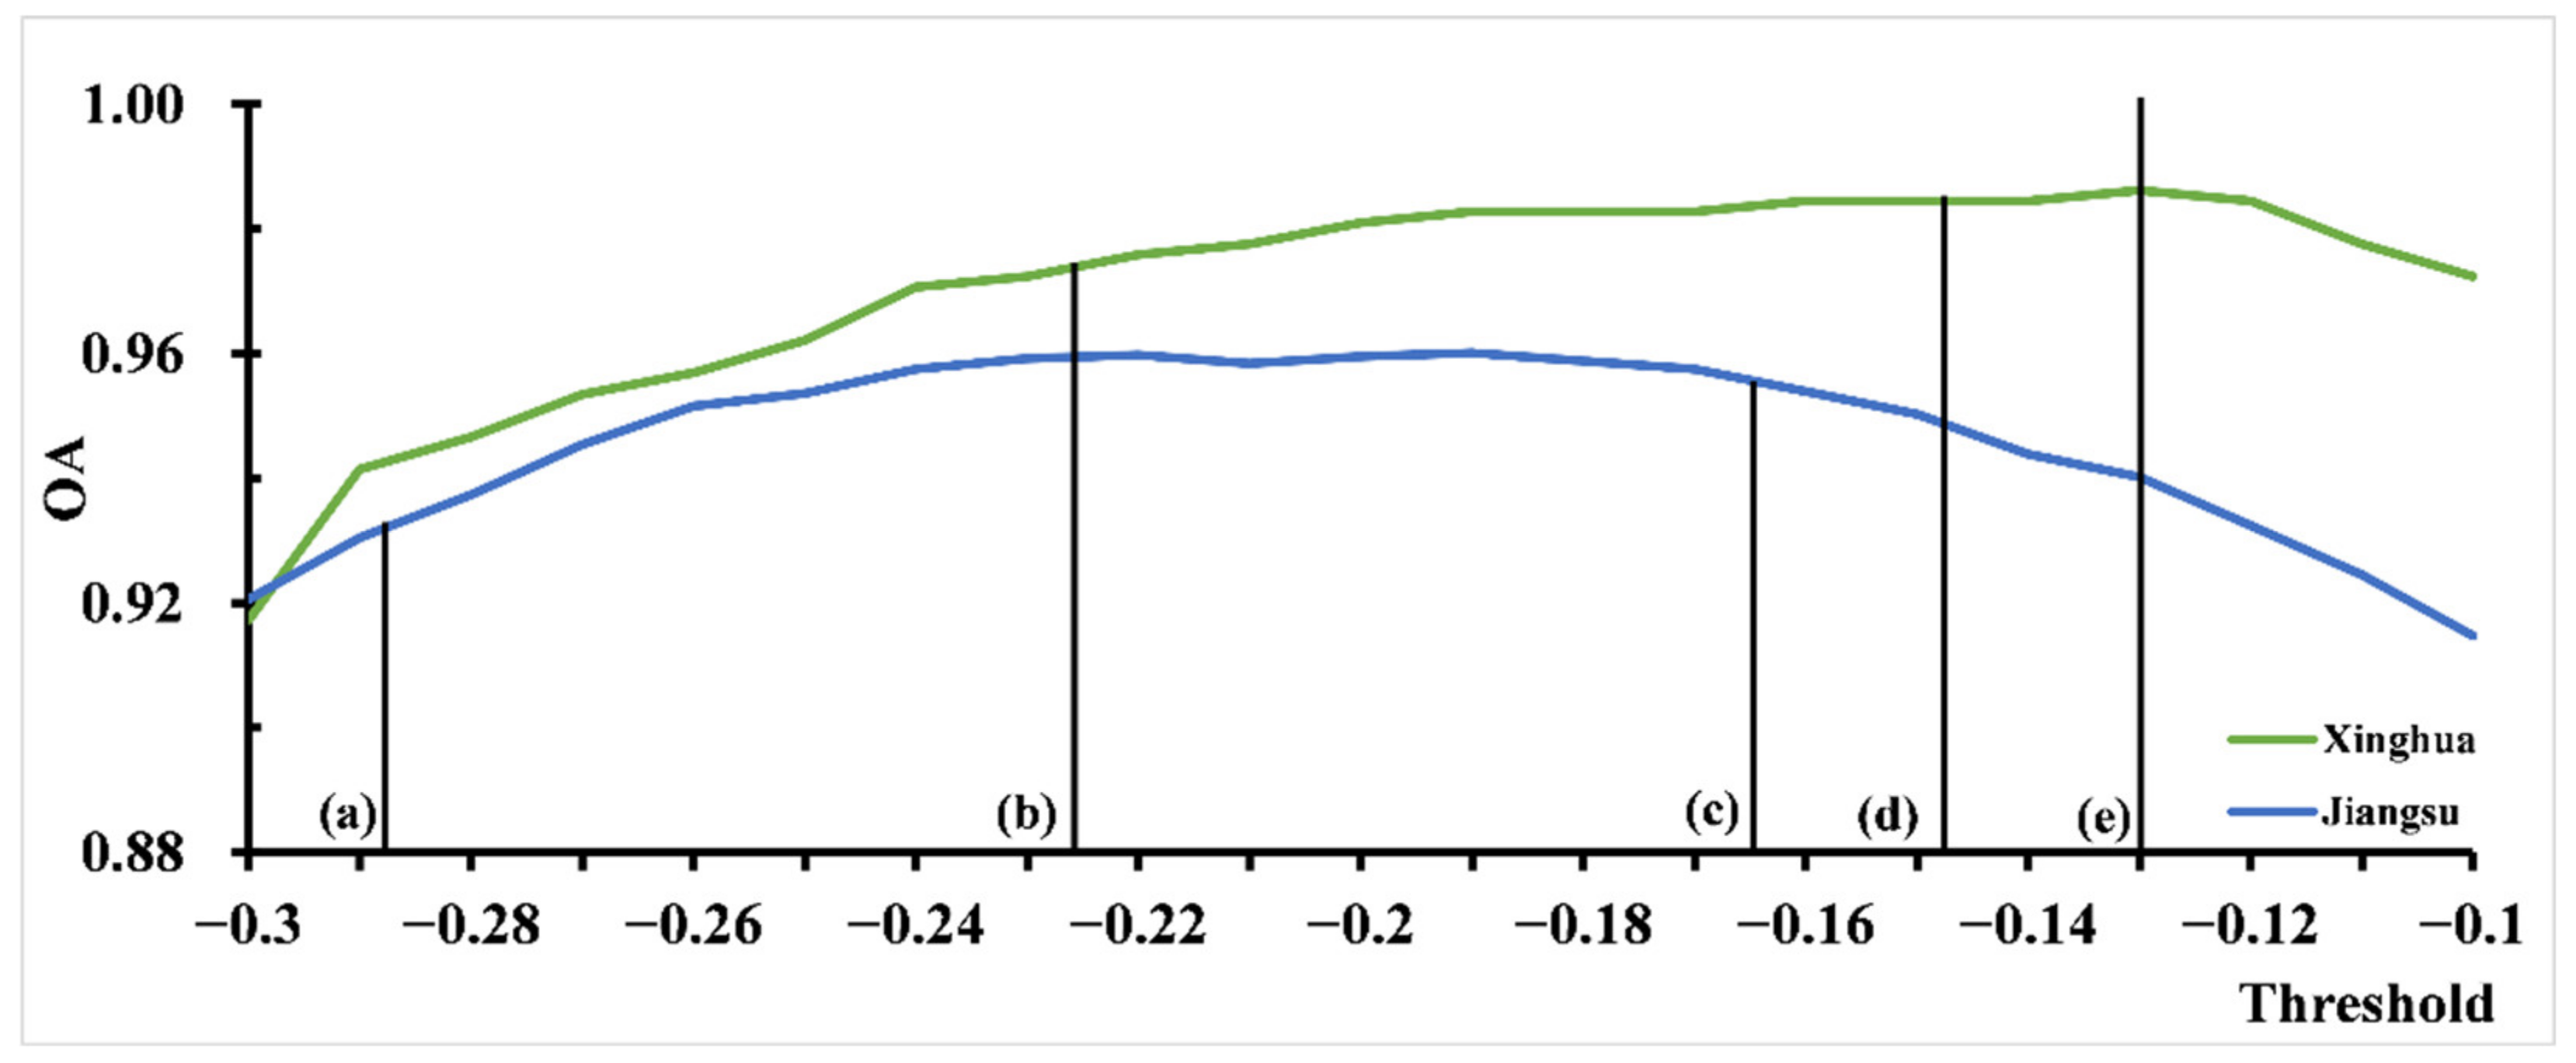
4.2. Threshold Selection for Rapeseed Extraction
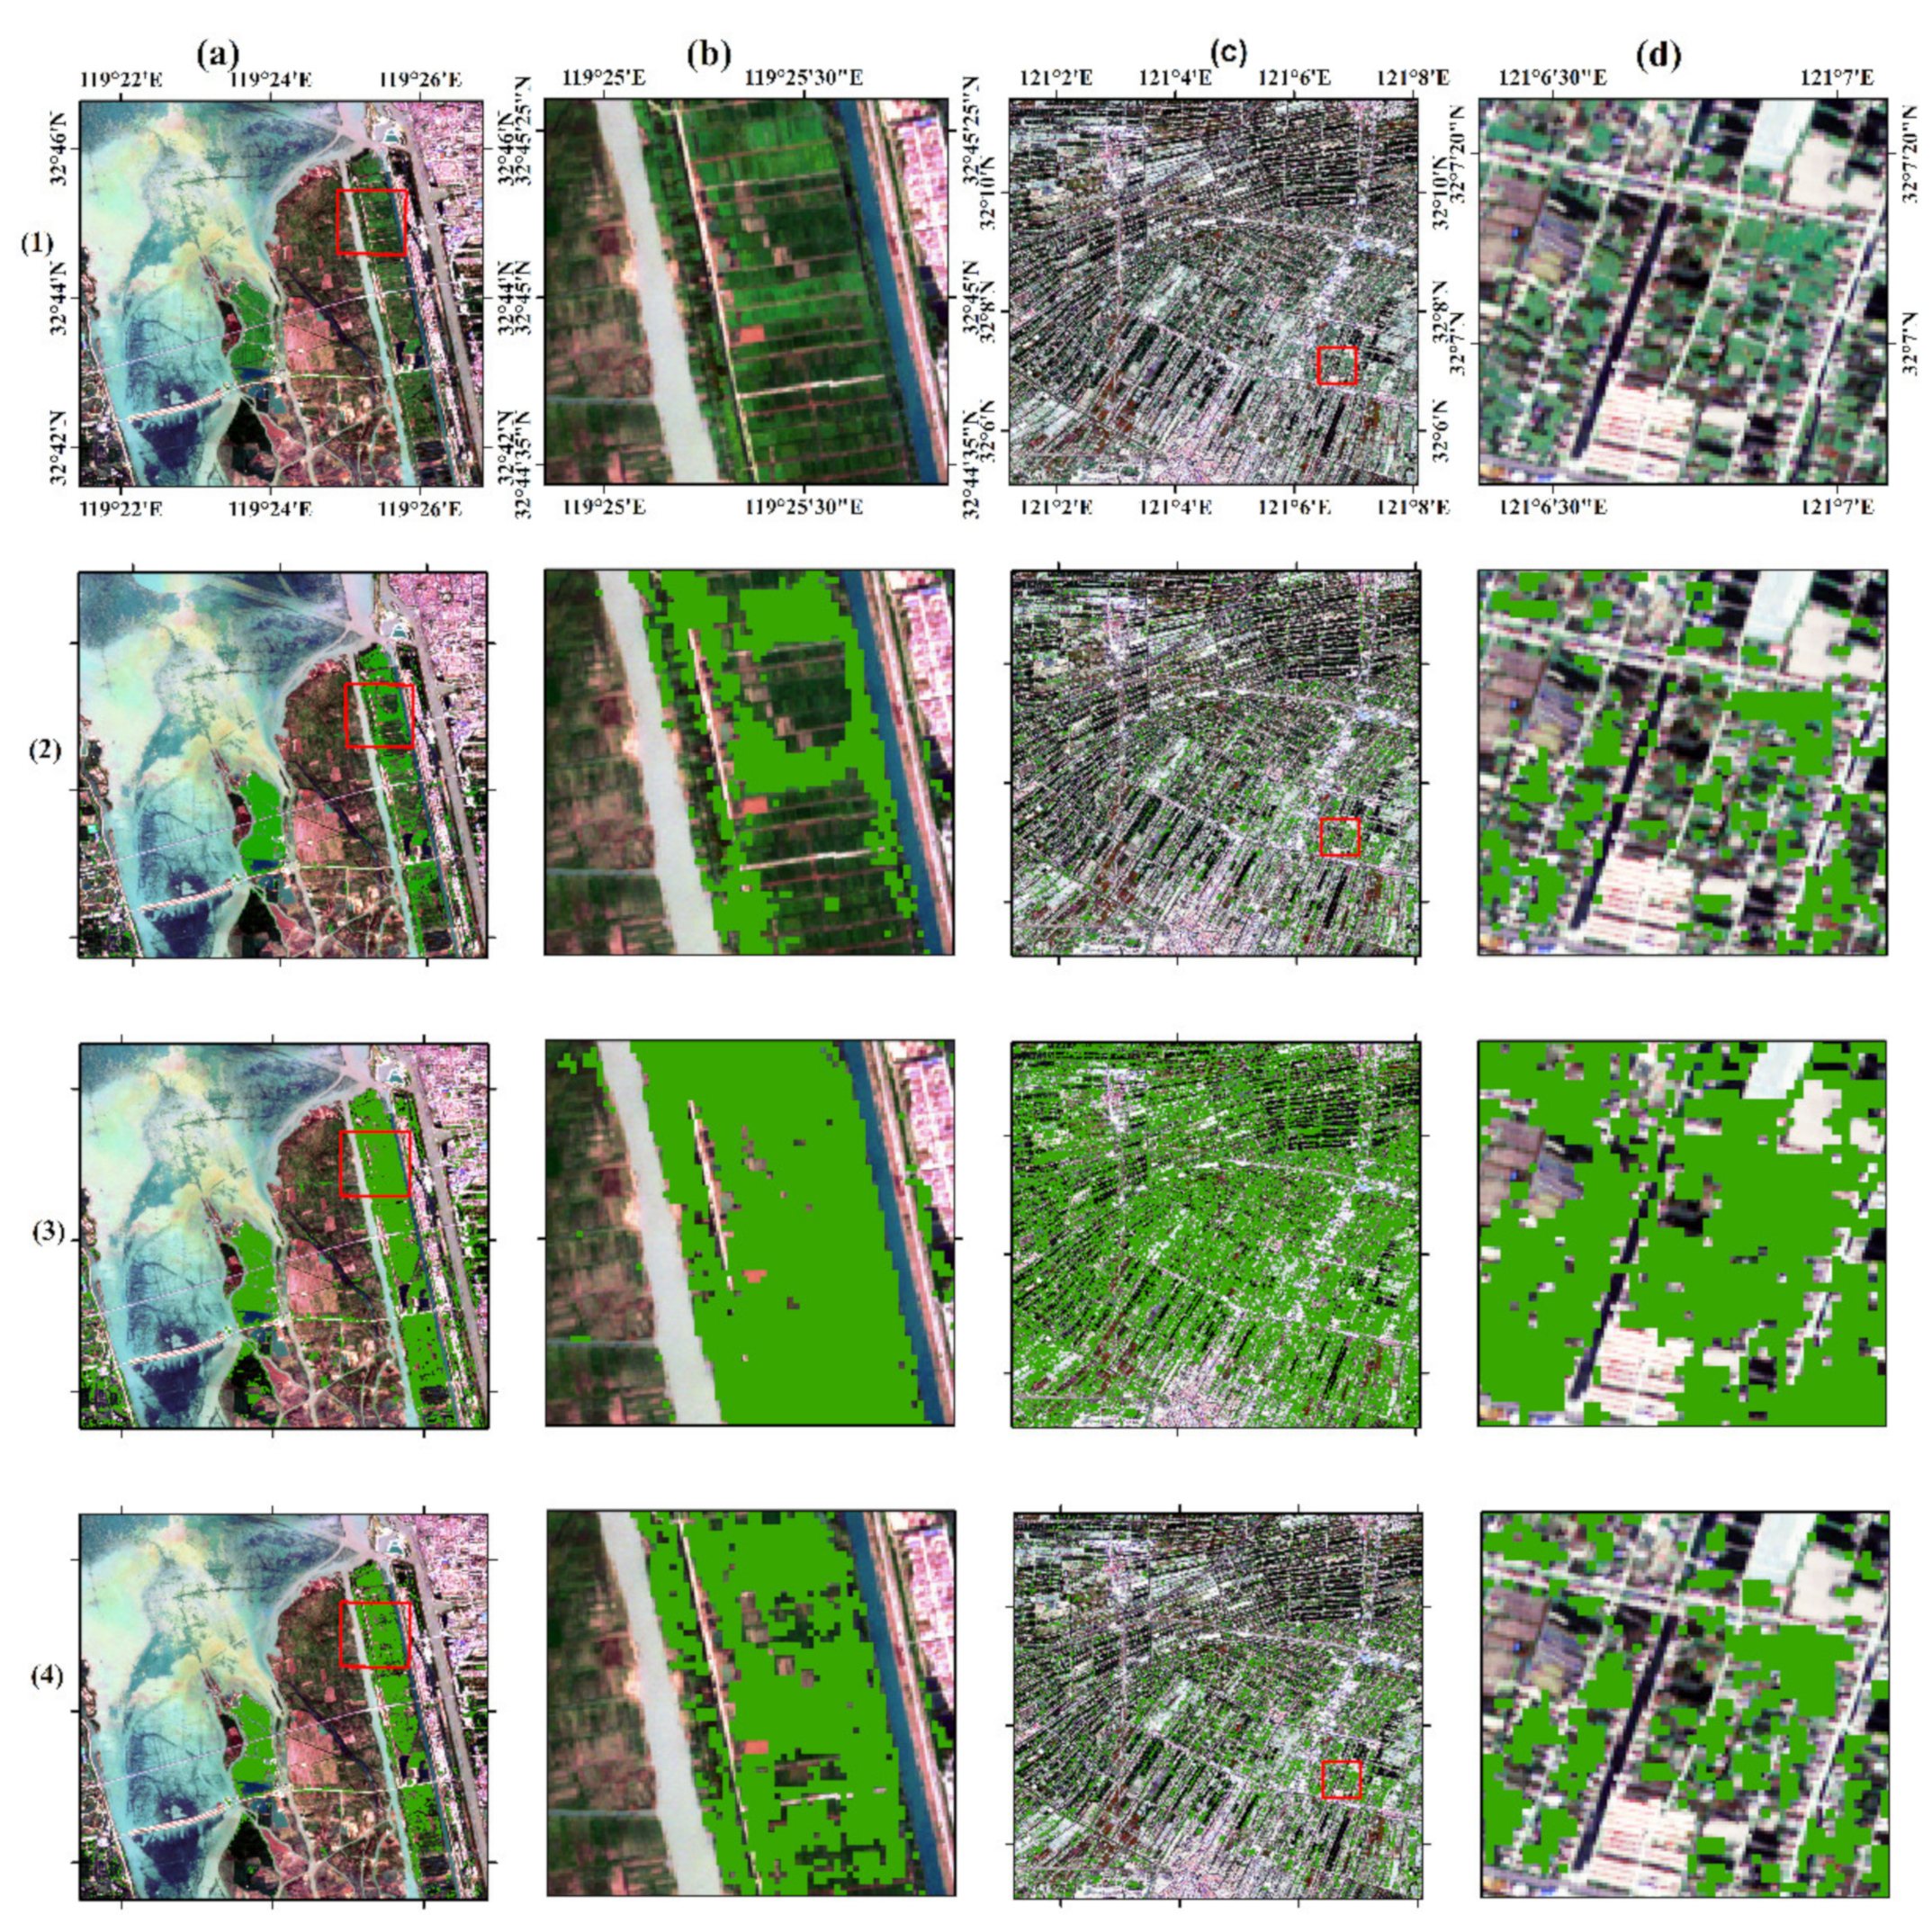
4.3. Accuracy Assessment and Comparison
5. Discussion
5.1. The Potential of NDRI in Rapeseed Mapping
5.2. Adaptive Threshold Method in Crop Mapping
5.3. Solution for Cloudy Regions
6. Conclusions
Author Contributions
Funding
Data Availability Statement
Conflicts of Interest
References
- Sulik, J.J.; Long, D.S. Spectral considerations for modeling yield of canola. Remote Sens. Environ. 2016, 184, 161–174. [Google Scholar] [CrossRef] [Green Version]
- Tao, J.; Wu, W.; Liu, W.; Xu, M. Exploring the Spatio-Temporal Dynamics of Winter Rape on the Middle Reaches of Yangtze River Valley Using Time-Series MODIS Data. Sustainability 2020, 12, 20466. [Google Scholar] [CrossRef] [Green Version]
- Pan, Z.; Huang, J.; Wang, F. Multi range spectral feature fitting for hyperspectral imagery in extracting oilseed rape planting area. Int. J. Appl. Earth Obs. Geoinf. 2013, 25, 21–29. [Google Scholar] [CrossRef]
- Jun, X.; Prasad, T.; James, T.; Murali, G.; Pardhasaradhi, T.; Adam, O.; Russell, C.; Kamini, Y.; Noel, G. Nominal 30-m Cropland Extent Map of Continental Africa by Integrating Pixel-Based and Object-Based Algorithms Using Sentinel-2 and Landsat-8 Data on Google Earth Engine. Remote Sens. 2017, 9, 1065. [Google Scholar] [CrossRef] [Green Version]
- Zhang, H.; Liu, W.; Zhang, L. Seamless and automated rapeseed mapping for large cloudy regions using time-series optical satellite imagery. ISPRS J. Photogramm. Remote Sens. 2022, 184, 45–62. [Google Scholar] [CrossRef]
- Adrian, J.; Sagan, V.; Maimaitijiang, M. Sentinel SAR-optical fusion for crop type mapping using deep learning and Google Earth Engine. ISPRS J. Photogramm. Remote Sens. 2021, 175, 215–235. [Google Scholar] [CrossRef]
- Liu, J.; Feng, Q.; Gong, J.; Zhou, J.; Liang, J.; Li, Y. Winter wheat mapping using a random forest classifier combined with multi-temporal and multi-sensor data. Int. J. Digit. Earth 2018, 11, 1–20. [Google Scholar] [CrossRef]
- He, Y.; Dong, J.; Liao, X.; Sun, L.; Fu, P. Examining rice distribution and cropping intensity in a mixed single- and double-cropping region in South China using all available Sentinel 1/2 images. Int. J. Appl. Earth Obs. Geoinf. 2021, 101, 102351. [Google Scholar] [CrossRef]
- Ashourloo, D.; Shahrabi, H.S.; Azadbakht, M.; Aghighi, H.; Nematollahi, H.; Alimohammadi, A.; Matkan, A.A. Automatic canola mapping using time series of sentinel 2 images. ISPRS J. Photogramm. Remote Sens. 2019, 156, 63–76. [Google Scholar] [CrossRef]
- D’Andrimont, R.; Taymans, M.; Lemoine, G.; Ceglar, A.; Velde, M. Detecting flowering phenology in oil seed rape parcels with Sentinel-1 and -2 time series. Remote Sens. Environ. 2020, 239, 111660. [Google Scholar] [CrossRef]
- Meng, S.; Zhong, Y.; Luo, C.; Hu, X.; Huang, S. Optimal Temporal Window Selection for Winter Wheat and Rapeseed Mapping with Sentinel-2 Images: A Case Study of Zhongxiang in China. Remote Sens. 2020, 12, 226. [Google Scholar] [CrossRef] [Green Version]
- Inglada, J.; Vincent, A.; Arias, M.; Marais-Sicre, C. Improved Early Crop Type Identification By Joint Use of High Temporal Resolution SAR And Optical Image Time Series. Remote Sens. 2016, 8, 362. [Google Scholar] [CrossRef] [Green Version]
- Griffiths, P.; Nendel, C.; Hostert, P. Intra-annual reflectance composites from Sentinel-2 and Landsat for national-scale crop and land cover mapping. Remote Sens. Environ. 2019, 220, 135–151. [Google Scholar] [CrossRef]
- Kussul, N.; Lavreniuk, M.; Skakun, S.; Shelestov, A. Deep Learning Classification of Land Cover and Crop Types Using Remote Sensing Data. IEEE Geosci. Remote Sens. Lett. 2017, 14, 778–782. [Google Scholar] [CrossRef]
- Wang, D.; Fang, S.; Yang, Z.; Wang, L.; Tang, W.; Li, Y.; Tong, C. A Regional Mapping Method for Oilseed Rape Based on HSV Transformation and Spectral Features. ISPRS Int. J. Geo-Inf. 2018, 7, 224. [Google Scholar] [CrossRef] [Green Version]
- Venkatappa, M.; Sasaki, N.; Shrestha, R.P.; Tripathi, N.K.; Ma, H.-O. Determination of Vegetation Thresholds for Assessing Land Use and Land Use Changes in Cambodia using the Google Earth Engine Cloud-Computing Platform. Remote Sens. 2019, 11, 1514. [Google Scholar] [CrossRef] [Green Version]
- Ashourloo, D.; Shahrabi, H.S.; Azadbakht, M.; Rad, A.M.; Aghighi, H.; Radiom, S. A novel method for automatic potato mapping using time series of Sentinel-2 images. Comput. Electron. Agric. 2020, 175, 105583. [Google Scholar] [CrossRef]
- Ashourloo, D.; Shahrabi, H.S.; Azadbakht, M.; Aghighi, H.; Radiom, S. A Novel Automatic Method for Alfalfa Mapping Using Time Series of Landsat-8 OLI Data. IEEE J. Sel. Top. Appl. Earth Obs. Remote Sens. 2018, 11, 4478–4487. [Google Scholar] [CrossRef]
- Huang, Y.; Qiu, B.; Chen, C.; Zhu, X.; Wu, W.; Jiang, F.; Lin, D.; Peng, Y. Automated soybean mapping based on canopy water content and chlorophyll content using Sentinel-2 images. Int. J. Appl. Earth Obs. Geoinf. 2022, 109, 102801. [Google Scholar] [CrossRef]
- Geethen, S.; Chevonne, R.; Marcus, B.; Benjamin, R. A Remote Sensing Method to Monitor Water, Aquatic Vegetation, and Invasive Water Hyacinth at National Extents. Remote Sens. 2020, 12, 4021. [Google Scholar] [CrossRef]
- Xu, H. Modification of normalised difference water index (NDWI) to enhance open water features in remotely sensed imagery. Int. J. Remote Sens. 2006, 27, 3025–3033. [Google Scholar] [CrossRef]
- Zhang, G.; Wu, M.; Wei, J.; Yufang, H. Adaptive Threshold Model in Google Earth Engine: A Case Study of Ulva prolifera Extraction in the South Yellow Sea, China. Remote Sens. 2021, 13, 3240. [Google Scholar] [CrossRef]
- Otsu, N. A Threshold Selection Method from Gray-Level Histograms. IEEE Trans. Syst. Man Cybern. 1979, 9, 62–66. [Google Scholar] [CrossRef] [Green Version]
- Da Silva, C.A., Jr.; Leonel-Junior, A.H.S.; Rossi, F.S.; Correia Filho, W.L.F.; de Barros Santiago, D.; de Oliveira-Júnior, J.F.; Teodoro, P.E.; Lima, M.; Capristo-Silva, G.F. Mapping soybean planting area in midwest Brazil with remotely sensed images and phenology-based algorithm using the Google Earth Engine platform. Comput. Electron. Agric. 2020, 169, 105194. [Google Scholar] [CrossRef]
- Huete, A.R. A soil-adjusted vegetation index (SAVI). Remote Sens. Environ. 1988, 25, 295–309. [Google Scholar] [CrossRef]
- Veloso, A.; Mermoz, S.; Bouvet, A.; Le Toan, T.; Planells, M.; Dejoux, J.F.; Ceschia, E. Understanding the temporal behavior of crops using Sentinel-1 and Sentinel-2-like data for agricultural applications. Remote Sens. Environ. 2017, 199, 415–426. [Google Scholar] [CrossRef]
- Thenkabail, P.S.; Enclona, E.A.; Ashton, M.S.; Meer, B. Accuracy assessments of hyperspectral waveband performance for vegetation analysis applications. Remote Sens. Environ. 2004, 91, 354–376. [Google Scholar] [CrossRef]
- Gao, B. NDWI-a normalized difference water index for remote sensing of vegetation liquid water from space. Remote Sens. Environ. 1996, 58, 257–266. [Google Scholar] [CrossRef]
- Fu, Y.; Zhou, T.; Yao, Y.; Qiu, A.; Wei, F.; Liu, J.; Liu, T. Evaluating efficiency and order of urban land use structure: An empirical study of cities in Jiangsu, China. J. Clean. Prod. 2021, 283, 124638. [Google Scholar] [CrossRef]
- Yusheng, K.; Ntarmah, A.H. Developing a rural ecological assessment index for Jiangsu Province, China. J. Nat. Conserv. 2021, 64, 126093. [Google Scholar] [CrossRef]
- Yang, L.; Shen, F.; Zhang, L.; Cai, Y.; Yi, F.; Zhou, C. Quantifying influences of natural and anthropogenic factors on vegetation changes using structural equation modeling: A case study in Jiangsu Province, China. J. Clean. Prod. 2021, 280, 124330. [Google Scholar] [CrossRef]
- Venkatappa, M.; Sasaki, N.; Anantsuksomsri, S.; Smith, B. Applications of the Google Earth Engine and Phenology-Based Threshold Classification Method for Mapping Forest Cover and Carbon Stock Changes in Siem Reap Province, Cambodia. Remote Sens. 2020, 12, 3110. [Google Scholar] [CrossRef]
- Gorelick, N.; Hancher, M.; Dixon, M.; Ilyushchenko, S.; Moore, R. Google Earth Engine: Planetary-scale geospatial analysis for everyone. Remote Sens. Environ. 2017, 202, 18–27. [Google Scholar] [CrossRef]
- Liu, L.; Xiao, X.; Qin, Y.; Wang, J.; Qiao, Z. Mapping cropping intensity in China using time series Landsat and Sentinel-2 images and Google Earth Engine. Remote Sens. Environ. 2020, 239, 111624. [Google Scholar] [CrossRef]
- Xu, F.; Li, Z.; Zhang, S.; Huang, N.; Quan, Z.; Zhang, W.; Liu, X.; Jiang, X.; Pan, J.; Prishchepov, A.V. Mapping Winter Wheat with Combinations of Temporally Aggregated Sentinel-2 and Landsat-8 Data in Shandong Province, China. Remote Sens. 2020, 12, 2065. [Google Scholar] [CrossRef]
- Qiu, S.; Zhu, Z.; He, B. Fmask 4.0: Improved cloud and cloud shadow detection in Landsats 4–8 and Sentinel-2 imagery. Remote Sens. Environ. 2019, 231, 111205. [Google Scholar] [CrossRef]
- Foga, S.; Scaramuzza, P.L.; Guo, S.; Zhu, Z.; Dilley, R.D.; Beckmann, T.; Schmidt, G.L.; Dwyer, J.L.; Joseph Hughes, M.; Laue, B. Cloud detection algorithm comparison and validation for operational Landsat data products. Remote Sens. Environ. 2017, 194, 379–390. [Google Scholar] [CrossRef] [Green Version]
- Braaten, J. Sentinel-2 Cloud Masking with s2cloudless. Available online: https://developers.google.com/earth-engine/tutorials/community/sentinel-2-s2cloudless?hl=en (accessed on 8 December 2021).
- Claverie, M.; Ju, J.; Masek, J.G.; Dungan, J.L.; Vermote, E.F.; Roger, J.C.; Skakun, S.V.; Justice, C. The Harmonized Landsat and Sentinel-2 surface reflectance data set. Remote Sens. Environ. 2018, 219, 145–161. [Google Scholar] [CrossRef]
- Shang, R.; Zhu, Z. Harmonizing Landsat 8 and Sentinel-2: A time-series-based reflectance adjustment approach. Remote Sens. Environ. 2019, 235, 111439. [Google Scholar] [CrossRef]
- Claverie, M.; Masek, J.G.; Ju, J. Harmonized Landsat-8 Sentinel-2 (HLS) Product User’s Guide. Available online: https://hls.gsfc.nasa.gov/wp-content/uploads/2017/02/HLS.v1.2.UserGuide.pdf (accessed on 23 December 2021).
- Rc, A.; Ih, A.; Jg, A.; Mf, A.; Kt, B. Empirical cross sensor comparison of Sentinel-2A and 2B MSI, Landsat-8 OLI, and Landsat-7 ETM+ top of atmosphere spectral characteristics over the conterminous United States. Remote Sens. Environ. 2019, 221, 274–285. [Google Scholar] [CrossRef]
- Ajadi, A.O.; Jeremiah, B.; Sang-Zi, L.; Rogerio, F.; Kumpatla, S.P.; Rinkal, P.; Anu, S. Large-scale crop type and crop area mapping across Brazil using synthetic aperture radar and optical imagery. Int. J. Appl. Earth Obs. Geoinf. 2021, 97, 102294. [Google Scholar] [CrossRef]
- Zhang, W.; Brandt, M.; Prishchepov, A.V.; Li, Z.; Lyu, C.; Fensholt, R. Mapping the Dynamics of Winter Wheat in the North China Plain from Dense Landsat Time Series (1999 to 2019). Remote Sens. 2021, 13, 1170. [Google Scholar] [CrossRef]
- Jain, M.; Mondal, P.; Defries, R.S.; Small, C.; Galford, G.L. Mapping cropping intensity of smallholder farms: A comparison of methods using multiple sensors. Remote Sens. Environ. 2013, 134, 210–223. [Google Scholar] [CrossRef] [Green Version]
- Wu, M.; Huang, W.; Niu, Z.; Wang, Y.; Wang, C.; Li, W.; Hao, P.; Yu, B. Fine crop mapping by combining high spectral and high spatial resolution remote sensing data in complex heterogeneous areas. Comput. Electron. Agric. 2017, 139, 1–9. [Google Scholar] [CrossRef]
- Rouse, J.W., Jr.; Haas, R.H.; Schell, J.A.; Deering, D.W. Monitoring vegetation systems in the greant plains with ERTS. In Proceedings of the Earth Resources Technology Satellite Symposium NASA, Washington, DC, USA, 10–14 December 1973; NASA: Washington, DC, USA, 1973; pp. 309–317. [Google Scholar]
- Bai, X.D.; Cao, Z.G.; Wang, Y.; Yu, Z.H.; Zhang, X.F.; Li, C.N. Crop segmentation from images by morphology modeling in the CIE L* a* b* color space. Comput. Electron. Agric. 2013, 99, 21–34. [Google Scholar] [CrossRef]
- Congalton, R.G. A review of assessing the accuracy of classifications of remotely sensed data. Remote Sens. Environ. 1991, 37, 35–46. [Google Scholar] [CrossRef]
- Pelletier, C.; Valero, S.; Inglada, J.; Champion, N.; Dedieu, G. Assessing the robustness of Random Forests to map land cover with high resolution satellite image time series over large areas. Remote Sens. Environ. 2016, 187, 156–168. [Google Scholar] [CrossRef]
- Mcfeeters, S.K. The use of the Normalized Difference Water Index (NDWI) in the delineation of open water features. Int. J. Remote Sens. 1996, 17, 1425–1432. [Google Scholar] [CrossRef]
- Wagle, P.; Gowda, P.H.; Northup, B.K.; Neel, J.P.S. Ecosystem-level water use efficiency and evapotranspiration partitioning in conventional till and no-till rainfed canola. Agric. Water Manag. 2021, 250, 106825. [Google Scholar] [CrossRef]
- Katuwal, K.B.; Cho, Y.; Singh, S.; Angadi, S.V.; Begna, S.; Stamm, M. Soil water extraction pattern and water use efficiency of spring canola under growth-stage-based irrigation management. Agric. Water Manag. 2020, 239, 106232. [Google Scholar] [CrossRef]
- Zhang, P.; Hu, S.; Li, W.; Zhang, C. Parcel-level mapping of crops in a smallholder agricultural area: A case of central China using single-temporal VHSR imagery. Comput. Electron. Agric. 2020, 175, 105581. [Google Scholar] [CrossRef]
- Dong, J.; Xiao, X.; Menarguez, M.A.; Zhang, G.; Qin, Y.; Thau, D.; Biradar, C.; Moore, B. Mapping paddy rice planting area in northeastern Asia with Landsat 8 images, phenology-based algorithm and Google Earth Engine. Remote Sens. Environ. 2016, 185, 142–154. [Google Scholar] [CrossRef] [PubMed] [Green Version]
- Song, X.-P.; Huang, W.; Hansen, M.C.; Potapov, P. An evaluation of Landsat, Sentinel-2, Sentinel-1 and MODIS data for crop type mapping. Sci. Remote Sens. 2021, 3, 100018. [Google Scholar] [CrossRef]
- Khalid, H.W.; Khalil, R.M.Z.; Qureshi, M.A. Evaluating spectral indices for water bodies extraction in western Tibetan Plateau. Egypt. J. Remote Sens. Space Sci. 2021, 24, 619–634. [Google Scholar] [CrossRef]
- Tian, H.; Meng, M.; Wu, M.; Niu, Z. Mapping Spring Canola and Spring Wheat Using Radarsat-2 and Landsat-8 Images with Google Earth Engine. Curr. Sci. 2019, 116, 291–298. [Google Scholar] [CrossRef]


| Month | Oct | Nov | Dec | Jan | Feb | Mar | Apr | May | Jun | ||||||||||||||||
|---|---|---|---|---|---|---|---|---|---|---|---|---|---|---|---|---|---|---|---|---|---|---|---|---|---|
| Ten-day | II | III | I | II | III | I | II | III | I | II | III | I | II | III | I | II | III | I | II | III | I | II | III | I | II |
| Phase | |||||||||||||||||||||||||
| Class | Xinghua County | Jiangsu Province | Total |
|---|---|---|---|
| Non-vegetation | 247 | 1575 | 1822 |
| Other vegetation | 140 | 860 | 1000 |
| Rapeseed | 163 | 625 | 788 |
| Total | 550 | 3060 | 3610 |
| Band | ETM+ to MSI | OLI to MSI |
|---|---|---|
| Red | MSI = 1.1060 ETM − 0.0139 | MSI = 1.0946 OLI − 0.0107 |
| Green | MSI = 0.9909 ETM + 0.0041 | MSI = 1.0043 OLI + 0.0026 |
| Blue | MSI = 1.0568 ETM − 0.0024 | MSI = 1.0524 OLI − 0.0015 |
| NIR | MSI = 1.0045 ETM − 0.0076 | MSI = 0.8954 OLI + 0.0033 |
| SWIR1 | MSI = 1.0361 ETM + 0.0041 | MSI = 1.0049 OLI + 0.0065 |
| SWIR2 | MSI = 1.040 ETM + 0.0086 | MSI = 1.0002 OLI + 0.0046 |
| Image Acquisition Period | Number of Sentinel-2 MSI Images | Number of Landsat-8 OLI Images | Number of Landsat-7 ETM+ Images | Total Number of Images |
|---|---|---|---|---|
| November | 129 | 14 | 9 | 152 |
| December | 129 | 17 | 12 | 158 |
| January | 48 | 9 | 6 | 63 |
| February | 81 | 10 | 7 | 98 |
| March | 114 | 16 | 8 | 138 |
| April | 120 | 18 | 14 | 152 |
| May | 118 | 18 | 7 | 143 |
| Index | JM Distance Value |
|---|---|
| NDVI | 0.5904 |
| NDYI | 0.5487 |
| NDRI | 1.0425 |
| RRCI | 0.7464 |
| Region | Thresholding Method | OA | Kappa | PA | UA |
|---|---|---|---|---|---|
| Xinghua County | Otsu | 0.9724 | 0.9327 | 0.9298 | 0.9755 |
| OCED | 0.9845 | 0.9614 | 0.9813 | 0.9632 | |
| RF | 0.9840 | 0.9603 | 0.9917 | 0.9520 | |
| Jiangsu Province | Otsu | 0.9310 | 0.8089 | 0.7556 | 0.9792 |
| OCED | 0.9559 | 0.8569 | 0.9554 | 0.8224 | |
| RF | 0.9806 | 0.9391 | 0.9527 | 0.9497 |
Publisher’s Note: MDPI stays neutral with regard to jurisdictional claims in published maps and institutional affiliations. |
© 2022 by the authors. Licensee MDPI, Basel, Switzerland. This article is an open access article distributed under the terms and conditions of the Creative Commons Attribution (CC BY) license (https://creativecommons.org/licenses/by/4.0/).
Share and Cite
Chen, S.; Li, Z.; Ji, T.; Zhao, H.; Jiang, X.; Gao, X.; Pan, J.; Zhang, W. Two-Stepwise Hierarchical Adaptive Threshold Method for Automatic Rapeseed Mapping over Jiangsu Using Harmonized Landsat/Sentinel-2. Remote Sens. 2022, 14, 2715. https://doi.org/10.3390/rs14112715
Chen S, Li Z, Ji T, Zhao H, Jiang X, Gao X, Pan J, Zhang W. Two-Stepwise Hierarchical Adaptive Threshold Method for Automatic Rapeseed Mapping over Jiangsu Using Harmonized Landsat/Sentinel-2. Remote Sensing. 2022; 14(11):2715. https://doi.org/10.3390/rs14112715
Chicago/Turabian StyleChen, Shaomei, Zhaofu Li, Tingli Ji, Haiyan Zhao, Xiaosan Jiang, Xiang Gao, Jianjun Pan, and Wenmin Zhang. 2022. "Two-Stepwise Hierarchical Adaptive Threshold Method for Automatic Rapeseed Mapping over Jiangsu Using Harmonized Landsat/Sentinel-2" Remote Sensing 14, no. 11: 2715. https://doi.org/10.3390/rs14112715