
Diurnal Variation in Cloud and Precipitation Characteristics in Summer over the Tibetan Plateau and Sichuan Basin


Abstract
:1. Introduction
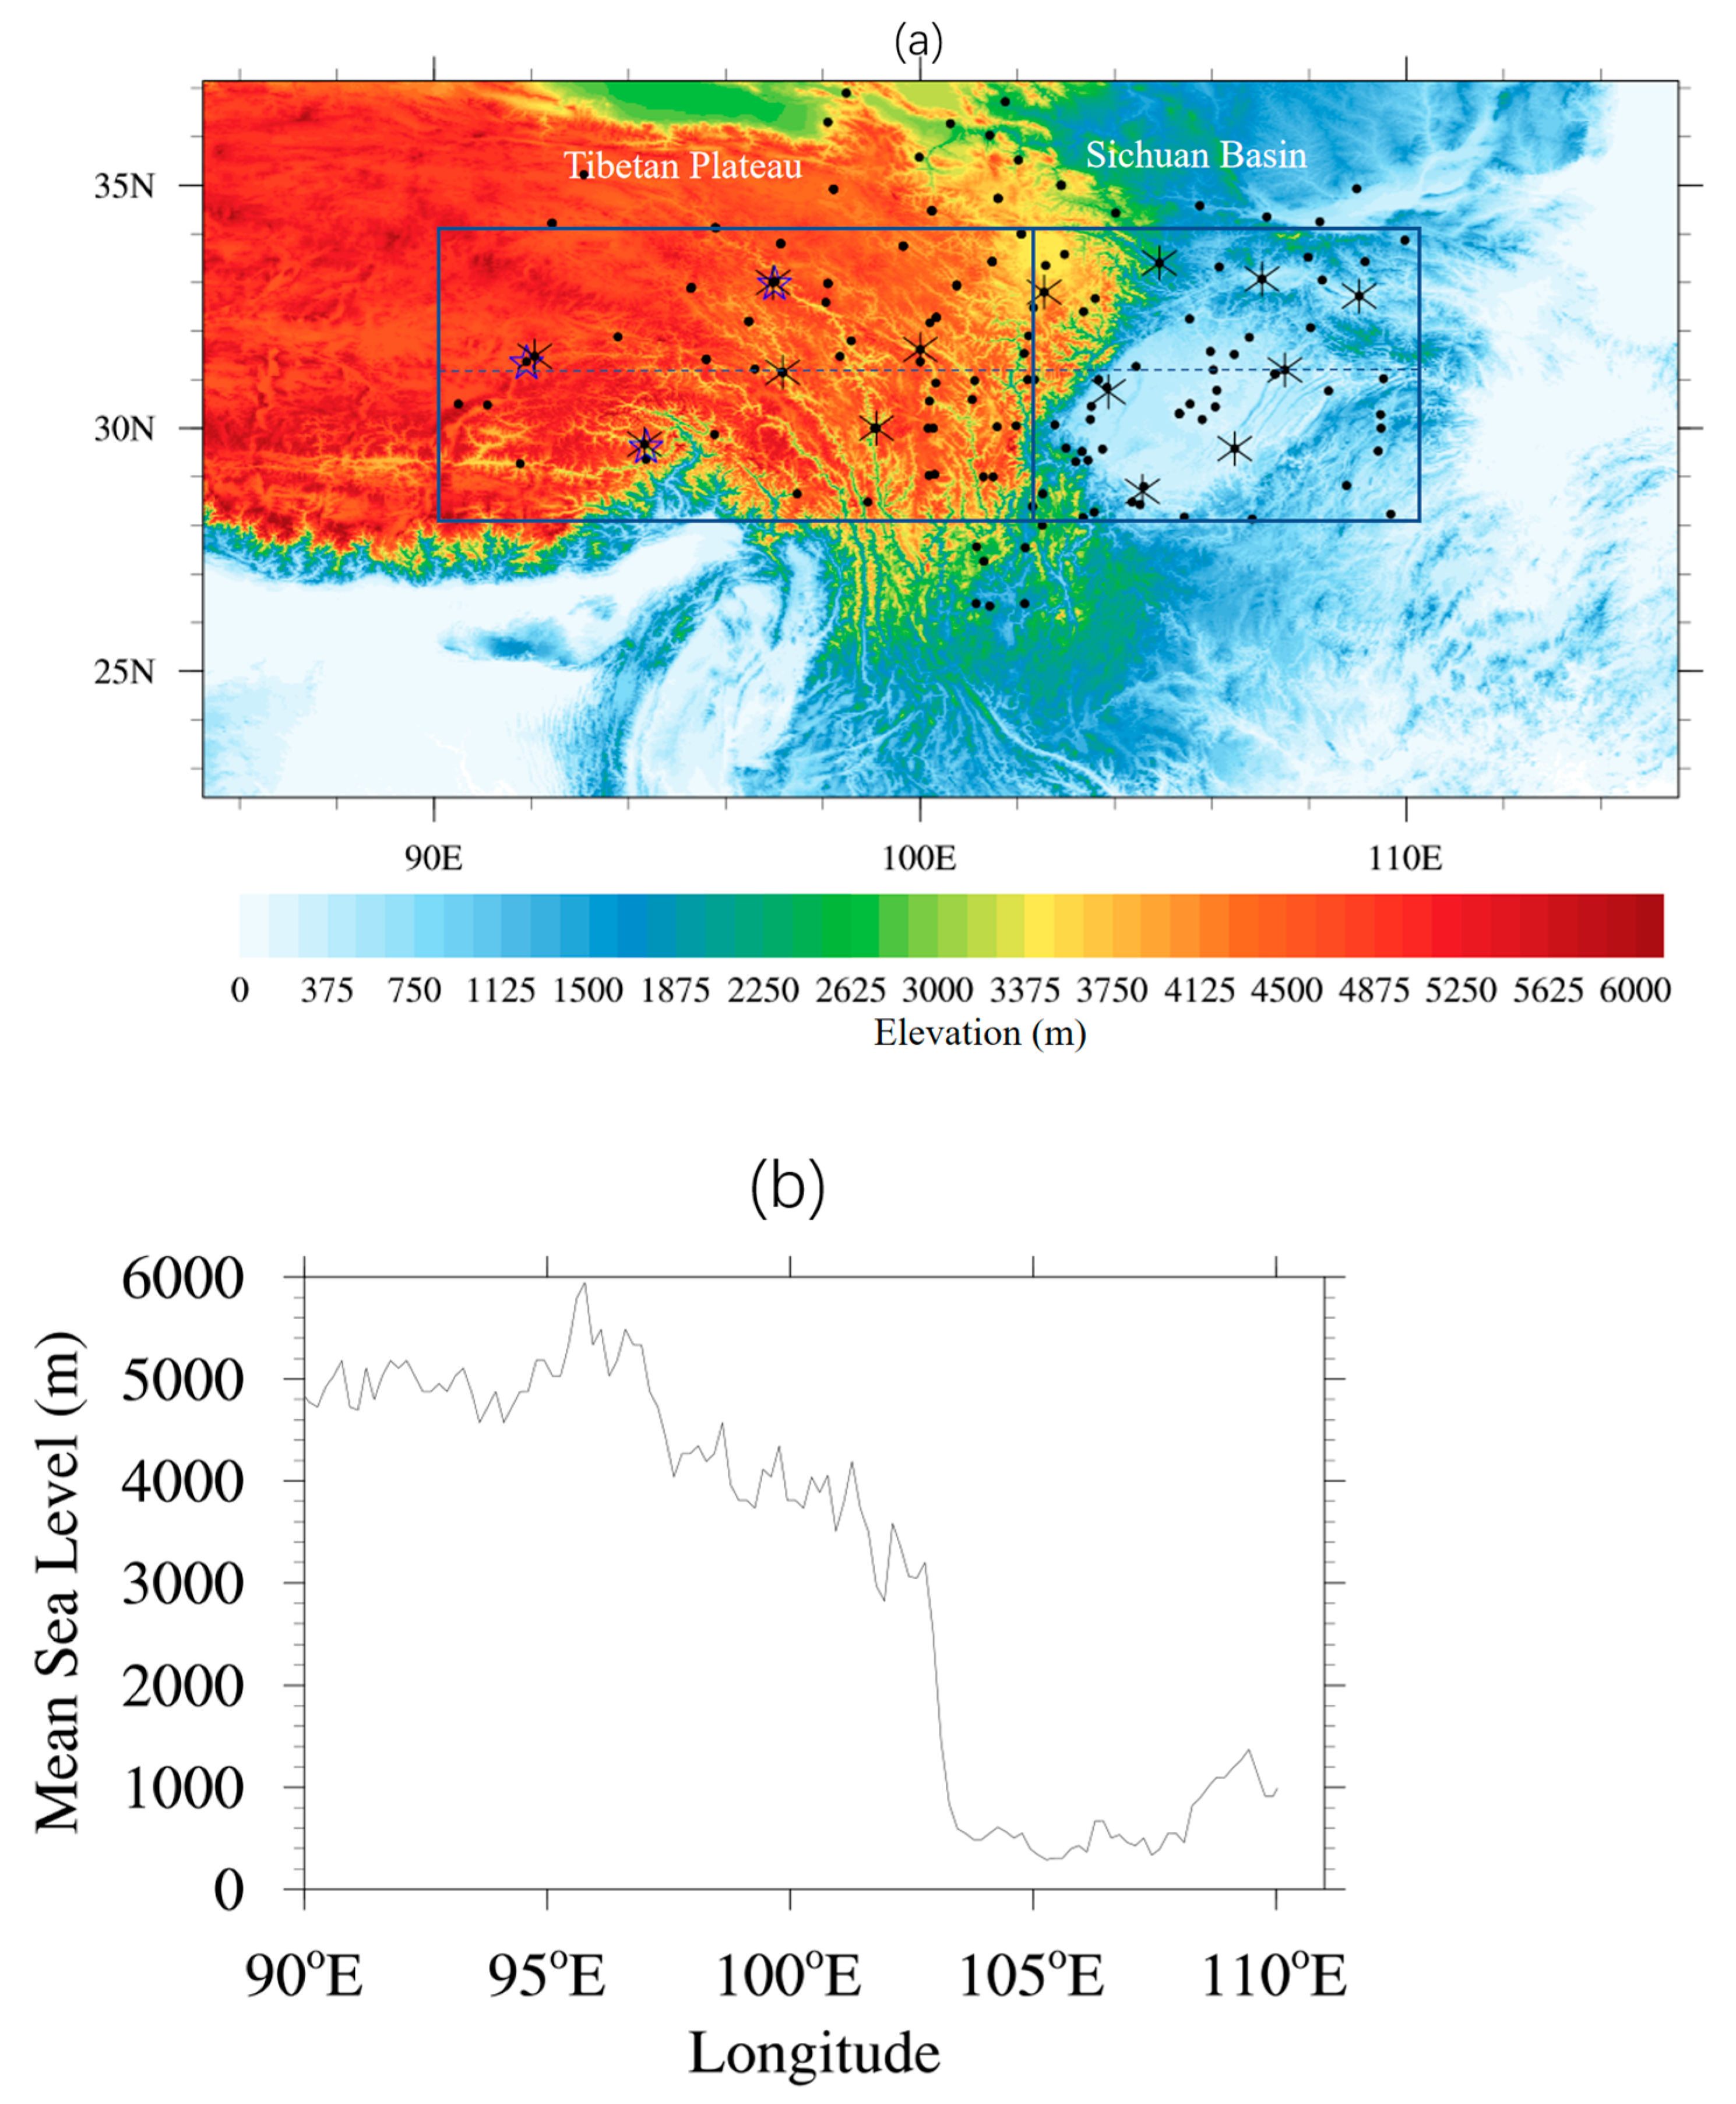
2. Data
2.1. Hydro-Estimator Satellite Rainfall Estimates
2.2. Ground Observational Data
2.3. ERA5 Reanalysis Dataset
3. Methods
4. Results
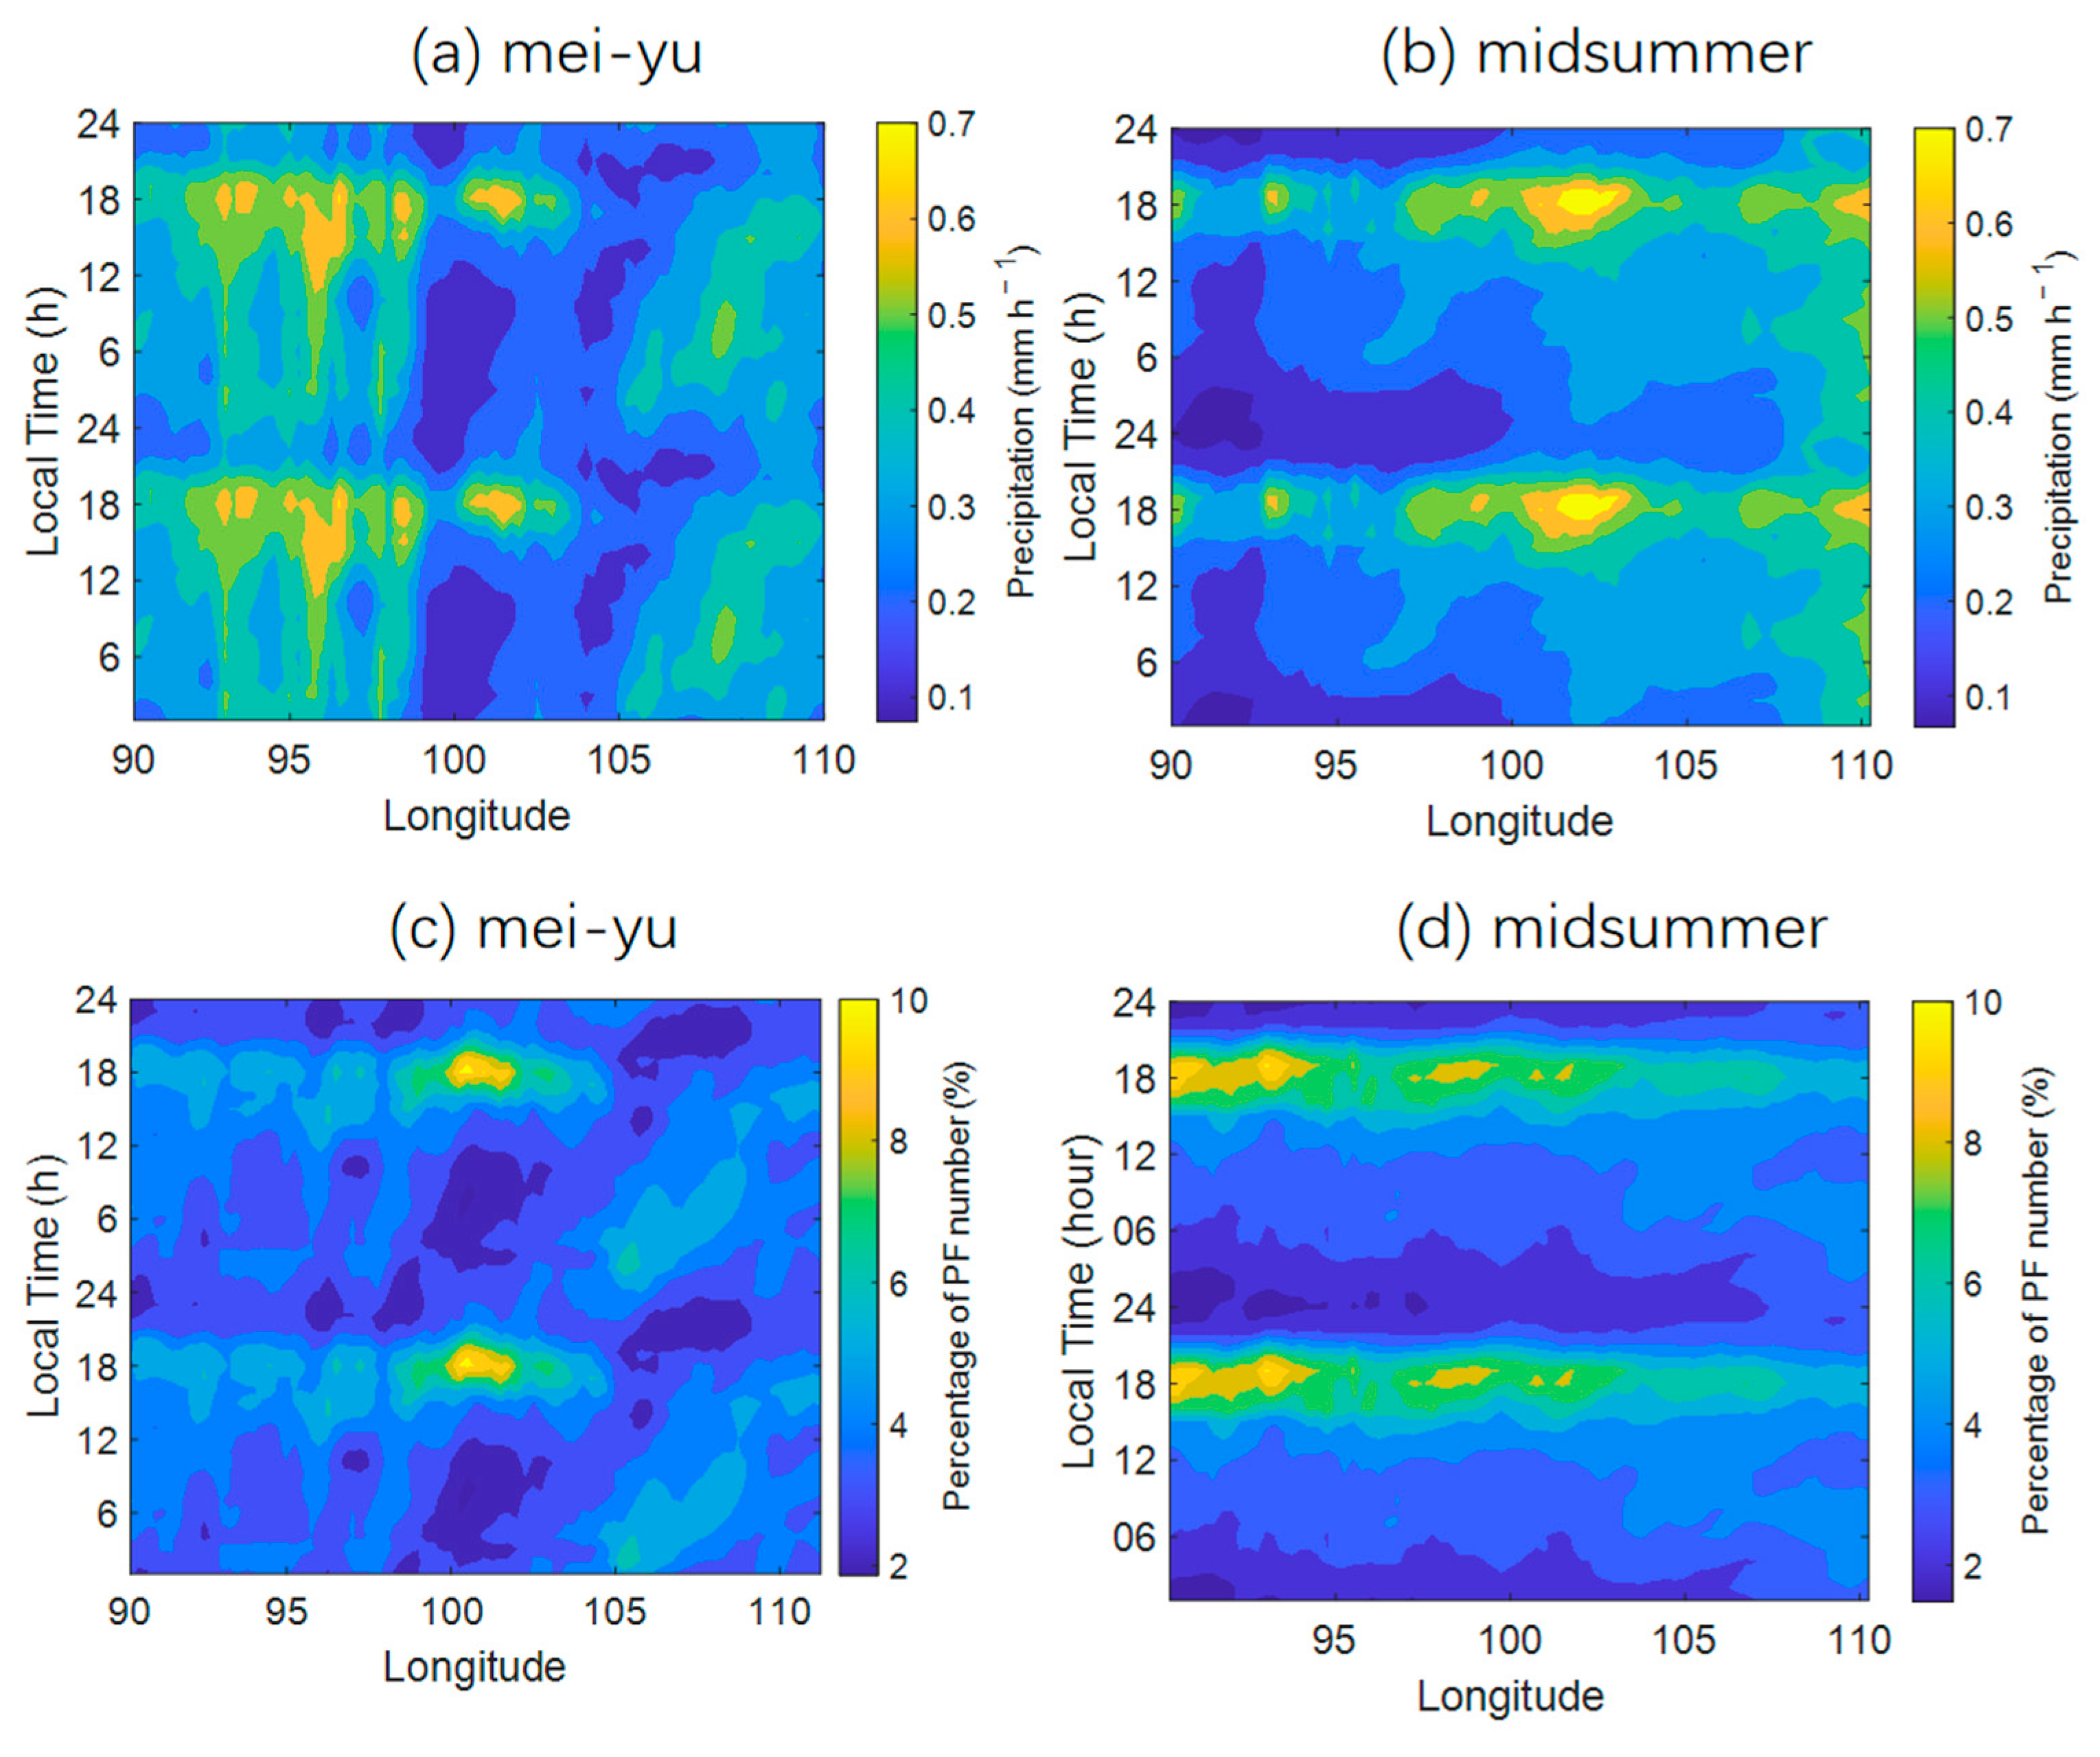
4.1. Diurnal Cycle of Precipitation and Cloud
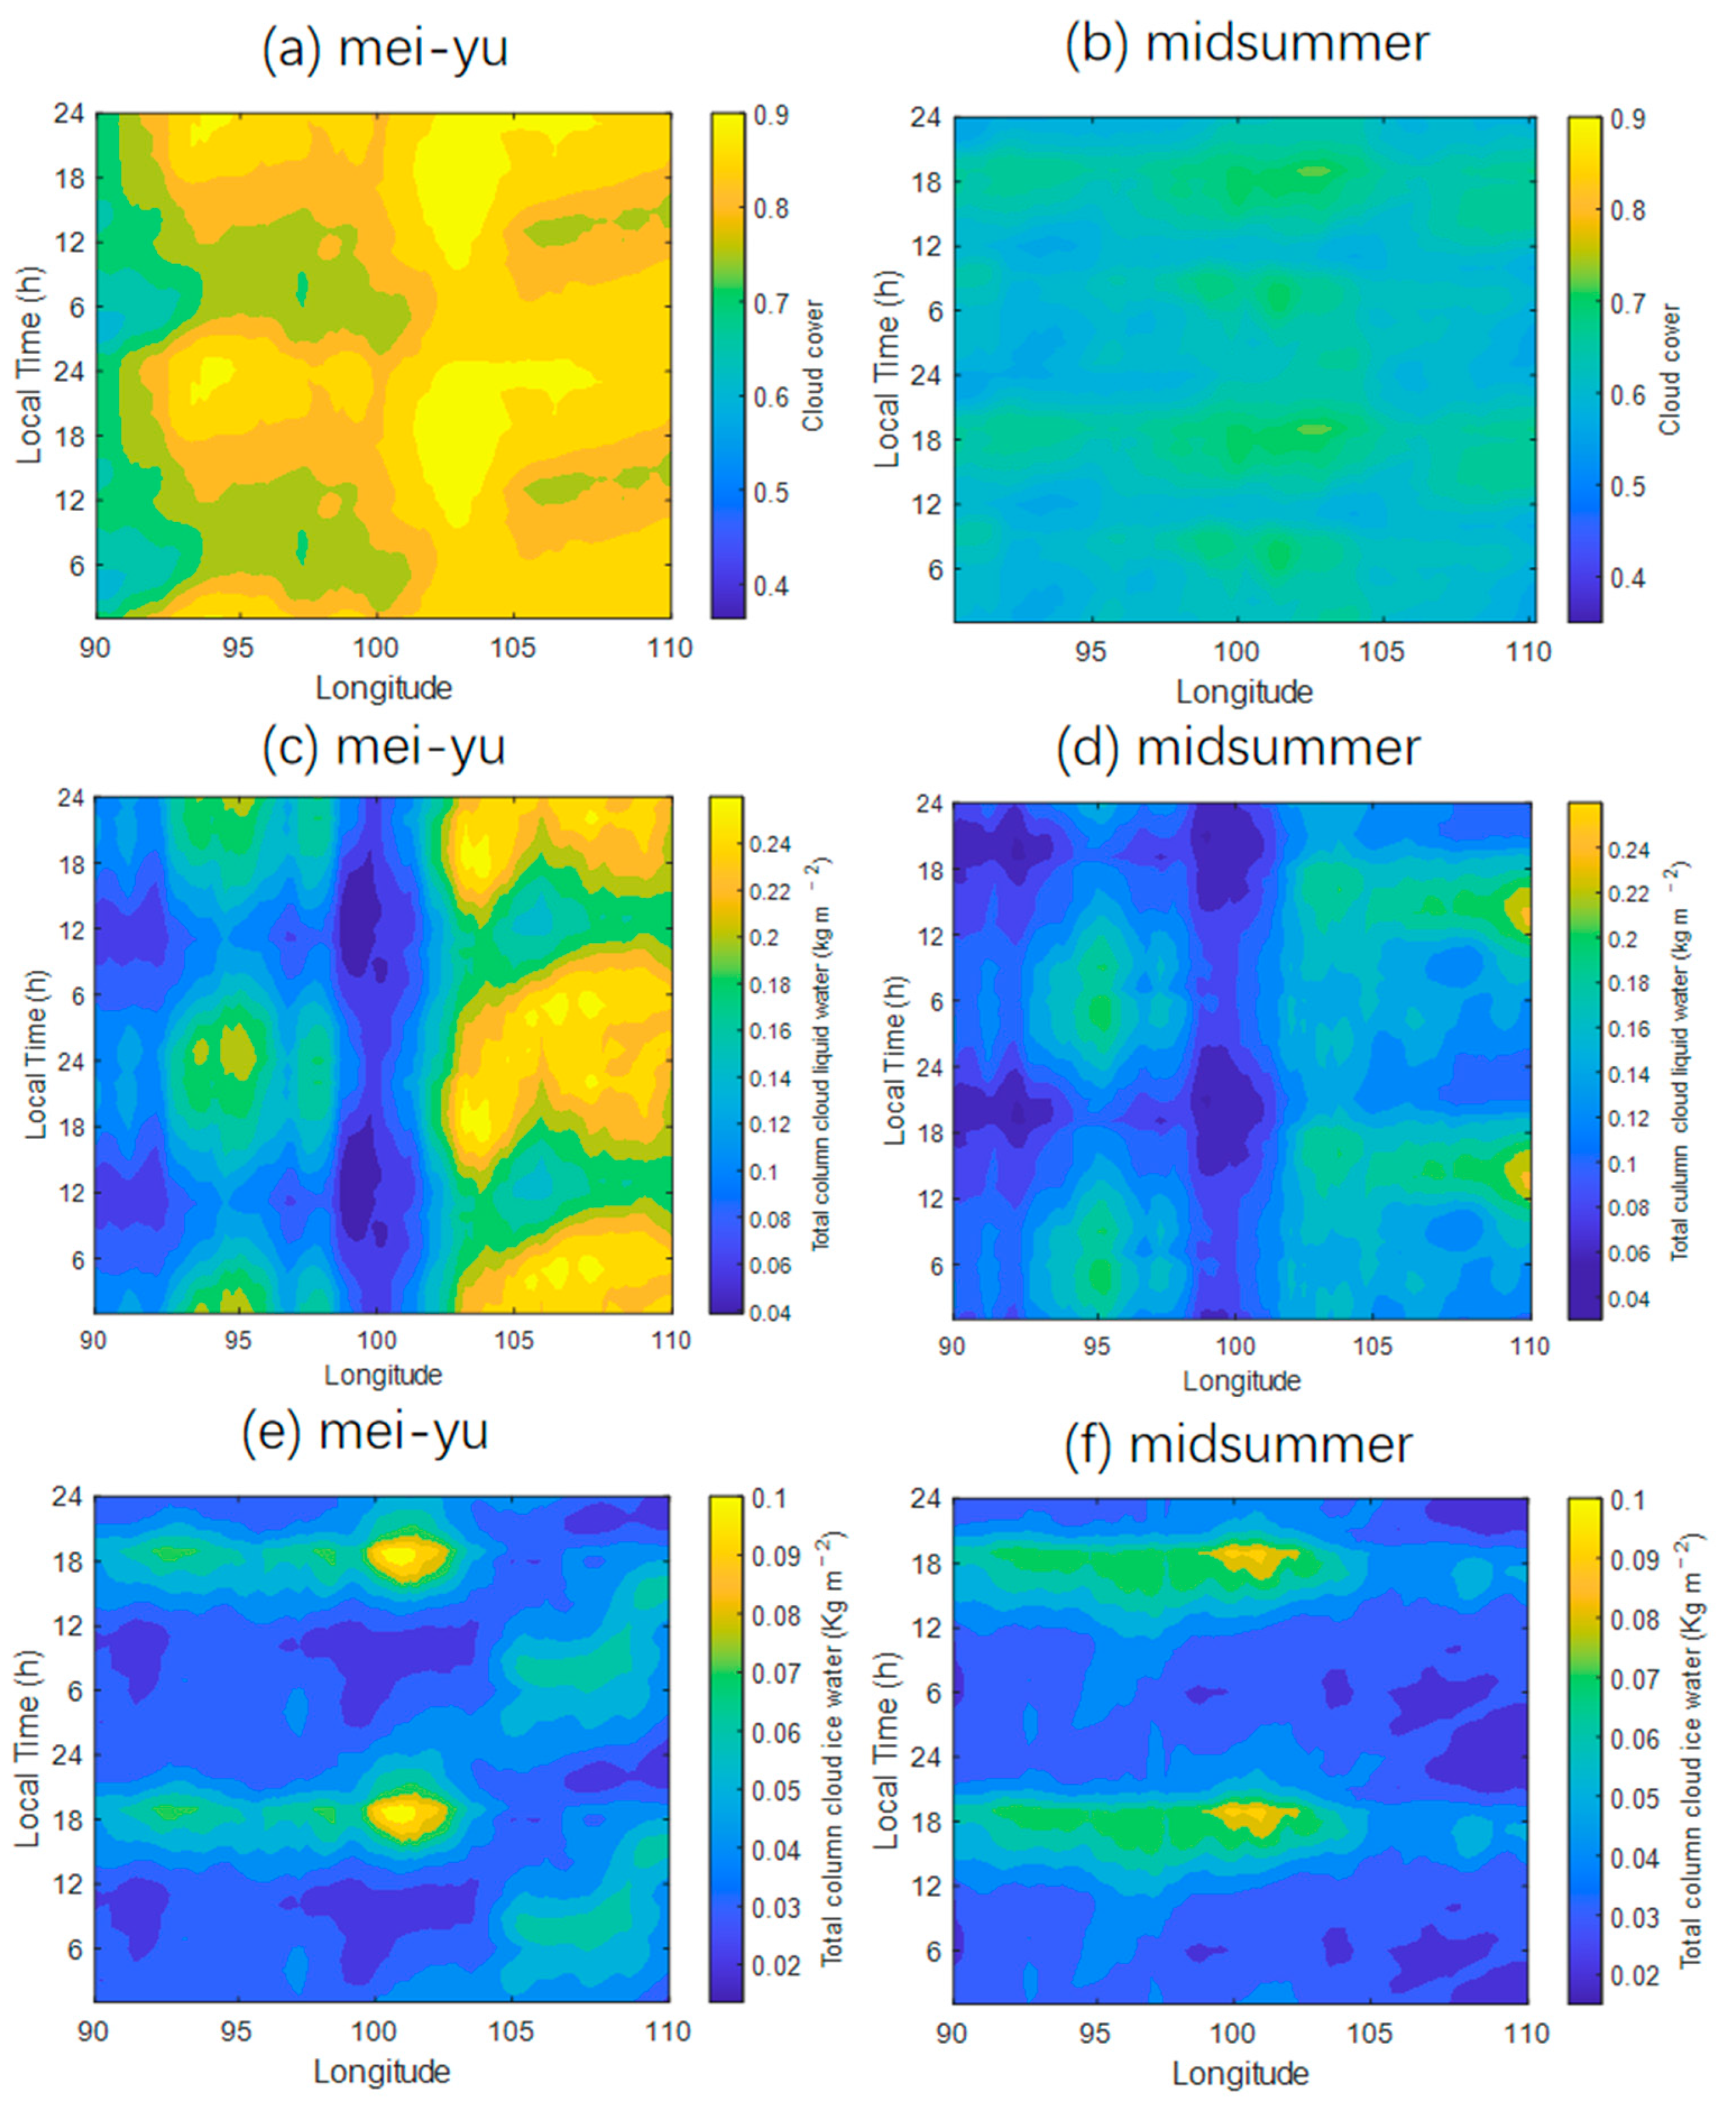
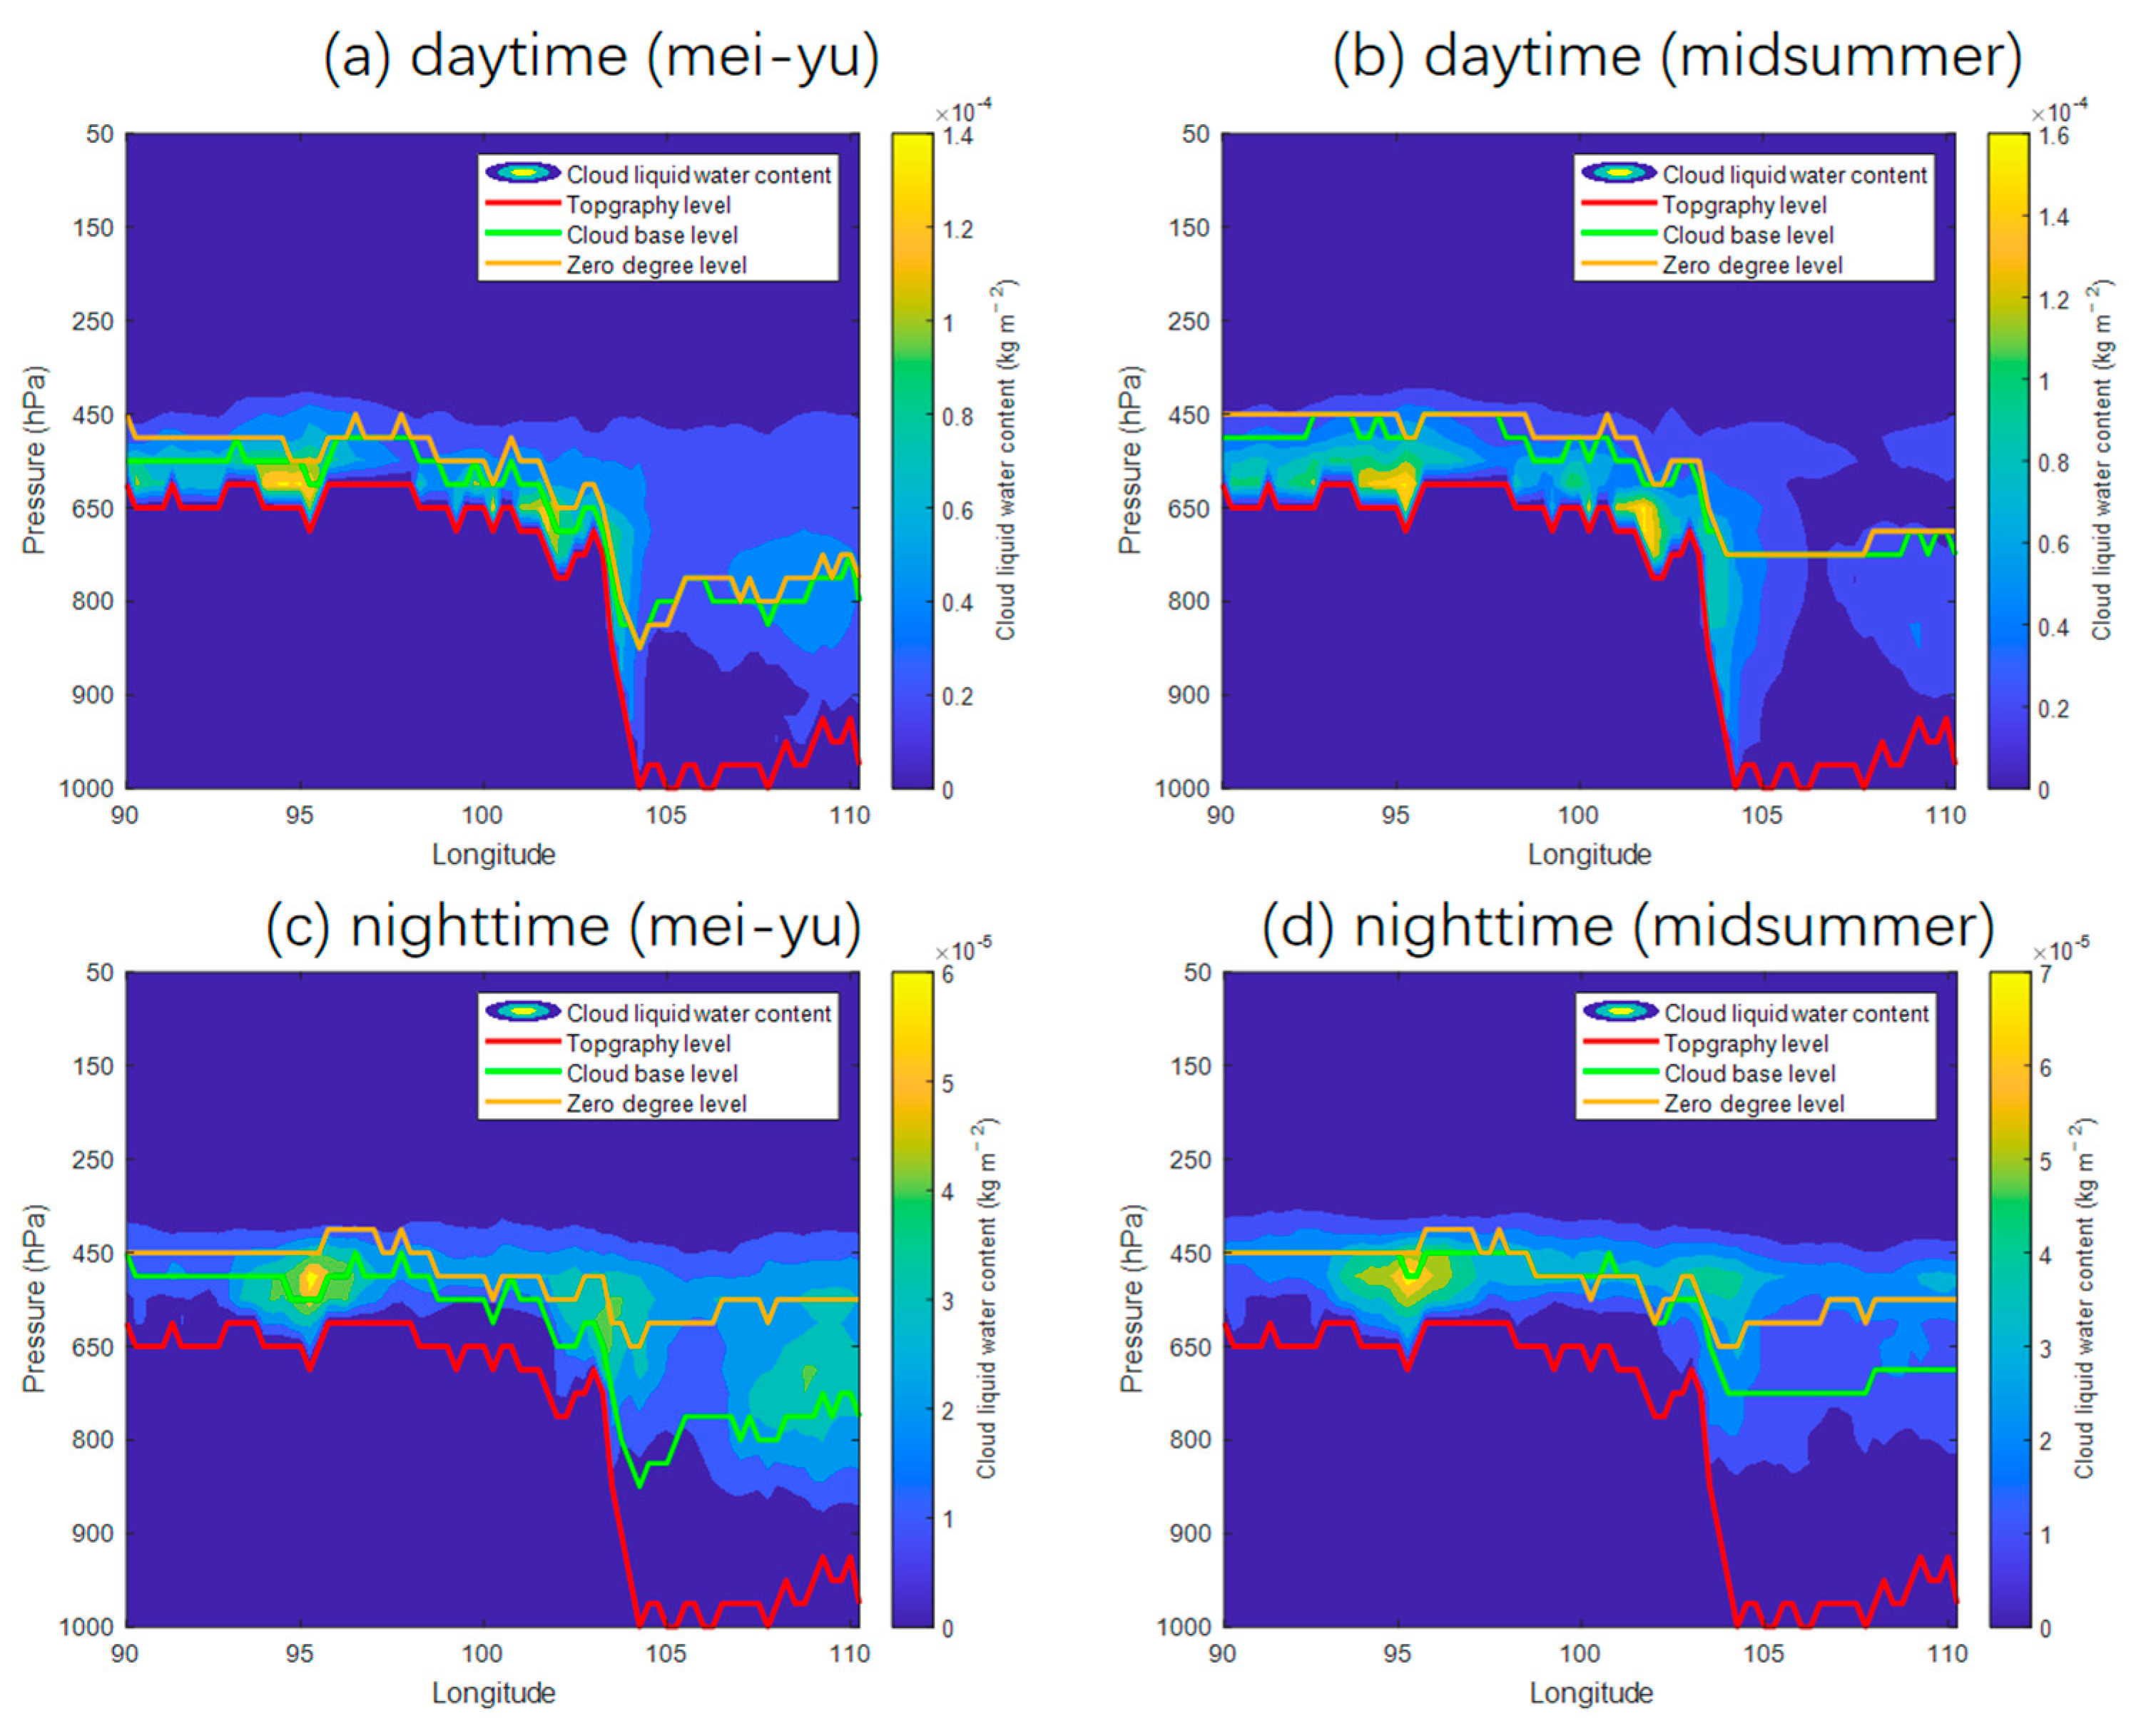
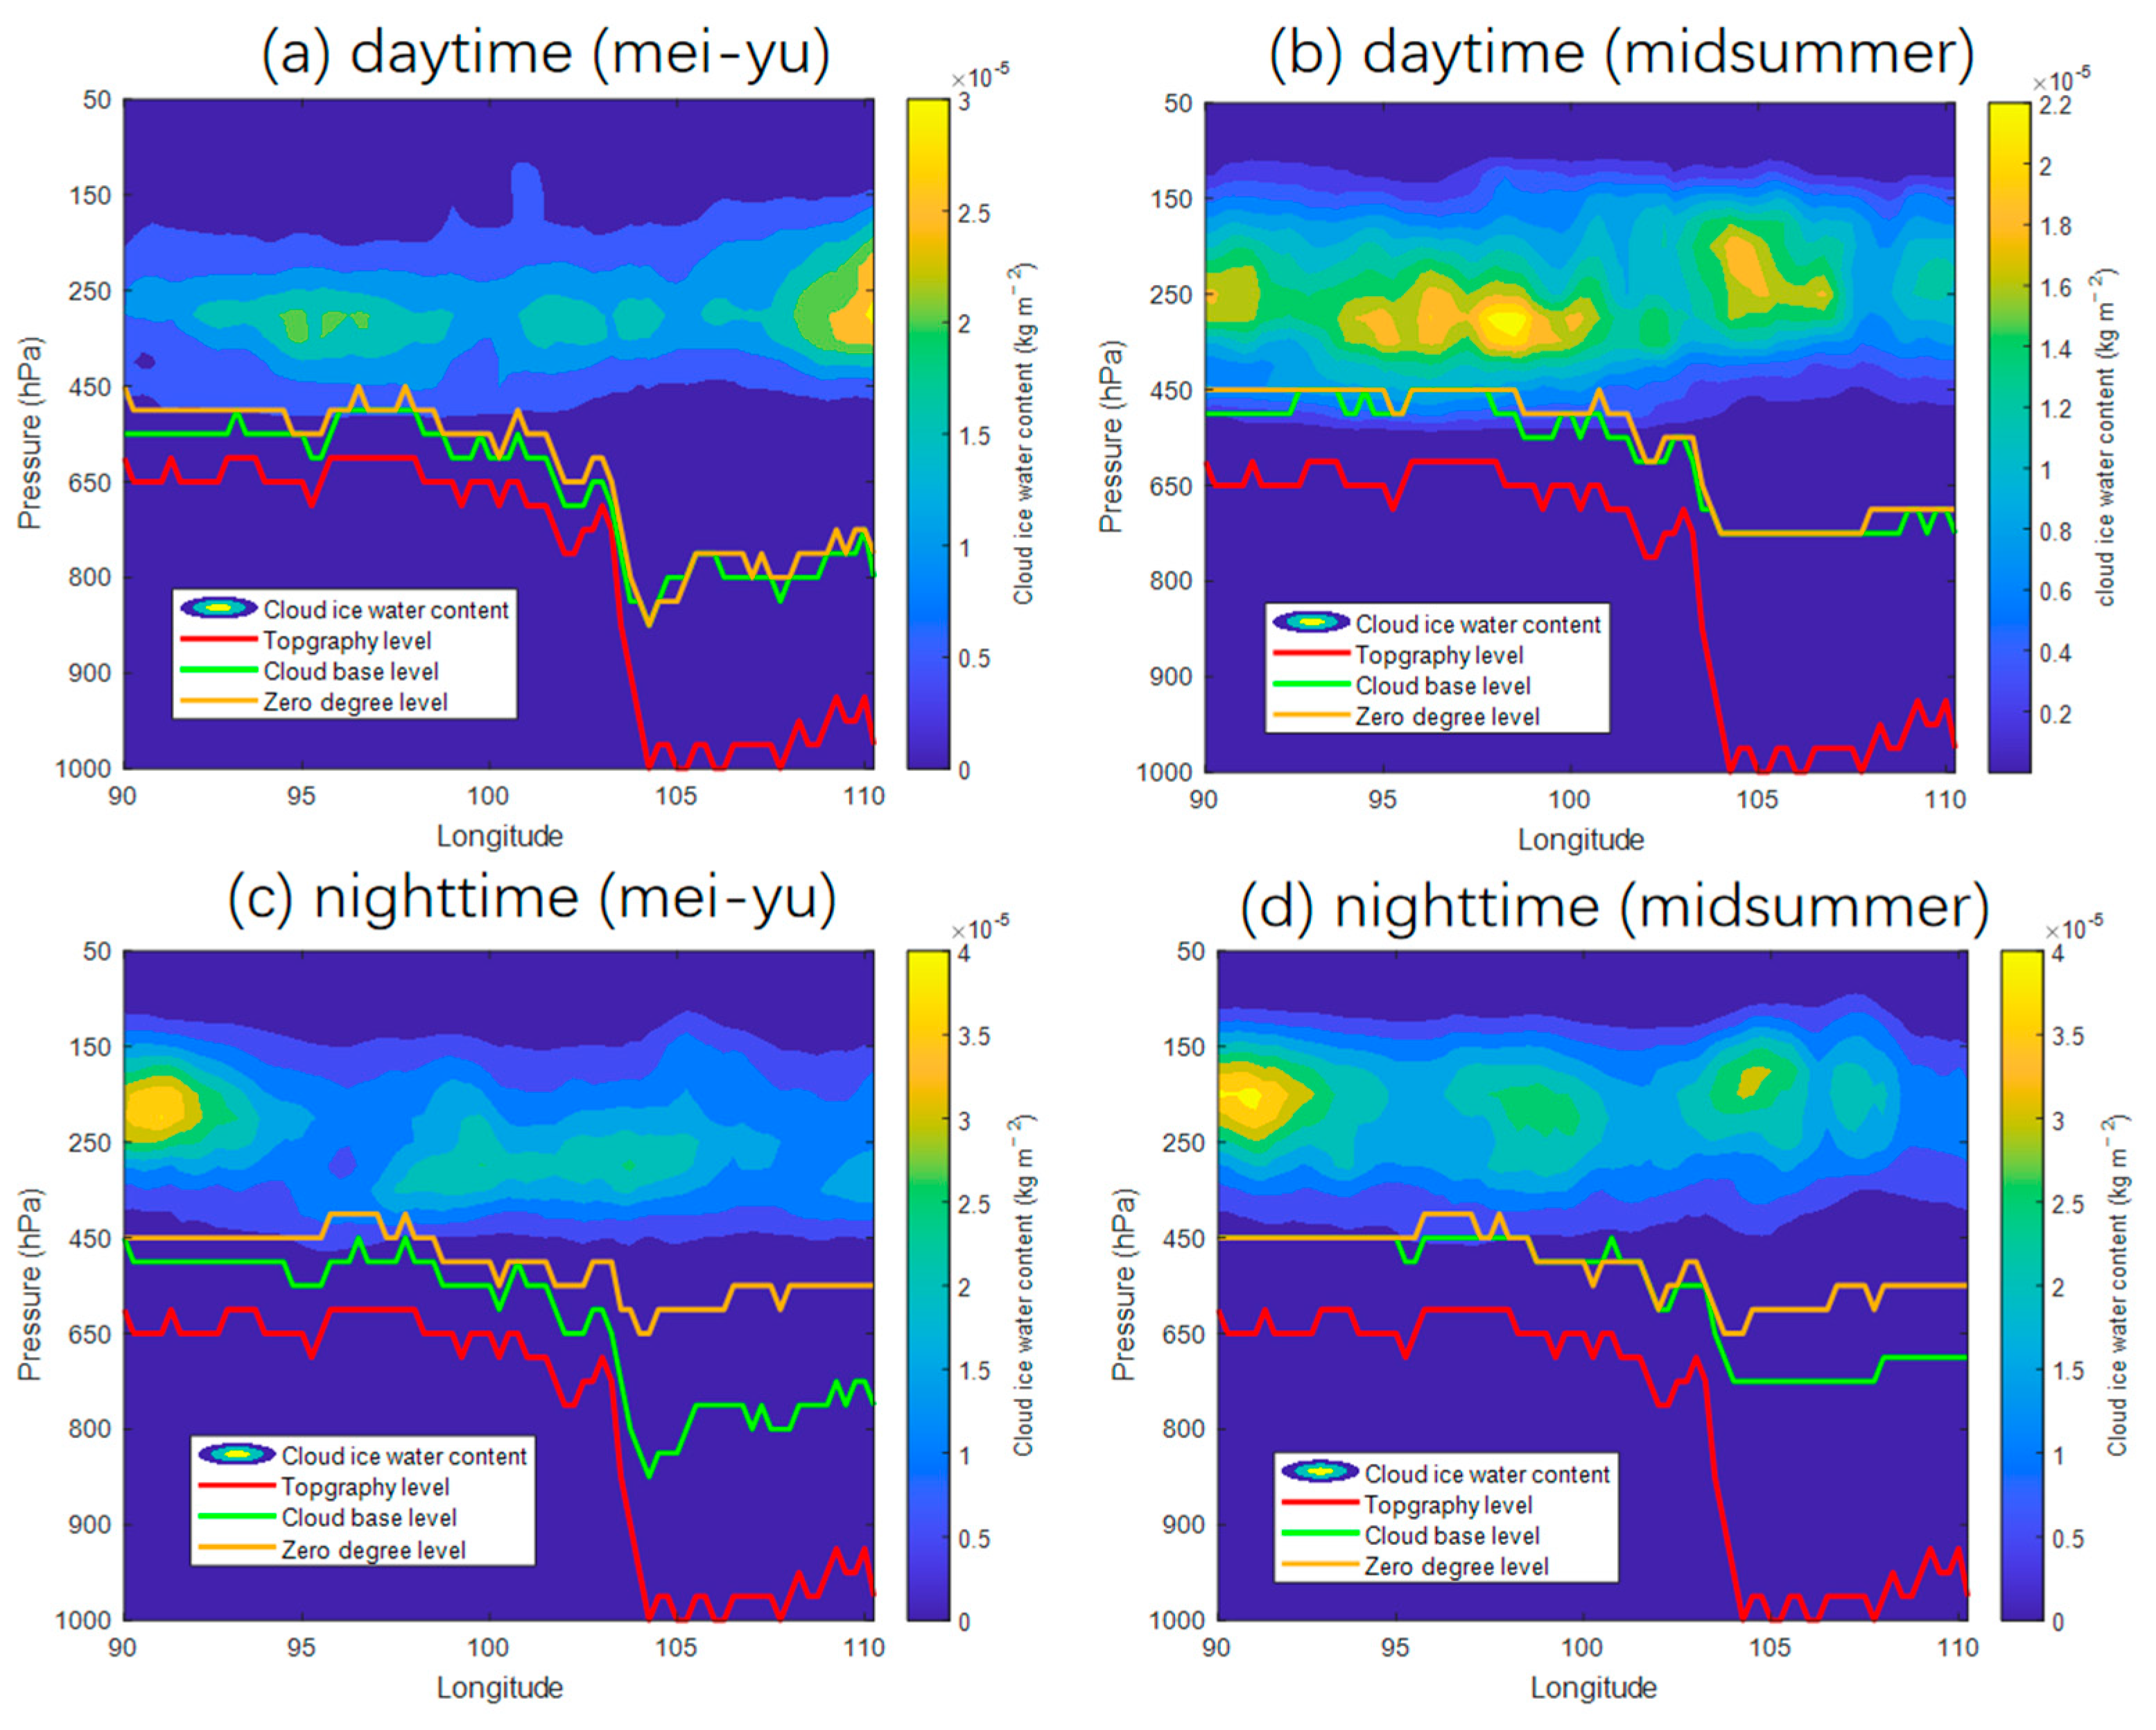
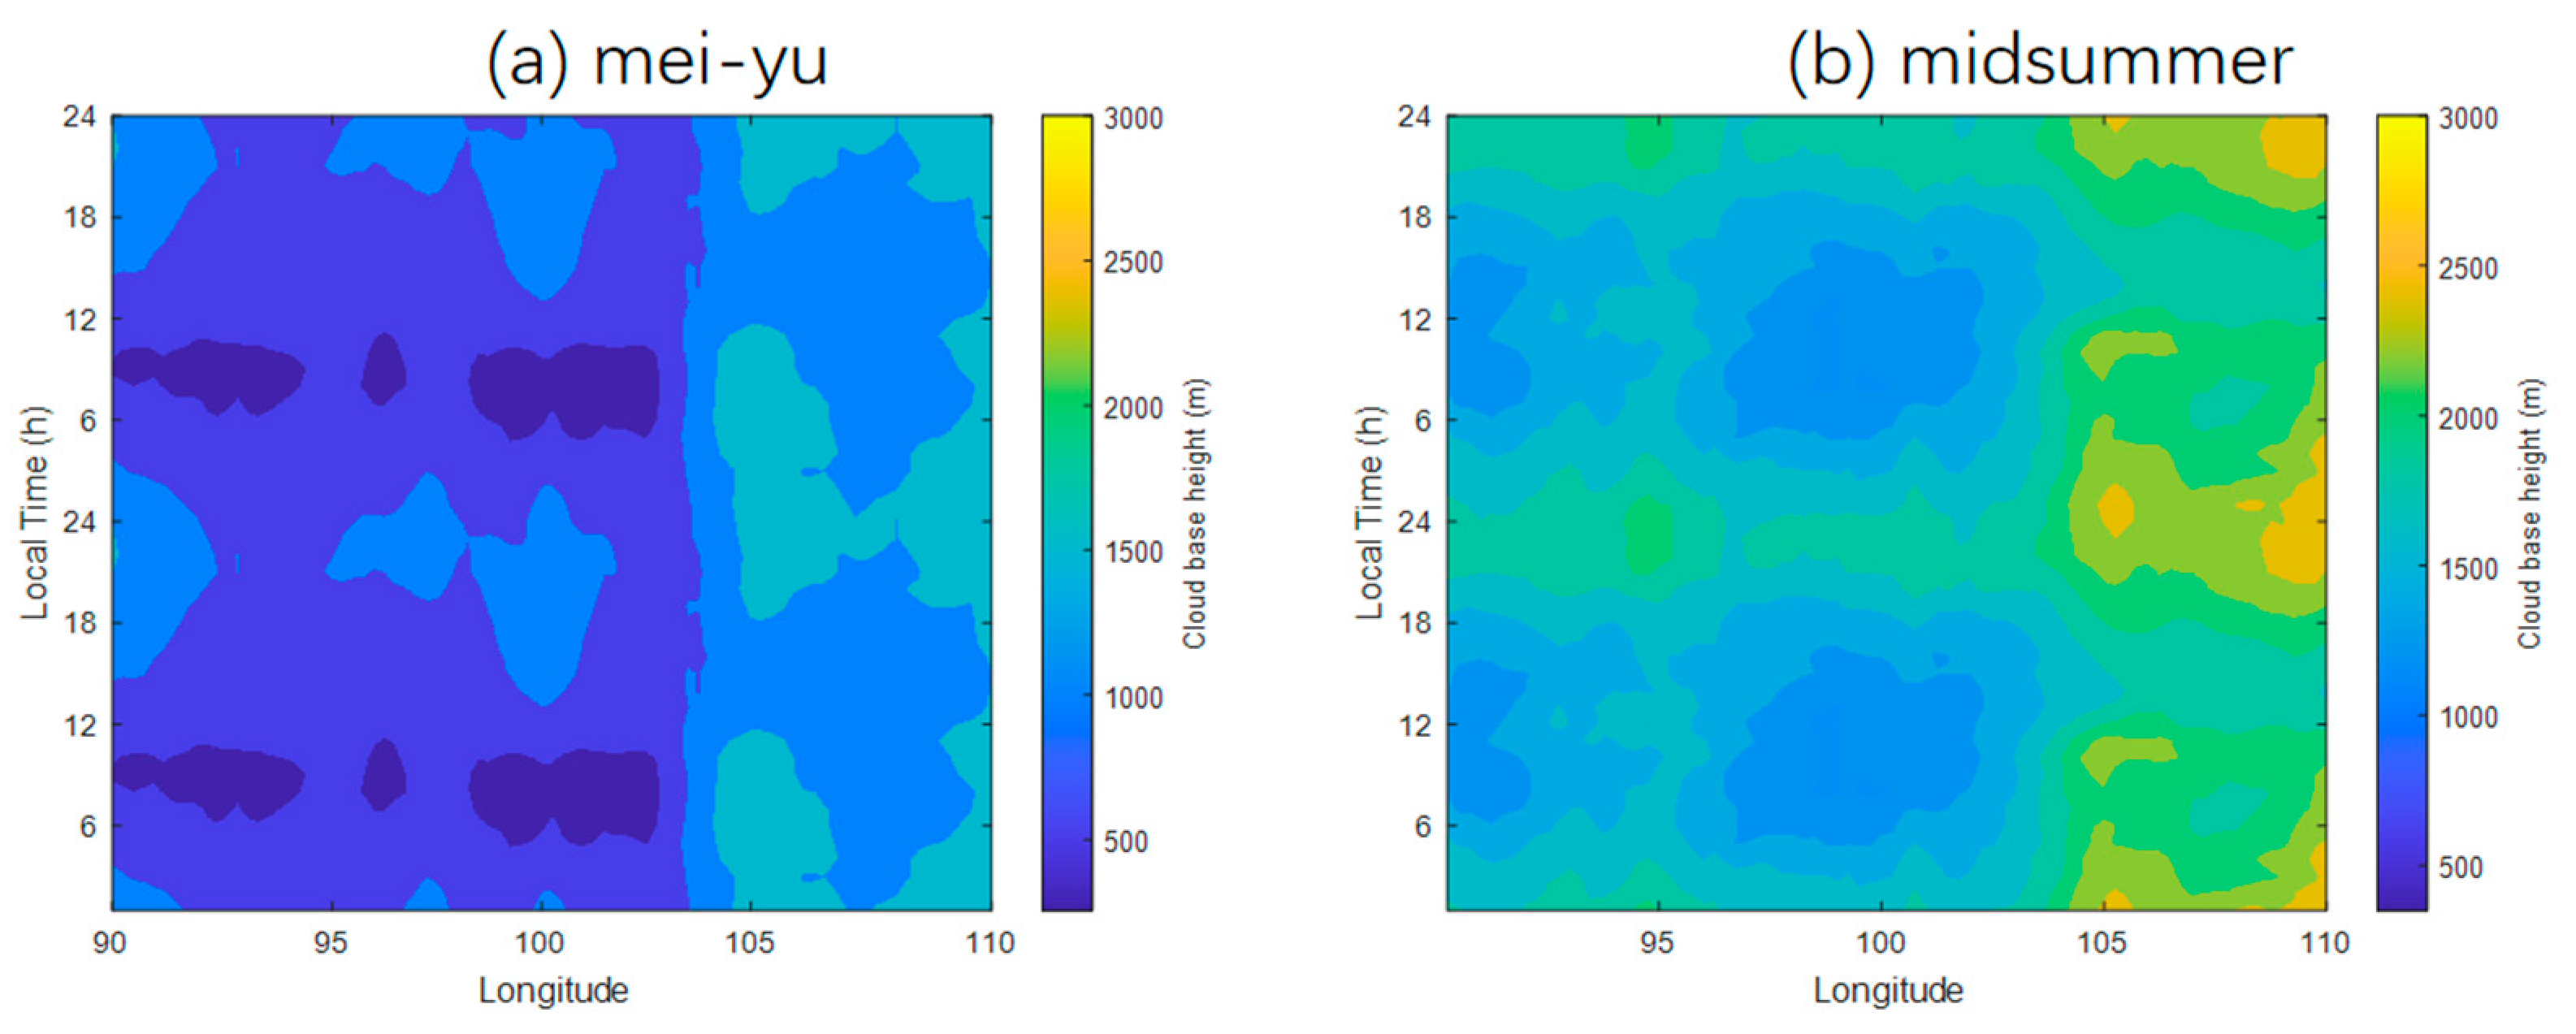
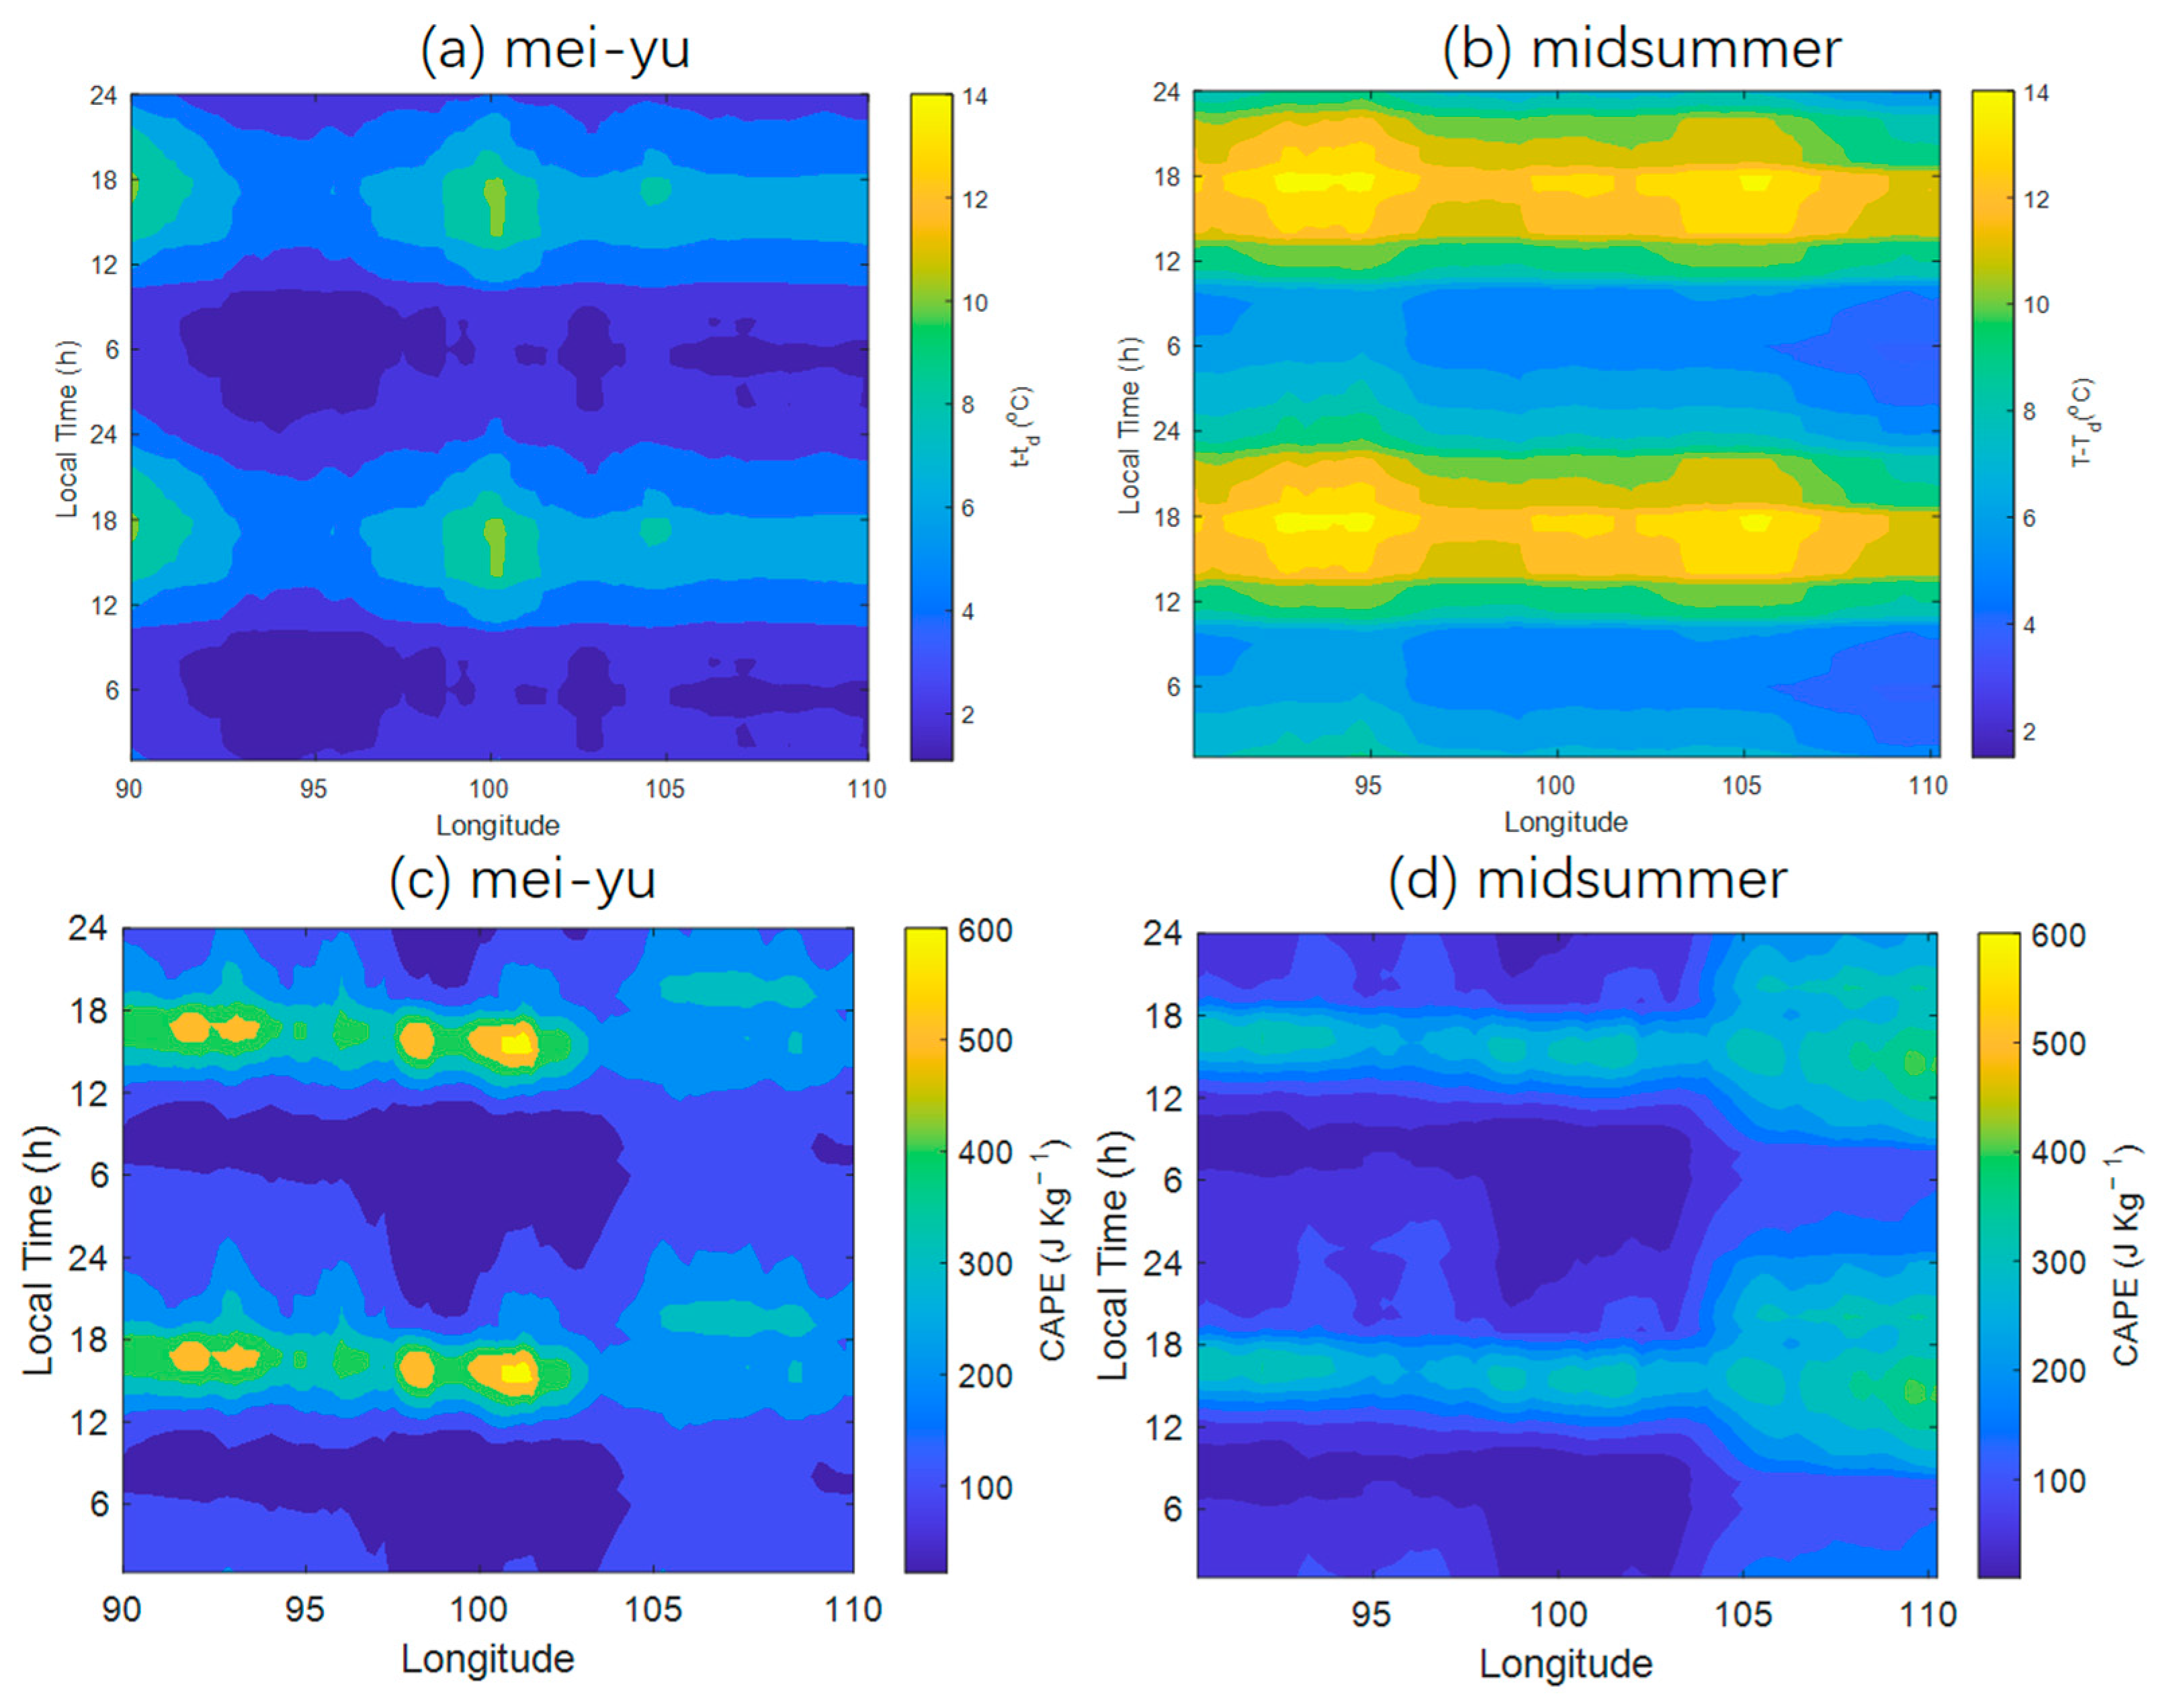
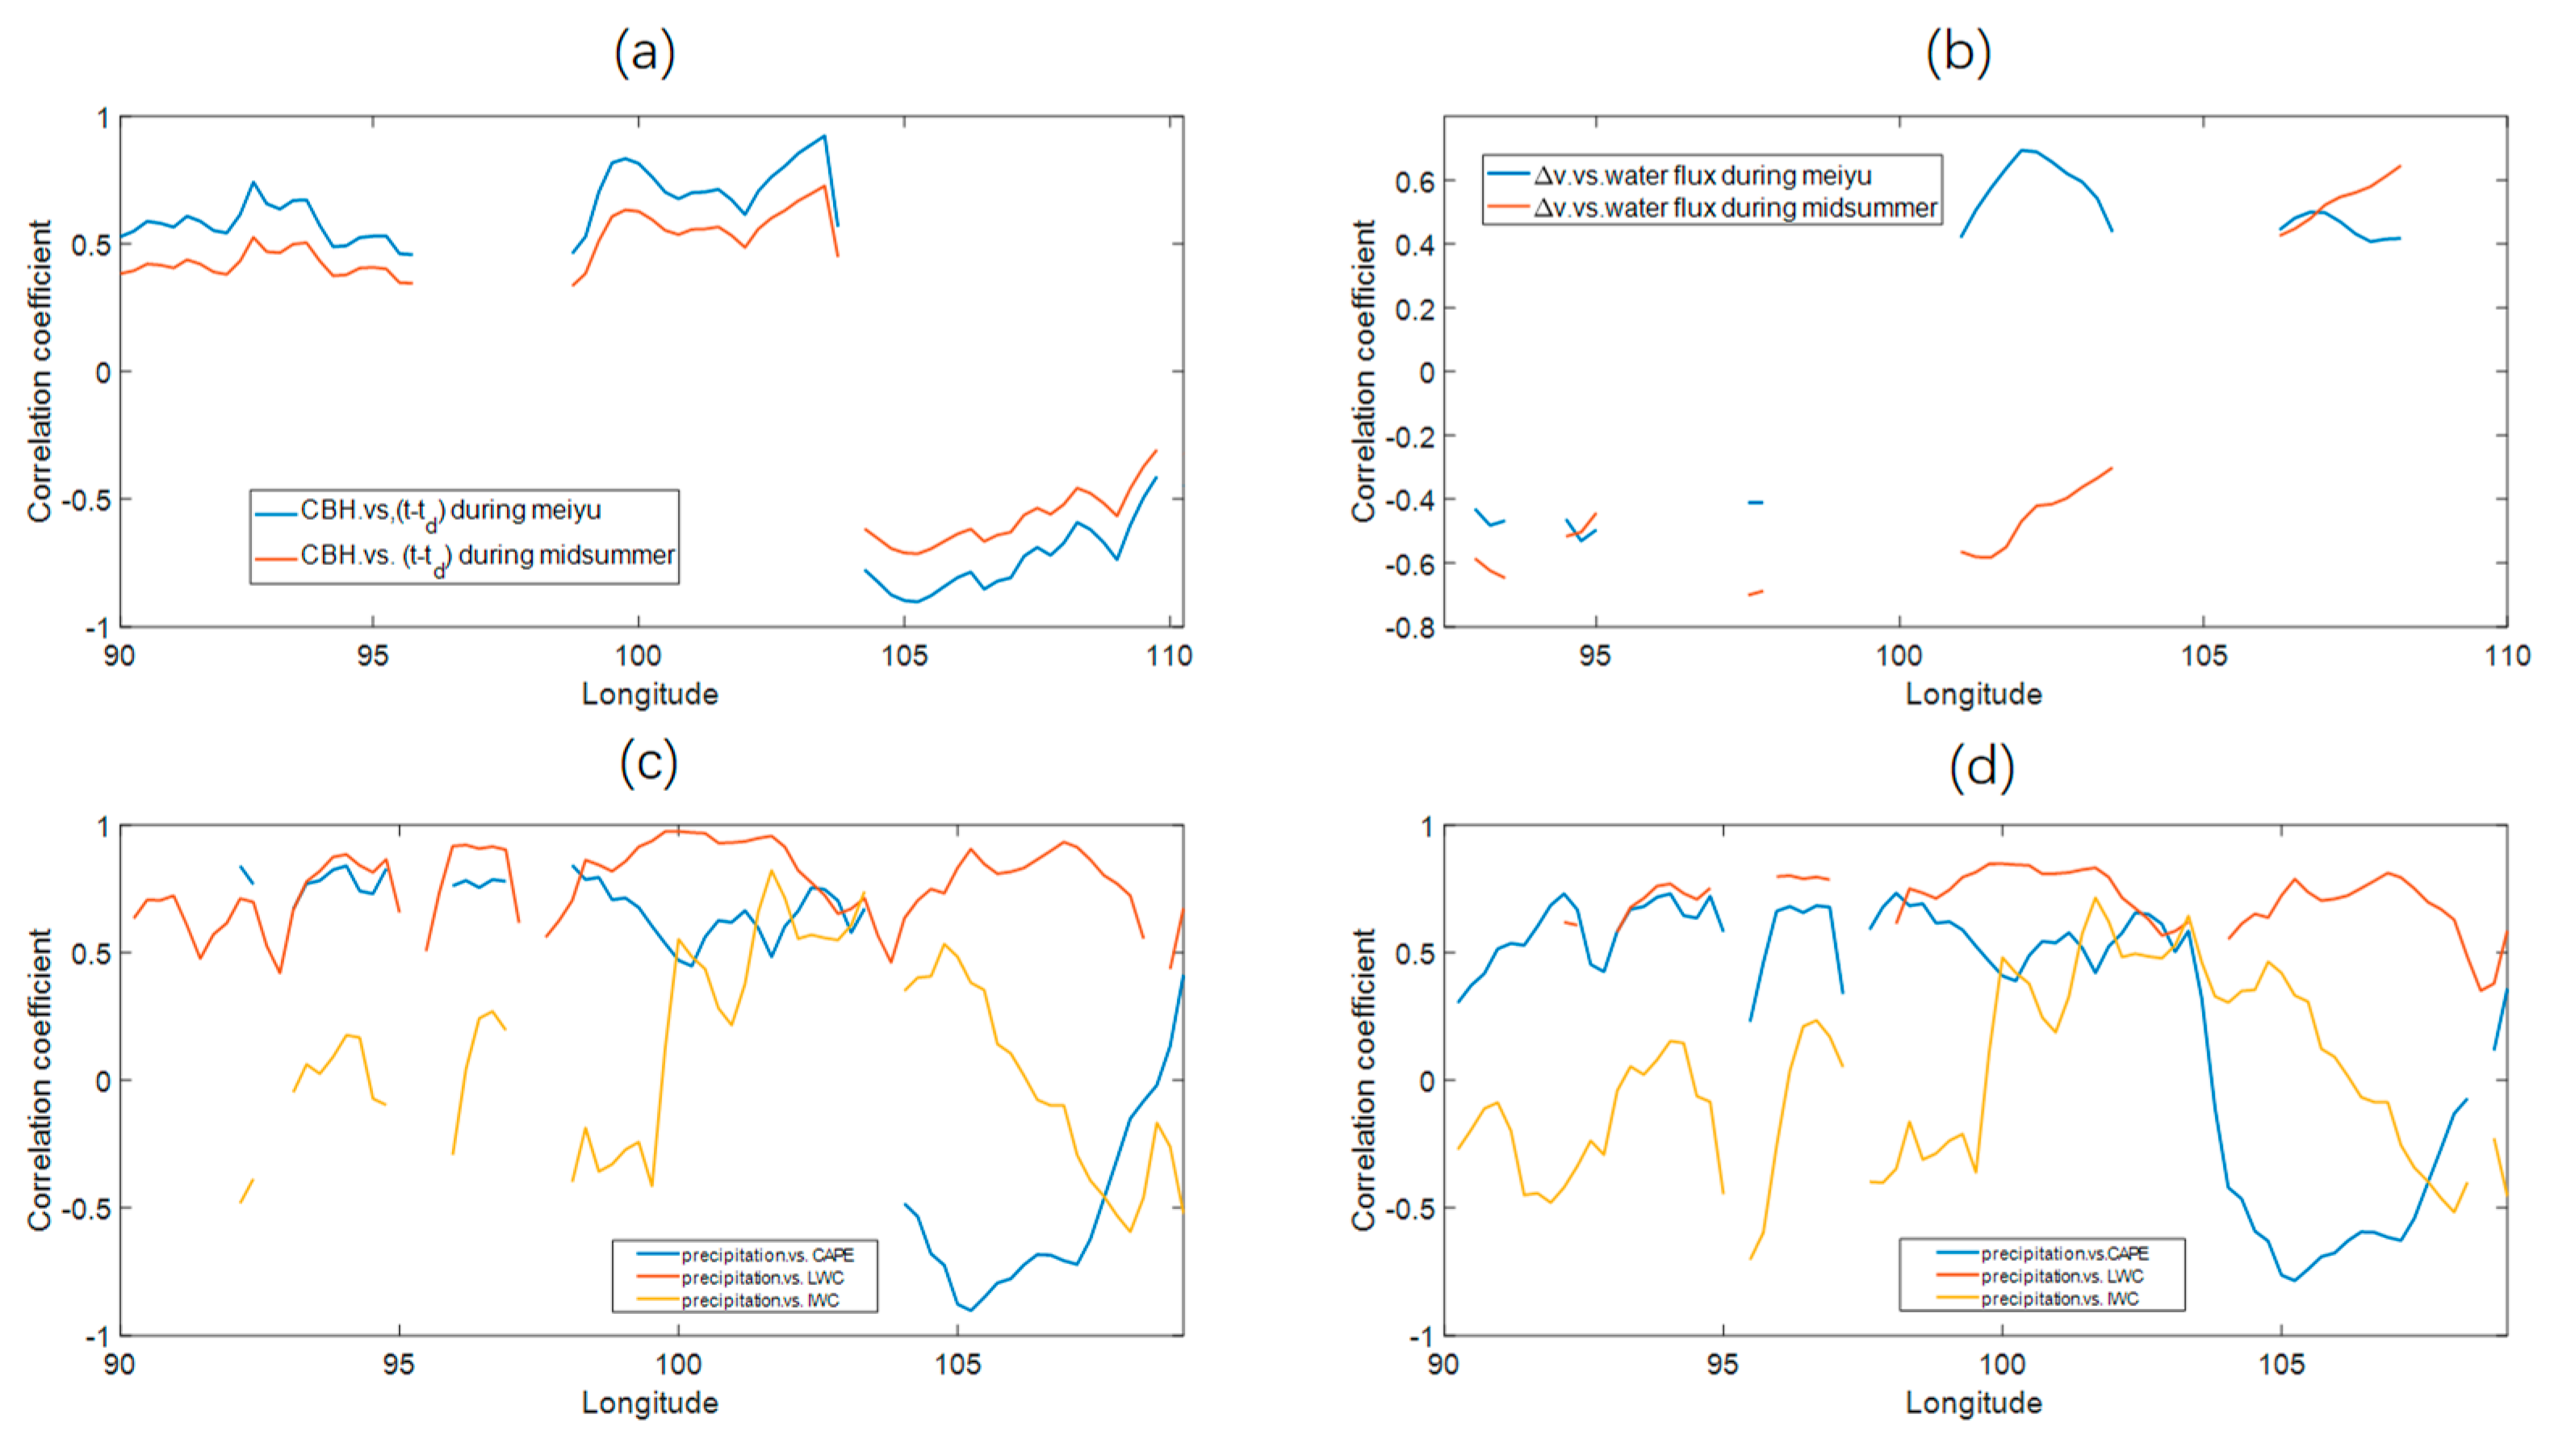
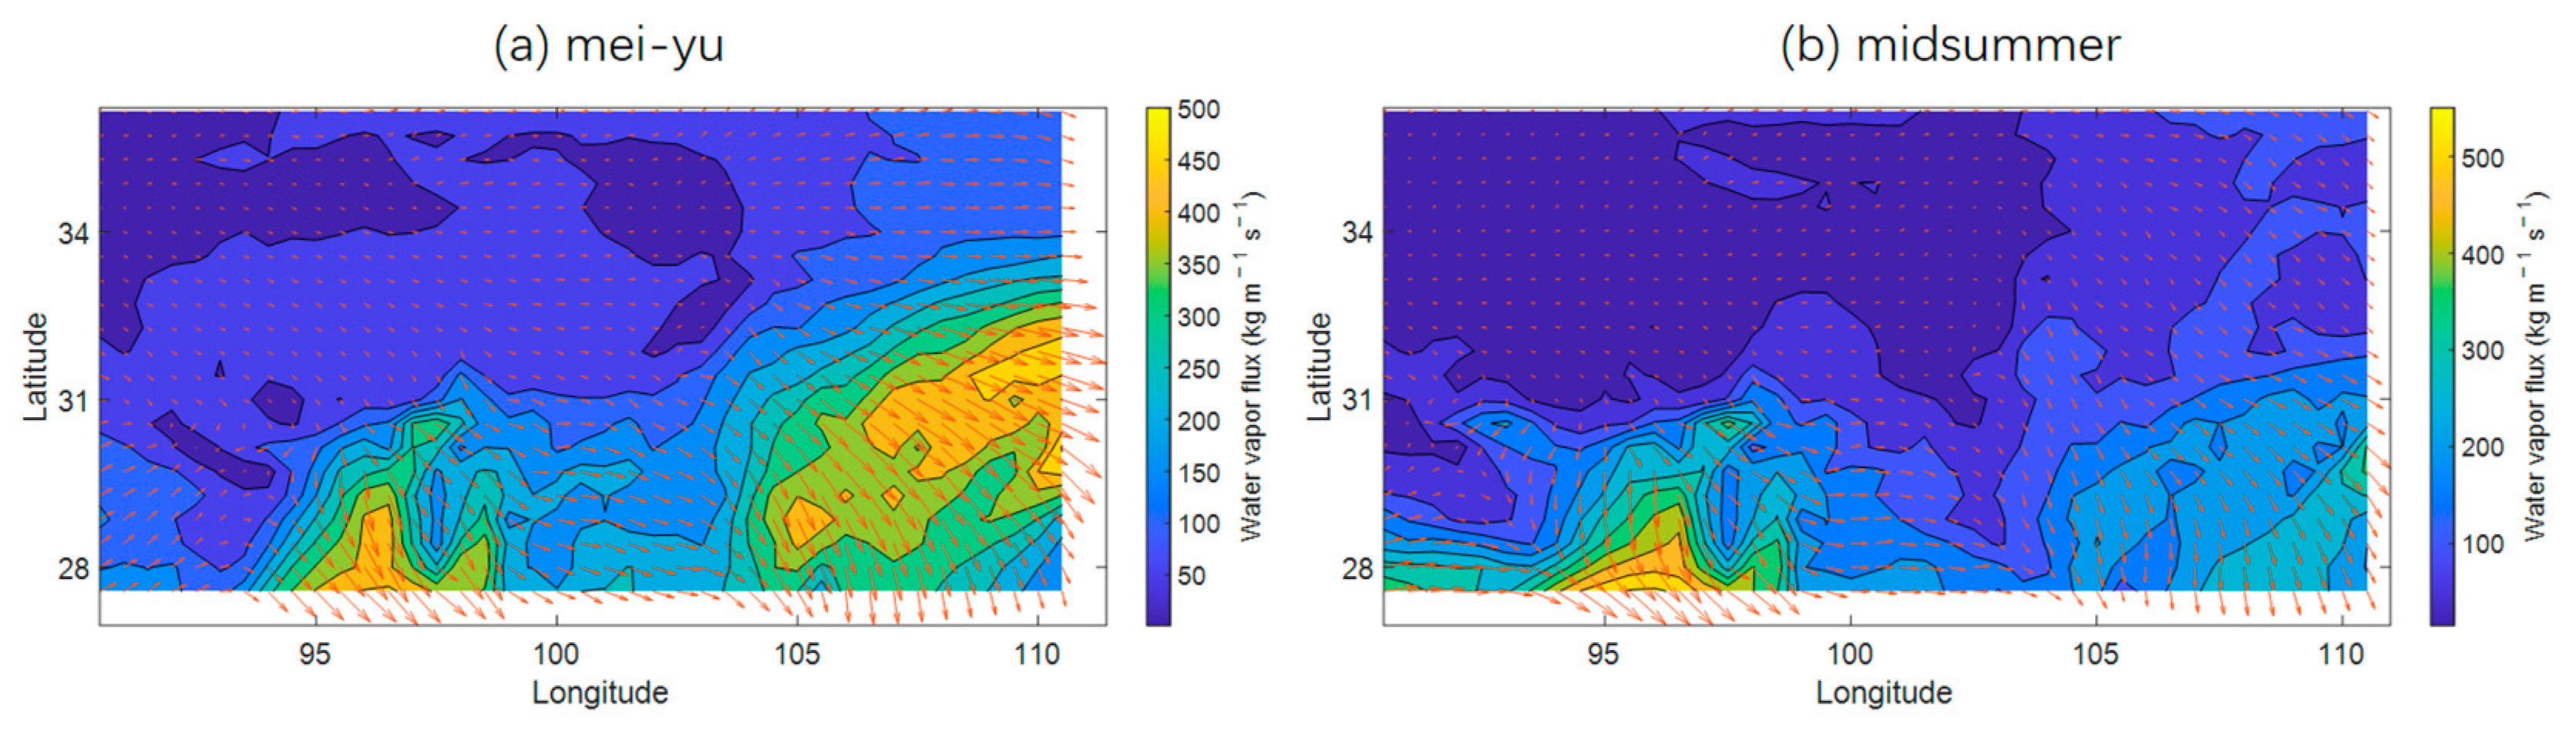
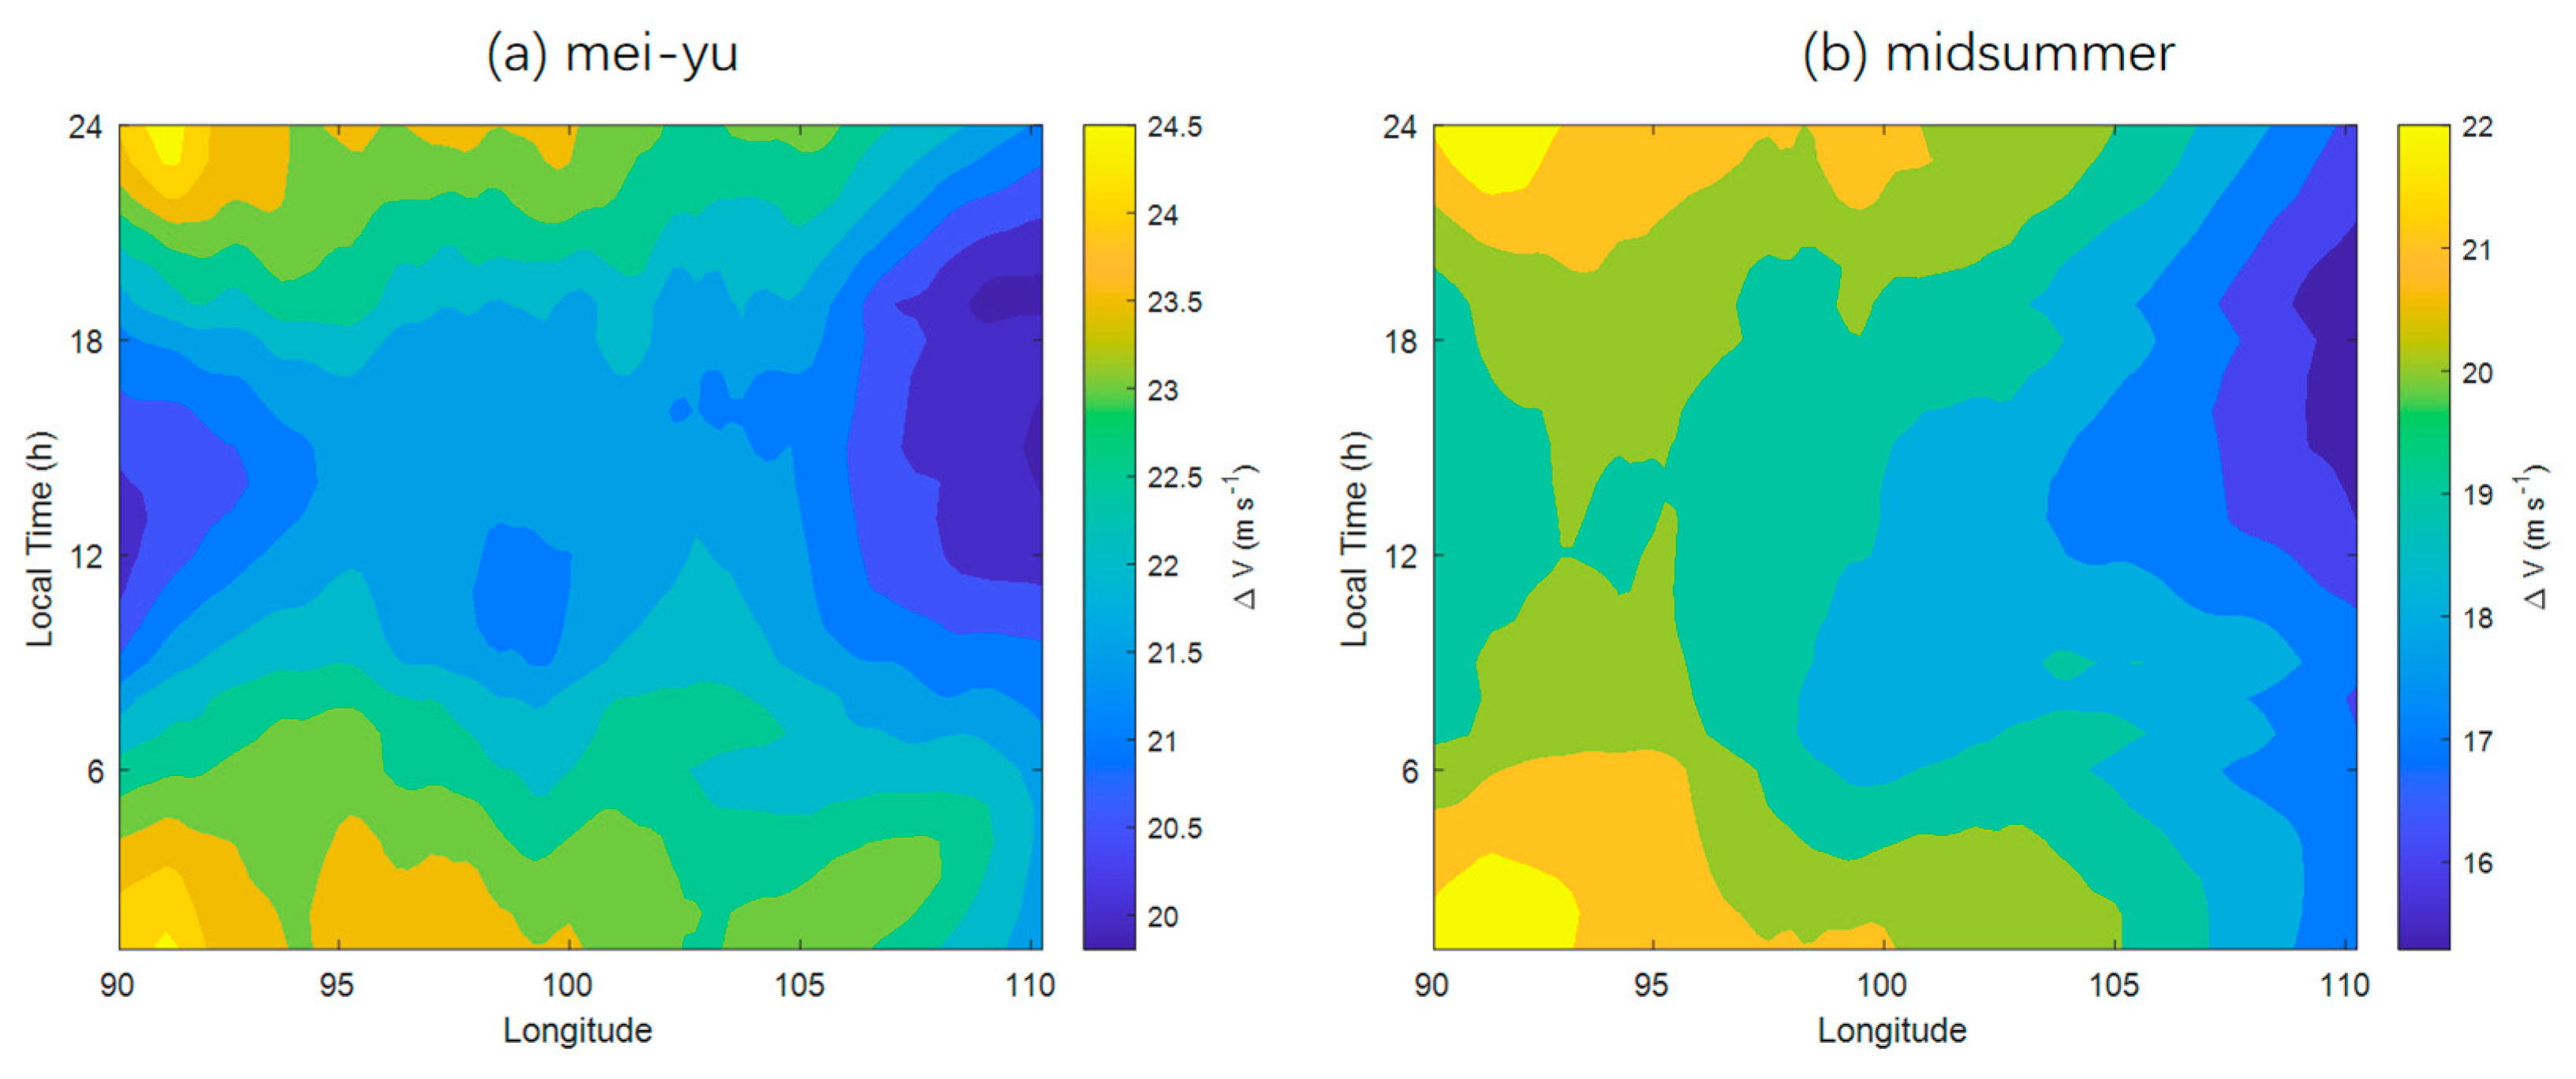
4.2. Factors Influencing the Formation of Cloud over the TP and SB
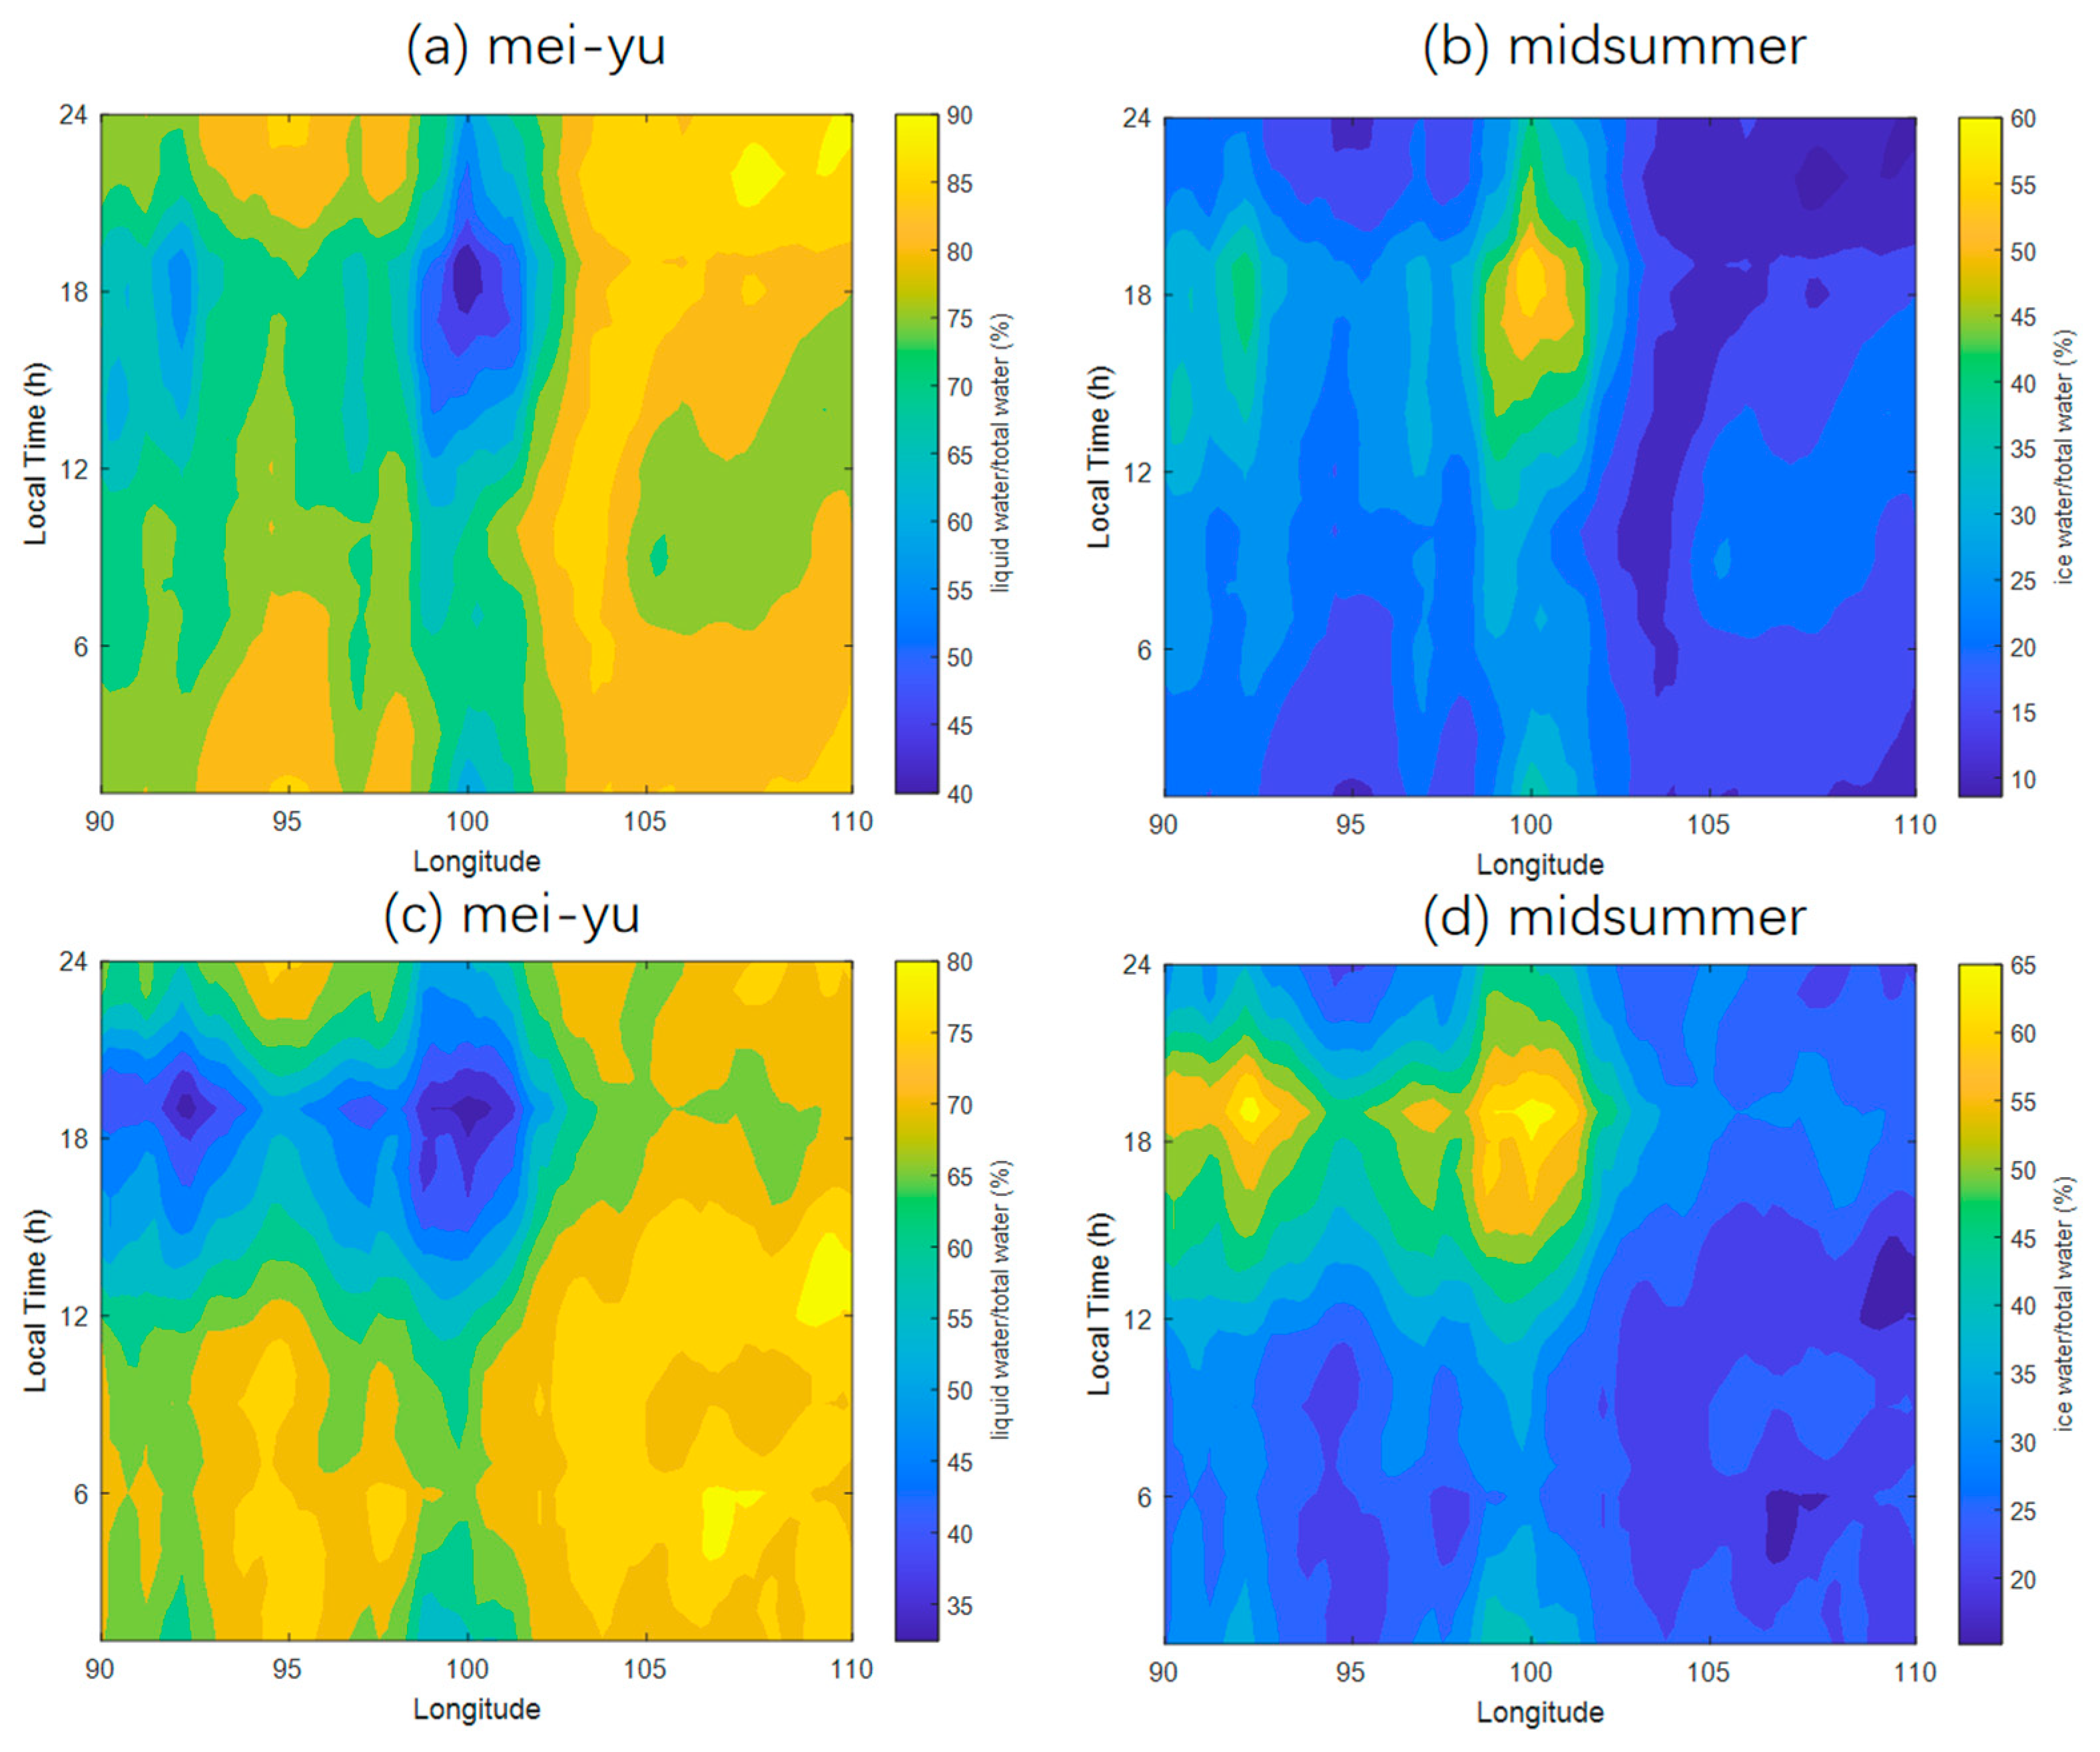
4.3. Factors Influencing the Formation of Precipitation over the TP and SB
5. Conclusions
Supplementary Materials
Author Contributions
Funding
Data Availability Statement
Conflicts of Interest
Abbreviations
| TP | Tibetan Plateau |
| SB | Sichuan Basin |
| EASM | East Asian summer monsoon |
| ECMWF | European Centre for Medium-Range Weather Forecasts |
| ERA5 | ECMWF Reanalysis v5 |
| PERSIANN-CDR | Precipitation Estimation from Remotely Sensed Information using Artificial Neural Networks-Climate Data Record |
| IMERG | Integrated Multi-satellite Retrievals for GPM |
| TMPA | Tropical Rainfall Measuring Mission (TRMM) Multisatellite Precipitation Analysis |
| CMORPH | Climate Prediction Center Morphing technique |
| HE | Hydro-Estimator Satellite Rainfall Estimates |
| LT | Local time |
| UTC | Coordinated Universal Time |
| PF | Precipitation Feature |
| AGL | Above ground level |
| MSL | Mean sea level |
| CBH | Cloud base height |
| LCL | Lifting condensation level |
| CAPE | Convective available potential energy |
| LWC | Cloud liquid water content |
| IWC | Cloud ice water content |
References
- Xu, X.; Lu, C.; Shi, X.; Gao, S. World water tower: An atmospheric perspective. Geophys. Res. Lett. 2008, 35, L20815. [Google Scholar] [CrossRef]
- Fu, Y.; Liu, G.; Wu, G.; Yu, R.; Xu, Y.; Wang, Y.; Li, R.; Liu, Q. Tower mast of precipitation over the central Tibetan Plateau summer. Geophys. Res. Lett. 2006, 33, L05802. [Google Scholar] [CrossRef] [Green Version]
- Boos, W.R.; Kuang, Z. Dominant control of the South Asian monsoon by orographic insulation versus plateau heating. Nature 2010, 463, 218–222. [Google Scholar] [CrossRef] [PubMed]
- Fu, Y.; Ma, Y.; Zhong, L.; Yang, Y.; Guo, X.; Wang, C.; Xu, X.; Yang, K.; Xu, X.; Liu, L.; et al. Land surface processes and summer cloud-precipitation characteristics in the Tibetan Plateau and their effects on downstream weather: A review and perspective. Natl. Sci. Rev. 2020, 7, 500–515. [Google Scholar] [CrossRef] [PubMed] [Green Version]
- Kukulies, J.; Chen, D.; Curio, J. The role of mesoscale convective systems in precipitation in the Tibetan Plateau region. J. Geophys. Res. Atmos. 2021, 126, e2021JD035279. [Google Scholar] [CrossRef]
- Barton, E.; Taylor, C.; Klein, C.; Harris, P.; Meng, X. Observed soil moisture impact on strong convection over mountainous Tibetan Plateau. J. Hydrometeorol. 2021, 22, 561–572. [Google Scholar] [CrossRef]
- Houze, R.A.; Wilton, D.C.; Smull, B.F. Monsoon convection in the Himalayan region as seen by the TRMM precipitation radar. Q.J.R. Meteorol. Soc. 2007, 133, 1389–1411. [Google Scholar] [CrossRef]
- Zhao, P.; Xu, X.; Chen, F.; Guo, X.; Zheng, X.; Liu, L.; Hong, Y.; Li, Y.; La, Z.; Peng, H. The Third Atmospheric Scientific Experiment for understanding the earth-atmosphere coupled system over the Tibetan Plateau and its effects. Bull. Am. Meteorol. Soc. 2017, 99, 757–776. [Google Scholar] [CrossRef]
- Bai, A.J.; Liu, C.; Liu, X. Diurnal variation of summer rainfall over the Tibetan Plateau and its neighboring regions revealed by TRMM multi-satellite precipitation analysis. Chin. J. Atmos. Sci. 2008, 51, 518–529. [Google Scholar] [CrossRef] [Green Version]
- Feng, J.; Liu, L.; Wang, Z. The statistic characteristics of radar echo and precipitation and some thermodynamic variables at Naqu in Qinghai-Xizang Plateau. Plateau Meteorol. 2002, 21, 368–374. (In Chinese) [Google Scholar]
- Zhao, P.; Xiao, H.; Liu, J.; Zhou, Y. Precipitation efficiency of cloud and its influencing factors over the Tibetan plateau. Int. J. Climatol. 2022, 42, 416–434. [Google Scholar] [CrossRef]
- Tao, S.; Chen, L. A review of recent research on the East Asian summer monsoon in China. In Monsoon Meteorology; Chang, C.P., Krishnamurti, T.N., Eds.; Oxford University Press: Oxford, UK, 1987; pp. 60–92. [Google Scholar]
- Ding, Y. Summer monsoon rainfalls in China. J. Meteor. Soc. Jpn. 1992, 70, 373–396. [Google Scholar] [CrossRef] [Green Version]
- Chen, G. Large-scale circulations associated with the East Asian summer monsoon and the mei-yu over South China and Taiwan. J. Meteor. Soc. Jpn. 1994, 72, 959–983. [Google Scholar] [CrossRef] [Green Version]
- Ding, Y.; Chan, J.C.-L. The East Asian summer monsoon: An overview. Meteor. Atmos. Phys. 2005, 89, 117–142. [Google Scholar]
- Chen, G. Research on the phenomena of Meiyu during the past quarter century: An overview. In The East Asian Monsoon; Chang, C.-P., Ed.; World Scientific: Singapore, 2004; pp. 357–403. [Google Scholar]
- Liu, L.; Zheng, J.; Zheng, R.; Cui, Z.; Hu, Z.; Wu, S.; Dai, G.; Wu, Y. Comprehensive radar observations of clouds and precipitation over the Tibetan Plateau and preliminary analysis of cloud properties. J. Meteorol. Res. 2015, 29, 546–561. [Google Scholar] [CrossRef]
- Mei, Y.; Hu, Z.; Huang, X. A study of convective clouds in the Tibetan Plateau based on dual polarimeteic radar observations. Acta Meteor Sin. 2018, 76, 1014–1028. [Google Scholar] [CrossRef]
- Liu, L.; Feng, J.; Chu, R.; Zhou, Y.; Ueno, K. The diurnal variation of precipitation in monsoon season in the Tibetan Plateau. Adv. Atmos. Sci. 2002, 19, 365–378. [Google Scholar] [CrossRef]
- Fujinami, H.; Yasunari, T. The seasonal and intraseasonal variability of diurnal cloud activity over the Tibetan Plateau. J. Meteor. Soc. Jpn. 2001, 79, 1207–1227. [Google Scholar] [CrossRef] [Green Version]
- Ji, X.L.; Wu, H.M.; Huang, A.N.; Zhao, W.; Yang, W. Characteristics of the precipitation diurnal variation over Qinghai-Tibetan Plateau in summer. Plateau Meteor. 2017, 36, 1188–1200. (In Chinese) [Google Scholar]
- Zhao, C.; Liu, L.; Wang, Q.; Qiu, Y.; Wang, Y.; Wu, X. MMCR-based characteristic properties of non-precipitating cloud liquid droplets at Naqu site over Tibetan Plateau in July 2014. Atmos. Res. 2017, 190, 68–76. [Google Scholar] [CrossRef]
- Xu, W.; Zipser, E.J. Diurnal variations of precipitation, deep convection, and lightning over and east of the eastern Tibetan Plateau. J. Clim. 2011, 24, 448–465. [Google Scholar] [CrossRef]
- Fu, Y.; Pan, X.; Xian, T.; Liu, G.; Zhong, L.; Liu, Q.; Ma, M. Precipitation characteristics over the steep slope of the Himalayas in rainy season observed by TRMM PR and VIRS. Clim. Dyn. 2018, 51, 1971–1989. [Google Scholar] [CrossRef]
- Gong, Y.F.; Ji, L.R.; Duan, T.Y. Precipitation character of rainy season of Qinghai-Xizang Plateau and onset over East Asia monsoon. Plateau Meteor. 2004, 23, 313–322. (In Chinese) [Google Scholar]
- Chen, G.; Sha, W.; Iwasaki, T. Diurnal variation of precipitation over southeastern China: 2. Impact of the diurnal monsoon variability. J. Geophys. Res. 2009, 114, D21105. [Google Scholar] [CrossRef] [Green Version]
- Yu, R.; Li, J.; Chen, H.; Yuan, W. Progress in studies of the precipitation diurnal variation over contiguous China. Acta Meteorol. Sin. 2014, 72, 948–968. [Google Scholar] [CrossRef]
- Sorooshian, S.; Hsu, K.L.; Gao, X.; Gupta, H.V.; Imam, B.; Braithwaite, D. Evaluation of PERSIANN system satellite-based estimates of tropical rainfall. Bull. Am. Meteorol. Soc. 2000, 81, 2035–2046. [Google Scholar] [CrossRef] [Green Version]
- Huffman, G.J.; Bolvin, D.T.; Nelkin, E.J. Integrated Multi-satellite Retrievals for GPM (IMERG) Technical Documentation. NASA/GSFC Code 612; 2015. Available online: http://pmm.nasa.gov/sites/default/files/document_files/IMERG_doc.pdf (accessed on 16 September 2019).
- Huffman, G.J.; Bolvin, D.T.; Nelkin, E.J.; Wolff, D.B.; Adler, R.F.; Gu, G.; Hong, Y.; Bowman, K.P.; Stocker, E.F. The TRMM multisatellite precipitation analysis (TMPA): Quasi-global, multiyear, combined-sensor precipitation estimates at fine scales. J. Hydrometeorol. 2007, 8, 38–55. [Google Scholar] [CrossRef]
- Joyce, R.J.; Janowiak, J.E.; Arkin, P.A.; Xie, P. CMORPH: A method that produces global precipitation estimates from passive microwave and infrared data at high spatial and temporal resolution. J. Hydrometeorol. 2004, 5, 487–503. [Google Scholar] [CrossRef]
- Scofield, R.A.; Kuligowski, R.J. Status and outlook of operational satellite precipitation algorithms for extreme-precipitation events. Mon. Wea. Rev. 2003, 18, 1037–1051. [Google Scholar] [CrossRef] [Green Version]
- Hobouchian, M.P.; Salio, P.; Skabar, Y.G.; Daniel, V.; Rene, G. Assessment of satellite precipitation estimates over the slopes of the subtropical Andes. Atmos. Res. 2017, 190, 43–54. [Google Scholar] [CrossRef]
- Yucel, I.; Kuligowski, R.J.; Gochis, D.J. Evaluating the hydro-estimator satellite rainfall algorithm over a mountainous region. Int. J. Remote Sens. 2011, 32, 7315–7342. [Google Scholar] [CrossRef]
- Liu, J. Analysis on cloud microphysical property over Qinghai-Xizang Plateau using satellite data. Plateau Meteor 2013, 32, 38–45. (In Chinese) [Google Scholar]
- Cadeddu, M.; Liljegren, J.; Turner, D. The atmospheric radiation measurement (ARM) program network of microwave radiometers: Instrumentation, data, and retrievals. Atmos. Meas. Tech. 2013, 6, 2359–2372. [Google Scholar] [CrossRef] [Green Version]
- Zhao, C.; Xie, S.; Klein, S. Toward understanding of differences in current cloud retrievals of ARM ground-based measurements. J. Geophys. Res. 2012, 117, D10206. [Google Scholar] [CrossRef]
- Guo, J.P.; Zhang, J.; Yang, K.; Liao, H.; Zhang, S.D.; Huang, K.M.; Lv, Y.M.; Shao, J.; Yu, T.; Tong, B.; et al. Investigation of nearglobal daytime boundary layer height using high-resolution radiosondes: First results and comparison with ERA5, MERRA-2, JRA-55, and NCEP-2 reanalyses. Atmos. Chem. Phys. 2021, 21, 17079–17097. [Google Scholar] [CrossRef]
- Cao, B.J.; Lyu, S.H.; Zhang, Y.; Yang, X.; Li, B.; Li, M. Factors influencing diurnal variations of cloud and precipitation in the Yushu area of the Tibetan Plateau. J. Meteor. Res. 2022, 36, 311–325. [Google Scholar] [CrossRef]
- Chen, M.; Chen, M.X.; Fan, S.Y. The real-time radar radial velocity 3DVar assimilation experiments for application to an operational forecast model in North China. Acta Meteor. Sinica 2014, 72, 658–677. (In Chinese) [Google Scholar] [CrossRef]
- Wang, Y.; Yang, Y.; Wang, C.H. Improving forecasting of strong convection by assimilating cloud-to-ground lightning data using the physical initialization method. Atmos. Res. 2014, 150, 31–41. [Google Scholar] [CrossRef]
- Zhang, Y.; Xue, M.; Zhu, K.; Zhou, B. What is the main cause of diurnal variation and nocturnal peak of summer precipitation in Sichuan Basin, China? The key role of boundary layer low- level jet inertial oscillations. J. Geophys. Res. Atmos. 2019, 124, 2643–2664. [Google Scholar] [CrossRef]
- Craven, J.P.; Jewell, R.E.; Brooks, H.E. Comparison between observed convective cloud-base heights and lifting condensation level for two different lifted parcels. Wea. Forecast 2002, 17, 885–890. [Google Scholar] [CrossRef] [Green Version]
- Wang, Y.; Zeng, X.; Xu, X.; Welty, J.; Lenschow, D.H.; Zhou, M.; Zhao, Y. Why are there more summer afternoon low clouds over the Tibetan Plateau compared to eastern China? Geophys. Res. Lett. 2020, 47, e2020GL089665. [Google Scholar] [CrossRef]
- Wu, G.X.; Duan, A.; Liu, Y.; Mao, J.; Ren, R.; Bao, Q.; He, B.; Liu, B.; Hu, W. Tibetan Plateau climate dynamics: Recent research progress and outlook. Natl. Sci. Rev. 2015, 2, 110–116. [Google Scholar] [CrossRef] [Green Version]


| Tibetan Plateau | Sichuan Basin | |
|---|---|---|
| Mei-yu | 4531 | 2687 |
| Midsummer | 8145 | 3556 |
| TP | SB | |||
|---|---|---|---|---|
| Mei-Yu | Midsummer | Mei-Yu | Midsummer | |
| CBH AGL (m) | 822 | 901 | 2556 | 2341 |
| LCL AGL (m) | 753 | 856 | 2468 | 2390 |
Publisher’s Note: MDPI stays neutral with regard to jurisdictional claims in published maps and institutional affiliations. |
© 2022 by the authors. Licensee MDPI, Basel, Switzerland. This article is an open access article distributed under the terms and conditions of the Creative Commons Attribution (CC BY) license (https://creativecommons.org/licenses/by/4.0/).
Share and Cite
Cao, B.; Yang, X.; Li, B.; Lu, Y.; Wen, J. Diurnal Variation in Cloud and Precipitation Characteristics in Summer over the Tibetan Plateau and Sichuan Basin. Remote Sens. 2022, 14, 2711. https://doi.org/10.3390/rs14112711
Cao B, Yang X, Li B, Lu Y, Wen J. Diurnal Variation in Cloud and Precipitation Characteristics in Summer over the Tibetan Plateau and Sichuan Basin. Remote Sensing. 2022; 14(11):2711. https://doi.org/10.3390/rs14112711
Chicago/Turabian StyleCao, Bangjun, Xianyu Yang, Boliang Li, Yaqiong Lu, and Jun Wen. 2022. "Diurnal Variation in Cloud and Precipitation Characteristics in Summer over the Tibetan Plateau and Sichuan Basin" Remote Sensing 14, no. 11: 2711. https://doi.org/10.3390/rs14112711