Article

Analysing Process and Probability of Built-Up Expansion Using Machine Learning and Fuzzy Logic in English Bazar, West Bengal

1
Department of Geography, Faculty of Natural Sciences, Jamia Millia Islamia, New Delhi 110025, India
2
Henry Samueli School of Engineering, University of California, 5200 Engineering Service Rd., Irvine, CA 92617, USA
3
Department of Geography, University of Gour Banga, Mokdumpur, Malda 732103, India
4
Department of Geography, University of Jammu, Jammu 180006, India
5
Department of Disaster Management, Begum Rokeya University, Rangpur 5400, Bangladesh
6
John von Neumann Faculty of Informatics, Obuda University, 1034 Budapest, Hungary
7
Institute of Information Engineering, Automation and Mathematics, Slovak University of Technology in Bratislava, 81107 Bratislava, Slovakia
8
Institute of Information Society, University of Public Service, 1083 Budapest, Hungary
*
Author to whom correspondence should be addressed.
Remote Sens. 2022, 14(10), 2349; https://doi.org/10.3390/rs14102349
Submission received: 30 March 2022 / Revised: 9 May 2022 / Accepted: 10 May 2022 / Published: 12 May 2022
(This article belongs to the Special Issue Artificial Intelligence-Based Learning Approaches for Remote Sensing)

Abstract

:
The study sought to investigate the process of built-up expansion and the probability of built-up expansion in the English Bazar Block of West Bengal, India, using multitemporal Landsat satellite images and an integrated machine learning algorithm and fuzzy logic model. The land use and land cover (LULC) classification were prepared using a support vector machine (SVM) classifier for 2001, 2011, and 2021. The landscape fragmentation technique using the landscape fragmentation tool (extension for ArcGIS software) and frequency approach were proposed to model the process of built-up expansion. To create the built-up expansion probability model, the dominance, diversity, and connectivity index of the built-up areas for each year were created and then integrated with fuzzy logic. The results showed that, during 2001–2021, the built-up areas increased by 21.67%, while vegetation and water bodies decreased by 9.28 and 4.63%, respectively. The accuracy of the LULC maps for 2001, 2011, and 2021 was 90.05, 93.67, and 96.24%, respectively. According to the built-up expansion model, 9.62% of the new built-up areas was created in recent decades. The built-up expansion probability model predicted that 21.46% of regions would be converted into built-up areas. This study will assist decision-makers in proposing management strategies for systematic urban growth that do not damage the environment.

Graphical Abstract

1. Introduction

The urban population of the world is rapidly growing, and according to a projection by the United Nations, approximately 9.8 billion people by 2050 and 11.2 billion by 2100 will be living in urban areas [1]. Due to this rapid growth in population, cities around the world are facing very fast transformation of their land use land cover (LULC) pattern [2,3,4]. This is creating serious problems, such as urban sprawl, unplanned expansion of impervious surfaces (built-up land), and decline in urban green spaces, as well as deterioration of the urban environmental quality [5,6,7]. The rate of unplanned expansion due to population growth and economic development is very high in developing countries of South and East Asia such as India, China, Bangladesh, etc. [8,9,10]. In India, small and medium-sized towns have experienced the very fast expansion of built-up surfaces in the last few decades [11,12,13,14], which has resulted in the unplanned expansion of these towns, as well as urban sprawling [15,16]. The rapid lateral expansion of India’s small and medium-sized cities is considered a serious urban problem [17]. As of 2011, India had 3894 small and medium-sized towns [18], which are growing at a greater rate in terms of population and spatial distribution than large and metro cities [19]. Most of the studies on the urbanisation and LULC changes in medium-sized Indian cities have addressed some aspects of urban expansion and its consequences [14,20,21,22]. India’s urban population has increased from 79 million in 1961 to 388 million in 2011, whereas its rural population doubled from 360 million to 860 million [23]. The primary cause for this continuous population rise was the development of infrastructural activities such as transport networks, internet connection, health sector development, new institutional sector establishment, etc. [7,17]. As a city’s population grows, the city and countryside expand laterally to accommodate the increasing population, resulting in a lateral extension of cities beyond their formal city authority boundaries, a phenomenon known as “urban sprawl” [24]. The phenomenon of built-up expansion in the process of urban sprawl is one of the most noticed and studied phenomenon among urban researchers [12,25,26].
The expansion of built-up land leads to several negative and harmful effects on the urban environment and ecology [5,27,28,29]. Thus, measuring and modelling different forms of built-up land expansion might assist planners in better understanding and addressing the challenges related to the expansion of built-up areas [30,31,32]. Researchers have tried to analyse and quantify the urbanisation-induced built-up land expansion around the world [12,33,34,35,36]. For instance, Salem et al. [34] analysed the pattern of built-up land expansion and urban sprawl in the peri-urban area of Cairo City in the post-revolution era using remote sensing techniques coupled with logistic regression. Similarly, Talukdar et al. [37] used the transferable build-up area extraction (TBUAE) technique for assessing urban growth using high-resolution satellite datasets. Further, Fawad et al. [38] combined multispectral satellite data with synthetic aperture radar (SAR) datasets for extracting urban impervious surfaces. Xu [39] and Shahfahad et al. [12] applied an index-based built-up index (IBI) technique for urban area expansion that was based on the multiple spectral indices derived from satellite data.
Studies have been done in developing countries like South Africa [40], Pakistan [41], Nigeria [42], and India [43] for mapping and monitoring urban LULC changes and built-up area expansion using remote sensing. However, most of these studies in India have been done on large metropolitan cities like Delhi, Kolkata, Mumbai, Chennai, etc. [44,45,46,47,48]. On the other hand, only a few studies have been done on small and medium-sized cities in India [14,16,49]. Despite the considerable growth in the literature on urban expansion and sprawling in major cities, studies on built-up expansion in small/medium-sized blocks/districts have received little attention from scholars and urban planners in India. Therefore, to fill this literature gap, this study aims to analyse the built-up growth and LULC change in the English Bazar block, which is a small town of West Bengal. The English Bazar Municipal Corporation, which is located in the centre of the English Bazar block has witnessed very fast population growth and landscape transformation in the last few decades [49]. In this context, an analysis of the built-up growth and LULC change is a matter of concern for medium-sized towns like English Bazar. Therefore, in this work, we identified the land use features using SVM for 2001, 2011, and 2021, including built-up areas, as an essential input for further research. We introduced a model to study the process of built-up expansion using fragmentation indices and the frequency approach. Additionally, we developed a built-up probability model using fuzzy logic for exploring the future built-up expansion probable areas, which have not been studied so far.

2. Materials and Methods

2.1. Study Area

The study area English Bazar block is an important political, cultural, and administrative centre in Malda District, West Bengal, and covers an estimated area of 251.8 km2. It is located between 24°50′–25°05′N latitude and 88°–88°10′E longitude (Figure 1). The study area is located at a height of 15–17 m above sea level. It consists of one municipality and 108 inhabited villages. This region is mainly made up of the younger alluvial plain of the Ganga River and the Mahananda River. The English Bazar, like most other parts of West Bengal, experiences highly humid and tropical weather. In May and June, temperatures can reach 42–45 °C during the day, but in December and January, they can drop to 8 °C overnight. According to the 2011 Census, the English Bazar block has a total population of 274,627, and the region is recognised as having an urban agglomeration. In the last decade (2001–2011), this region has witnessed a rapid rise in urbanisation, with the highest urbanisation rate in West Bengal at 124.81%. Various social and economic factors influenced this significant built-up expansion. The intersection of NH-34 (national highway), the state highway (SH-10), the north-eastern frontier railway, and the eastern railway all lead to the enhancement of the built-up expansion in this region. As increased urbanisation in a developing country, this region is challenged with uncontrolled built-up growth, insufficient critical infrastructure and utilities, air, noise, and water pollution, as well as bad governance.

2.2. Data Base and Its Preprocess
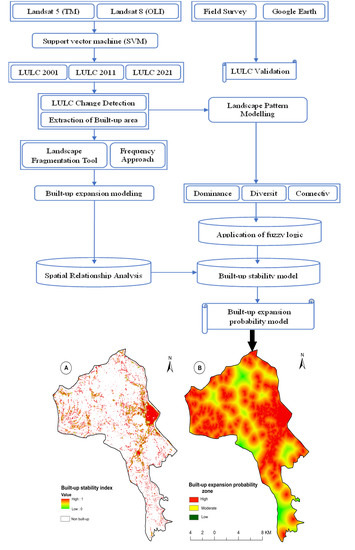
The LULC maps for the years 2001, 2011, and 2021 were created using the satellite images provided by different sensors of Landsat, such as Landsat 5 thematic mapper (TM) and the Landsat 8 operational land imager (OLI). Before proceeding for further research, we considered the technical issues of both sensors. However, Landsat TM started providing multispectral data in 1984. Landsat 8 launched recently (2013) with the OLI and TIRS sensors, resulting in a new orthorectified dataset (L1T) [50]. Despite the fact that Landsat 5 is no longer in operation and Landsat 7 is hampered by the failure of the Scan Line Corrector (SLC-off), the successful launch of Landsat 8 has supplied a steady stream of intermediate spatial resolution data for long-term LULC mapping and trend analysis [51]. Therefore, most research on long-term vegetation changes and LULC mapping uses different Landsat sensors together, such as TM, ETM+, and the OLI sensor. In comparison to TM and ETM+, OLI has two new spectral bands: an ultra-blue band (0.43–0.45 µm) and a cirrus band (1.36–1.39 µm). In the near-infrared (NIR), the OLI bands are generally narrower than the equivalent TM and ETM+ bands. Given these factors, it is necessary to compare Landsat 8 data to the preceding Landsat sensors before integrating them with other sensors for the trend analysis. Several researchers have examined clear sky observations taken 8 days apart for the same site to compare Landsat 5, 7, and 8 data [51,52]. These studies assumed that the phenology and land cover did not change between acquisitions and found that surface reflectance variances of about 2% and NDVI differences of about 5% exist between the two sensors [21]. However, Vinayak et al. [44] concluded that the TM, ETM+, and OLI images are comparable enough to be used as complementary data.
Therefore, based on the previous literature, we used TM and OLI sensors for our research, with two considerations. First, we did not use all bands of the TM and OLI sensors for our LULC mapping. We used only those bands that are common in both sensors and relevant for LULC research, such as red, blue, and green, while the thermal bands of both sensors, coastal and circus bands of the OLI sensors, were excluded for the analysis. Additionally, these bands did not have much influence on the LULC research. Second, before using the selected bands for further research, we did radiometric correction, like top-of-atmosphere (TOA) reflectance and/or radiance using radiometric rescaling coefficients provided in the metadata file that is delivered with the Level-1 product.
The Landsat datasets were downloaded from the Earth Explorer website (http://earthexplorer.usgs.gov/, accessed on 16 December 2021) of the United States Geological Survey. In a subtropical country like India, satellite data are generally used for the months of March and April to get cloud-free scenes [28]. However, this part of India receives significant rainfall during the pre-monsoon months (March to April) due to the nor’wester activity (locally known as Kaalbaisakhi) and, thus, experiences frequent cloud cover [12]. Therefore, in this study, the satellite data were used for the months of December to avoid any kind of errors due to local climatic effects, and we got the cloud-free images [21]. The Landsat images offer a medium spatial resolution of 30 m, which is suitable for the mapping of urban landscape pattern at different levels (Table 1). Further, for the validation of prepared LULC maps, the samples were collected through a field survey, as well as the Google Earth Pro domain.

2.3. Methodology

2.3.1. Method for the LULC Classification

The SVM is a binary classifier [52]; it may classify many characteristics (over two) using either the one-versus-one (OVO) or one-versus-rest (OVR) techniques. The SVM, a statistical learning approach, provides improved overfitting control and a high convergence rate and is unaffected by the local minima [53]. Many classifications issues have been successfully solved using the SVM classifier [54,55,56]. In this work, we did LULC classification based on three different bands of Landsat satellite data: red (R), green (G), and blue (B). We divided the pixels in the images into five categories (agricultural land, barren land, vegetation, built-up area, and water body) (Table 2).
As a result, a multiclass SVM classifier based on the RGB band composite was developed to predict the land use classes. To design and test the SVM classifier for classification into five groups, 360 datasets were collected. For training and testing the model, we partitioned the total datasets into two halves in the ratio of 80:20. In other words, 212 datasets were used to train the model, and 56 datasets were used to test it. The training dataset comprised 8619 total pixels. Out of the total pixels, we collected 1306 pixels from water bodies, 2500 from built-up, 1613 from vegetation, 2600 from agricultural land, and 600 from barren land. The SVM model classifies a typical pixel in an image as +1 if it corresponds to a specified class or −1 if it belongs to a different class [56]. This work used the OVO approach with radial basis function kernel to create a multiclass classification [57]. The SVM model was trained using training data from two different classes in the OVO approach.
The training of a new SVM model is performed until each class pair has been completed. In this scenario, picture pixels are classified into five classes, resulting in 10 [=(52 − 5)/2] combinations. Therefore, 10 SVM models are needed to train for classification into five classes. The class of a particular pixel has been predicted using the voting scheme. A typical pixel is projected as “+1” based on the most votes from all ten classifiers. Any SVM model’s principal goal is to find the best separating hyperplane, w.x + b = 0, for categorising pixels into two groups. The optimal hyperplane distinguishes the pixels into +1 and −1 with the maximum margin. We used C-support vector classification to run the model. The SVM was executed with the parameters of: the penalty parameter (C) of 1, Nu of 0.5, p of 0.5, radial basis function-based kernel, coefficient 0 of 1, degree of 0.5, and gamma of 1. Based on these optimised parameters, the LULC was classified three times, for 2001, 2011, and 2021.

2.3.2. Validation of LULC Map

The most significant and last stage in the image classification process is the accuracy assessment estimation. Validation is a crucial component of robust and accurate LULC mapping, because it assists planners and administrative departments in understanding the significance, impact, and accuracy between ground reality and research work in the studied region [55,56]. Post-classification validation of the LULC maps also helps planners and administrative divisions in launching their strategies. The standard kappa coefficient, overall accuracy, producer accuracy, and user accuracy were among the accuracy measurement methodologies used in the present study. The following formula was used to determine the kappa coefficient [58]:
Kappa coefficient
N i r x i i i r ( x i + ) ( x i ) N 2 i r ( x i + ) ( x i )
where r represents the number of rows, x represents the number of observations in the rows and columns (diagonal elements), and N represents the number of total observations:
Overall accuracy
OA = ( 1 N ) i = 1 r n i i
Producer’s accuracy
PA = ( n i i n i c o l )  
User’s accuracy
UA = ( n i i n i r o w )  
where the number of correctly classified pixels is ii, the total number of pixels is N, the number of rows is r, and the column and row totals are nicol and nirow., respectively.
The total accuracy estimator determines how many pixels in the image have been correctly identified. For this work, we used the kappa coefficient to validate the LULC maps based on the testing samples. In the present study, we randomly chose 20% of the field data as the testing sample. Fifty-six samples were calculated as the testing sample, which comprised 2641 total pixels. Out of total pixels, we collected 286 pixels from water bodies, 780 from built-up, 690 from vegetation, 655 from agricultural land, and 230 from barren land.

2.3.3. Method for the LULC Change Detection

Using the GIS environment and a post-classification change detection approach, the changes in LULC during 2001–2011, 2011–2021, and 2001–2021 were examined (Figure 2). Post-classification change detection is one of the most common methods for analysing the details of changes in LULC patterns in a region during a time period [52]. This approach may evaluate the temporal variations in the LULC types and the level of LULC conversion caused by urbanisation. We calculated the change statistics for two time periods of LULC maps using Equation (5):
Change   ( % ) = β 1 β 2 β 1
where β1 = present year (2021) and β2 = initial year (2001).

2.3.4. Methods for the Modelling of Built-Up Expansion Process

In this study, the built-up growth was represented using a frequency technique. We first categorised the LULC map, then divided the entire map into two groups, built-up and non-built up, for distinction when using the reclassification tool in GIS. The built-up area was denoted by 1 and the non-built-up area by 0. Then, we used the spatial analyst tool with the less than frequency and the reclassified raster layer as the input. This approach calculates the number of times a collection of the raster is smaller than another raster on a cell-by-cell basis. The number of instances (frequency) in which a raster in the input list has a lower value is counted for each cell position in the input value raster. Finally, a frequency map is produced. The value reflects the number of times the associated cells in the list of the raster are less than the value raster for each cell in the output raster. The final map is overlaid by a built-up area of different (three) times.
We employed landscape fragmentation tools to analyse the growth rate trend to categorise the built-up area. The LULC map was divided into two categories: built-up and non-built-up, with built-up denoted by 2 and non-built-up denoted by 1. As an input raster, we utilised this reclassified map. We followed two steps to perform this model that reclassified LULC data and analysed the fragmentation. The final map was divided into four categories: patch, edge, perforated, and core. Based on the size of the core tract, the core category is further classified into large, medium, and small cores. The primary categories are determined by a parameter called edge width. Many studies have established the deterioration of forests or grasslands along disturbance edges, but we used it in our study to demonstrate the extension of newly formed built-up areas via the edge effect.

2.3.5. Built-Up Expansion Probability Model Using Fuzzy Logic

A suitability analysis, often known as site selection, is an advanced remote sensing-based study used to discover the optimal location for anything. To generate a built-up expansion probability model, first, we created a dominance, diversity, and connectivity model in SAGA GIS, and then, we used fuzzy tools in GIS and determined three different fuzzified models with the help of suitable fuzzy membership types. We used six membership functions (linear, small, large, MS Small, MS Large, and near) for the model. The fuzzy membership tool reclassifies or converts the input data into a 0 to 1 scale, depending on the probability of being a member of a certain set [59]. We mainly used the ‘large’ membership function, because it has a positive relationship with built-up expansion, and ‘large’ indicates a high fuzzy membership value. Fuzzy membership assigns values ranging from 0 to 1, with 0 indicating that something is unlikely or inappropriate and 1 indicating that something is most probable or appropriate [60]
After that, we created a built-up stability model using fuzzy overlay methods (In a multicriteria overlay analysis, the fuzzy overlay tool may estimate the probability of a phenomena belonging to various sets. Fuzzy overlay not only determines which sets the occurrence could belong to, but it also examines the connections between the sets’ membership [59]. Since the multiple classes’ surfaces are compared, this phase is analogous to weighted site selection (a site selection type that allows users to rank raster cells and provide a critical relative value to each layer). Then, we utilised the fuzzy operator (And, Or, Sum, Product, and Gamma) ‘And’, which gave us the best results, because this operator is great for identifying places that fulfil all requirements. Finally, we created a built-up probability model using Euclidean distance from spatial analyst tools in GIS. From the centre of the source cell to the centre of each surrounding cell, the Euclidean distance was determined. Each of the distance tools calculated the actual Euclidean distance. If the shortest distance to a source is less than the maximum distance given, the value is allocated to the cell location on the output raster. Therefore, we used the built-up stability map as a raster layer to generate the final output map, signified through 0 and 1, and quickly predicted the built-up expansion probability zone in the English Bazar block. The methodology of this study is summarised in Figure 2.

3. Results

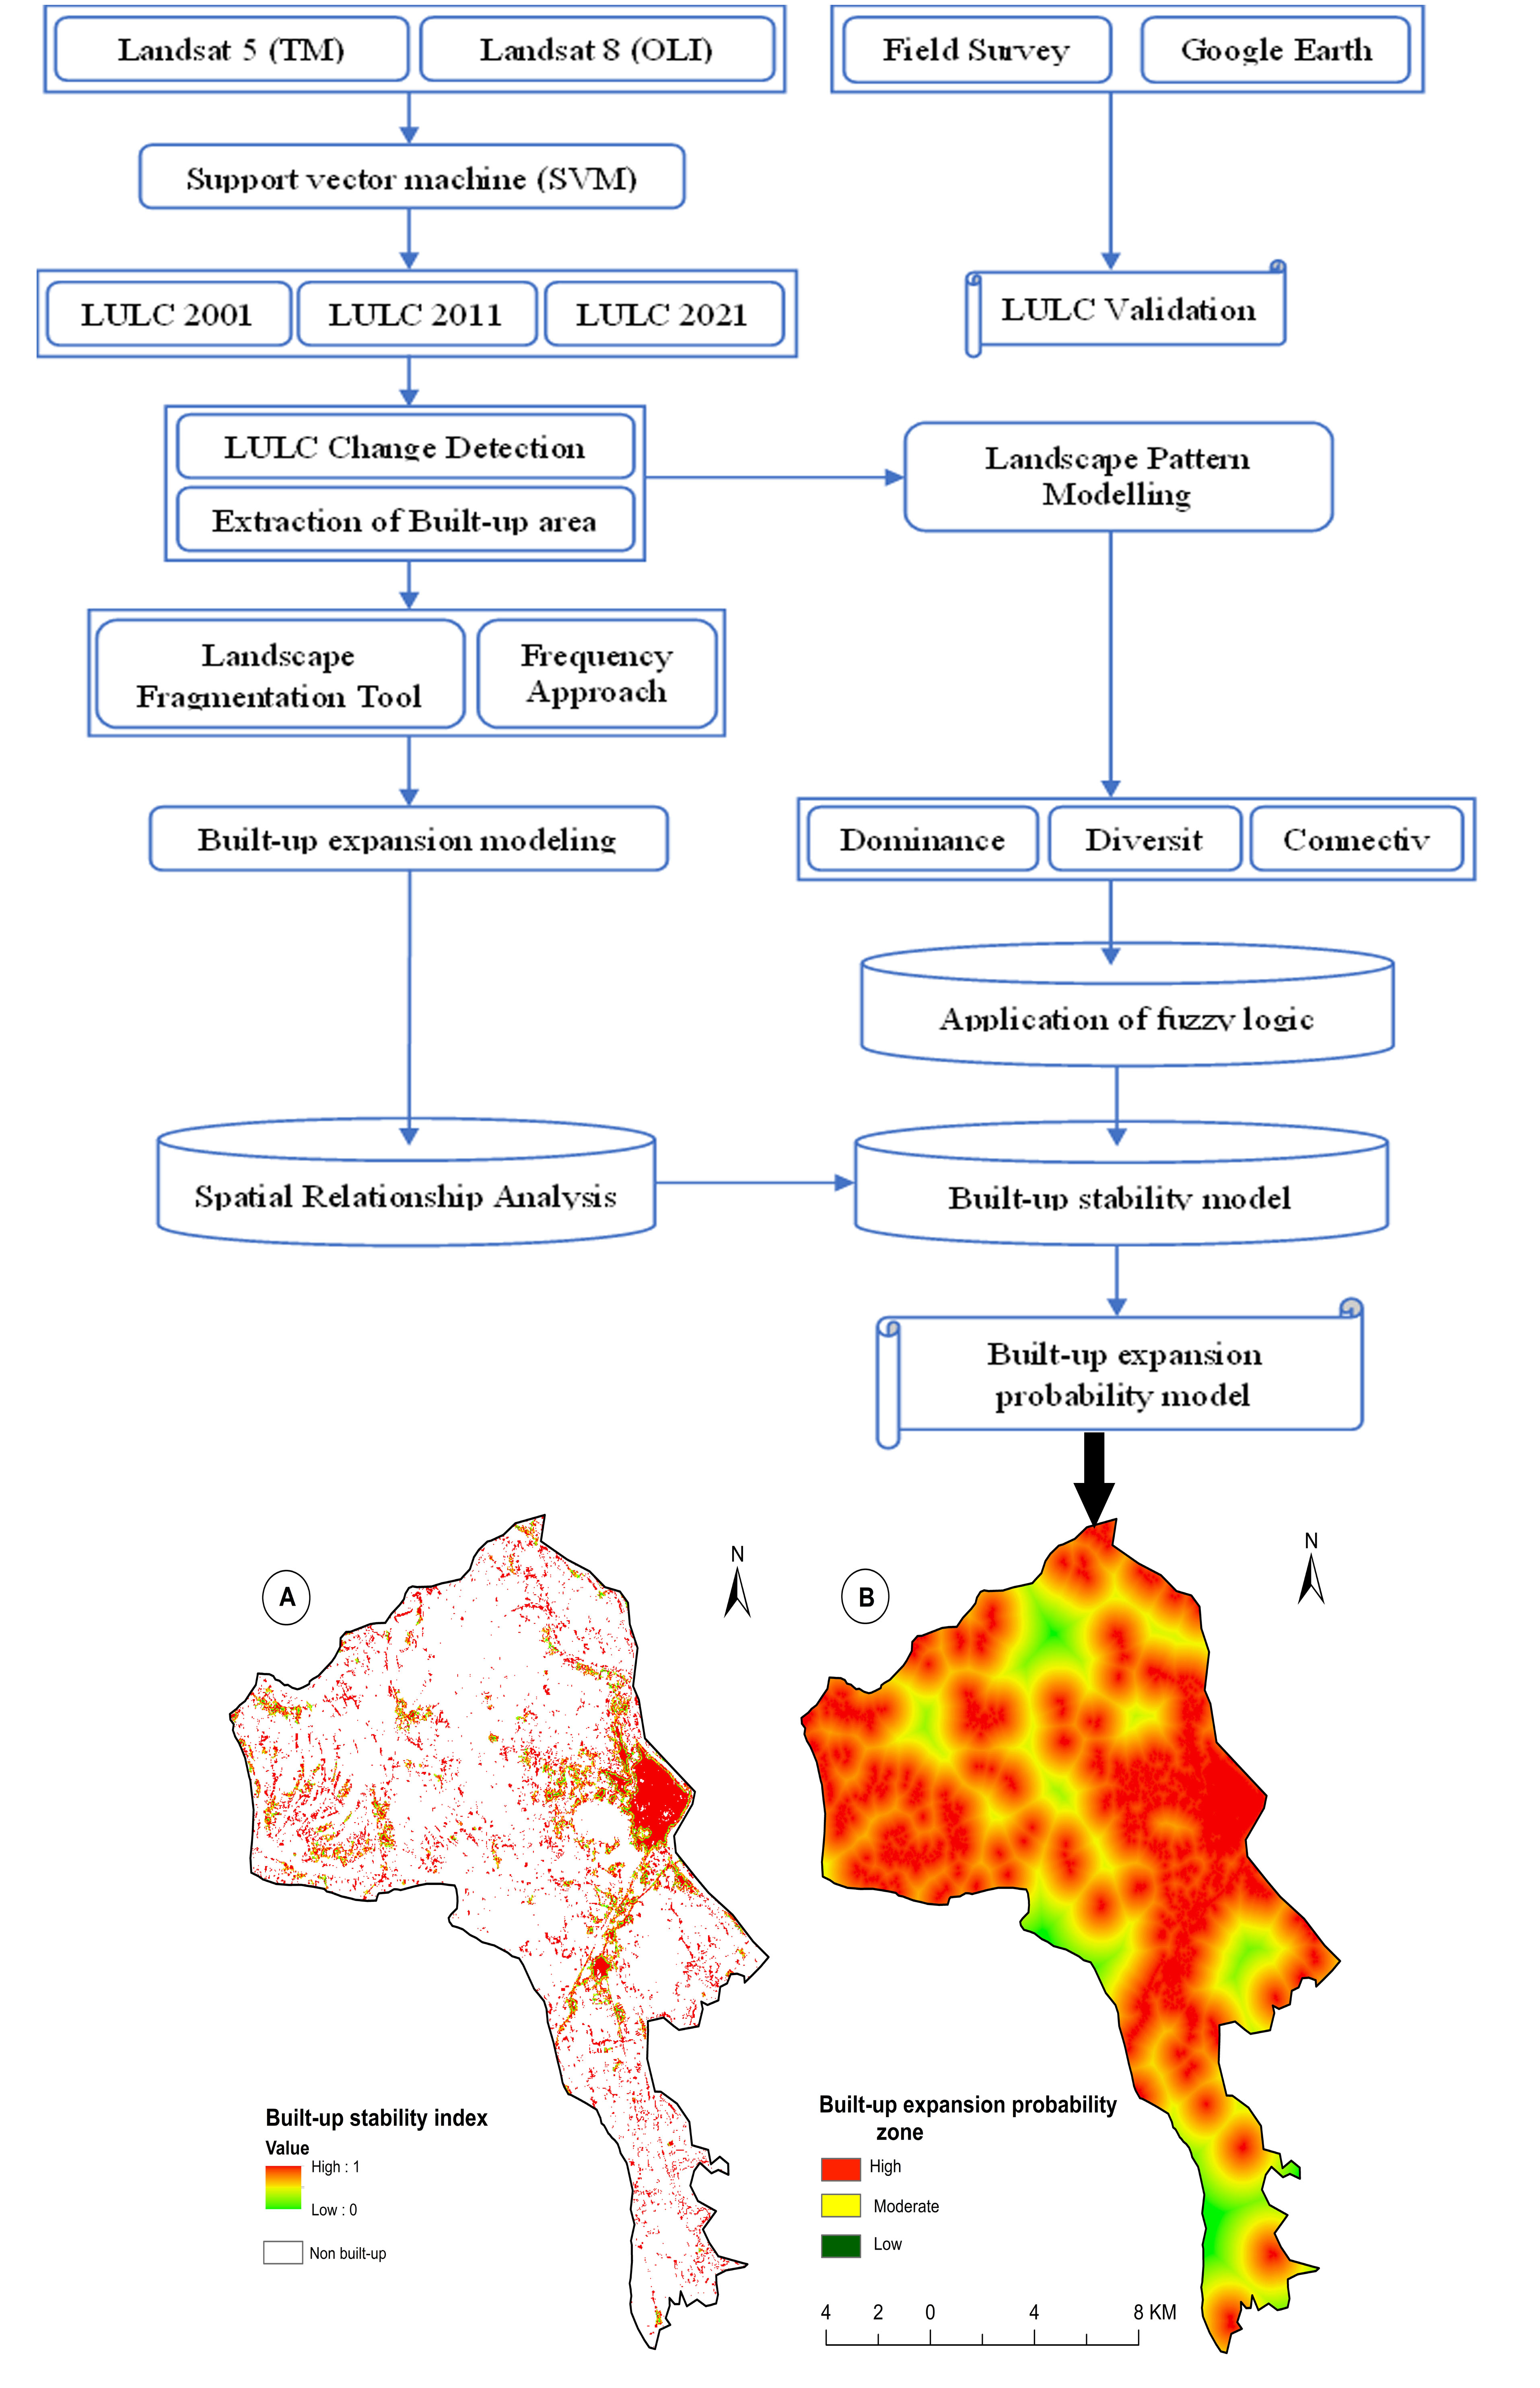
3.1. Analysis of the LULC Mapping

The LULC of the English Bazar block was classified into five categories, i.e., water bodies, built-up area, vegetation, barren land, and agricultural land (Figure 3), based on the level-I classification scheme of the National Remote Sensing Centre (NRSC). This study observed a significant shift in LULC patterns in the last 20 years. The results for the LULC map of 2001 showed that a 109 km2 area was covered by vegetation cover, followed by agricultural land (70.1 km2), water bodies (21.11 km2), built-up area (15.4 km2), and barren land (18.4 km2). In 2011, the results showed that a 92 km2 area was covered by agricultural land, followed by vegetation cover (80 km2), built-up area (26.8 km2), water bodies (17.26 km2), and barren land (12.4 km2). In the case of 2021, the built-up area and agricultural land increased significantly, and agricultural land covers 98 km2, followed by the vegetation cover (72 km2), built-up area (35.91 km2), water bodies (19.2 km2), and barren land (7.64 km2) (Figure 3). The amount of built-up and agricultural land has grown, while vegetation and barren land decreased. Water bodies also increased in the south-eastern part of this study area, owing to lowlands that were flooded in 2017 [53], resulting in stagnant water bodies. Further, new farm ponds were dug under the Mahatma Gandhi National Rural Employment Guarantee Act (MGNREGA) scheme by the union, as well as the state government, to increase fish production and maintain the ecological balance, especially of aqua life. Agricultural land has primarily expanded near built-up areas because of many people involved in agricultural activity, mostly in rural areas, and to meet the growing need for food for an expanding population, both show urban growth. Barren land has been changed to agricultural land, built up, and certain areas have been converted to vegetation, particularly mango forests, since Malda District is noted for them [54]. The built-up area was expanding all over the block at a very high pace. The main growth was noticed in the surroundings part of the municipal area, which is located in the eastern part of the study area. High built-up growth was noticed in the northern part, where the expansion was mainly increased along the banks of Kalindri River. To the western part and southern part, the built-up area was increased along the State Highway (SH) 10 and National Highway (NH) 34. Maheshpur has seen a massive increase in settlements area, located on the left bank of Mahananda River, a very short distance from the municipal area (southern part). The built-up area increased by 30% during 2001–2011 and 44.28% from 2011 to 2021. The reason for the rapid urbanisation in the north-eastern part of the study area is the presence of the rapidly growing English Bazar municipality, type-I city, and decentralisation of several medium and small microenterprises (MSME), educational centres, and health centre. These governmental and private centres accelerate the process for growing urban centres across the study area rapidly, not only the north-eastern part. According to the census of 2001, the population density of this municipality was 881 persons/km2, which was increased by 1100 persons/km2. Therefore, it can be stated that the urban centres have been growing rapidly over time.

3.2. Validation of the LULC Classification

The accuracy of the prediction of a certain class is shown by the metric of the producer accuracy. The consistency of the group to the user is revealed by the user’s accuracy. The LULC maps of 2001 had an overall average of 90.05%, 93.67% in 2011, and 96.24% in the 2021 (Table 3). These results indicate that the performance of the SVM model for classifying the LULC maps was highly satisfactory. Previous studies reported that the overall accuracy of greater than 80% could be considered satisfactory [55,56]. The results of the LULC maps of three periods showed that the LULC of 2021 had the highest user accuracy of 96.24%, followed by 93.67% in 2011, and 90.05% in 2001. The built-up area was found to be more reliable because of the 98% user accuracy for the LULC of 2021, followed by vegetation (96%), and agricultural land (96%). In the case of the LULC of 2011, vegetation had the highest user accuracy of 95%, followed by built-up area (94%) and water bodies (93%). The accuracy assessment of the LULC of 2001 showed that built-up areas achieved the second-highest user accuracy of 88%. Therefore, it can be stated that the built-up area achieved the highest accuracy compared to the other four LULC classes.

3.3. Analysis of the LULC Dynamics

During 2001–2021, urbanisation and development activities had the most significant impact on restructuring the land use and land cover in the English Bazar region. Figure 4 depicts how the urbanisation process, also known as built-up expansion, changed the land use at the expense of vegetation, agricultural land, and barren land, as seen in the Figure 4. From 2001 to 2011, roughly 6.2 km2 of agricultural land and 4.6 km2 of vegetation cover were transformed into built-up areas, while between 2001 and 2011, almost 12.5 km2 of vegetation cover was converted into agricultural land, and between 2011 and 2021, a nearly 15.6 km2 vegetation cover was converted to agricultural land. From 2001 to 2021, a considerable shift in the barren land was observed, with a total area of 12.63 km2 being transformed into built-up areas, agricultural land, and vegetative cover. During the investigation, water bodies were converted into agricultural land and built-up land. The total built-up area was increased to about 35.8 km2 between 2011 and 2021, which covered about 14.4% of the total area of the English Bazar block. It was also noticed that a large area was converting from water bodies to agricultural land by almost 15 km2. The vegetation cover also decreased over time, which was transformed into agricultural land and barren land in 28 and 5.2 km2. A significant change in barren land was noticed in a 3.2 km2 area, which was transformed into a built-up area, while a 6.3 km2 area was converted into agricultural land during 2001–2021. The area under water bodies has gained from the area under agricultural land through the conversion of 3.5 km2.
During 2001–2021, the pattern of built-up expansion is shown in Figure 5, which illustrates how the built-up area expanded in the region. Here, we observed four classes of built-up changes, with non-built-up to built-up showing an increasing trend. The term unchanged built-up refers to a region that was built up during a preceding time. In the English Bazar block built-up area expanding all sides of the block, some parts increased quickly and some parts slowly. In Figure 5, the changing pattern from 2001 to 2021 showed a huge increase of the built-up area; this expansion was mainly done along the road and riverside. The built-up area witnessed linear expansion along the SH-10 in the western part and NH-34 in the south-central part, as well as beside the Mahananda in the eastern part and Kalindri River in the northern part of the English Bazar block. Although, we observed few unusual conversions in the present study. That is, few small amounts of areas were converted from built-up to non-built-up (other LULC classes) because of frequent flooding and the eviction of unlawful settlements, such as slums, especially from the riverbank of Mahananda River, as reported by the local authorities.

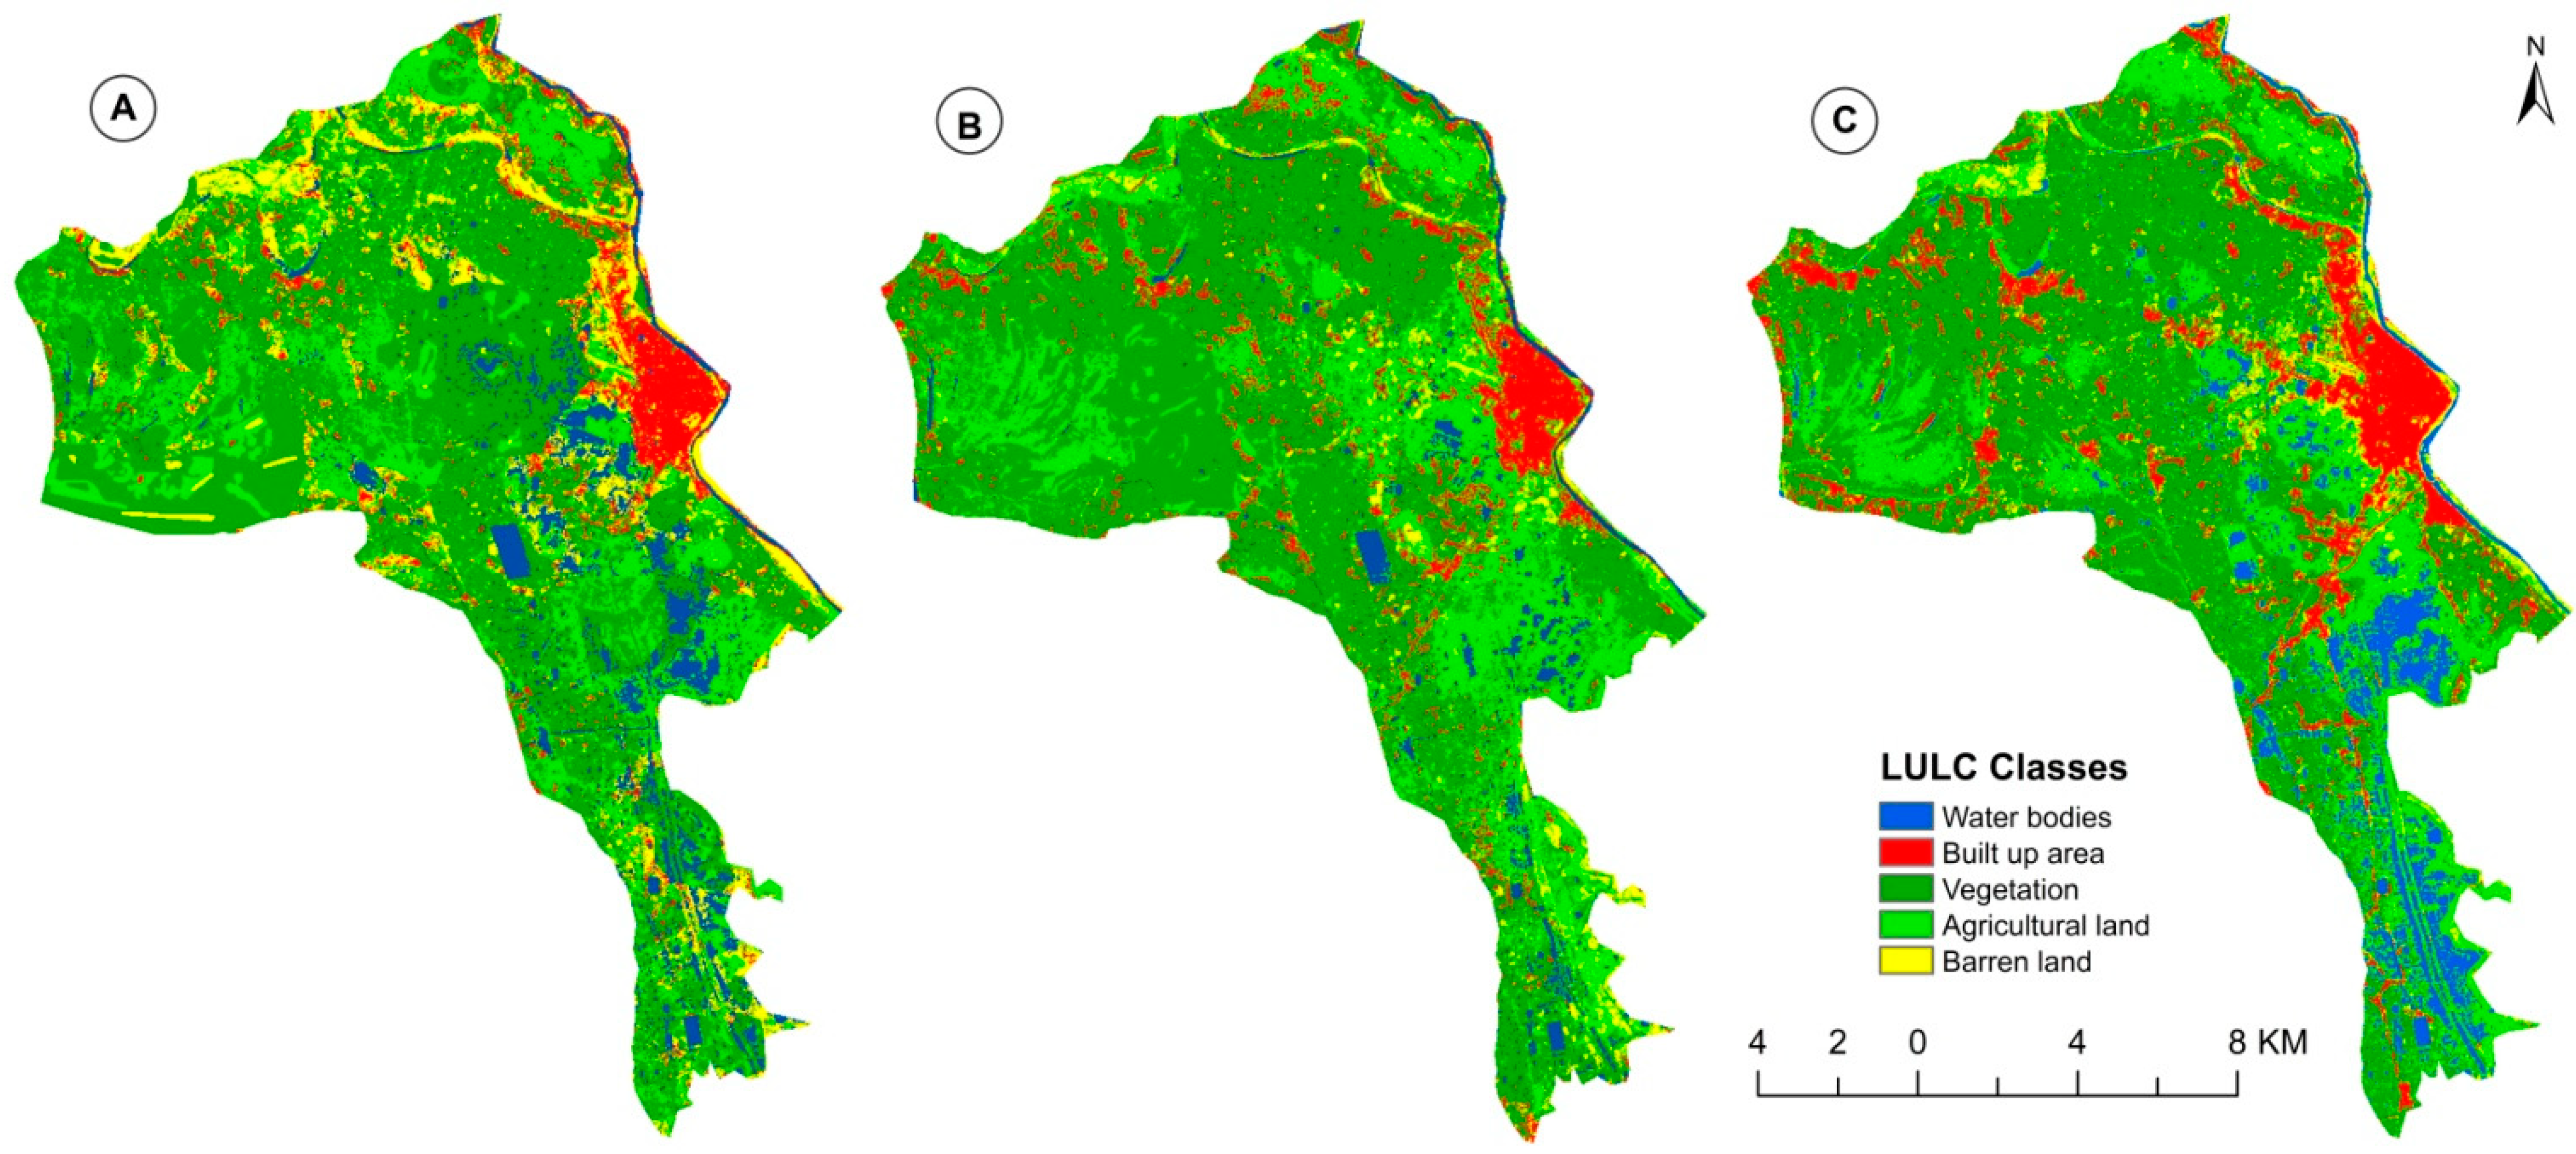
3.4. Analysis of the Built-Up Expansion Process

We employed a landscape fragmentation and frequency approach model to demonstrate the process of built-up expansion in the English Bazar. Using these models, we could easily explore the process of built-up expansion growth, its trend, and pattern. The process of built-up expansion was modelled using fragmentation indices, and it classified the built-up area into six fragmentation indices, such as large core, medium core, small core, perforated, edge, and patch (Figure 6). The large core indicates a built-up area of more than 500 acres and can be considered as the most stable and permanent built-up area. In contrast, the small core indicates an area of less than 250 acres and can be considered as the concentration of a newly formed built-up that has been expanding outwards from the main core. The results showed that the large core of the built-up area covered 2.92 km2 in 2001, which then increased to 3.8 km2 and was amplified by 7.42 km2. This scenario shows that the large core of the built-up area, identified in 2001, was fixed three times. However, the medium core and small core during 2001 and 2011 were concentrated, along with the large core areas, and, ultimately, converted into large core areas in 2021. This scenario reflects increasing the large core of the built-up area through the process in the study area. Additionally, the small and medium cores in the study area observed increasing areas; for instance, in 2001, the small and medium cores were 1.4 and 0.94 km2, which increased to 4.4 and 5.36 km2. The small and medium cores observed significant growth because of the fresh and isolated built-up node conversion. In 2001, the core area was mainly concentrated in English Bazar City, but as the population grew over time, the municipality grew proportionately. The core area expanded in the northern and south-western parts, primarily along national highway-34 and state highway-10. Bagbari, Daulatpur, Milki, Makdumpur, Sonatala, Uttarjadupur, Maheshpur, Uttarramchandrapur, and other regions were identified as small and medium cores in the extreme northern, southern, and western parts of this study area in 2021. The edge and perforated areas mainly showed surrounding English Bazar City, particularly fresh and isolated urban nodes, as well as new patches, which can be found sparsely in the western, southern, and northern parts, namely Sultanpur, Shyampur, Niamatpur, and Kirki. The results showed that the areas under the perforated and patch categories were 6.24 km2 and 13.42 km2 in 2001, which increased to 13.23 km2 and 17.86 km2 in 2021 (Figure 6). These fresh and isolated built-up nodes were once a rural neighbourhood, but the economic and infrastructural growths triggered the urbanisation process to take place over there. Therefore, some of the perforated and patch areas progressed outwards and were connected with small and medium cores over time. This is how the small, medium, and large cores have increased tendencies. During this research, it was discovered that substantial expansion has occurred along the transportation network, primarily the road and railway [61].
The frequency approach was used in this study to illustrate the built-up expansion of the English Bazar block, and the results were promising. The probability of an occurrence, according to the frequency theory, is the upper limit of the relative frequency with which the event occurs in repeated trials under essentially identical conditions. Thus, using this model, we can immediately grasp the newly developed extended area that has been constructed. The built-up regions for three different eras were layered in this model, and a final map was created that depicted three different periods: three times, two times, and one time, respectively. Consequently, we could quantify the built-up expansion over time rapidly. The results demonstrated that the number three represents a permanent or stable built-up area, which reflects that built-up areas were common in 2001, 2011, and 2021 in those particular places, as depicted by the sky blue hue (Figure 7). While value two in the frequency approach shows that the region has observed a built-up area two times in particular places (2001 and 2011), as represented by the deep blue colour. Value one shows that the region has witnessed one instance of a newly constructed built-up area, shown by the red colour. Therefore, the findings show that the fresh and isolated built-up nodes covered a 10.98 km2 area, indicated by value one, while the built-up transition area, indicated by value two, covered a 10.24 km2 area (Figure 7). The transition zone is the most unstable area, which gains areas from fresh and isolated built-up areas and loses to stable or permanent built-up areas. The most economical and infrastructural growth can be observed in this zone recently. In the case of new and isolated built-up nodes, medium and small enterprises, as well as health and educational centres, help them grow into urban areas.

3.5. Analysis of Built-Up Expansion Probability

Using SAGA GIS, we first created the dominance, diversity, and connectivity models as parameters for analysing the structural pattern of the built-up area. It used to understand the present situation and probability of built-up expansion. In this context, the parameter, like urban dominance, refers to the web of influences that particular cities sustain within a system of cities as the new orthodoxy in urban planning and development; diversity makes cities more cosmopolitan and economically productive, with different economic activity and opportunities. Diverse roles in the municipality in the urban hierarchy attract a vast population. Connectivity refers to how easily passengers or freights may move from one node to another, either directly (directly) or indirectly (through another node or a series of nodes). It is a crucial indicator of built-up growth. The values in these three models varied from 0 to 1, with 0 showing a low built-up concentration and 1 showing a high one. In this three-model analysis, it was discovered that a substantial concentration zone existed in the municipality and its surroundings and several areas next to the NH-34. The municipal area, particularly Rathbari, is a key transit hub for the Malda and North Bengal regions. As a result, the development grew from the municipal territory to both sides of the road network. After that, we used the fuzzy membership tool in arc GIS to unidirectionally show all the parameters, resulting in a fuzzified dominance, diversity, and connectivity model that varied from 0 to 1, showing the same outcome as before. Then, with the help of the fuzzy overlay tool and the and/or gamma operators, we utilised these three fuzzified models to build the final built-up expansion model. Its values ranged from 0 to 1, and the final map depicts the future built-up expansion probability of the English Bazar block (Figure 8).
Based on the parameters (dominance, diversity, and connectivity), the final output using a fuzzy logic model ranged between 0 and 1, indicating high to low built-up expansion probability in stretch format. Then, we used a natural break algorithm to classify the stretch built-up probability expansion index into three classes, such as high, moderate, and low built-up expansion probability zones. The results showed that a 103.2 km2 area has been predicted as a high built-up expansion probability zone, followed by moderate (89.01 km2) and low built-up expansion probability zones (59.62 km2) (Figure 9A). All the parameters positively influenced the built-up expansion, which indicate that where the value of the parameters is higher, the probability of built-up expansion will also be higher. As the higher value of the dominance, diversity, and connectivity parameters were seen in the eastern part of the study area, therefore, these parts have experienced a higher built-up expansion probability. A higher concentration of all the parameters means a higher accessibility rate of the region, which will also experience higher built-up growth in the future. It appears that the surrounding rural areas of the municipality will have a greater chance to convert into urban areas, primarily the area adjacent to NH-34, so its expansion will be concentrated in the southwest and northern parts of the study area. Furthermore, while being a rural residential area, its western half has a good chance of growing in population. Barbara, Sonatala, and Milik were designated as census towns in 2011, and our research revealed that this area is in a high built-up probability expansion zone, implying that these areas have a high proclivity to expand their built-up areas and that this area has also been transformed into an urban area because of urban expansion (Figure 9). Maheshpur, Makdumpur, Pirozpur, Lalapur, Mathurapur, and Uttarramchandrapur are among the 11-g panchayats in the English Bazar block, with the majority of them having moderate built-up expansion likelihood. As a result of the spread effect of the English Bazar municipal area, its fringe areas such as Makdumpur, Barbara, Uttarramchandrapur, and Maheshpur have seen significant changes in terms of built-up expansion, and they may be converted into urban areas and merged with the municipality of English Bazar block. The areas with the lowest built-up expansion potential were found in some parts of the study area’s north, south, west, and central regions, because this area either has the mango forest or water bodies, and parallel to this, these parts also suffered from lousy connectivity. Though the municipality of the English Bazar block is a type-I city, according to the 2011 Census with a population of 274,627 and a population density of 1100/km2 and, also, the municipality had a 2.16 lakhs population, it has a high chance or probability of expanding their built-up area with a much higher rate in the future, and our study also revealed the probable expansion zone. A significant reason for this high expansion is its nodal connectivity location, fertile soil, which enhanced the agricultural activities, primarily mango groves and some food processing industries, and its growing business capacity.
The field survey was conducted to see how the built-up expansion has been taking place in the study area, such as nursing homes, two/four-wheeler showrooms, residences, apartment houses, and retail malls, and soon, which have been developed on open land. One of the most striking observations we made was that most construction activity has been taking place along the roadside, mostly alongside NH-34. Here are some photographs from the field that we took during the survey (Figure 10).

4. Discussion

This paper presents an easy and sophisticated method for exploring the process of built-up expansion mapping and modelling the built-up expansion probability. Our primary aim was to model the process of built-up expansion and delineate the probability for the English Bazar block. In the present study, we divided the whole Discussion section into several parts based on the objectives and analyses.

4.1. LULC Mapping and Dynamics

The present study generated the LULC maps for three periods using the SVM algorithm. We used this machine learning algorithm, because many studies have already been conducted successfully with this and obtained highly accurate results. Thanh Noi and Kappas [54] applied SVM, RF, and K-nearest neighbour for LULC classification and found that SVM obtained the highest overall accuracy compared to the other two models. Similarly, Singh et al. [55] used SVM to classify the LULC for Pichavaram forest on the southeast coast of India. They found that 89–94% of kappa statistics for the LULC maps of 1991, 2000, and 2009 show the higher performances of SVM classifiers. On the other hand, Rana and Suryanarayana [56] utilised the maximum likelihood, RF, and SVM algorithms to classify LULC for the Vishwamitri watershed in Vadodara, India, found that SVM outperformed other models. Therefore, it can be stated that many previous studies obtained highly accurate results for LULC classification using SVM. While, in the present study, we also obtained 90–94% accuracy for the LULC of 2001, 2011, and 2021, this suggests that the generated LULC maps are highly accurate and reliable. The results of the LULC dynamics show that the LULC transformation in English Bazar occurred rapidly from 2001 to 2021. The predominance of the built-up area replacing agricultural land characterised these transformations. Other studies have reported the increasing percentage of the built-up area in the English Bazar and West Bengal state [11,46,59]. The water bodies, especially in the southern part of the study area, created a cascading pattern (shape) from 2001 to 2021. The area under it decreased from 2001 to 2011 and then increased again from 2011 to 2021. The area under water bodies declined from 2001 to 2011 because of its conversion to agricultural land by filling up water bodies [56]. From 2001 to 2021, the area under the water bodies increased because of the widespread floods of 2017, which converted many low-lying areas into water bodies because of permanent water-logging conditions [56]. The area under barren land has decreased significantly. It has been converted into agriculture and built up because of the paucity of space for increasing the population and mango farming, which is the mainstay of the economy for Malda District [46]. The findings show that changes in the agricultural land, vegetation, water bodies, and the built-up area had the most significant influence on the landscape heterogeneities [60]. Land use change aided the transformation of the landscape, especially for the rise of the built-up area. Additionally, the conversion of vegetation and agricultural land to a built-up area, and barren land converted into agricultural land, implies that the intensity of human activities affects land use change, landscape fragmentation, and ecological change [62].

4.2. Process of Built-Up Expansion

In the present study, we introduced the process of built-up expansion through the fragmentation and frequency approach. The steps of built-up expansion over time have been identified using the six indices of the landscape fragmentation approach. The results showed that the perforated and patch category areas were 6.24 km2 and 13.42 km2 in 2001, respectively, and have risen to 13.23 km2 and 17.86 km2 in 2021 (Figure 6). These new and isolated built-up nodes were originally rural neighbourhoods. The study area has experienced an economic and infrastructure progression because of the rise of MSME and governmental schemes that has accelerated the urbanisation process. As a result, some of the perforated and patched portions have expanded outwards through time, eventually connecting with small and medium cores. Replacing the edges and patches in the study period has increased the core categories. The increase in the percentage of the core can be attributed to the increasing built-up density and the conversion of intervening spaces into the built-up and the emergence of a new infrastructure [46]. The emergence of new patches and edge is widespread, signifying the spatial expansion of built-up areas by replacing agricultural land. Additionally, the results showed that, in 2001, the large core of the built-up area encompassed 2.92 km2, which was amplified by 7.42 km2 in 2021. As shown in this scenario, the large core of the built-up area, defined in 2001, was fixed three times but gained extra area in 2011 and 2021. Many studies reported that agricultural land is continuously declining in English Bazar over time [11,14,46]. Additionally, the frequency approach mimics fragmentation results, in which the permanent built-up area (frequency 3) is present in the core areas. In contrast, frequency 1 was fresh and isolated built-up nodes, while frequency 2 was the built-up transition area of small and medium cores. In this way, we showed the process of built-up expansion at the spatial scale. However, the research on the process of built-up expansion has not been explored yet using remote sensing as per the authors’ knowledge; most of the research has concentrated on the overall built-up expansion mapping and pattern analysis [63,64]. As shown by the current study, the area under build up has been increasing gradually over time, which can result in several socioecological problems, such as UHI [65], pollution [66], urban flooding, etc., in English Bazar and its contiguous areas in recent decades.

4.3. Built-Up Probability Modelling

In the current study, the built-up probability modelling was done using three parameters, such as dominance, diversity, and connectivity models. The results showed that the values of all three models (dominance, diversity, and connectivity) for English Bazar were very high in the urban part and its surrounding area. We constructed a built-up expansion probability model by integrating the dominance, diversity, and connectivity models using fuzzy logic. It is predicted that considerable expansion will occur around the main city centre, NH-34 and SH-10, and some western regions. Increased populations, migration, small agro-based industrial sector, and transportation nodal location of the English Bazar block are all significant factors that have led to a transformation in the land use pattern [11,46,67,68]. However, one of the significant factors of unplanned built-up expansion was local and national government plans and policies. The rise of small-scale industrial activity in industrial axes and cities encourages investors to invest and develop an infrastructure. This acts as a pull factor for the population of its surrounding rural area or neighbouring district. Therefore, the new residential area was developed for the migrants.
Similarly, the rapid development of small industrial towns, health centres, educational institutes, and transportation networks has attracted the population to come and settle over there, which significantly influences land use change. The scattered settlements in rural areas were also expanded because of many central and state government-sponsored projects, such as ‘Pradhan Mantri Gram Sadak Yojana’ (PMGSY) of the central government and ‘Pathashree Abhijan’ of the state government. These schemes boosted the process of the rapid construction of the road throughout the country (which enhanced the connectivity and linked it with the urban area). Additionally, other schemes, for pucca (concrete) houses under the ‘Pradhan Mantri Awas Yojana’ (PMAJ), accelerate the process of built-up expansion. The increase in agricultural activities may be another factor of enormous expansion in the rural built-up sector [56,59]. Due to these changes, vegetation, agricultural land, water bodies, and barren land were converted into built-up areas. Thus, with built-up growth and expansion during this period, the dominant landscape was gradually replaced by an urban landscape, resulting in a shift in the region’s natural ecosystem and the formation of a more fragmented landscape pattern of natural resources [69,70]. Additionally, the distance from roads negatively affects built-up developments. Hence, built-up transitions are typically seen near roads [61,71,72]. In the present study, we delineated the future built-up expansion probability based on these factors.
We verified the results using Google Earth images (Figure 11), and it also shows the rapid built-up growth over time, similar to our models. The built-up growth can be seen outwards from the centre, which signifies the probable built-up expansion area.

4.4. Policy Recommendation for Urban Planning and Future Research Scope

To the best of the authors’ knowledge, a study on built-up probability has not been conducted so far. Many studies have investigated the effect of urbanisation on land use change [11,12,13,14,15,30,43,68,73]. However, most of the studies were focused mainly on the urban area. However, we considered rural and urban areas in this research paper and showed their future built-up growth probability. Built-up growth centres are primarily in the southwestern and north-western regions of the municipality area, and some of them are in the western part of the English Bazar block. It also shows that not every village is adjacent to a dense region, which is a potential growth hub in the future. The outcome of the present study showed that the municipal area witnessed an urban sprawl beyond its administrative boundary after 2011. This research identified about 20 villages as high-probability future growth hubs and 38 villages as moderate-probability future growth centres based on the dominance, diversity, and connectivity parameters. The significant probability will be surrounded by the city and along the NH-34. Therefore, it is suggested that these should be immediately stopped to maintain the remaining natural resources and, if feasible, restore them. If we inspect the distribution of trees in the urban region, we can see that trees are scarce in the urban area, altering the microclimate and forming an urban heat island (UHI). Due to this, the present study suggests that more green space be created in the English Bazar urban region, such as along the Badh road, Subhankar sisu udhyan, Chatra wetland, University of Gour Banga, etc. A similar suggestion can be followed in other built-up nodes such as Samsi, Pukhuria, Pakuahat, etc. English Bazar City has suffered from the UHI effect [61]; therefore, generating more green spaces will help reduce this UHI effect. It will also improve the air quality of the study area and provide comfort to the citizens.
Systematic and uniformly distributed urbanisation or built-up expansion has not been seen in small and medium-sized cities. It is noticed that urban growth can be observed in some regions of small and medium-sized cities. Therefore, with the help of the fragmentation model, it is possible to identify the place of growth with the direction and magnitude. If the interval is reduced to the three-five-year interval, the direction of growth, and the actual reason behind the growth, can be identified. Therefore, unwanted rapid urban growth can be prevented in those areas.

5. Conclusions

The primary purpose of this research was to explore the process of built-up expansion and model the future built-up probability zones based on the datasets from 2001 to 2021. Our findings showed that the study area observed a sharp rise in built-up areas, accompanied by a decrease in agricultural and vegetation cover. The built-up fragmentation model identified the process of built-up expansion in the form of permanent, isolated, and newly formed built-up areas. Then, using the frequency approach model, the process of built-up expansion over time was created on a single map, showing it during three separate periods. Then, the dominance, diversity, and connection models were employed as parameters for the built-up probability model. Finally, we used the fuzzy logic-based built-up stability and built-up probability model to predict future built-up growths and trends. The results showed that the built-up area in the study area increased in tandem with the substantial economic expansion. In the previous 20 years (2001–2021), the built-up area has grown by nearly 2.5 times what it was, with a 36 km2 net increase. Between 2001 and 2021, the LULC was altered, demonstrating a rise in a built-up area (almost by 6%) but a decrease in vegetation cover (by 4.54%) and agricultural land (by 3.78%). Moreover, from 2001 to 2021, barren land was also converted into agricultural land, built-up, and vegetation cover because of the increasing population, the necessity for food, and mango farming, a dominant orchard in Malda District. The expansion and growth of the built-up regions and the elimination of agriculture and vegetation across the English Bazar increased its population and subsequent economic development. According to this study, the English Bazar municipality has established itself as a permanent and stable location for built-up areas that span time and geography (beyond its administrative boundary). The study has some limitations, although we developed a model for the urban growth process and the likelihood of future urban expansion, which can minimise urban sprawling and foster compact green towns. We employed a satellite image with a moderate resolution, which has certain limitations in recognising built-up areas and traditional machine learning methods like SVM. High-resolution satellite imagery and deep learning algorithms can solve these problems. We can finely detect the expansion of urbanisation with minor errors using high-resolution satellite images such as Sentinel, LISS-IV, Worldview, QuickBird, and others. After tackling the drawbacks, these approaches can be implemented in small and medium-sized cities for proper management. The MODIS and night-time images can be used in future research with the proposed models for exploring the urbanisation process and the probability of large and megacities. The U-Net model (deep learning model) can be used in future research to analyse and predict urbanisation expansion, providing pixel-level information with great accuracy.

Author Contributions

Conceptualisation, T.D., A.R.M.T.I., A.M. and A.R.; software, T.D., S.T. and S.; validation, M.W.N., A.P., M.S.A. and S.P.; formal analysis, T.D., S.T. and A.M.; investigation, M.W.N., S.T. and A.R.M.T.I.; resources, A.R., M.S.A. and A.M.; data curation, T.D., S.T. and S.; writing—original draft preparation, T.D., A.P., S.T., and S.; writing—review and editing, A.R. and S.P.; visualisation, S.T. and A.M.; supervision, A.R., A.M. and S.P.; project administration, A.R. and A.M.; and funding acquisition, A.M. All authors have read and agreed to the published version of the manuscript.

Funding

This research received no external funding.

Data Availability Statement

Not applicable.

Acknowledgments

All the authors are thankful to the USGS for making the Landsat data freely available.

Conflicts of Interest

The authors declare no conflict of interest.

References

  1. United Nations Department of Economic and Social Affairs. World Urbanization Prospects: The 2018 Revision. Available online: https://population.un.org/wup/ (accessed on 5 March 2022).
  2. Seto, K.C.; Fragkias, M.; Guneralp, B.; Reilly, M.K. A meta-analysis of global urban land expansion. PLoS ONE 2011, 6, e23777. [Google Scholar] [CrossRef] [PubMed]
  3. Seto, K.C.; Güneralp, B.; Hutyra, L.R. Global forecasts of urban expansion to 2030 and direct impacts on biodiversity and carbon pools. Proc. Natl. Acad. Sci. USA 2012, 109, 16083–16088. [Google Scholar] [CrossRef] [PubMed] [Green Version]
  4. Chakraborty, S.; Maity, I.; Dadashpoor, H.; Novotnẏ, J.; Banerji, S. Building in or out? Examining urban expansion patterns and land use efficiency across the global sample of 466 cities with million+ inhabitants. Habitat Int. 2022, 120, 102503. [Google Scholar] [CrossRef]
  5. Rahman, A.; Kumar, Y.; Fazal, S.; Bhaskaran, S. Urbanization and quality of urban environment using remote sensing and GIS techniques in East Delhi-India. J. Geogr. Inf. Syst. 2011, 3, 62–84. [Google Scholar] [CrossRef] [Green Version]
  6. Wolch, J.R.; Byrne, J.; Newell, J.P. Urban green space, public health, and environmental justice: The challenge of making cities “just green enough”. Landsc. Urban Plan. 2014, 125, 234–244. [Google Scholar] [CrossRef] [Green Version]
  7. Hennig, E.I.; Schwick, C.; Soukup, T.; Orlitová, E.; Kienast, F.; Jaeger, J.A.G. Multi-scale analysis of urban sprawl in Europe: Towards a European de-sprawling strategy. Land Use Policy 2015, 49, 483–498. [Google Scholar] [CrossRef] [Green Version]
  8. Chadchan, J.; Shankar, R. An analysis of urban growth trends in the post-economic reforms period in India. Int. J. Sustain. Built Environ. 2012, 1, 36–49. [Google Scholar] [CrossRef] [Green Version]
  9. Dewan, A.M.; Yamaguchi, Y. Land use and land cover change in greater Dhaka, Bangladesh: Using remote sensing to promote sustainable urbanization. Appl. Geogr. 2009, 29, 390–401. [Google Scholar] [CrossRef]
  10. Ranagalage, M.; Morimoto, T.; Simwanda, M.; Murayama, Y. Spatial Analysis of Urbanization Patterns in Four Rapidly Growing South Asian Cities Using Sentinel-2 Data. Remote Sens. 2021, 13, 1531. [Google Scholar] [CrossRef]
  11. Shaw, R.; Das, A. Identifying peri-urban growth in small and medium towns using GIS and remote sensing technique: A case study of English Bazar Urban Agglomeration, West Bengal, India. Egypt. J. Remote Sens. Space Sci. 2018, 21, 159–172. [Google Scholar] [CrossRef]
  12. Shahfahad; Mourya, M.; Kumari, B.; Tayyab, M.; Paarcha, A.; Asif; Rahman, A. Indices based assessment of built-up density and urban expansion of fast-growing Surat city using multi-temporal Landsat data sets. GeoJournal 2020, 86, 1607–1623. [Google Scholar] [CrossRef]
  13. Chettry, V.; Surawar, M. Assessment of urban sprawl characteristics in Indian cities using remote sensing: Case studies of Patna, Ranchi, and Srinagar. Environ. Dev. Sustain. 2021, 23, 11913–11935. [Google Scholar] [CrossRef]
  14. Das, M.; Das, A. Dynamics of Urbanization and its impact on Urban Ecosystem Services (UESs): A study of a medium size town of West Bengal, Eastern India. J. Urban Manag. 2019, 8, 420–434. [Google Scholar] [CrossRef]
  15. Nengroo, Z.A.; BhatNissar, M.S.; Kuchay, A. Measuring urban sprawl of Srinagar city, Jammu and Kashmir, India. J. Urban Manag. 2017, 6, 45–55. [Google Scholar] [CrossRef]
  16. Pawe, C.K.; Saikia, A. Decumbent development: Urban sprawl in the Guwahati Metropolitan Area, India. Singap. J. Trop. Geogr. 2020, 41, 226–247. [Google Scholar] [CrossRef]
  17. Shaban, A.; Kourtit, K.; Nijkamp, P. India’s urban system: Sustainability and imbalanced growth of cities. Sustainability 2020, 12, 2941. [Google Scholar] [CrossRef] [Green Version]
  18. Census of India. Provisional Population Totals Urban Agglomerations and Cities 2011. Available online: https://censusindia.gov.in/2011-prov-results/paper2/data_files/india2/1.%20data%20highlight.pdf (accessed on 6 March 2022).
  19. Raman, B.; Prasad-Aleyamma, M.; de Bercegol, R.; Denis, E.; Zérah, M.-H. Selected Readings on Small Town Dynamics in India. USR 3330 “Savoirs et MondesIndiens” Working Papers Series No. 7. No. 2. SUBURBIN Working Papers Series. 2015. Available online: https://hal.archives-ouvertes.fr/hal-01139006/document (accessed on 5 March 2022).
  20. Patra, S.; Sahoo, S.; Mishra, P.; Mahapatra, S.C. Impacts of urbanization on land use/cover changes and its probable implications on local climate and groundwater level. J. Urban Manag. 2018, 7, 70–84. [Google Scholar] [CrossRef]
  21. Dutta, D.; Rahman, A.; Kundu, A. Growth of Dehradun city: An application of linear spectral unmixing (LSU) technique using multi-temporal landsat satellite data sets. Remote Sens. Appl. Soc. Environ. 2015, 1, 98–111. [Google Scholar] [CrossRef]
  22. Mohanta, K.; Sharma, L.K. Assessing the impacts of urbanization on the thermal environment of Ranchi City (India) using geospatial technology. Remote Sens. Appl. Soc. Environ. 2017, 8, 54–63. [Google Scholar] [CrossRef]
  23. Bhagat, R.B. Emerging pattern of urbanisation in India. Econ. Political Wkly. 2011, 34, 10–12. [Google Scholar]
  24. Nechyba, T.J.; Walsh, R.P. Urban sprawl. J. Econ. Perspect. 2004, 18, 177–200. [Google Scholar] [CrossRef] [Green Version]
  25. Wang, X.; Shi, R.; Zhou, Y. Dynamics of urban sprawl and sustainable development in China. Socio Econ. Plan. Sci. 2019, 70, 100736. [Google Scholar] [CrossRef]
  26. Ghazaryan, G.; Rienow, A.; Oldenburg, C.; Thonfeld, F.; Trampnau, B.; Sticksel, S.; Jürgens, C. Monitoring of Urban Sprawl and Densification Processes in Western Germany in the Light of SDG Indicator 11.3.1 Based on an Automated Retrospective Classification Approach. Remote Sens. 2021, 13, 1694. [Google Scholar] [CrossRef]
  27. Bai, X.; McPhearson, T.; Cleugh, H.; Nagendra, H.; Tong, X.; Zhu, T.; Zhu, Y.-G. Linking Urbanization and the Environment: Conceptual and Empirical Advances. Annu. Rev. Environ. Resour. 2017, 42, 215–240. [Google Scholar] [CrossRef] [Green Version]
  28. Talukdar, S.; Rihan, M.; Hang, H.T.; Bhaskaran, S.; Rahman, A. Modelling Urban Heat Island (UHI) and Thermal Field Variation and Their Relationship with Land Use Indices over Delhi and Mumbai Metro Cities. Environ. Dev. Sustain. 2021, 24, 3762–3790. [Google Scholar]
  29. Aram, F.; Solgi, E.; HiguerasGarcía, E.; Mosavi, A.; Várkonyi-Kóczy, A.R. The Cooling Effect of Large-Scale Urban Parks on Surrounding Area Thermal Comfort. Energies 2019, 12, 3904. [Google Scholar] [CrossRef] [Green Version]
  30. Wentz, E.A.; Anderson, S.; Fragkias, M.; Netzband, M.; Mesev, V.; Myint, S.W.; Quattrochi, D.A.; Rahman, A.; Seto, K.C. Supporting global environmental change research: A review of trends and knowledge gaps in urban remote sensing. Remote Sens. 2014, 6, 3879–3905. [Google Scholar] [CrossRef] [Green Version]
  31. Yan, X.; Wang, J. Dynamic monitoring of urban built-up object expansion trajectories in Karachi, Pakistan with time series images and the LandTrendr algorithm. Sci. Rep. 2021, 11, 23118. [Google Scholar] [CrossRef]
  32. Güneralp, B.; Reba, M.; Hales, B.; Wentz, E.; Seto, K. Trends in urban land expansion, density, and land transitions from 1970 to 2010: A global synthesis. Environ. Res. Lett. 2020, 15, 044015. [Google Scholar] [CrossRef]
  33. As-syakur, A.R.; Adnyana, I.W.S.; Arthana, I.W.; Nuarsa, I.W. Enhanced Built-Up and Bareness Index (EBBI) for Mapping Built-Up and Bare Land in an Urban Area. Remote Sens. 2012, 4, 2957–2970. [Google Scholar] [CrossRef] [Green Version]
  34. Zhang, J.; Li, P.; Wang, J. Urban Built-Up Area Extraction from Landsat TM/ETM+ Images Using Spectral Information and Multivariate Texture. Remote Sens. 2014, 6, 7339–7359. [Google Scholar] [CrossRef] [Green Version]
  35. Salem, M.; Tsurusaki, N.; Divigalpitiya, P. Land use/land cover change detection and urban sprawl in the peri-urban area of greater Cairo since the Egyptian revolution of 2011. J. Land Use Sci. 2020, 15, 592–606. [Google Scholar] [CrossRef]
  36. Zheng, Y.; Tang, L.; Wang, H. An improved approach for monitoring urban built-up areas by combining NPP-VIIRS nighttime light, NDVI, NDWI, and NDBI. J. Clean. Prod. 2021, 328, 129488. [Google Scholar] [CrossRef]
  37. Talukdar, S.; Singha, P.; Mahato, S.; Pal, S.; Liou, Y.A.; Rahman, A. Land-use land-cover classification by machine learning classifiers for satellite observations—A review. Remote Sens. 2020, 12, 1135. [Google Scholar] [CrossRef] [Green Version]
  38. Fawad, J.A.; Khan, M.N.; Minallah, N. Impact of Machine Learning Techniques for Lulc Classification of Peshawar Pakistan. Int. Res. J. Mod. Eng. Technol. Sci. 2021, 3, 478–486. [Google Scholar]
  39. Xu, H.Q. A new index for delineating built-up land features in satellite imagery. Int. J. Remote Sens. 2008, 29, 4269–4276. [Google Scholar] [CrossRef]
  40. Omer, G.; Mutanga, O.; Abdel-Rahman, E.M.; Adam, E. Exploring the utility of the additional WorldView-2 bands and support vector machines in mapping land use/land cover in a fragmented ecosystem, South Africa. S. Afr. J. Geomat. 2015, 4, 414–433. [Google Scholar] [CrossRef] [Green Version]
  41. Ul Din, S.; Mak, H.W.L. Retrieval of Land-Use/Land Cover Change (LUCC) Maps and Urban Expansion Dynamics of Hyderabad, Pakistan via Landsat Datasets and Support Vector Machine Framework. Remote Sens. 2021, 13, 3337. [Google Scholar] [CrossRef]
  42. Schulz, D.; Yin, H.; Tischbein, B.; Verleysdonk, S.; Adamou, R.; Kumar, N. Land use mapping using Sentinel-1 and Sentinel-2 time series in a heterogeneous landscape in Niger, Sahel. J. Photogramm. Remote Sens. 2021, 178, 71–111. [Google Scholar] [CrossRef]
  43. Naikoo, M.W.; Rihan, M.; Ishtiaque, M. Analyses of land use land cover (LULC) change and built-up expansion in the suburb of a metropolitan city: Spatio-temporal analysis of Delhi NCR using landsat datasets. J. Urban Manag. 2020, 9, 347–359. [Google Scholar] [CrossRef]
  44. Shahfahad; Rihan, M.; Naikoo, M.W.; Ali, M.A.; Usmani, T.M.; Rahman, A. Urban Heat Island Dynamics in Response to Land-Use/Land-Cover Change in the Coastal City of Mumbai. J. Indian Soc. Remote Sens. 2021, 49, 2227–2247. [Google Scholar] [CrossRef]
  45. Shahfahad; Naikoo, M.W.; Islam, A.R.M.T.; Mallick, J.; Rahman, A. LULC change and its impact on surface urban heat island and urban thermal comfort in a metropolitan city. Urban Clim. 2022, 41, 101052. [Google Scholar] [CrossRef]
  46. Naikoo, M.W.; Rihan, M.; Peer, A.H.; Talukdar, S.; Mallick, J.; Ishtiaq, M.; Rahman, A. Analysis of peri-urban land use/land cover change and its drivers using geospatial techniques and geographically weighted regression. Environ. Sci. Pollut. Res. 2022, 1–19. [Google Scholar] [CrossRef] [PubMed]
  47. Vinayak, B.; Lee, H.S.; Gedem, S.; Latha, R. Impacts of future urbanization on urban microclimate and thermal comfort over the Mumbai Metropolitan Region, India. Sustain. Cities Soc. 2022, 79, 103703. [Google Scholar] [CrossRef]
  48. Dinda, S.; Chatterjee, N.D.; Ghosh, S. An integrated simulation approach to the assessment of urban growth pattern and loss in urban green space in Kolkata, India: A GIS-based analysis. Ecol. Indic. 2021, 121, 107178. [Google Scholar] [CrossRef]
  49. Dutta, I.; Das, A. Application of Geo-Spatial Indices for Detection of Growth Dynamics and Forms of Expansion in English Bazar Urban Agglomeration, West Bengal. J. Urban Manag. 2019, 8, 288–302. [Google Scholar] [CrossRef]
  50. Roy, D.P.; Wulder, M.A.; Loveland, T.R.; Woodcock, C.E.; Allen, R.G.; Anderson, M.C.; Helder, D.; Irons, J.R.; Johnson, D.M.; Kennedy, R.; et al. Landsat-8: Science and product vision for terrestrial global change research. Remote Sens. Environ. 2014, 145, 154–172. [Google Scholar] [CrossRef] [Green Version]
  51. Flood, N. Continuity of reflectance data between landsat-7 ETM+ and landsat-8 OLI, for both top-of-atmosphere and surface reflectance: A study in the australian landscape. Remote Sens. 2014, 6, 7952–7970. [Google Scholar] [CrossRef] [Green Version]
  52. Guo, Y.M.; Guo, L.B.; Hao, Z.Q.; Tang, Y.; Ma, S.X.; Zeng, Q.D.; Tang, S.S.; Li, X.Y.; Lu, Y.F.; Zeng, X.Y. Accuracy improvement of iron ore analysis using laser-induced breakdown spectroscopy with a hybrid sparse partial least squares and least-squares support vector machine model. J. Anal. At. Spectrom. 2018, 33, 1330–1335. [Google Scholar] [CrossRef]
  53. Wu, C.; Du, B.; Cui, X.; Zhang, L. A post-classification change detection method based on iterative slow feature analysis and Bayesian soft fusion. Remote Sens. Environ. 2017, 199, 241–255. [Google Scholar] [CrossRef]
  54. Thanh Noi, P.; Kappas, M. Comparison of random forest, k-nearest neighbor, and support vector machine classifiers for land cover classification using Sentinel-2 imagery. Sensors 2017, 18, 18. [Google Scholar] [CrossRef] [PubMed] [Green Version]
  55. Singh, S.K.; Srivastava, P.K.; Gupta, M.; Thakur, J.K.; Mukherjee, S. Appraisal of land use/land cover of mangrove forest ecosystem using support vector machine. Environ. Earth Sci. 2014, 71, 2245–2255. [Google Scholar] [CrossRef]
  56. Rana, V.K.; Suryanarayana, T.M.V. Performance evaluation of MLE, RF and SVM classification algorithms for watershed scale land use/land cover mapping using sentinel 2 bands. Remote Sens. Appl. Soc. Environ. 2020, 19, 100351. [Google Scholar] [CrossRef]
  57. Galgamuwa, G.A.P.; Barden, C.J.; Hartman, J.; Rhodes, T.; Bloedow, N.; Osõrio, R. Ecological Restoration of an Oak Woodland within the Forest-Prairie Ecotone of Kansas. For. Sci. 2018, 65, 48–58. [Google Scholar] [CrossRef]
  58. Amato, F.; Maimone, B.A.; Martellozzo, F.; Nolè, G.; Murgante, B. The Effects of Urban Policies on the Development of Urban Areas. Sustainability 2016, 8, 297. [Google Scholar] [CrossRef] [Green Version]
  59. Talukdar, S.; Naikoo, M.W.; Mallick, J.; Praveen, B.; Sharma, P.; Islam, A.R.M.T.; Pal, S.; Rahman, A. Coupling geographic information system integrated fuzzy logic-analytical hierarchy process with global and machine learning based sensitivity analysis for agricultural suitability mapping. Agric. Syst. 2022, 196, 103343. [Google Scholar] [CrossRef]
  60. Kowe, P.; Mutanga, O.; Dube, T. Advancements in the remote sensing of landscape pattern of urban green spaces and vegetation fragmentation. Int. J. Remote Sens. 2021, 42, 3797–3832. [Google Scholar] [CrossRef]
  61. Ziaul, S.; Pal, S. Analyzing control of respiratory particulate matter on Land Surface Temperature in local climatic zones of English Bazar Municipality and Surroundings. Urban Clim. 2018, 24, 34–50. [Google Scholar] [CrossRef]
  62. Saadat, M.N.; Gupta, K. Mango cultivation in Malda District, West Bengal: A historical perspective. Asian Agri Hist. 2017, 21, 309–318. [Google Scholar]
  63. Thapa, R.B.; Murayama, Y. Examining spatiotemporal urbanization patterns in Kathmandu Valley, Nepal: Remote sensing and spatial metrics approaches. Remote Sens. 2009, 1, 534–556. [Google Scholar] [CrossRef] [Green Version]
  64. Lopez, J.M.R.; Heider, K.; Scheffran, J. Frontiers of urbanization: Identifying and explaining urbanization hot spots in the south of Mexico City using human and remote sensing. Appl. Geogr. 2017, 79, 1–10. [Google Scholar] [CrossRef]
  65. Basu, T.; Das, A.; Pham, Q.B.; Al-Ansari, N.; Linh, N.T.T.; Lagerwall, G. Development of an integrated peri-urban wetland degradation assessment approach for the Chatra Wetland in eastern India. Sci. Rep. 2021, 11, 4470. [Google Scholar] [CrossRef] [PubMed]
  66. Das, S.; Bhunia, G.S.; Bera, B.; Shit, P.K. Evaluation of wetland ecosystem health using geospatial technology: Evidence from the lower Gangetic flood plain in India. Environ. Sci. Pollut. Res. 2022, 29, 1858–1874. [Google Scholar] [CrossRef] [PubMed]
  67. Yang, Y.; Chen, J.; Lan, Y.; Zhou, G.; You, H.; Han, X.; Wang, Y.; Shi, X. Landscape Pattern and Ecological Risk Assessment in Guangxi Based on Land Use Change. Int. J. Environ. Res. Public Health 2022, 19, 1595. [Google Scholar] [CrossRef]
  68. Byun, G.; Kim, Y. A street-view-based method to detect urban growth and decline: A case study of Midtown in Detroit, Michigan, USA. PLoS ONE 2022, 17, e0263775. [Google Scholar] [CrossRef]
  69. Rwanga, S.S.; Ndambuki, J.M. Accuracy assessment of land use/land cover classification using remote sensing and GIS. Int. J. Geosci. 2017, 8, 611. [Google Scholar] [CrossRef] [Green Version]
  70. Dutta, S.; Dutta, I.; Das, A.; Guchhait, S.K. Quantification and mapping of fragmented forest landscape in dry deciduous forest of Burdwan Forest Division, West Bengal, India. Trees For. People 2020, 2, 100012. [Google Scholar] [CrossRef]
  71. Wentz, E.A.; Nelson, D.; Rahman, A.; Stefanov, W.L.; Roy, S.S. Expert system classification of urban land use/cover for Delhi, India. Int. J. Remote Sens. 2008, 29, 4405–4427. [Google Scholar] [CrossRef]
  72. Ghosh, D.K.; Mandal, A.C.H.; Majumder, R.; Patra, P.; Bhunia, G.S. Analysis for mapping of built-up area using remotely sensed indices-A case study of rajarhat block in Barasatsadar sub-division in west Bengal (India). J. Landsc. Ecol. Repub. 2018, 11, 67–76. [Google Scholar]
  73. Li, H.; Zhou, Y.; Jia, G.; Zhao, K.; Dong, J. Quantifying the Response of Surface Urban Heat Island to Urbanization Using the Annual Temperature Cycle Model. Geosci. Front. 2021, 13, 101141. [Google Scholar] [CrossRef]
Figure 1. Location map of the study area, with the major built-up node and distribution of the training and testing datasets.
Remotesensing 14 02349 g001
Figure 2. Hierarchical structure of the methodological framework of the entire study.
Remotesensing 14 02349 g002
Figure 3. LULC mapping using SVM for the years of (A) 2001, (B) 2011, and (C) 2021 of the English Bazar block.
Remotesensing 14 02349 g003
Figure 4. The LULC transition matrix using a heatmap between the periods of 2001 and 2021.
Remotesensing 14 02349 g004
Figure 5. Built-up change maps between the years of (A) 2001 and 2011, (B) 2011 and 2021, and (C) 2001 and 2021 of English Bazar.
Remotesensing 14 02349 g005
Figure 6. Built-up expansion process model using landscape fragmentation index for (A) 2001, (B) 2011, and (C) 2021 in English Bazar.
Remotesensing 14 02349 g006
Figure 7. Frequency approach model to show the expanded built-up area over time.
Remotesensing 14 02349 g007
Figure 8. Triggering factors for built-up expansion probability modelling using a fuzzy logic model, such as (A) a dominance model, (B) a diversity model, and (C) a connectivity model. The fuzzification of the parameters using the membership function, such as (D) the fuzzified dominance model, (E) fuzzified diversity model, and (F) fuzzified connectivity model.
Remotesensing 14 02349 g008
Figure 9. Fuzzy logic-based (A) built-up stability model, and (B) built-up expansion probability model for English Bazar.
Remotesensing 14 02349 g009
Figure 10. Under construction built-up areas on national highway-34 beyond the administrative boundary of the municipal areas, such as (a) a housing lodge at Gabgachi (1 km away from the University of Gour Banga); (b) a car showroom at the nearby area of Gabgachi, which can help to emerge other allied services in very soon upcoming days; (c) nursing home towards Gazole (another emerging site for the built-up area), which will help other allied services, hotels, restaurant, and others in the upcoming days; and (d) a shopping mall at Madhabnagar (southwards from the municipal areas), which will help to grow new built-up areas, like a garage, petrol stations, small shops, and others.
Remotesensing 14 02349 g010
Figure 11. Present scenario of the urban landscape in the English Bazar block based on high-resolution satellite images (QuickBird, resolution 1 m) from Google Earth. (ac) in upper part of figure shows South-eastern built-up expansion during 2006, 2014, and 2021, away from the municipal area. (a’,b’) in lower part of figure shows South-west built-up growth besides NH-34 during 2007–2021). As previously stated, a significant changing pattern was observed in the southern part of the study area, with water bodies in that area changing over time from 2001 to 2011. Some of it was converted into agricultural land, but from 2011 to 2021, the water bodies area increased again for the reasons previously stated. As a result, the Google Earth images clearly indicate that the water bodies are changing into built-up lands.
Remotesensing 14 02349 g011
Table 1. Details of multitemporal satellite images and their characteristics.
SatelliteSensorsDate/YearPath/RowSpatial Resolution (m)Cloud Cover (%)
Landsat 5Thematic mapper (TM)14 December 2001139/43300.00
Landsat 5Thematic mapper (TM)11 December 2011139/43300.00
Landsat 8Operational land imager (OLI)4 December 2021139/43300.00
Table 2. Description of the LULC classes identified in the study area.
S. NoLULC TypeDescription
1Water bodiesLakes, ponds, river, canals wetlands, or other water-logged areas
2Built-up areaResidential, commercial, and industrial areas, as well as all infrastructure facilities
3VegetationNatural vegetated areas and plantation
4Barren land/sand barLand without any manmade structure and vegetation cover, as well as sandy surfaces along rivers or other water-logged areas
5Agricultural landAll types of cultivatable lands
Table 3. Accuracy assessment using the Kappa statistics of the classified LULC maps for three periods.
LULC Class200120112021
Producers Accuracy (%)Users Accuracy (%)Kappa CoefficientProducers Accuracy (%)Users Accuracy (%)Kappa CoefficientProducers Accuracy (%)Users Accuracy (%)Kappa Coefficient
Water bodies90.0089.000.8794.5693.000.9296.8795.000.94
Built-up area93.2590.000.8896.8294.000.9498.0098.000.97
Vegetation91.5587.000.8795.6095.000.9397.3896.000.96
Barren land88.0091.000.9190.3391.000.9195.8095.000.93
Agricultural land91.5087.000.8689.4590.000.9195.0096.000.94
Overall Classification Accuracy90.0593.6796.24
Kappa Statistics0.880.920.95
Publisher’s Note: MDPI stays neutral with regard to jurisdictional claims in published maps and institutional affiliations.

