Technical Note

Specific Windows Search for Multi-Ship and Multi-Scale Wake Detection in SAR Images

Division of Advanced Manufacturing, Shenzhen International Graduate School, Tsinghua University, Shenzhen 518055, China
*
Author to whom correspondence should be addressed.
These authors contributed equally to this paper.
Remote Sens. 2022, 14(1), 25; https://doi.org/10.3390/rs14010025
Submission received: 23 November 2021 / Revised: 17 December 2021 / Accepted: 19 December 2021 / Published: 22 December 2021
(This article belongs to the Topic Computational Intelligence in Remote Sensing)

Abstract

:
Traditional ship identification systems have difficulty in identifying illegal or broken ships, but the wakes generated by ships can be used as a major feature for identification. However, multi-ship and multi-scale wake detection is also a big challenge. This paper combines the geometric and pixel characteristics of ships and their wakes in Synthetic Aperture Radar (SAR) images and proposes a method for multi-ship and multi-scale wake detection. This method first detects the highlight pixel area in the image and then generates specific windows around the centroid, thereby detecting wakes of different sizes in different areas. In addition, all wake components can be located completely based on wake clustering, the statistical features of wake axis pixels can be used to determine the visible length of the wake. Test results on the Gaofen-3 SAR image show the special potential of the method for wake detection.

Graphical Abstract

1. Introduction

With the development of the marine industry, there are many ports, a huge increase of ships, complicated waterways and rapidly changing sea conditions in marine countries in the world, which greatly increases the risk of ship encounters. Moreover, the exploitation of marine resources has also caused problems such as illegal invasion, illegal fishing and illegal smuggling. Therefore, more and more attention has been paid to marine ship monitoring in the whole sea area. SAR has been widely used in ship detection [1,2], oil spill detection [3], change detection [4,5,6,7] and other fields [8,9] and plays an important role in ship detection due to its wide observation range, short observation period, strong data timeliness and high spatial resolution [10]. At present, SAR image ship detection includes ship body detection and ship wake detection. Compared with the detection of ship body alone, the detection of wake is more valuable in terms of detectability and researchability. First, the wake lasts for a long time: under certain conditions, the wake on the sea can stretch over tens of kilometers, which is often dozens of times the length of the ship [11,12]. In addition, wakes generated by ships in different motion states have different geometric and pixel features. Detection of wakes can not only locate ship targets indirectly, but also determine their sailing speed, track, ship type and other information according to the geometric features of the wakes [13,14,15].
In fact, the linear structure is the main feature of each wake component in the SAR image. These linear features have a certain length and width, and there are narrow regions of bright or dark. Therefore, wake detection can proceed from this linear feature and transform the problem into one of line detection. The Radon transform (RT) or Hough transform (HT) has shown excellent performance in this field [16,17]. In addition, the limited regional characteristics of ship wakes can be transformed into a target detection problem; the rapidly developing deep learning method has also been applied to wake detection. Kang et al. [18] detected ships as well as wakes from SAR images using deep learning based on Convolutional Neural Networks (CNN). The detection rates under adverse weather conditions were 68.4% and 60.0%, respectively. However, deep learning methods usually require a large amount of data support, and there are not enough open wake data sets hindering the rapid development of this method [19,20]. Therefore, most of the current research is based on the traditional wake detection method of RT or HT. Considering that SAR images are seriously disturbed by speckle noise or clutter, a lot of work is focused on image data preprocessing to make the wake characteristics more obvious. Jin et al. [21] proposed a spatial wavelet correlation technique for ship wake detection. After multi-scale edge extraction and spatial correlation, the wake is extracted effectively and the edge of the wake is sharpened significantly. Courmontagne et al. [22] introduced Stochastic Matched Filtering into wake detection, and Arnord-Bos et al. [23] applied it to maximize the signal-to-noise ratio after processing. Biondi [24] considered the polarization information of SAR images and adopted Low-rank Plus Sparse Decomposition followed by RT to perform clutter suppression and extract the interesting wake components. Yang et al. [25] constructed the wake structure dictionary in an analytical way and decomposed the image into structural components including ship wake and sea texture components, which suppressed the marine clutter noise in a disguised way and had a significant effect on ship wake detection in SAR images with complex backgrounds. Additionally, much research is devoted to improving these traditional methods to make them have better applicability and robustness. Copeland et al. [26] proposed line RT: intensity integration is done on short segments instead of on the whole image, which can detect and locate wakes that are obviously smaller than the image dimension. There are also some scholars who use local RT, or a combination of sliding windows for global wake detection [27,28] so as to realize the detection of local short wake. However, this kind of local processing algorithm often consumes a lot of time and computation power, which is not conducive to the real-time detection of wake. Apart from these methods, the circular scanning method [29], the image energy method [30] and the pixel screening method [31,32] also have good performance in the field of wake detection.
Many of the above algorithms are essentially wake extraction under the condition of known wake. However, the actual situation is often that we cannot know how many ships and wakes are contained in the SAR image, and the scale of the wakes cannot be determined in advance. In real SAR ocean background images, a single image may contain many wakes of different sizes and positions, and the wakes usually occupy a small area. Therefore, most of these algorithms cannot effectively deal with the problem of multi-ship and multi-scale wake detection in unfamiliar images. This article from the ship and its wake pixel features and geometric characteristics, puts forward the Specific Window Search method for wake detection, a series of search windows with different sizes and orientations are generated around the highlighted pixel (ship or other man-made objects) field of the image. Each window is scored based on improved RT to screen out the area containing wake components and determine whether the highlighted pixel point in the center is a ship. Then, the turbulence and Kelvin wakes are located by clustering analysis of the candidate locations based on the geometric characteristics of wakes in the region containing wakes. Finally, we extract the pixels on the main axis of the retrieved wake and determine the beginning and end points of the wake based on statistical analysis characteristics and pixel gradient characteristics. As we know, separately detecting ships or wakes can only locate the position or judge the passage of the ship. Only by paired detection of ship and wake can we make better use of their geometric relationship to conduct parameter inversion research [33,34]. This is also the core of the algorithm, which uses highlighted pixels to quickly locate the wake, and the detected wake lines help to determine whether the center is a ship. We have applied the algorithm to SAR images collected by Gaofen-3 [35] and tested multiple images with different backgrounds and styles in the data set to complete wake line localization and length measurement. The main contributions of this paper are as follows:
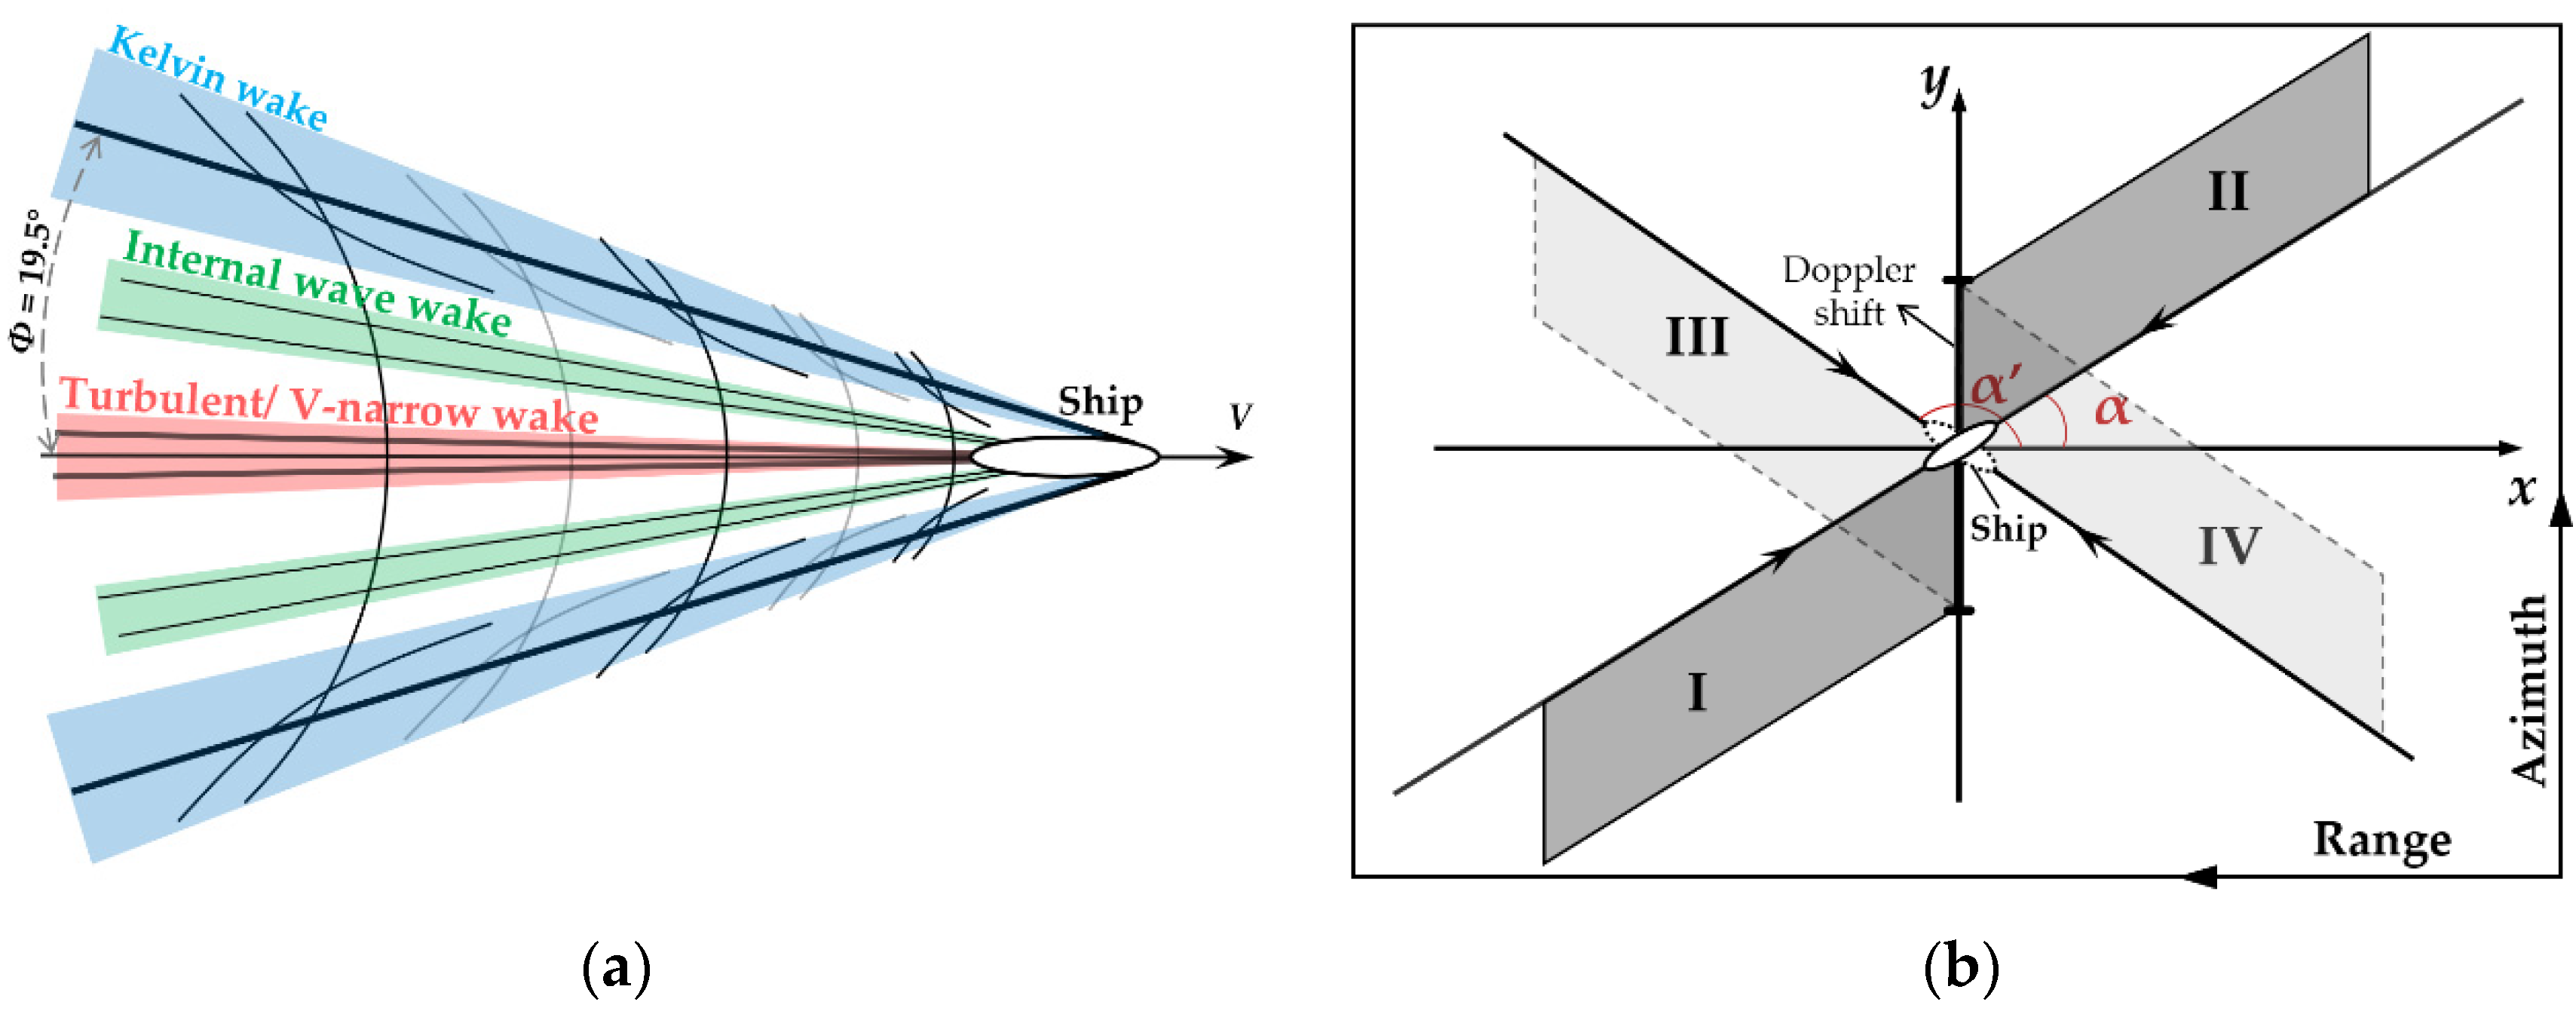
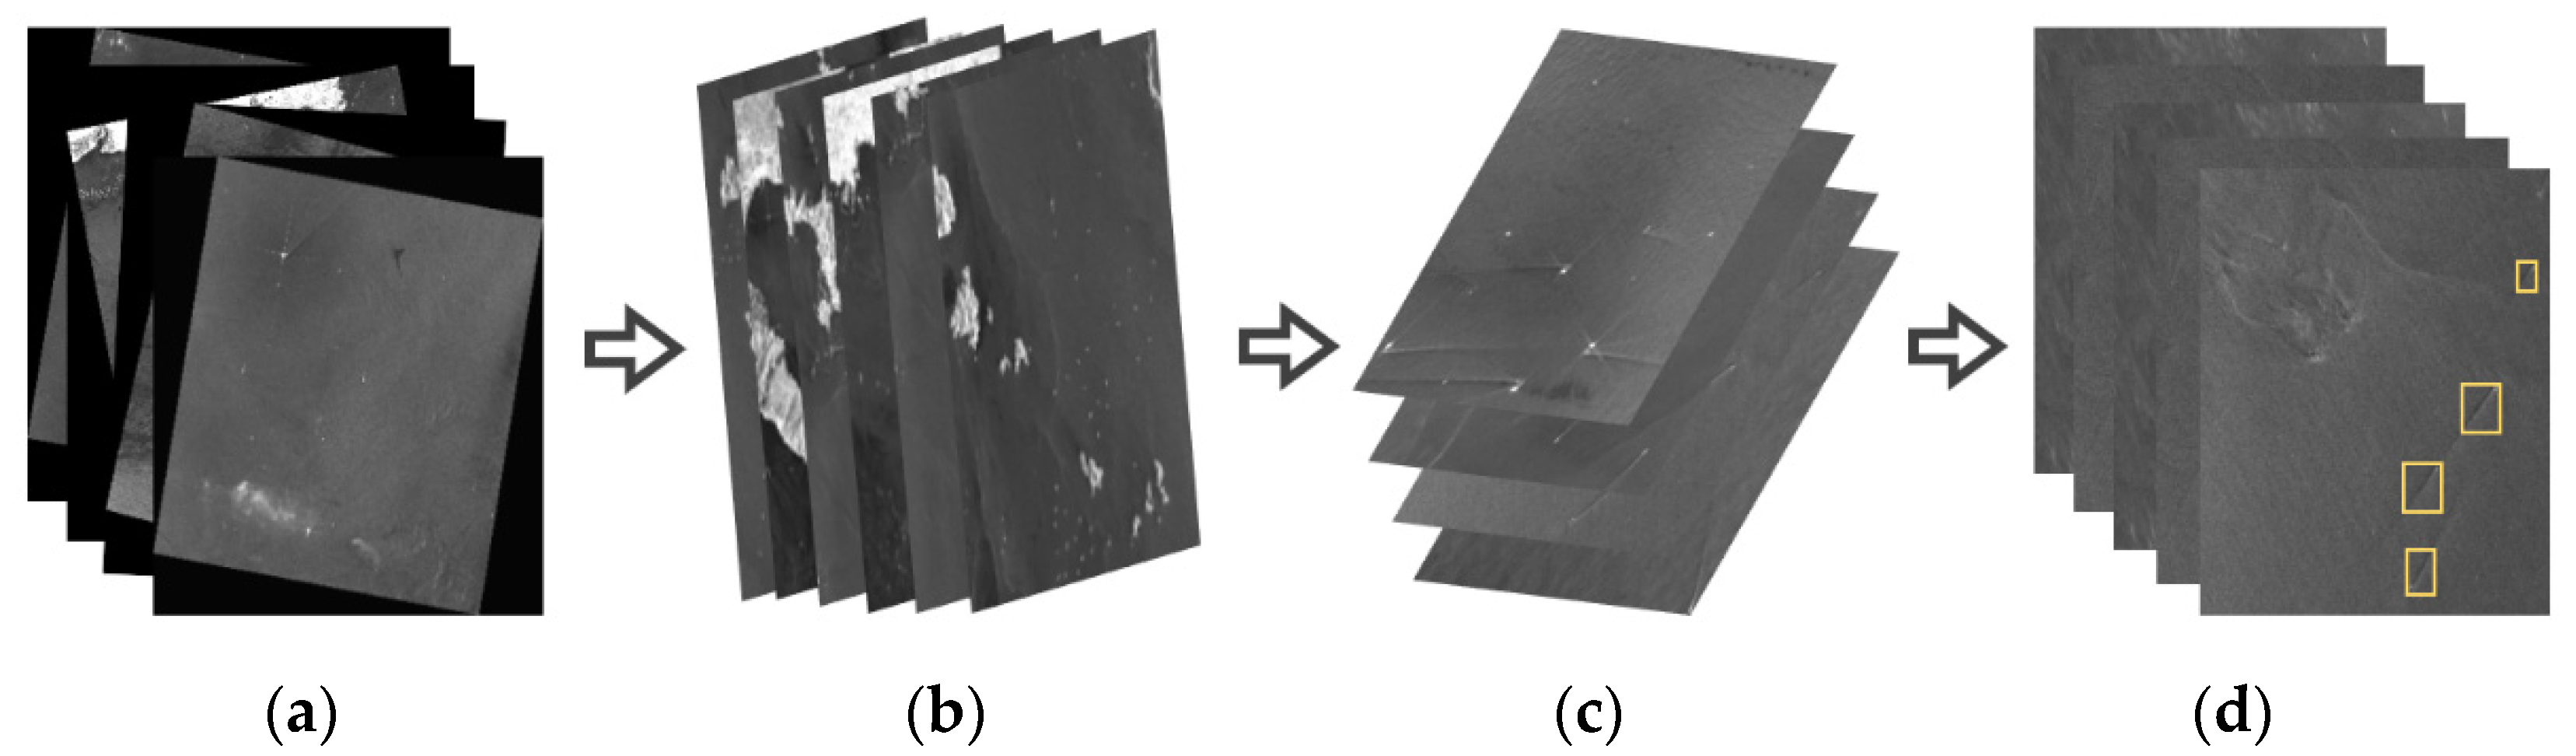
  • A specific window search method different from pre-selected box generation and sliding window search is proposed for the multi-ship and multi-scale wake detection problem. Search sub-windows are generated based on a limited number of highlighted pixel regions in the image, thus greatly reducing the area to be detected.
  • Combining the geometric features of the ship and the wake, we develop the correlation detection of the ship and the wake, which are detected in pairs rather than separately, and help in the inversion of the ship navigation information.
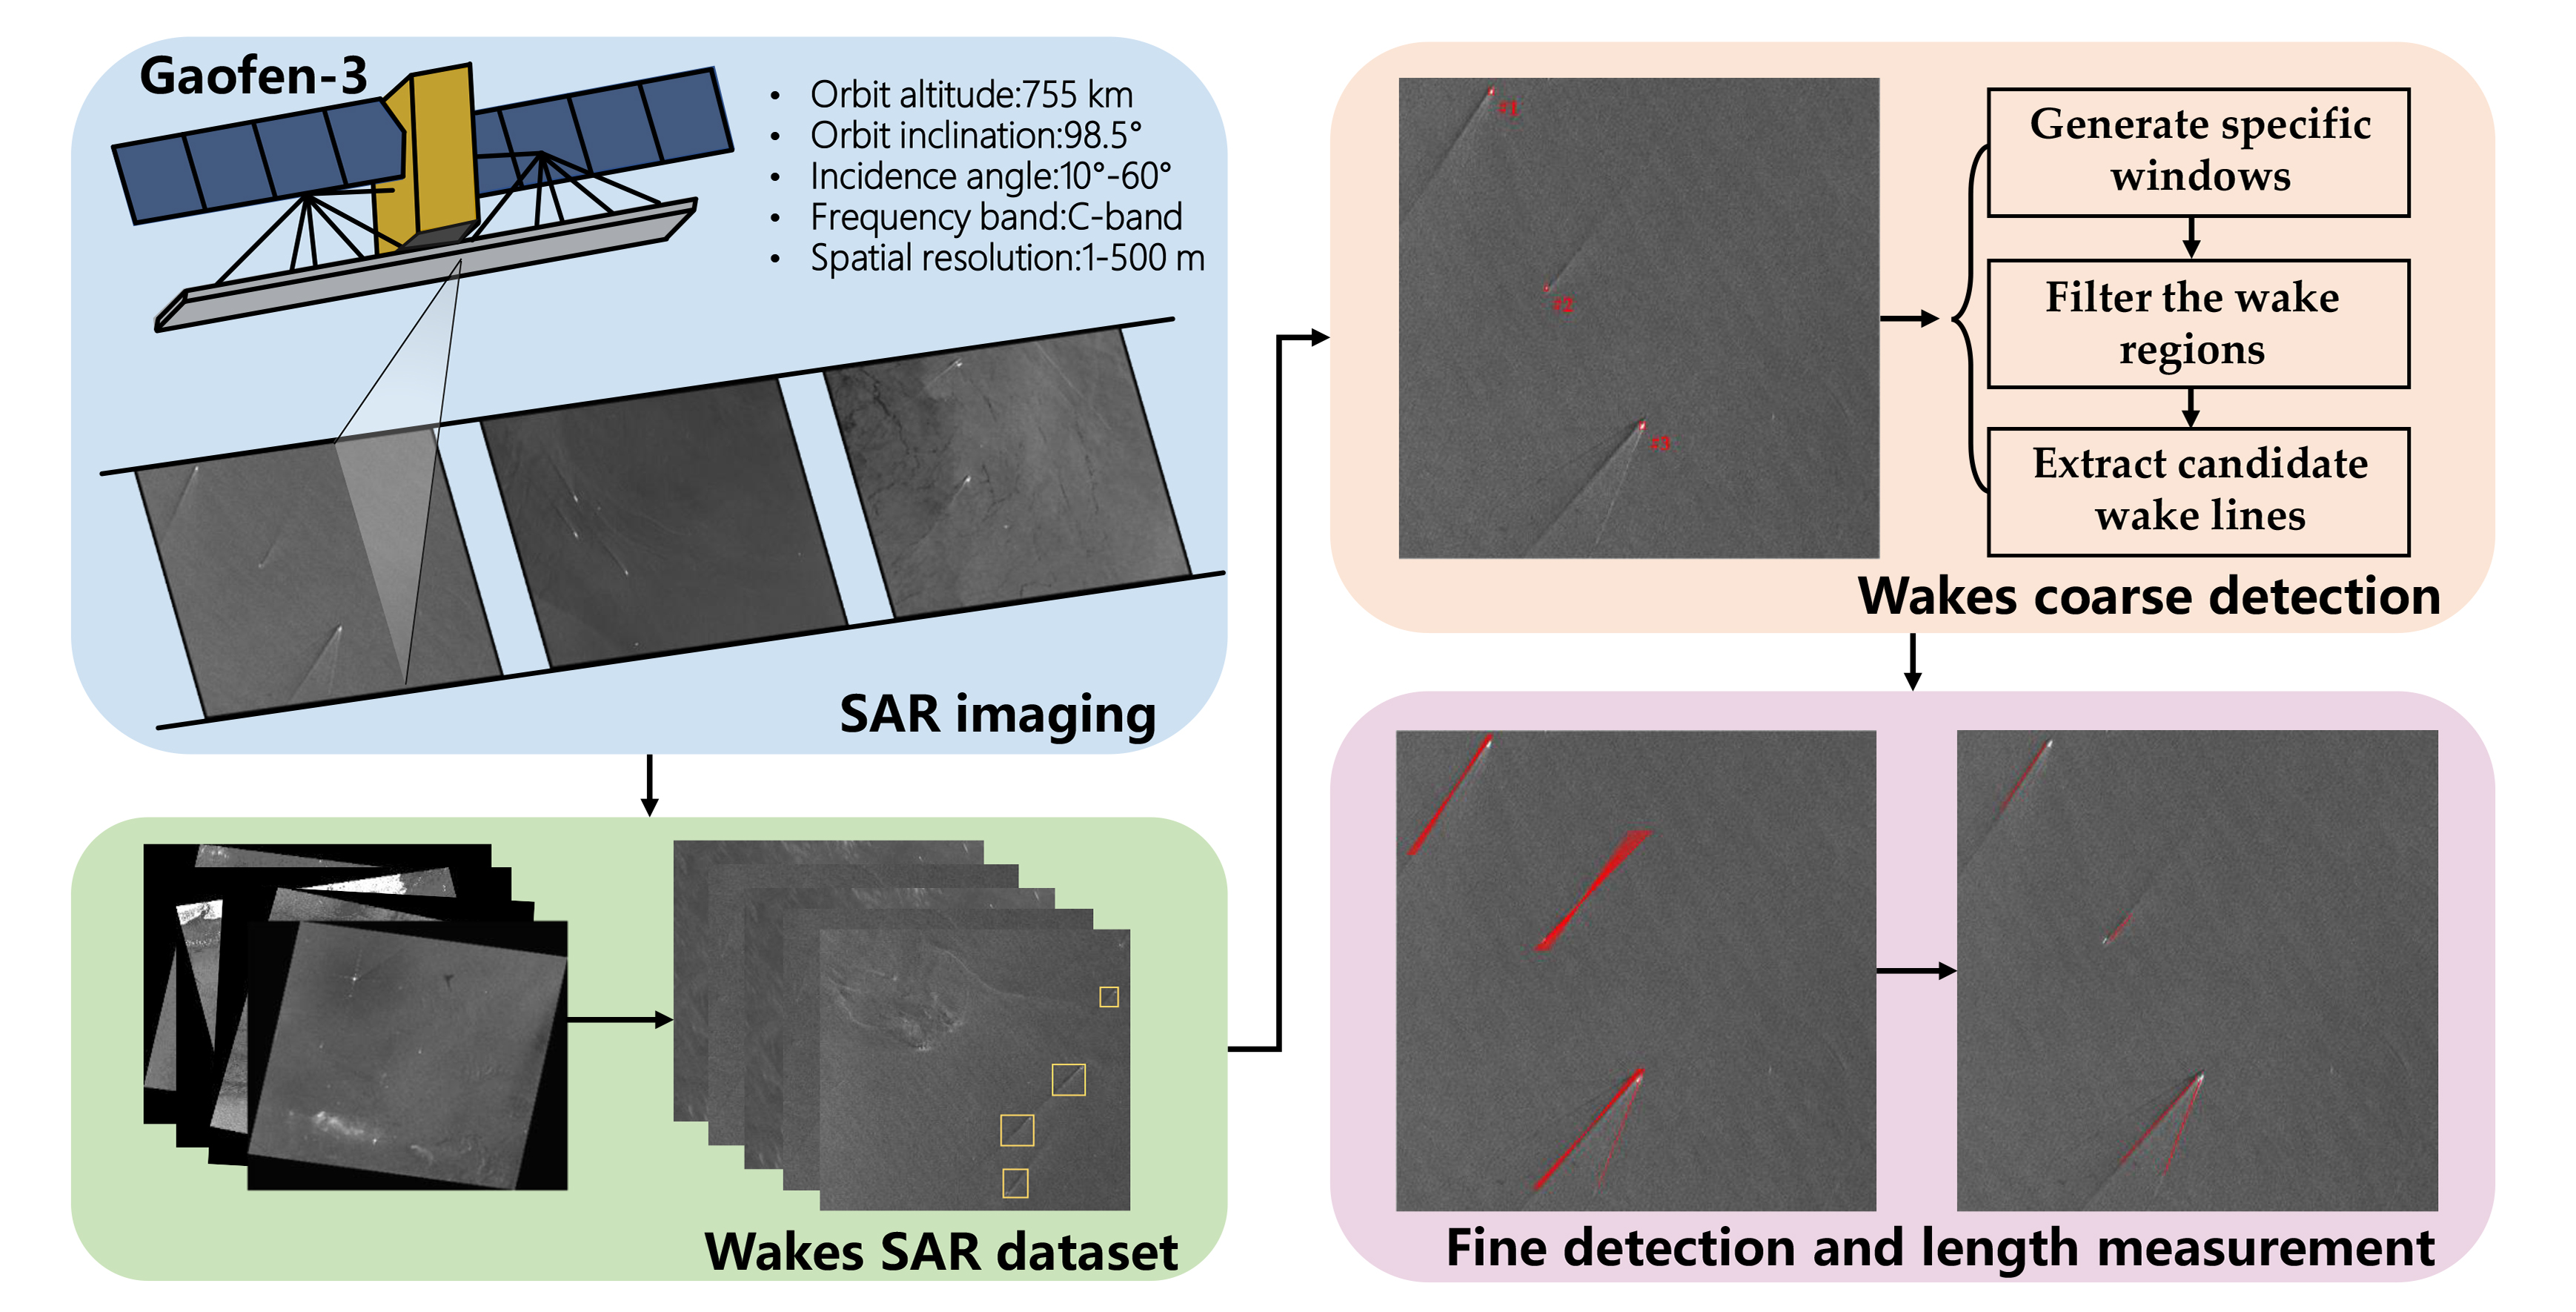
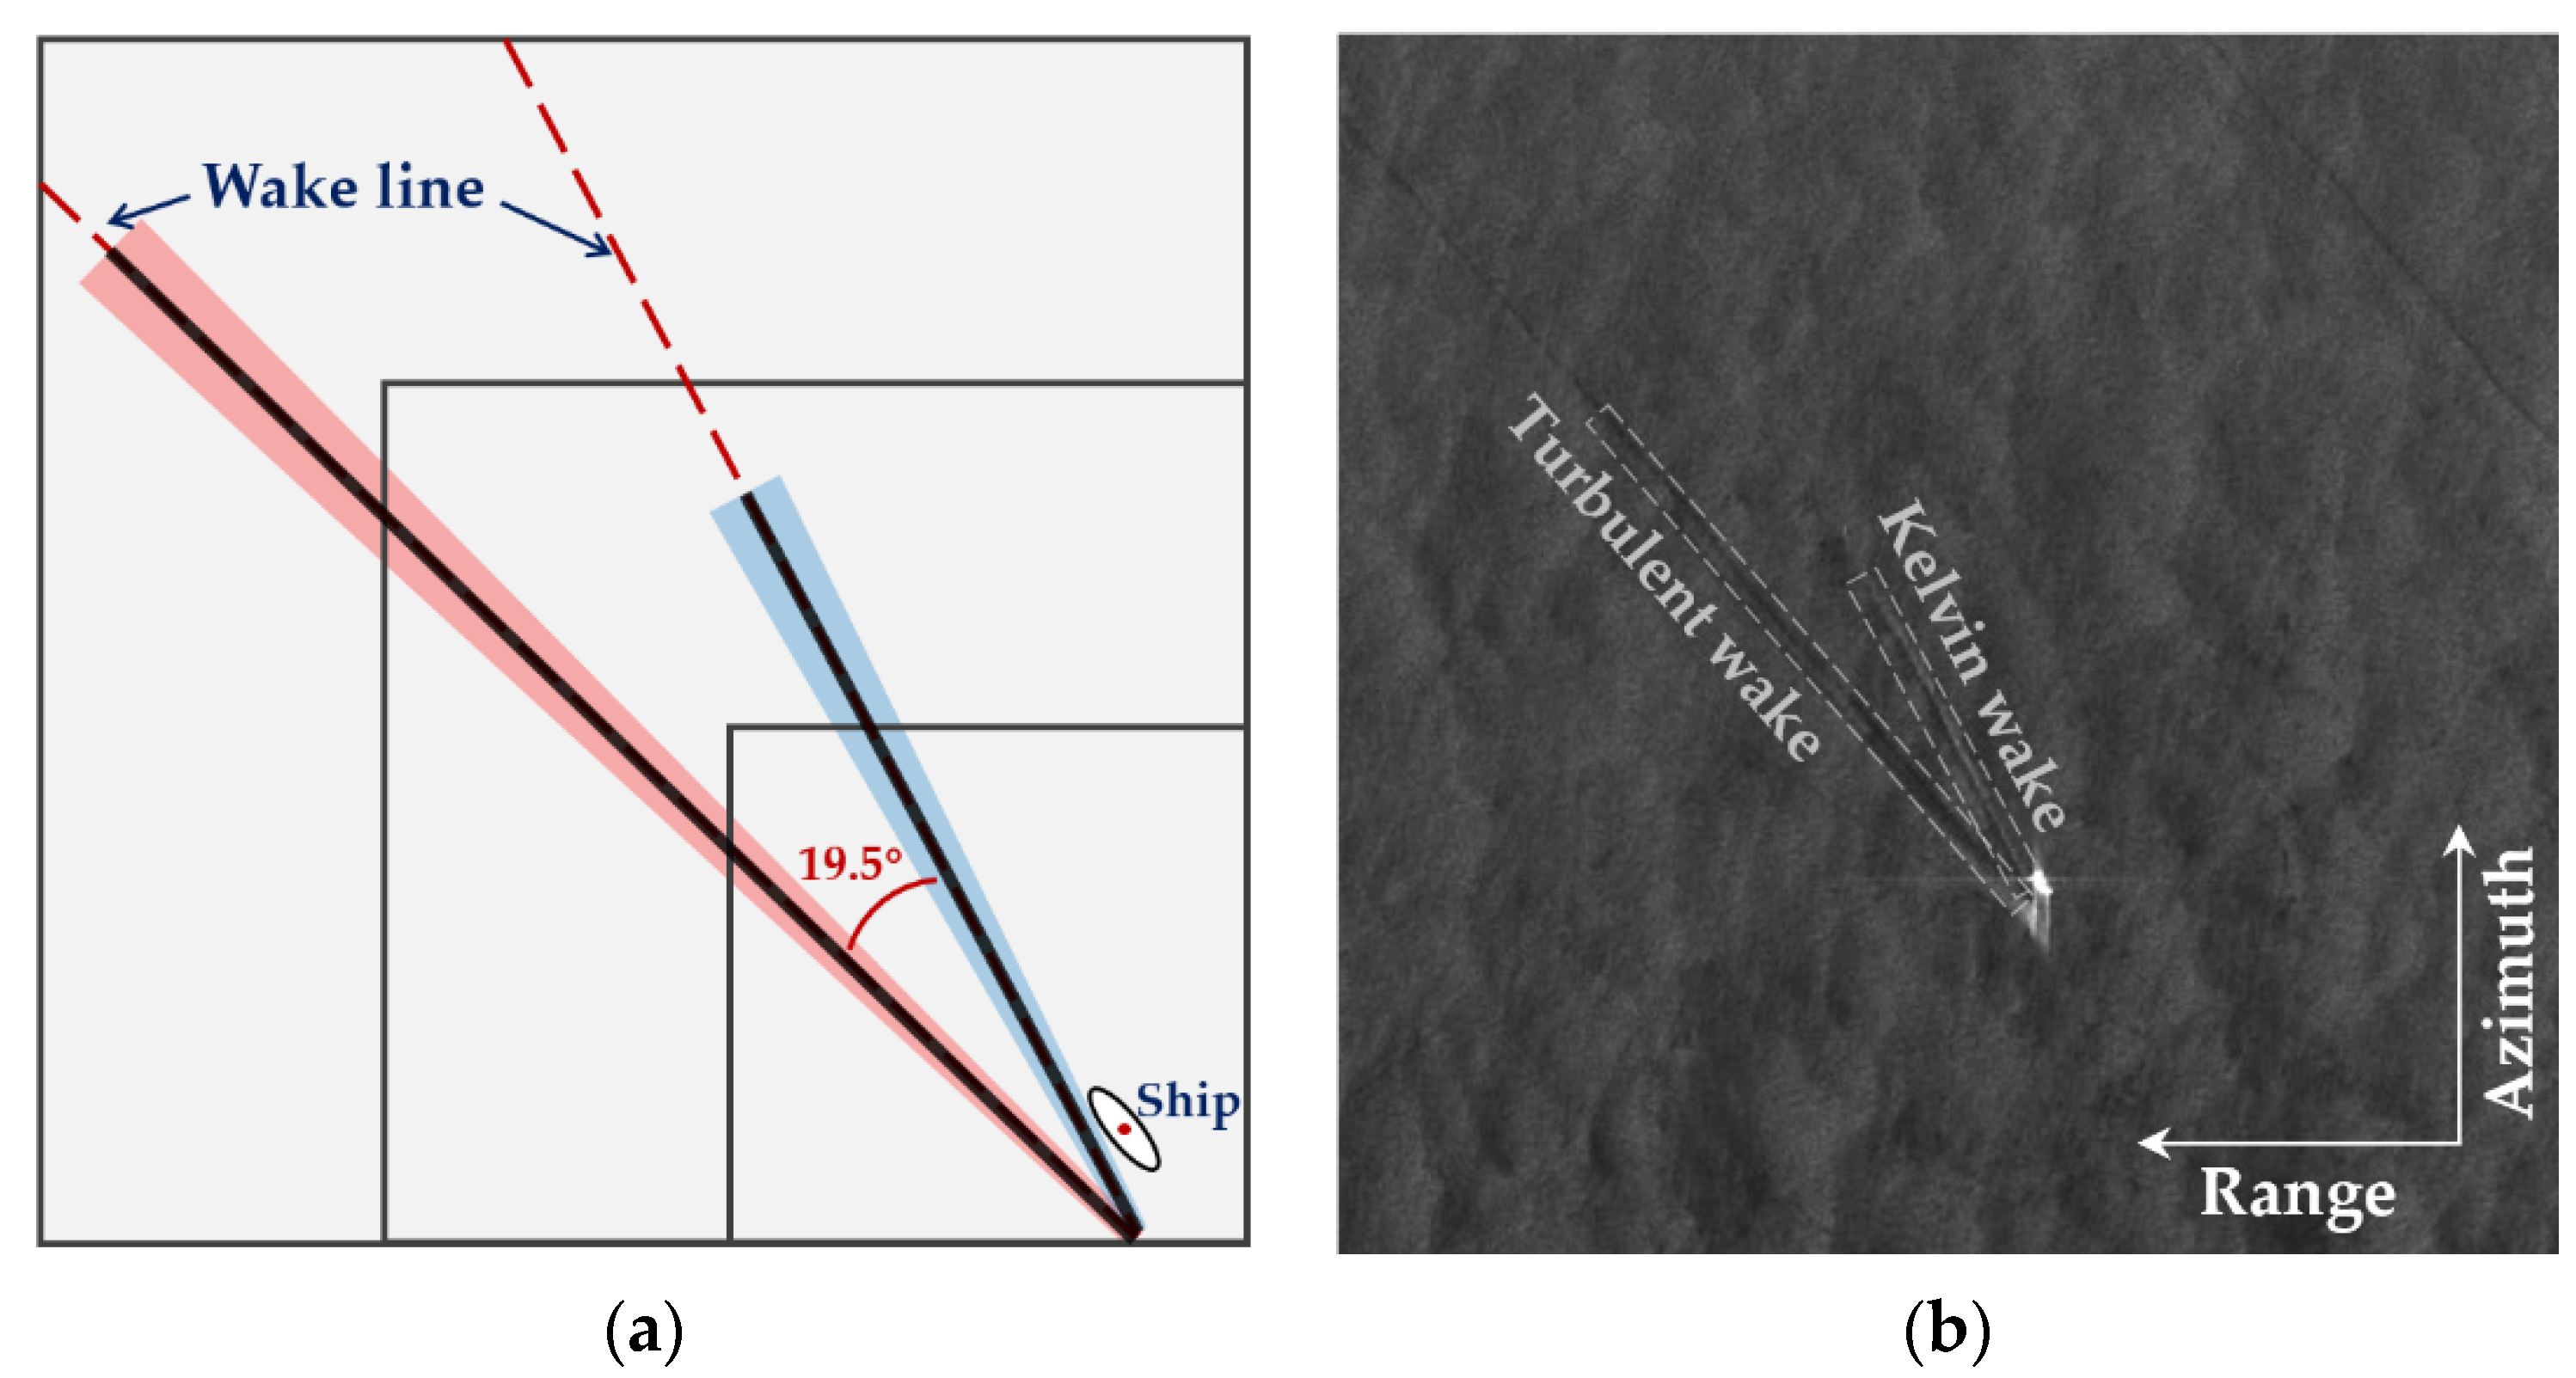
  • Based on the angle characteristics between wake components, a new clustering method is proposed to locate different wake components (turbulence and Kelvin wake) of the same ship, and measure the shortest visible length of the wake.
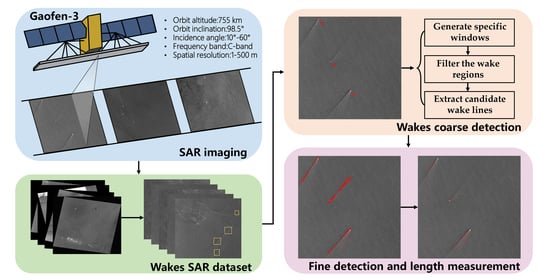
  • We create SAR wake data set containing different types of Gaofen-3 and validate our method on these data.
The rest of the paper is organized as follows. Section 2 introduces in detail the specific window search detection algorithm we propose, including the wake location strategy and wake length measurement method. Section 3 presents the Gaofen-3 SAR data and analyzes the results through several groups of experiments and comparison. Section 4 concludes the paper with a summary and puts forward some suggestions for future development.

2. Materials and Methods

In this section, we will show the ship and its wake characteristics in SAR images, detail our specific window search algorithm for wake detection and propose some strategies for getting as many potential locations as possible. Our search algorithm has the following design considerations:
First of all, it is necessary to capture all the ship wakes, which are the identity features generated by the movement of the ship. Accurately identifying all the wake features is the main goal of the algorithm.
Second, the scale of the wakes generated by ships are not the same under different motion states, which are affected by the ship’s speed and shape as well as the sea conditions. The acquisition of wakes of all different scales is helpful for the subsequent inversion of ship motion information.
Finally, our algorithm is different from the traditional sliding window search algorithm. The goal of a specific window search is to generate a certain number of windows under a specific target, so as to locate the actual position of the wake. This set size is much smaller than the traditional algorithm, so the efficiency of our algorithm will be greatly improved.

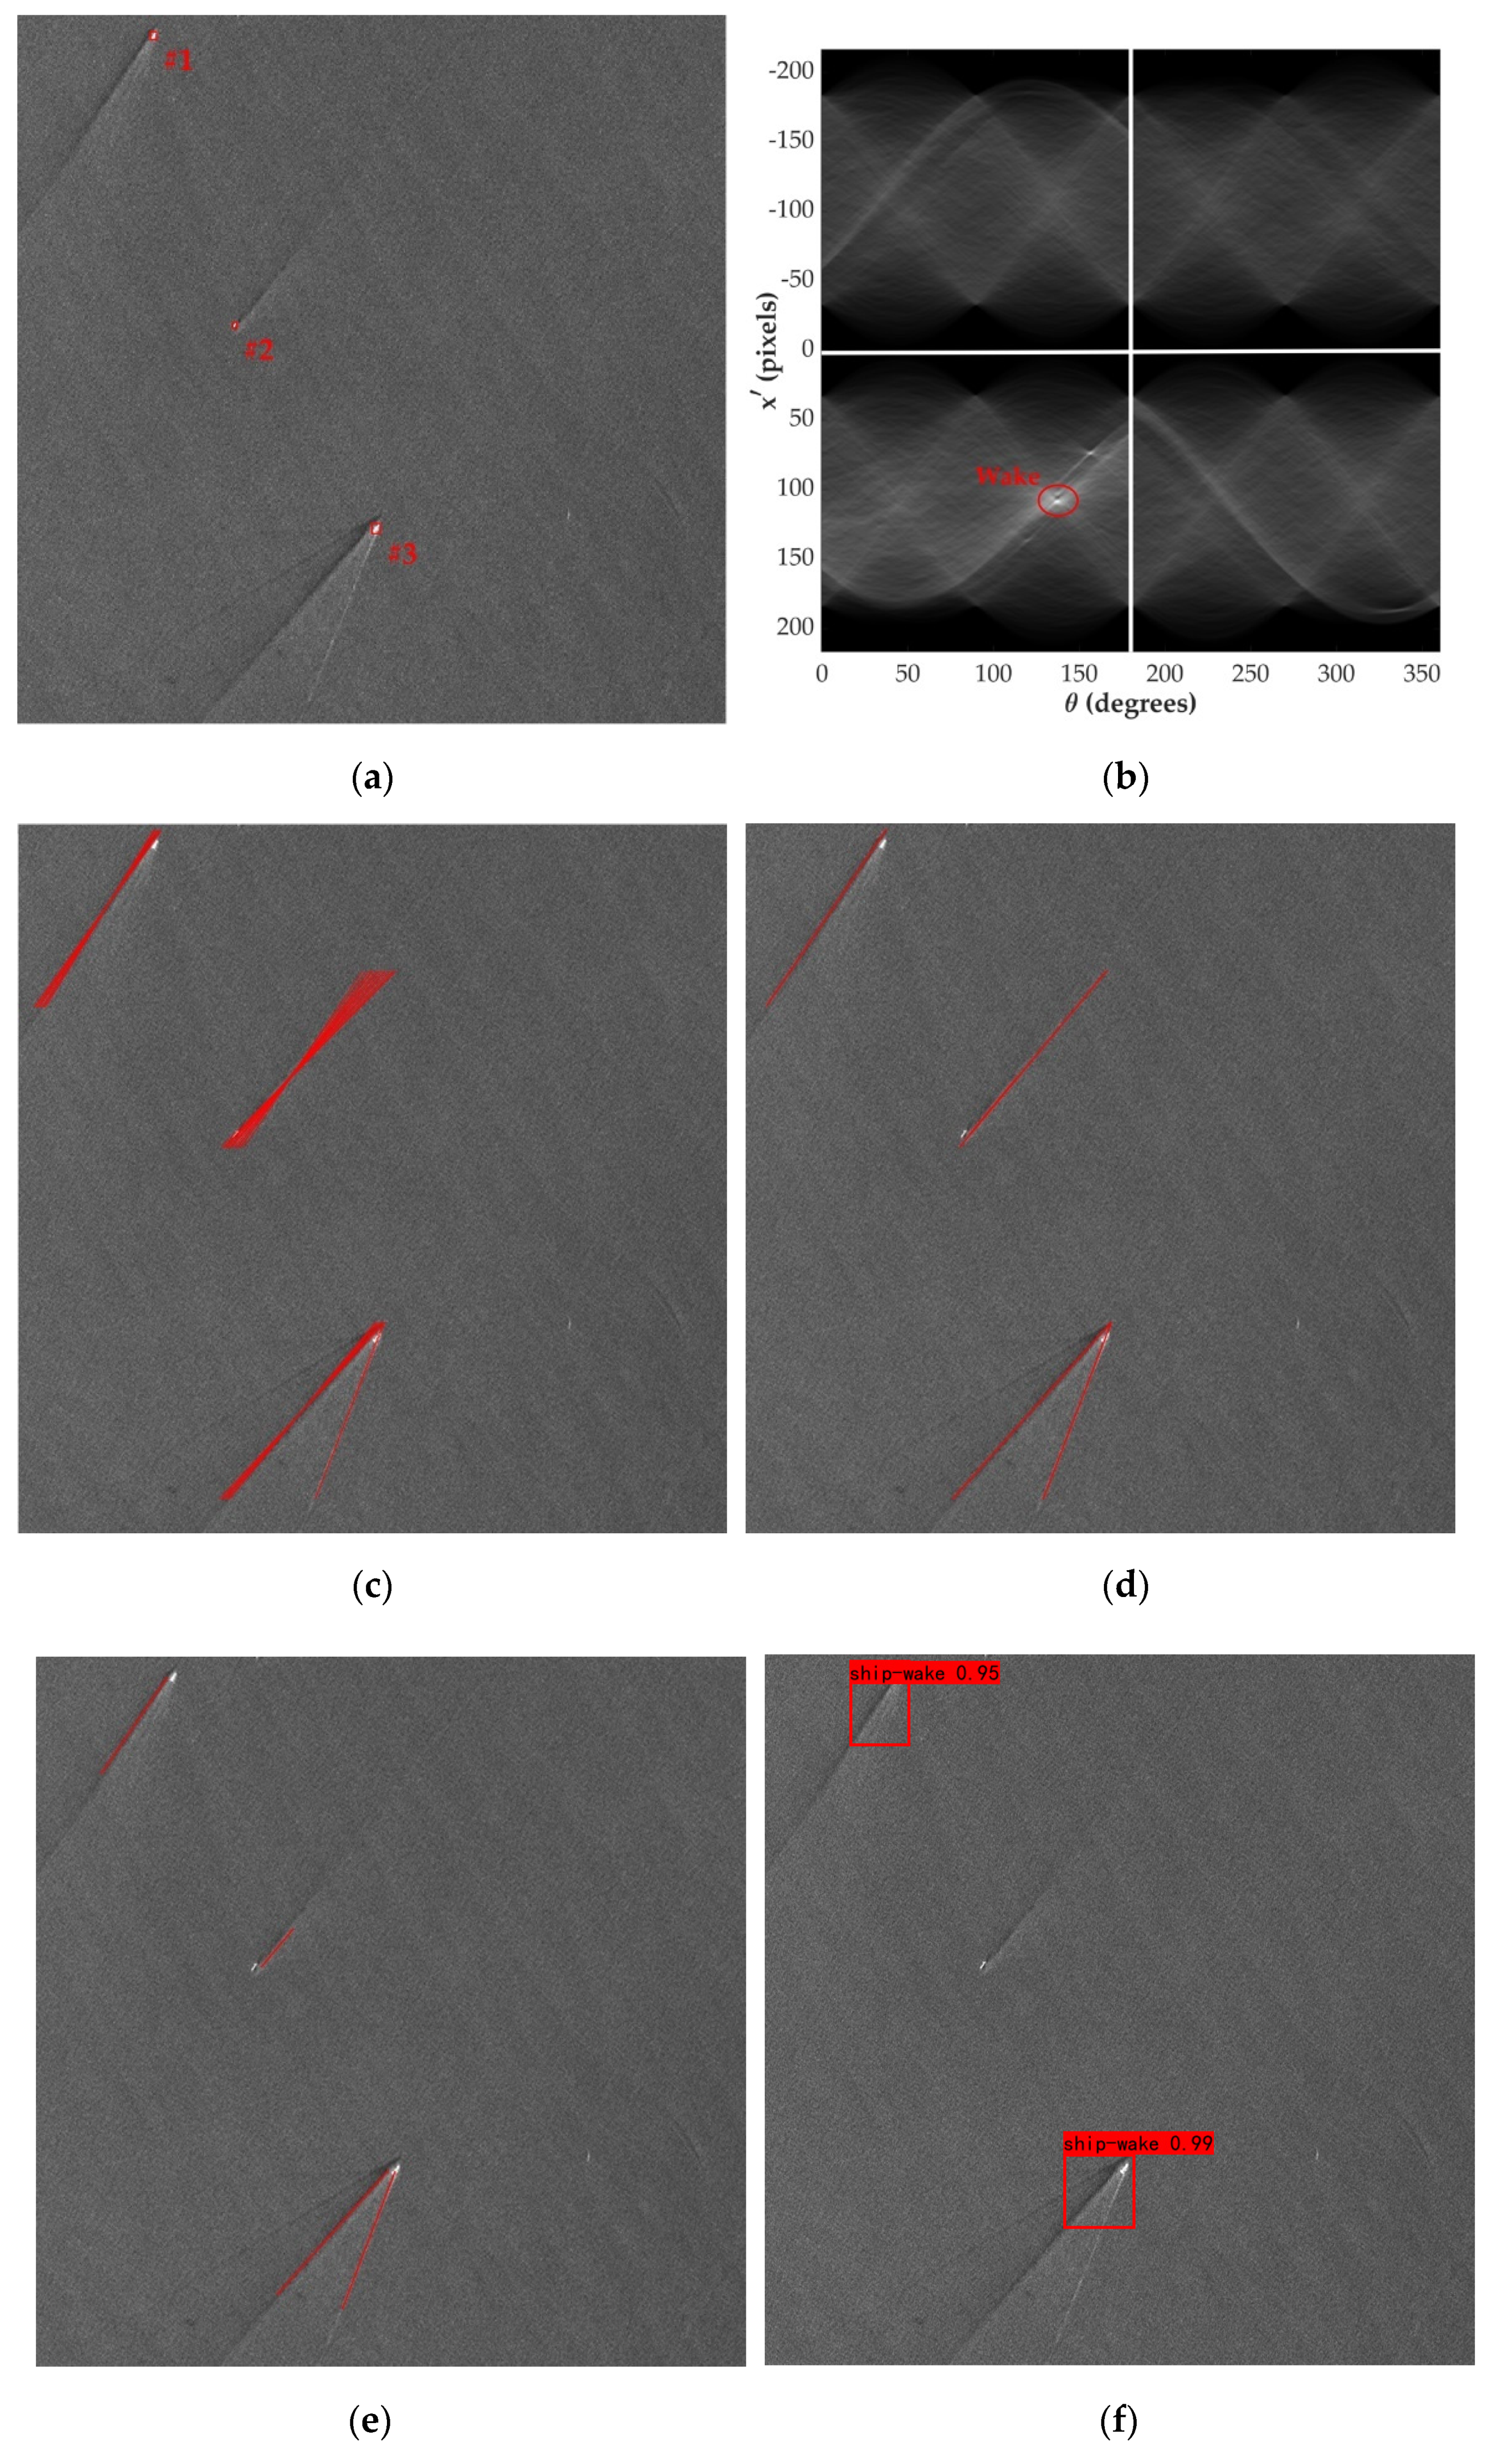
2.1. Specific Windows Search by Highlighted Pixel Points

Wakes generated by ships during navigation can generally be divided into Kelvin wakes, internal wave wakes, turbulent wakes and V-narrow wakes, and they show different geometric characteristics [36], as shown in Figure 1a. Actually, ship wakes in SAR images are mainly turbulent wakes and Kelvin wakes, with Kelvin wakes accounting for about 17% of wakes. Turbulent wakes are the most common wake type and exist in almost all ship wakes [37]. They are characterized by dark or bright narrow lines that stretch for tens of kilometers in length; these ships generally show the highlight point or region.
In addition, due to the ship’s movement and the SAR system, a Doppler shift effect will appear in the imaging process, resulting in a special geometric relationship between the ship and the wake [38,39], as shown in Figure 1b. In the imaging mode of the ascending left view, the ships travel toward each other in 2 tracks with different angles and 4 different directions. The regions where wakes are generated (shown by turbulent wakes) are divided into four different regions. Taking a ship heading northeast, as an example, the ship target is located in the coordinate center, and its turbulent wake must be generated in area I. Therefore, unlike other targets on the sea surface, the pixel features and spatial geometric features of ship targets and wakes are very obvious. It is precisely by combining the pixel and geometric features between the ship and the wake that we use the highlight pixel algorithm to form the basis of our specific window search, so as to avoid irrelevant interference features and improve the specificity of the target search. The core idea of the specific window search is to generate a specific window based on the highlighted pixels for the target search. The steps of specific window generation are as follows:
The first thing we need to do is to detect the location or potential location of the ships. However, in addition to ship targets, artifacts on the sea surface, islands and other speckle noises are also displayed in the highlighted pixel areas. Therefore, we need to do image preprocessing to eliminate the influence of these non-ideal factors. In this way, the real position of the ship can be determined as accurately as possible, and the computational load of the subsequent algorithm can be reduced.
We preset a constant false alarm rate and obtain all potential ship target areas through the pixel filtering algorithm. Then, for the potential target points, the method adopted in this paper is performing morphological processing on the binarization target image to eliminate discrete noise points and enhance the potential ship target area.
After obtaining the position of the potential ship target, according to the geometric relationship between the ship and the wake in the SAR image described above, specific windows are successively generated around the centroid of the highlighted pixel area of the ship target in order to cover different areas where the ship wake exists. Figure 2 shows an example of the specific window, and the corresponding specific window can be generated similarly for multiple wakes.
The length of the subwindow is set as a multi-scale window, so that wakes of different lengths can be detected. In addition, to cover the offset d due to the Doppler shift, an overlap width of 2d is set between the windows. The offset d can be calculated by [40,41]:
d = v m R s cos θ i n V s
where vm denotes the maximum velocity of the ship, Vs is velocity of the satellite, Rs is the slant range distance and θin is the incidence angle. These satellite-related parameters used in the experiment are all from Gaofen-3.
Each detection window is represented by a subwindow in the set Wi = { w j , k i } and the corresponding score s j , k i . The scoring rules will be described in detail below, where i represents the set of windows generated by the i-th pixel pi = (xi, yi), and (j, k) = ({S1, S2, S3}, {±π/4, ±3π/4}) determine the scale and orientation of subwindow respectively.
The key problem of the algorithm is to find the location and measure the length of the wake. Therefore, some strategies are designed to make the location and length more accurate.

2.2. Wake Localization Strategy

The size and location of the window covering the object varies in the image. However, within a set of windows in a highlighted pixel area, some windows cover objects more accurately than others. An appropriate window facilitates subsequent standardization of wake features with varying scales. In the wake localization stage, for each subwindow, we evaluated the possibility of a window covering an object by an improved RT, based on its internal pixel integration, while considering its position and size [16]. The localization stage includes first determining the window orientation, that is, finding the window directions that can accurately cover the wake position in the four directions, and then accurately marking the wake position of each scale or each component in the window.
In order to avoid the influence of the highlighted pixel region on the subwindow pixel integration, we mask these regions with the average pixel μ( w j , k i ) of the sea clutter in the window. For the window set Wi, the minimum scale window determines the shortest wake that can be detected, the Local Difference Radon transform in this scale window set w k i is used as its score to eliminate the fake ship highlight pixels and determine the window orientation. The probability score s k i of each direction window is expressed by:
s k i = max   R k i
where, R k i represents the Difference Radon transform. Although the actual ship wake may be bright or dark lines, its average pixel is different from sea clutter; local pixel difference processing can increase the contrast between wake and clutter, and, at the same time, it is convenient to capture the position of the wake at the peak in the Radon domain, which is defined as:
R k i = w k i | f ( x , y ) μ ( w k i ) | δ ( ρ - x c o s θ - y s i n θ ) d x d y
The maximum value of s k i is taken as the score of the i-th window set. When the root location of the subwindow is the fake highlight pixel centroid without wakes, the score is approximately zero. If the value is much larger than zero, the subwindow is judged to contain wakes. Thus, the subwindow containing the wake can be selected and its orientation can be determined, the corresponding (i, k) is shown in Equation (5).
s i = max k = ± π / 4 , ± 3 π / 4 s k i
w k i { ( i , k ) | max ( max R k i ) 0 , i = 1 , 2 , , n ,   k = ± π / 4 , ± 3 π / 4 }
After completing this step, the wakes in the image are positioned by a series of sub-windows of different sizes, as shown in Figure 3a. In addition, due to imaging conditions, different wakes formed by the same ship may show different lengths in the actual SAR image [13,42], as shown in Figure 3b.
In order to accurately locate wakes at various scales and ensure that different wake components generated by the same ship can be detected, we modified Equation (3) by adding scale factors to standardize it; Sj represents window scale.
R ¯ j i ( ρ , θ ) = R j i ( ρ , θ ) / S j
We then need to set the appropriate threshold Tw to mark all the qualified position information (ρ,θ); Tw is usually set to Rm/√2, which is given by the length relation between the Kelvin wake and the turbulent wake. Rm is the maximum value in the Radon domain.
( ρ , θ ) = arg   R ¯ j i ( ρ , θ ) ) > T w
Since the number of wakes in the subwindow is unknown and the wake component is not a line but a channel of bright/dark pixels, the position set in Equation (7) is some cluster of points, {(ρ11), (ρ22), …, (ρNN)}.
We cluster the polar coordinate points belonging to the same wake into one category, so that all wakes can be retrieved, and the position of the line can be accurately located. Here, the angle is used as the criterion to distinguish different wakes. For each two detected lines, if Equation (8) is satisfied, then the two lines are different wakes.
| θ m θ n | > Φ / 2
In fact, the wake has a certain width, and a single wake also corresponds to several extreme points, that is, several lines. For each two lines, if Equation (9) is satisfied, we consider that they to belong to the same wake.
{ | θ m θ n | < ε | ρ m ρ n | < w
where, Φ is the angle between the turbulent wake and the Kelvin wake and ε and w are small values which can be set according to the actual situation.
At this point, we can divide the peak point set into different subsets which represent the point clusters corresponding to different wakes and then calculate the center of each point cluster, which is the precise position of each wake, where the center of the Ni-th cluster is:
( ρ ¯ , θ ¯ ) N i = 1 N i ( ρ , θ ) / N i

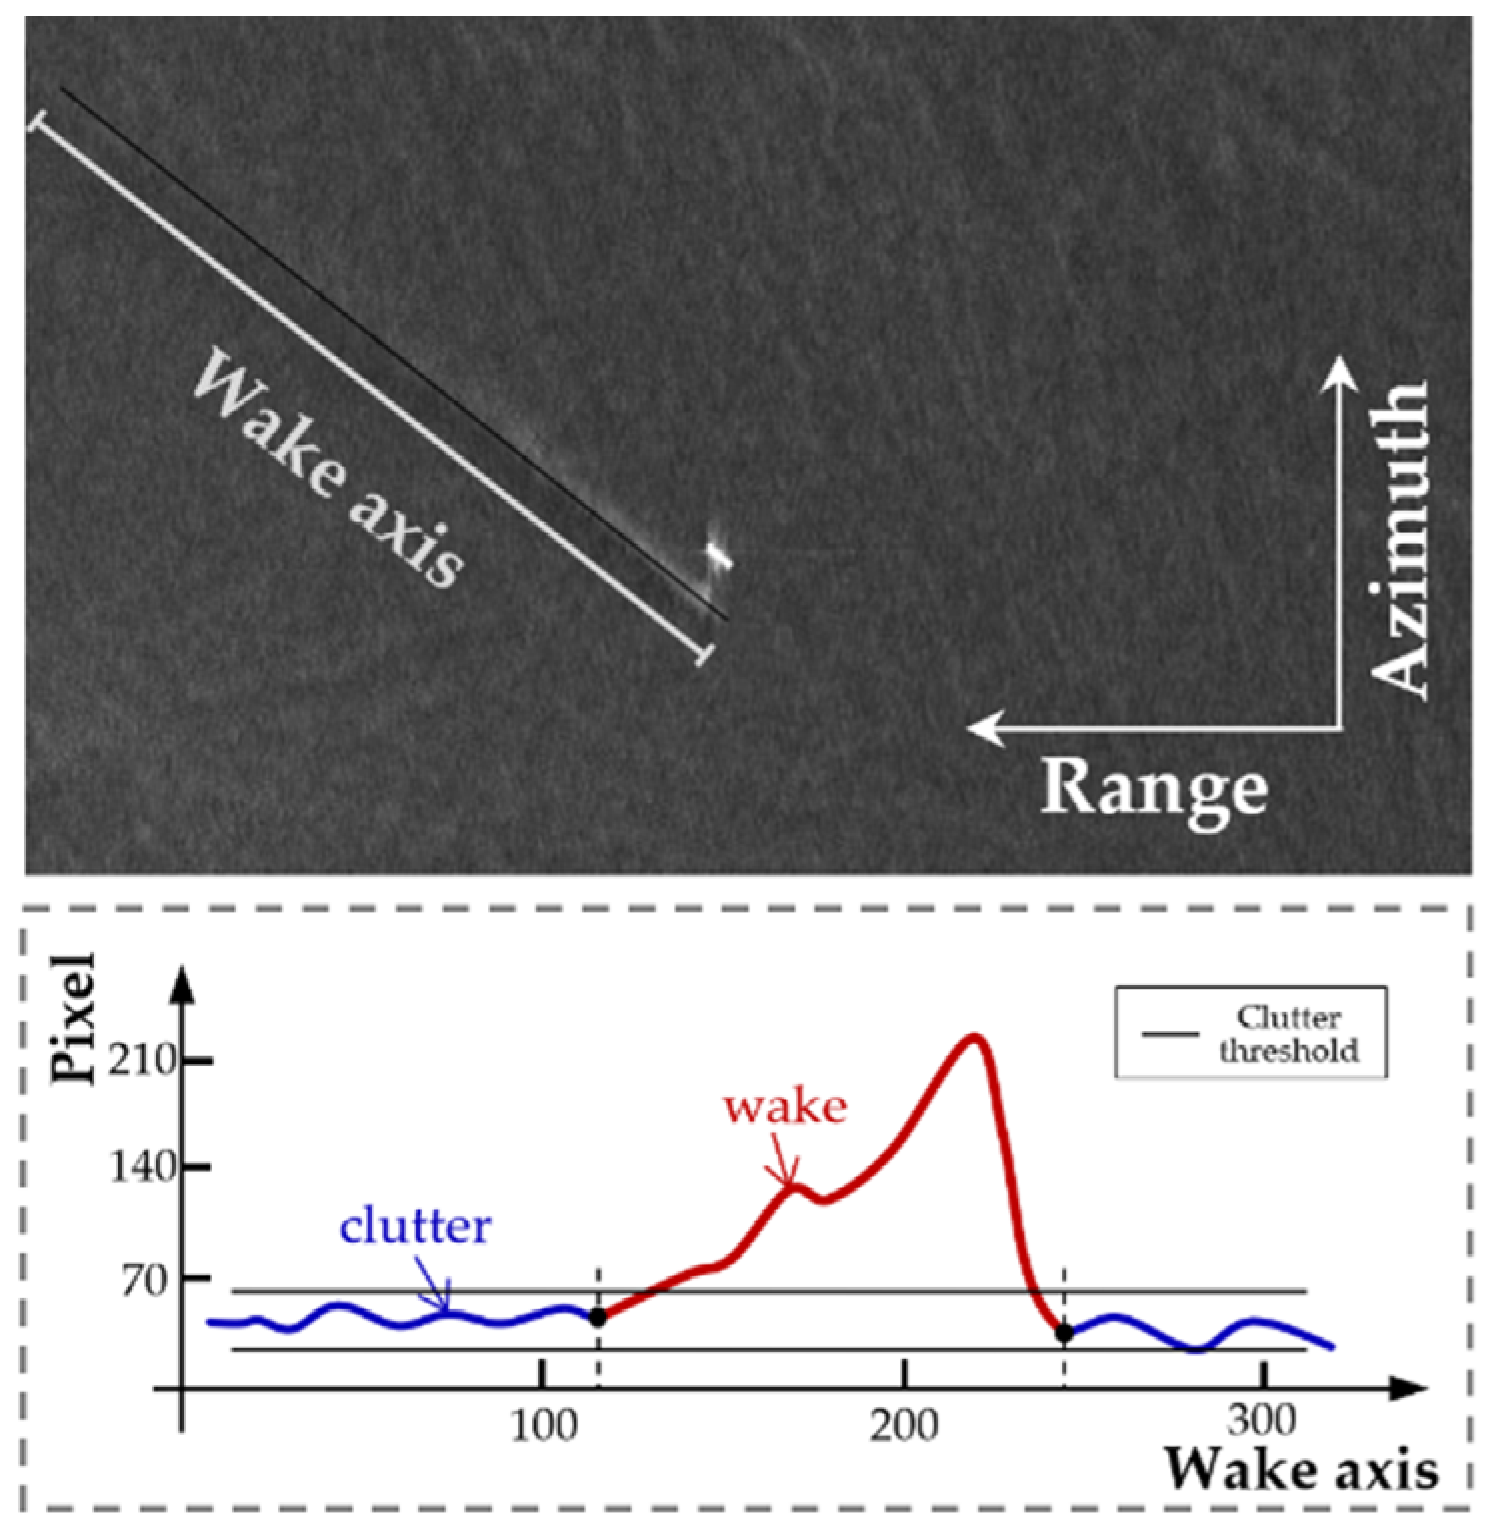
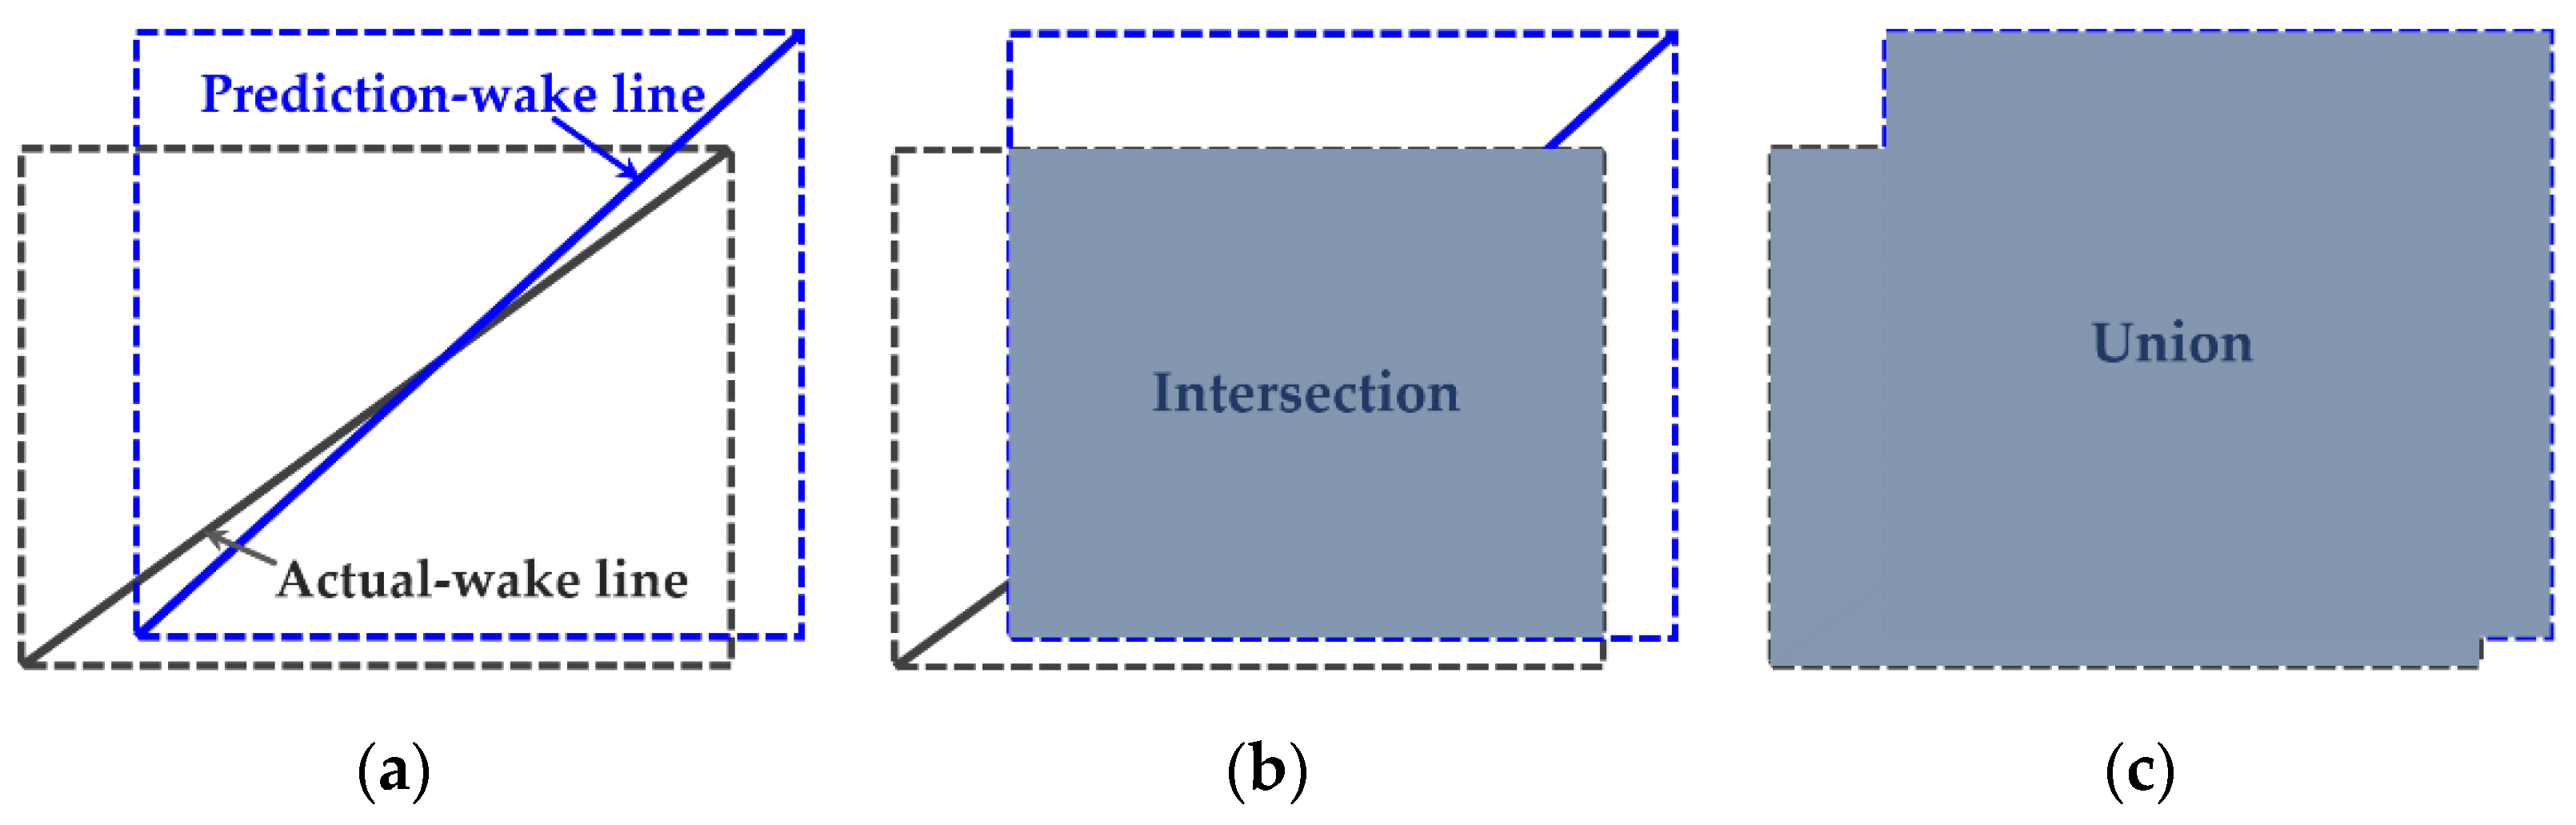
2.3. Wake Scale Measurement

In the following, we measure the visible length of the positioned wake. In reality, the duration of wake formed by ship and its speed determine the length of wake, which can also be affected by external factors such as sea conditions [42]. The process from wake formation to being submerged in the sea clutter is represented in the SAR image as the gradient change of the pixel gray level on the wake line [36].
Measuring the length of the wake is determining the start and end positions of the wake. Unlike sea clutter, the wake area has obvious pixel characteristics. In order to separate the wake pixels from the sea clutter pixels, the statistical pixel characteristics of the sea clutter in the corresponding subwindow are selected as the parameters to distinguish the wake lines from the sea clutter [20].
μ w = i = 1 N j = 1 N f ( i , j ) N × N
σ w = i = 1 N j = 1 N ( f ( i , j ) μ w ) 2 N × N
where μw is the mean gray value of the image, σw is the gray standard deviation of the image, and f (i, j) represents the gray value of image pixels.
A set of pixel points gn is extracted along the axis where the wake is located. Clutter noise existing on the wake axis causes disorganized changes of pixel gradient on the axis. Therefore, this group of one-dimensional data is processed to ensure the smoothness of pixel values on wake lines. The processed data Gn was used to draw the gradient diagram of its wake axis, as shown in Figure 4. The decision rule based on the statistical characteristics of pixel gray scale is:
{ | G i μ w | t σ w D e n d = 0 , i [ 1 , 2 , n ]
The pixel segment conforming to Equation (13) is considered a wake line. Here, t can be adjusted according to different sea conditions and imaging modes, Di = Gi+1Gi-1 represents the gradient of the wake axis and Dend is the gradient of the two ends of the wake. When the gradient is zero, the wake is submerged in sea clutter, which is the shortest wake detected.

3. Results

This paper uses the position generated by the specific window search to perform multi-ship and multi-scale wake detection. We will introduce in detail the wake SAR image data set used for the experiment and the execution process of wake detection and analyze the results. The detailed steps of the experiment are as follows, Algorithm 1:
Algorithm 1: Specific Windows Search for Wake Localization and Length Detection
Input: The input is a marine SAR image with ships and their wakes, as well as a variety of other noise.
Process:
  • After preprocessing, obtain the center of the highlighted region p = {(x1, y1), (x2, y2), …, (xn, yn)}.
2.
Generate a series of bounding boxes W = {W1, W2, …, Wn} around the center of mass, then calculate the average value of pixels in each box and mask the highlighted pixel area, where the Wi represents the set of windows around the i-th region, which contains windows of different scales and locations.
3.
Repeat step 4 for p = 1, ..., n.
4.
Perform the Radon-based algorithm for each window in the w j , k i . Select the peak points in the Radon domain. Use the clustering algorithm to select the congregate points which are very close. Calculate the gravity centers of the selected clusters.
5.
For all labeled locations, measure the wake length.
Output: The output is a set of ship wake line positions with the wake lengths.

3.1. Data Set

Our data set comes from SAR images of offshore China taken by Gaofen-3 satellite, a C-band multi-polarization SAR satellite launched by China in 2016. The orbit parameters and load indexes of Gaofen-3 are shown in Table 1 [35].
The imaging modes of the wake SAR images in the data set were Ultra-Fine Strips (UFS) and Fine Strips (FS) [35]. The detailed information of the data set SAR images is listed in Table 2.
In these images, samples containing more than two wakes are manually identified and collected, and then the locations of wakes are marked so as to build the multi-ship and multi-scale data set for algorithm testing, as shown in Figure 5.

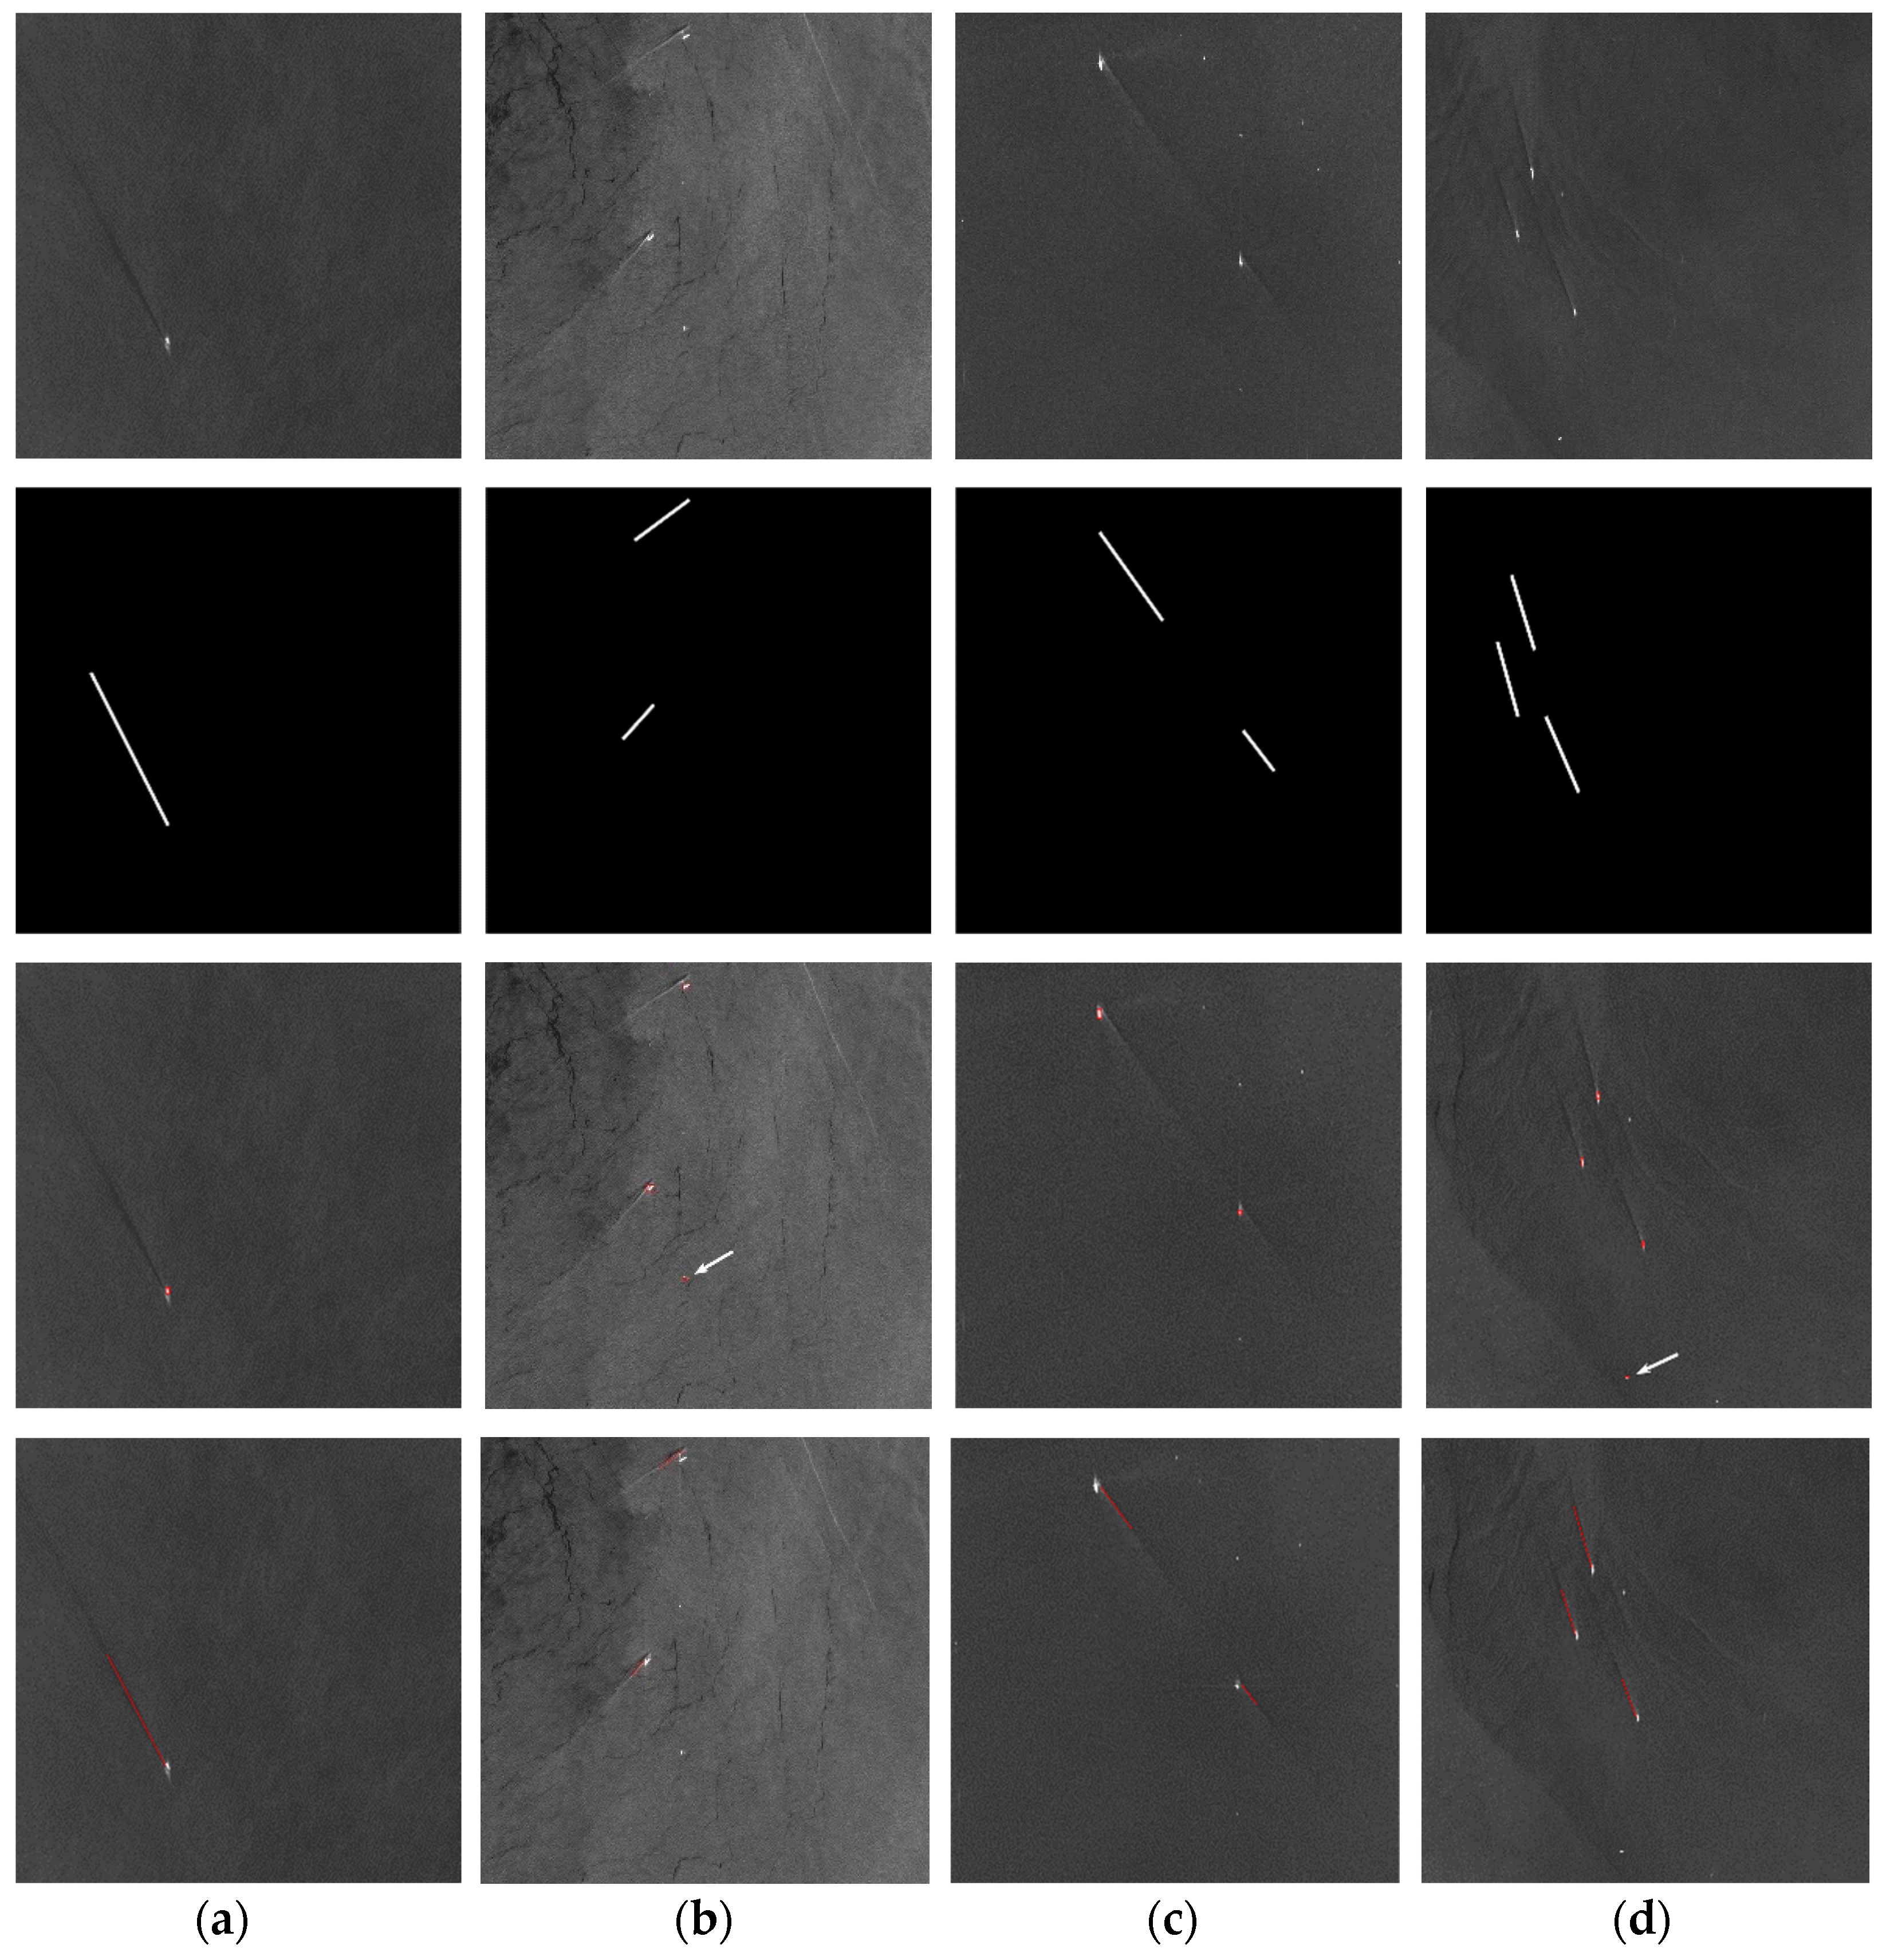
3.2. Experimental Results

We selected a 700 × 700 pixel-sized sample with multi-scale and multi-wake in the Gaofen-3 data set, see Figure 6, and the imaging mode was ascending left view. There are three visible wakes in the image, among which Wake #2 is small and difficult to find. The Kelvin wake and turbulent wake in Wake #3 are visible. This image is used as an example to demonstrate the performance of the algorithm.
Since we do not need to determine whether the highlights are ship targets at this stage, we use simple morphological processing instead of the complex traditional CFAR algorithm to obtain the highlighted pixels, and the results are shown in Figure 7a. As we can see, although the ship target of Wake #2 is only a few pixels, we can still locate the pixels, which is helpful for the subsequent wake localization.
For these highlighted areas detected, specific windows are generated in their centers and the windows containing the wake are identified. We take Wake #3 with Kelvin wake and turbulent wake as an example for coarse detection and precise location of wake.
In Figure 7b, Radon domain results of the four subwindows show that the maximum score can be obtained at the lower left corner, so it is confirmed that this subwindow contains wake. After standardization, the wake lines corresponding to these preliminary candidate points are shown in Figure 7c. In the stage of fine positioning of each component of the wake, the maximum peak point was taken as the first clustering center [43], and the rest of the clustering centers were determined by geometric and angular relations of the wake; we set ε as 5° and ω as 3 pixels. The results are shown in Figure 7d. It can be shown that the turbulent wake and one Kelvin arm were well detected, while the other Kelvin arm failed to be located due to weak features.
Figure 7e shows the measurement results of wake length. Parameter t is first selected within a reasonable range according to experience, and then manually adjusted and gradually optimized. Here, t is set to 0.35.
Figure 7f is the recognition result of You Only Look Once (YOLO) algorithm [44]. It can be seen that the short wakes have missed detection due to the extremely weak wake characteristics, and the other two wakes were detected with high confidence. It is worth mentioning that, under the condition of no ship target information, for the multi-ship and multi-scale wake detection task, our traditional method can also achieve the results of deep learning methods, and doesn’t need a lot of data set as a support. Compared with direct wake line positioning of our algorithm, the wake bounding-box of YOLO requires further line detection in the local area. In short, our algorithm could match the detection effect of the latest deep learning method. (It should be noted that the deep learning method here is based on the standard YOLOv3 network training result. This result is only a preliminary attempt of wake detection using deep learning. We have also conducted new research in the follow-up, and the research results will be announced later.)
In current target detection tasks, the confusion matrix is often used to define some indicators to quantitatively analyze the performance of the algorithm. For ship wake detection, we also define the corresponding 2×2 Confusion Matrix, as shown in Table 3.
In the table, TP represents true positive, that is, the detected wake is a true wake; FP stands for a false positive, that is, a fake feature is detected as a wake; FN stands for a false negative, which means that the ship pixel is detected but the wake position is not correctly located; TN stands for true negative, which means that the highlighted pixels of fake-ships are detected and removed. We set the rate of Precision and Recall to evaluate the performance of wake detection:
Precision = TP TP + FP
Recall = TP TP + FN
In addition, our method can measure the length of visible wake, and Intersection-over-Union (IoU) is a very appropriate indicator to evaluate our detection results and analyze the degree of coincidence between the prediction wake line and the actual wake line. As shown in Figure 8a, the rectangle with the wake line as the diagonal can be considered as its position box, so that the wake detection results can be evaluated in terms of area; IoU can be expressed as:
IoU = Intersection Union
That is, the ratio of the intersection area to the union area.
We selected 30 SAR images with multi-ship and multi-scale wakes for the experiment, including 75 visible wakes. The YOLO algorithm was also introduced for comparison, and the experimental results are listed in Table 4.
From the table data, it can be concluded that, compared with the advanced deep learning algorithm YOLO, the lower Precision of our method is due to some false detection caused by the lower highlight pixel threshold; the higher Recall indicates that the method can basically not miss the visible wakes or different wake components. In particular, IoU is an evaluation indicator that other traditional methods do not have, and here we achieve even better results than YOLO, which is due to the difficulty of obtaining the pixel-level feature differences of the wake in the feature extraction part of YOLO. Overall, the algorithm can achieve nearly the same level of results as the advanced deep learning algorithm YOLO.
Part of the representative multi-ship and multi-scale ship wake detection results under optimal parameters are shown in Figure 9. It is not difficult to see that Figure 9a is a single dark wake, and this method can accurately locate the wake line and measure the length. Figure 9b–d are all bright wakes with complex backgrounds or speck noise, among which Figure 9b is a short wake with interference of other linear structures. The Pixel-based approach of the algorithm greatly reduces the range of the search area, and the local processing method can effectively avoid the influence of useless areas on the Region of Interest (ROI), achieving good detection results. Figure 9c shows the wake of two ships sailing in a single line, the algorithm can effectively detect the two collinear wakes, rather than just one line running through the whole picture. Figure 9d has multiple wakes with relatively close distances and the results show that mutual interference between the wakes can be avoided. It should be pointed out that there is some highlighted region of the detected fake-ship as shown in Figure 9b,d (the white arrow), which can be removed by the algorithm through the subsequent discrimination principle, and other wakes can be accurately detected. In fact, the result of missed detection is much more serious than false wake alarms, and we try to ensure that all potentially highlighted pixels are detected, even at the cost of extra computation.
The above test cases show that there are still missed detections of multi-mode wakes and some small wakes. In order to reduce false detections and missed detections, we still need further improvement in the algorithm. Moreover, the parameter setting of the wake measurement part of the algorithm is conservative, so the statistical characteristics of the wake and sea clutter need to be more deeply explored in the wake measurement part.

4. Discussion

Multi-ship and multi-scale wake detection tests are performed using the collected Gaofen-3 SAR data. Despite not having a priori ship positions, the results show that the method has good capabilities for test samples with multiple wakes. Especially for some local small-sized wakes, which can also be accurately and completely located. In addition, we compared the results of the proposed algorithm and the YOLO algorithm, and, in terms of recognition accuracy, the method almost achieves the effects of the deep learning algorithm without a large amount of training data as the basis. However, some very small-sized ships only exist as a single pixel in the SAR image, and their wakes are tiny and fuzzy. Most algorithms can hardly achieve good results for this type of wake detection. This is also a limitation of this algorithm because it is difficult to determine whether these bright spots are ships or speckle noise.
In fact, our specific window search method provides a new solution in which ships and wakes are detected as a partner instead of being detected individually and unrelatedly. The performance of the algorithm for multi-ship and multi-scale wake detection can be intuitively displayed in both the Radon domain and image domain. Future research work should focus on the detection of very small wakes and the detection of wakes in more complex environments. We need to further improve our detection logic or solve speckle noise suppression more deeply.

5. Conclusions

This paper proposes a specific window search method for rapid detection of multi-ship and multi-scale wakes in SAR images. We have observed that in SAR images, such as the Gaofen-3 offshore China data set we use, there are often multiple wakes of different positions and lengths within a certain range, and the wake targets always appear as line features occupying a small area. Therefore, the single wake extraction algorithm can never capture all possible ship wake positions. Aiming at the problem of multi-ship and multi-scale wake detection, we introduce a specific window search method, which is different from most pre-selection box generation methods for target detection, and is also different from the sliding window style global scan search. Considering the strong geometric correlation between ships and wakes and their typicality in pixels, we generate a specific search sub-window based on the highlighted pixel area in the image, so that the area that needs to be detected is greatly reduced. Through the localized Radon-based enhancement algorithm, the real ship target area can be screened out, and the sub-window that is bounding the wake can be determined. Subsequently, combined with the geometric angle relationship, our method can accurately locate the wake axis, capture the different components of the wake and then cluster the candidate wakes point clusters so as to reconstruct all the wakes. Finally, through empirical analysis of multiple samples, and based on pixel statistics, the shortest visible length of the wake can be measured.

Author Contributions

Conceptualization, K.D. and J.Y.; methodology, K.D.; software, K.D. and J.Y.; validation, K.D.; formal analysis, K.D. and Z.W.; investigation, Z.W.; resources, K.D. and Q.Z.; writing—original draft preparation, K.D.; writing—review and editing, K.D., Q.Z., J.Y. and K.N.; visualization, K.D.; supervision, Q.Z., X.W. and K.N.; project administration, Q.Z. and K.N.; funding acquisition, Q.Z. and K.N. All authors have read and agreed to the published version of the manuscript.

Funding

Shenzhen Fundamental Research Funding (JCYJ20200109143008165, JCYJ20210324115813037).

Institutional Review Board Statement

Not applicable.

Informed Consent Statement

Not applicable.

Data Availability Statement

Restrictions apply to the availability of these data. Data was obtained from the National Center for Satellite Marine Applications and are available https://osdds.nsoas.org.cn (accessed on 16 May 2021) with the permission of the National Center for Satellite Marine Applications.

Acknowledgments

The GF—3 satellite data acquisition from the website: https://osdds.nsoas.org.cn (accessed on 16 May 2021) The authors thank the National Center for Satellite Marine Applications for their data support.

Conflicts of Interest

The authors declare no conflict of interest.

References

  1. Xu, P.; Li, Q.; Zhang, B.; Wu, F.; Zhao, K.; Du, X.; Yang, C.; Zhong, R. On-Board Real-Time Ship Detection in HISEA-1 SAR Images Based on CFAR and Lightweight Deep Learning. Remote Sens. 2021, 13, 1995. [Google Scholar] [CrossRef]
  2. Ma, M.; Chen, J.; Liu, W.; Yang, W. Ship classification and detection based on CNN using GF-3 SAR images. Remote Sens. 2018, 10, 2043. [Google Scholar] [CrossRef] [Green Version]
  3. Yekeen, S.; Balogun, A.; Yusof, K. A novel deep learning instance segmentation model for automated marine oil spill detection. ISPRS J. Photogramm. Remote Sens. 2020, 167, 190–200. [Google Scholar] [CrossRef]
  4. Kang, M.; Baek, J. SAR Image Change Detection via Multiple-Window Processing with Structural Similarity. Sensors 2021, 21, 6645. [Google Scholar] [CrossRef]
  5. Gao, Y.; Gao, F.; Dong, J.; Wang, S. Change Detection from Synthetic Aperture Radar Images Based on Channel Weighting-Based Deep Cascade Network. IEEE J. Sel. Top. Appl. Earth Observ. 2019, 12, 4517–4529. [Google Scholar] [CrossRef]
  6. Zhang, X.; Liu, G.; Zhang, C.; Atkinson, P.M.; Tan, X.; Jian, X.; Zhou, X.; Li, Y. Two-phase object-based deep learning for multi-temporal SAR image change detection. Remote Sens. 2020, 12, 548. [Google Scholar] [CrossRef] [Green Version]
  7. Chen, H.; Shi, Z. A Spatial-Temporal Attention-Based Method and a New Dataset for Remote Sensing Image Change Detection. Remote Sens. 2020, 12, 1662. [Google Scholar] [CrossRef]
  8. Niedermeier, A.; Romaneessen, E.; Lehner, S. Detection of coastlines in sar images using wavelet methods. IEEE Trans. Geosci. Remote Sens. 2000, 38, 2270–2281. [Google Scholar] [CrossRef]
  9. Baselice, F.; Ferraioli, G. Unsupervised coastal line extraction from sar images. IEEE Geosci. Remote Sens. Lett. 2013, 10, 1350–1354. [Google Scholar] [CrossRef]
  10. Ouchi, K. Recent trend and advance of synthetic aperture radar with selected topics. Remote Sens. 2013, 5, 716–807. [Google Scholar] [CrossRef] [Green Version]
  11. Reed, A.M.; Milgram, J.H. Ship Wakes and Their Radar Images. Annu. Rev. Fluid Mech. 2002, 34, 469–502. [Google Scholar] [CrossRef] [Green Version]
  12. Touzi, R.; Charbonneau, F.J.; Hawkins, R.K.; Vachon, P.W. Ship detection and characterization using polarimetric SAR. Can. J. Remote Sens. 2004, 30, 552–559. [Google Scholar] [CrossRef]
  13. Panico, A.; Graziano, M.D.; Renga, A. SAR-Based Vessel Velocity Estimation from Partially Imaged Kelvin Pattern. IEEE Trans. Geosci. Remote Sens. 2017, 14, 2067–2071. [Google Scholar] [CrossRef]
  14. Graziano, M.D.; Rufino, G.; D’Errico, M. Wake-based ship route estimation in high-resolution SAR images. Proc. SPIE Int. Soc. Opt. Eng. 2014, 9243. [Google Scholar] [CrossRef]
  15. Wang, J.; Ci, L. Ship’s Length Estimation from Its Wakes in Synthetic Aperture Radar Images. Trans. Beijing Inst. Technol. 2004, 24, 901–904. [Google Scholar]
  16. Rey, M.T.; Tunaley, J.K.; Folinsbee, J.T.; Jahans, P.A.; Dixon, J.A.; Vant, M.R. Application Of Radon Transform Techniques To Wake Detection In Seasat-A SAR Images. IEEE Trans. Geosci. Remote Sens. 1990, 28, 553–560. [Google Scholar] [CrossRef]
  17. Skingley, J.; Rye, A.J. The Hough transform applied to SAR images for thin line detection. Pattern Recognit. Lett. 1987, 6, 61–67. [Google Scholar] [CrossRef]
  18. Kang, K.; Kim, D. Ship Velocity Estimation From Ship Wakes Detected Using Convolutional Neural Networks. IEEE J. Sel. Top. Appl. Earth Obs. Remote Sens. 2019, 12, 4379–4388. [Google Scholar] [CrossRef]
  19. Zilman, G.; Zapolski, A.; Marom, M. The speed and beam of a ship from its wake’s SAR images. IEEE Trans. Geosci. Remote Sens. 2004, 42, 2335–2343. [Google Scholar] [CrossRef]
  20. An, Q.; Pan, Z.; You, H. Ship detection in Gaofen-3 SAR images based on sea clutter distribution analysis and deep convolutional neural network. Sensors 2018, 18, 334. [Google Scholar] [CrossRef] [PubMed] [Green Version]
  21. Jin, M.K.; Chen, K.S. The application of wavelets correlator for ship wake detection in SAR images. IEEE Trans. Geosci. Remote Sens. 2003, 41, 1506–1511. [Google Scholar] [CrossRef]
  22. Courmontagne, P. An improvement of ship wake detection based on the radon transform. Signal Process. 2005, 85, 1634–1654. [Google Scholar] [CrossRef]
  23. Arnold-Bos, A.; Martin, A.; Khenchaf, A. Obtaining A Ships Speed and Direction from Its Kelvin Wake Spectrum Using Stochastic Matched Filtering. In Proceedings of the IEEE International Geoscience and Remote Sensing Symposium, Barcelona, Spain, 23–28 July 2007; pp. 1106–1109. [Google Scholar]
  24. Biondi, F. A Polarimetric Extension of Low-Rank Plus Sparse Decomposition and Radon Transform for Ship Wake Detection in Synthetic Aperture Radar Images. IEEE Geosci. Remote Sens. Lett. 2019, 16, 75–79. [Google Scholar] [CrossRef]
  25. Yang, G.; Jing, Y.; Xiao, C.; Sun, W. Ship wake detection for SAR images with complex backgrounds based on morphological dictionary learning. In Proceedings of the IEEE International Conference on Acoustics, Speech and Signal Processing, Shanghai, China, 20–25 March 2016; pp. 1896–1900. [Google Scholar]
  26. Copeland, A.C.; Ravichandran, G.; Trivedi, M.M. Localized Radon transform-based detection of ship wakes in SAR images. IEEE Trans. Geosci. Remote Sens. 1995, 33, 35–45. [Google Scholar] [CrossRef]
  27. Ai, J.; Qi, X.; Yu, W.; Deng, Y.; Liu, F.; Shi, L.; Jia, Y. A Novel Ship Wake CFAR Detection Algorithm Based on SCR Enhancement and Normalized Hough Transform. IEEE Geosci. Remote Sens. Lett. 2011, 8, 681–685. [Google Scholar]
  28. Du, G.; Yeo, T.S. A novel Radon transform-based method for ship wake detection. In Proceedings of the IEEE International Geoscience and Remote Sensing Symposium, Anchorage, AK, USA, 20–24 September 2004; pp. 3069–3072. [Google Scholar]
  29. Cusano, M.; Lichtenegger, J.; Lombardo, P.; Petrocchi, A.; Zanovello, D. A real time operational scheme for ship traffic monitoring using quick look ERS SAR images. In Proceedings of the IEEE International Geoscience & Remote Sensing Symposium, Honolulu, HI, USA, 24–28 July 2000; pp. 2918–2920. [Google Scholar]
  30. Yang, G.; Yu, J.; Sun, W. Ship wake detection in SAR images with complex backgrounds based on relative total variation. J. Univ. Chin. Acad. Sci. 2017, 34, 734–742. [Google Scholar]
  31. Graziano, M.D. Preliminary Results of Ship Detection Technique by Wake Pattern Recognition in SAR Images. Remote Sens. 2020, 12, 2869. [Google Scholar] [CrossRef]
  32. Graziano, M.D.; Renga, A. Towards Automatic Recognition of Wakes Generated by Dark Vessels in Sentinel-1 Images. Remote Sens. 2021, 13, 1955. [Google Scholar] [CrossRef]
  33. Tings, B.; Pleskachevsky, A.; Velotto, D.; Jacobsen, S. Extension of ship wake detectability model for non-linear influences of parameters using satellite based x-band synthetic aperture radar. Remote Sens. 2019, 11, 563. [Google Scholar] [CrossRef] [Green Version]
  34. Tings, B.; Velotto, D. Comparison of ship wake detectability on C-band and X-band SAR. Int. J. Remote Sens. 2018, 39, 4451–4468. [Google Scholar] [CrossRef] [Green Version]
  35. China Ocean Satellite Data Service Center. Available online: https://osdds.nsoas.org.cn (accessed on 16 May 2021).
  36. Sun, Y.; Peng, L.; Jin, Y. Ship Wake Components: Isolation, Reconstruction, and Characteristics Analysis in Spectral, Spatial, and TerraSAR-X Image Domains. IEEE Trans. Geosci. Remote Sens. 2018, 56, 4209–4224. [Google Scholar] [CrossRef]
  37. Fan, K.; Zhang, H.; Liang, J.; Chen, P.; Xu, B.; Zhang, M. Analysis of ship wake features and extraction of ship motion parameters from SAR images in the Yellow Sea. Front. Earth Sci. 2019, 13, 588–595. [Google Scholar] [CrossRef]
  38. Chen, P.; Li, X.; Zheng, G.; Zhang, H. A new method for extracting ship motion parameters in Radarsat-2 SAR imagery. Int. J. Remote Sens. 2019, 40, 5617–5634. [Google Scholar] [CrossRef]
  39. Hennings, I.; Romeiser, R.; Alpers, W.; Viola, A. Radar imaging of Kelvin arms of ship wakes. Int. J. Remote Sens. 1999, 20, 2519–2543. [Google Scholar] [CrossRef]
  40. Jen, K. Theory of synthetic aperture radar imaging of a moving target. IEEE Trans. Geosci. Remote Sens. 2001, 39, 1984–1992. [Google Scholar]
  41. Yang, J.; Zhang, Y. Analysis on the azimuth shift of a moving target in SAR image. Prog. Electromagn. Res. 2015, 42, 121–134. [Google Scholar] [CrossRef] [Green Version]
  42. Zilman, G.; Zapolski, A.; Marom, M. On Detectability of a Ship’s Kelvin Wake in Simulated SAR Images of Rough Sea Surface. IEEE Trans. Geosci. Remote Sens. 2015, 53, 609–619. [Google Scholar] [CrossRef]
  43. Rodriguez, A.; Laio, A. Clustering by fast search and find of density peaks. Science 2014, 344, 1492–1496. [Google Scholar] [CrossRef] [Green Version]
  44. Redmon, J.; Farhadi, A. YOLOv3: An Incremental Improvement. arXiv 2018, arXiv:1804.02767. [Google Scholar]
Figure 1. Various wakes of ships and their geometric relations: (a) The geometry of the wake pattern produced by ships; (b) The relationship between ship direction and wake region: I, II, III and IV represent the wake region caused by the maximum Doppler shift in four directions, α and α’ are the angle of two tracks respectively.
Remotesensing 14 00025 g001
Figure 2. Schematic diagram of Specific Window distribution.
Remotesensing 14 00025 g002
Figure 3. Fine detection of wakes from the same ship: (a) Wakes of different scales and their detection subwindows; (b) turbulence wakes and Kelvin wakes of different lengths in SAR images.
Remotesensing 14 00025 g003
Figure 4. Pixel variation trend diagram of wake axis.
Remotesensing 14 00025 g004
Figure 5. Creation of multi-ship and multi-scale wake data sets: (a) SAR images; (b) preselect the images with ship wakes; (c) crop sub-images with multiple ships and multiple wakes; (d) labeled sub-images.
Remotesensing 14 00025 g005
Figure 6. Representative SAR images of ship wakes.
Remotesensing 14 00025 g006
Figure 7. Detection results: (a) Highlight area centroid detection results; (b) Radon-based results of subwindows with wakes; (c) Candidate position of wake line after standardization; (d) Fine position of each wake component; (e) The final result; (f) The YOLO algorithm detection result.
Remotesensing 14 00025 g007
Figure 8. Schematic diagram of IoU principle of wake detection: (a) The actual box (Black) and prediction box (Blue) of the wake line; (b) Intersection area of actual and prediction boxes; (c) Union area of actual and prediction boxes.
Remotesensing 14 00025 g008
Figure 9. Some SAR samples and detection results of the ship wake: (a) Single wake; (bd) Multiple wakes.
Remotesensing 14 00025 g009
Table 1. Orbit parameters and load indexes of Gaofen-3 satellite.
SatelliteItemParameters
Gaofen-3OrbitSun-synchronous orbit
Orbit altitude755 km
Orbit inclination98.5°
Revisit period<3 days (Dual-side Looking)
<1.5 days (Single-side Looking) 1
Frequency bandC-band
Incidence angle10°–60°
Signal bandwidth0–240 MHz
PolarizationSingle/Dual/Full
Imaging modes12
Spatial resolution1–500 m
Swath width10–650 km
1 10 m resolution, 100 km mapping bandwidth, 90% real-time observation area.
Table 2. The detailed information of the wake data set.
Imaging ModeResolution(m)Incidence Angle (°)
UFS3 × 320–50
FS-I5 × 519–50
FS-II10 × 1019–50
Table 3. Confusion Matrix.
Wake DetectionPrediction = 1Prediction = 0
Actual = 1TPFN
Actual = 0FPTN
Table 4. Quantitative comparison results (Shown as average values).
Wake DetectionOur MethodYOLO
Precision0.910.94
Recall0.890.87
IoU0.820.74
Publisher’s Note: MDPI stays neutral with regard to jurisdictional claims in published maps and institutional affiliations.

