1. Introduction
The main area of application of Airborne Laser Scanning (ALS) in forests is from the very beginning collecting data to determine the height of individual trees and entire stands, tree density and the reserve (biomass) of stands [
1,
2]. Later, there were attempts to classify the content of ALS data, i.e., to identify registered objects, including the species affiliation of individual trees. For forest districts, important information is also the other parameters related to structure and contribution of tree layer and number of trees in the forest district area [
3,
4].
Overviews of the obtained results are provided by [
5,
6]. Currently, there are two main approaches for using ALS to characterize forest resources [
7]: (1) an area-based approach typically providing data at stand level and (2) a single-tree approach where individual trees are the basic unit of the assessment.
The detection of single trees requires, above all, an appropriate scanning density, season and specific purpose of the study. In literature [
7] we find that the single-tree approach performs best with dense laser scanning (5–10 laser pulses m
−2), however, for older trees with large canopies even as few as 2 pulses m
−2 may be sufficient [
8]. Not all trees are usually detected and there is still a need to find a new methodology for tree detection.
This paper proposes a new methodology for calculating the number of trees based on ALS measurement. Addressing this problem was dictated by the demand for this type of information by the forest district unit. The most important reasons for the great interest of foresters in the data from ALS, and therefore, undertaking research on the usefulness of this technology in forest management, among others [
9,
10]:
Possibility of precise description and measurement of the forest’s objects and trees.
Acquiring tree and their heights, trees crown size, number of trees (density),
details of the vertical structure of the stand (stacking) after ALS data processing.
Measurement of all trees from the top floor. The ALS technology opens up new possibilities for height detection and measurement and selected other features (e.g., crown width, crown base).
Speed of data acquisition. There is currently no other method that is as efficient. In this respect, laser scanning technology is much better than field measurements. One ALS mission can last several hours, and the results collected during this time accurately describe hundreds of square kilometers of the area. Interferometric Synthetic Aperture Radar (InSAR) and Polarimetric Interferometry (PolInSAR) become a competition for this technology, while access to data and its development is much more time-consuming [
11].
Data processing automation. Huge data sets can only be processed using fully automatic or semi-automatic algorithms. Automation helps to ensure objectivity while taking measurements and reduces their costs.
Lack of some flaws typical of photographic images. Land cover models can be presented in any projections, including orthogonal projection. With proper planning, raids have no shadows cast by objects or insufficiently lit place.
In this paper, particular attention was paid to the possibility of detecting single trees with the use of existing software. The proposed new methodology for processing ALS data is a contribution to research on the use of ALS data in forest districts to maintain up-to-date and accurate statistics on stands. Samławki Forest District keeps its statistics on tree stands, size of wooded areas and forest density. Each year the forest is cleared and planted in order to increase its vitality and care for the good culture of forest areas.
In the literature on the subject, there are studies on the detection of single trees, among others: [
12,
13,
14].
In [
12], the authors presented a method for single tree segmentation and characterization from a canopy surface model (CSM), and its corresponding point cloud, based on airborne laser scanning. The method comprised new algorithms for controlling the shape of crown segments, and for residual adjustment of the canopy surface model. They presented a new criterion that measures the success of locating trees and demonstrate how this criterion can be used for optimizing the degree of CSM smoothing. The results showed that the method overestimated crown diameter and crown base height.
The interesting solution proposed by [
13] used multibaseline SAR interferometry (InSAR) and airborne laser scanning (ALS) datasets for the identification of trees. All point clouds showed similar geolocation accuracies with 0.2–0.3 m relative shifts. Both InSAR and ALS techniques yielded points predominantly located in the upper levels of the forest vegetation, while ALS provided points from the top of the canopy down to the understory and forest floor. The results demonstrated the use of millimeter wave SAR interferometry data as an alternative to ALS- and photogrammetry-based data for forest monitoring.
In [
14], authors used satellite metric imagery along with canopy altimetry from airborne LiDAR for detect individual trees [
14]. For this objective, authors optimized, calibrated and applied a model based on marked point processes to detect trees in high biomass mangroves of French Guiana by considering a set of 1 m pixel images. They showed the relevance of detection considering: the agreement in space of detected crown centers locations with known true locations for the DART images and also the detection agreement for each pair of IKONOS and LiDAR images, and the comparison between the frequency distributions of the diameters of the detected crowns and of the tree trunks measured in the field. The authors presented that results are encouraging provided that crown sizes are sufficiently large compared to 1 m pixels.
Another approach to the subject of identification and DSM and DTM Point Cloud Generation dense has been presented by [
15]. The primary objective of this study is to provide a methodology to generate a dense point cloud of a digital surface model (DSM) and digital terrain model (DTM) from 0.6 m GSD stereo images acquired by the CARTOSAT-2E satellite of the Indian Space Research Organization. This proposed method consists of several processes, such as orienting the stereo images, DEM point cloud extraction using the semi-global matching, and DSM to DTM filtering. The stereo model is built by performing aero triangulation and block adjustment using the ground control points. The semi-global matching algorithm is used on the epipolar images to generate the DSM in the form of a dense point cloud corresponding to one height point for each pixel.
Similar to the references to literature already indicated, the authors of [
16] discussed their solution based on determining forest height using discrete-return LiDAR data, SRTM, satellite L-band SAR data, and Optical data.
The proposed methods have varying detection efficiencies, but the literature review shows that automatic tree detection still requires searching for new approaches and methodologies. Due to the development of computer technologies and an increase in the efficiency of software dedicated to processing LiDAR point clouds, skillful selection of software may result in an increase in the accuracy of detecting single trees. Proper data preparation in the pre-processing stage is also of great importance. The paper proposes a methodology based on several software. The pre-processing step was done in LASTools, WhiteboxTools, CloudCompare and ArcGIS software and the next steps were done in SAGA GIS software.
The proposed methodology allows determining: the number of trees and the height of the trees. The knowledge of additional parameters for selected forest addresses, such as valuation class, age of the stand, as well as the dbh of a representative sample, read from the tables, and the field interview allowed for the calculation of the volume of two stands at two forest addresses of the Samławki Forest District.
2. Materials and Methods
ALS data was obtained from the website
https://pzgik.geoportal.gov.pl/imap/ (date of data download 14 January 2021). The data was collected as part of the Nation Protection IT System (ISOK) project. The ISOK system is a comprehensive tool for protection against dangerous hazards in particular meteorological and hydrological ones. The acquired ALS point cloud contains a network of points with coordinates (X, Y, H) in the WGS-84 coordinate system and the measurement was made in 2017.
Two forest addresses from Samławki Forest District (State Forest in Poland) were selected for the analysis. Localization of the research area is presented in
Figure 1.
In
Figure 2 two forest addresses: 07-14-2-06-13 -b -00 (called: 13b) and 07-14-2-06-30 -a -00 (called: 30a) were presented.
Table 1 Presents indicators describing selected forest addresses, provided by Samławki Forest District.
3. Methodology
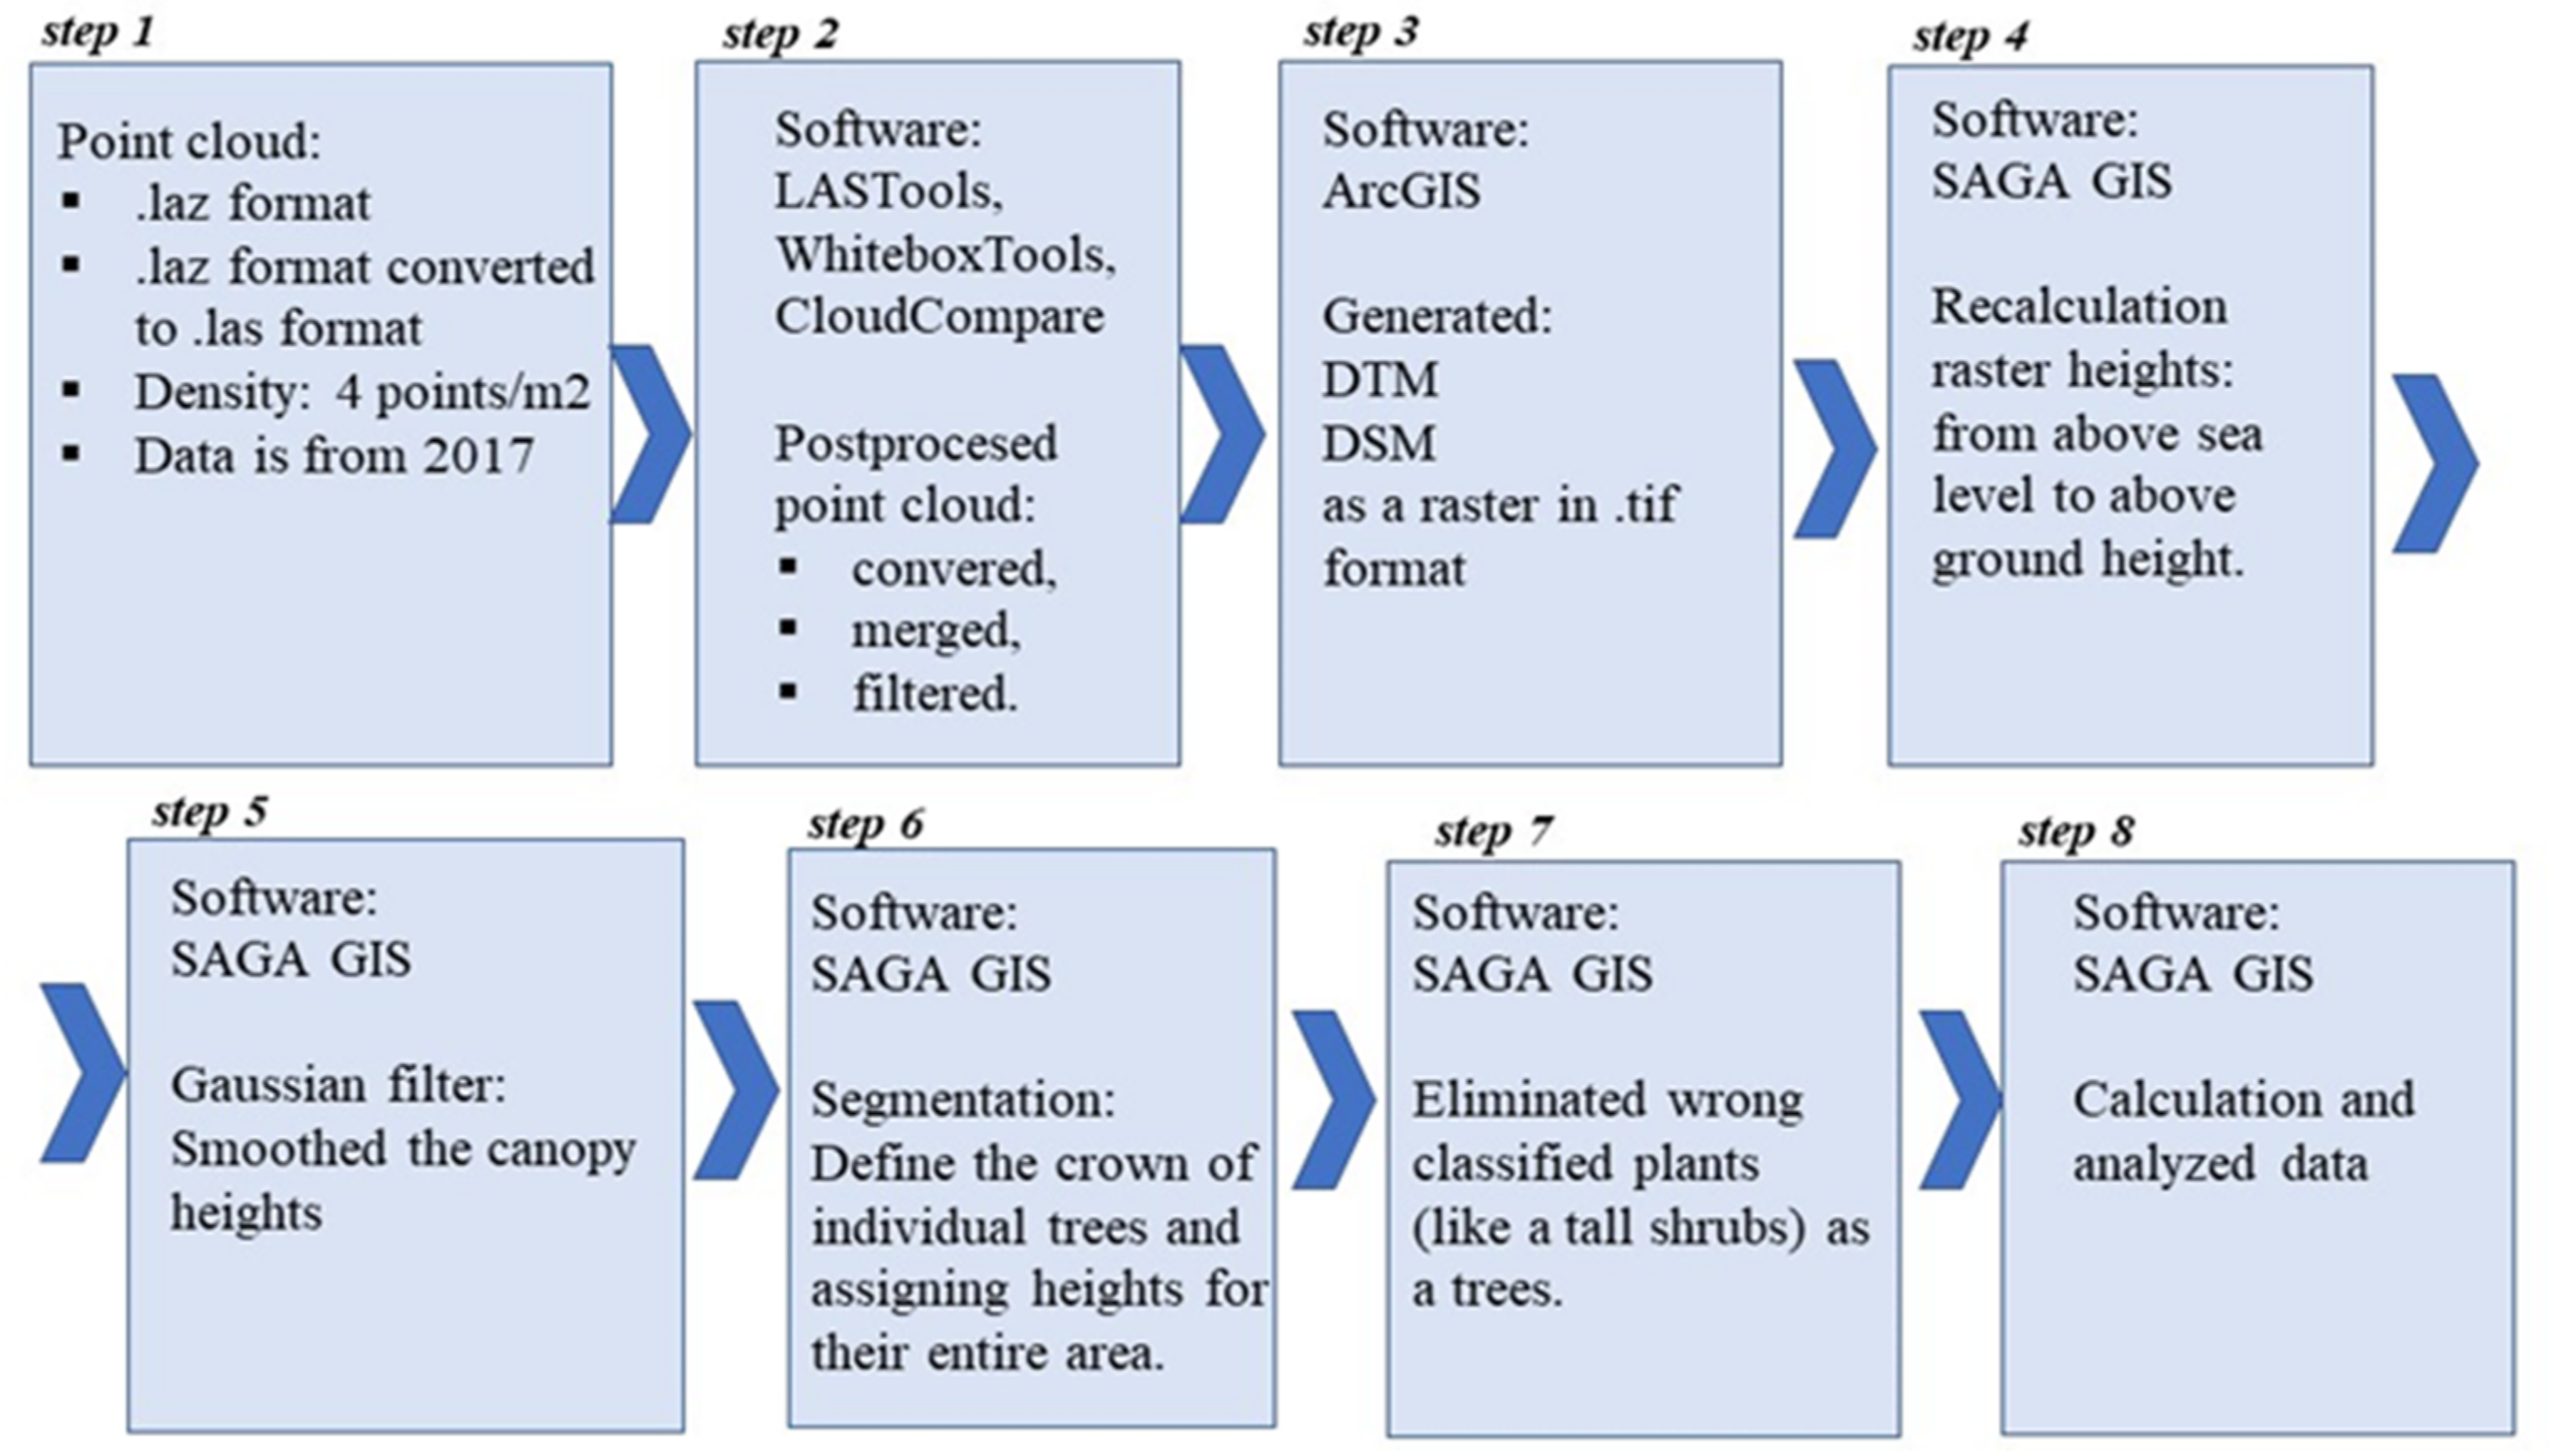
The downloaded point clouds for the selected forest addresses were processed taking into account the new methodology for the development of ALS point clouds for forestry applications. The proposed methodology is based on the released data from ALS measurement, which are made available for the entire territory of Poland. In stage 1, point clouds are obtained in the form of .laz files. Depending on the terrain, these data are characterized by a different measurement resolution and a different measurement epoch. In the case of the tested point clouds, they were from 2017 and have a resolution of 4 points/m
2. Then, in stage 2, point clouds are prepared, which consists in separating specific classes from the set: low (3 class), medium (4 class) and height (5 class) vegetation and ground (2 class). In the next step 3, the DTM and DSM are generated. The inverse distance weighting (IDW) method was used for the generation, thanks to which the resolution of the models was increased. In this way, models with a resolution of 0.25 m were obtained. It was important in the next steps. In stage 4, the heights of the generated models were recalculated from above sea level to above ground height. For this purpose, the DSM-DTM differential models were developed. Later in step 5, a Gaussian filter was applied to smooth the canopy height. In order to detect trees along with their height in step 6, the process of segmentation was performed. It involved with detection of the canopy contours in the top view. For this purpose, the maximum pixels values constituting the highest point of each tree were found. Each generated canopy possessed its own point representing an individual tree along with an attribute containing the height data of the selected tree. The disadvantage of this segmentation is the over-segmentation. However, the earlier use of the Gaussian filter in step 5 prevented the over-segmentation problems. Then, in stage 7, the correctness of tree identification was checked, and then in stage 8, the calculation of the final number of trees in the forest address under study. The steps of the methodology are presented in
Figure 3.
Step 4 is of significant importance in the processing of the proposed methodology. The resolution of the generated DTM and DSM should be adjusted. It should be based on the point density in the cloud and, of course, the same for both models to be able to produce a differential model. The accuracy of the creation of the differential model is also influenced by the correctness of the performed point cloud classification, especially for DTM.
4. Results
Two selected forest addresses were processed using the previously described methodology.
Figure 4a shows the point cloud for the forest address 13b, while
Figure 5a shows the point cloud for the forest address 30a. Both figures also show the vegetation point class (
Figure 4b and
Figure 5b) and the ground class
Figure 4c and
Figure 5c).
In
Table 2 the characteristics of datasets are presented.
The number of point clouds in the area of both forest addresses was similar. Then, point clouds from both forest addresses were processed in accordance with the assumptions of stages 3–6, as presented in
Figure 6 and
Figure 7.
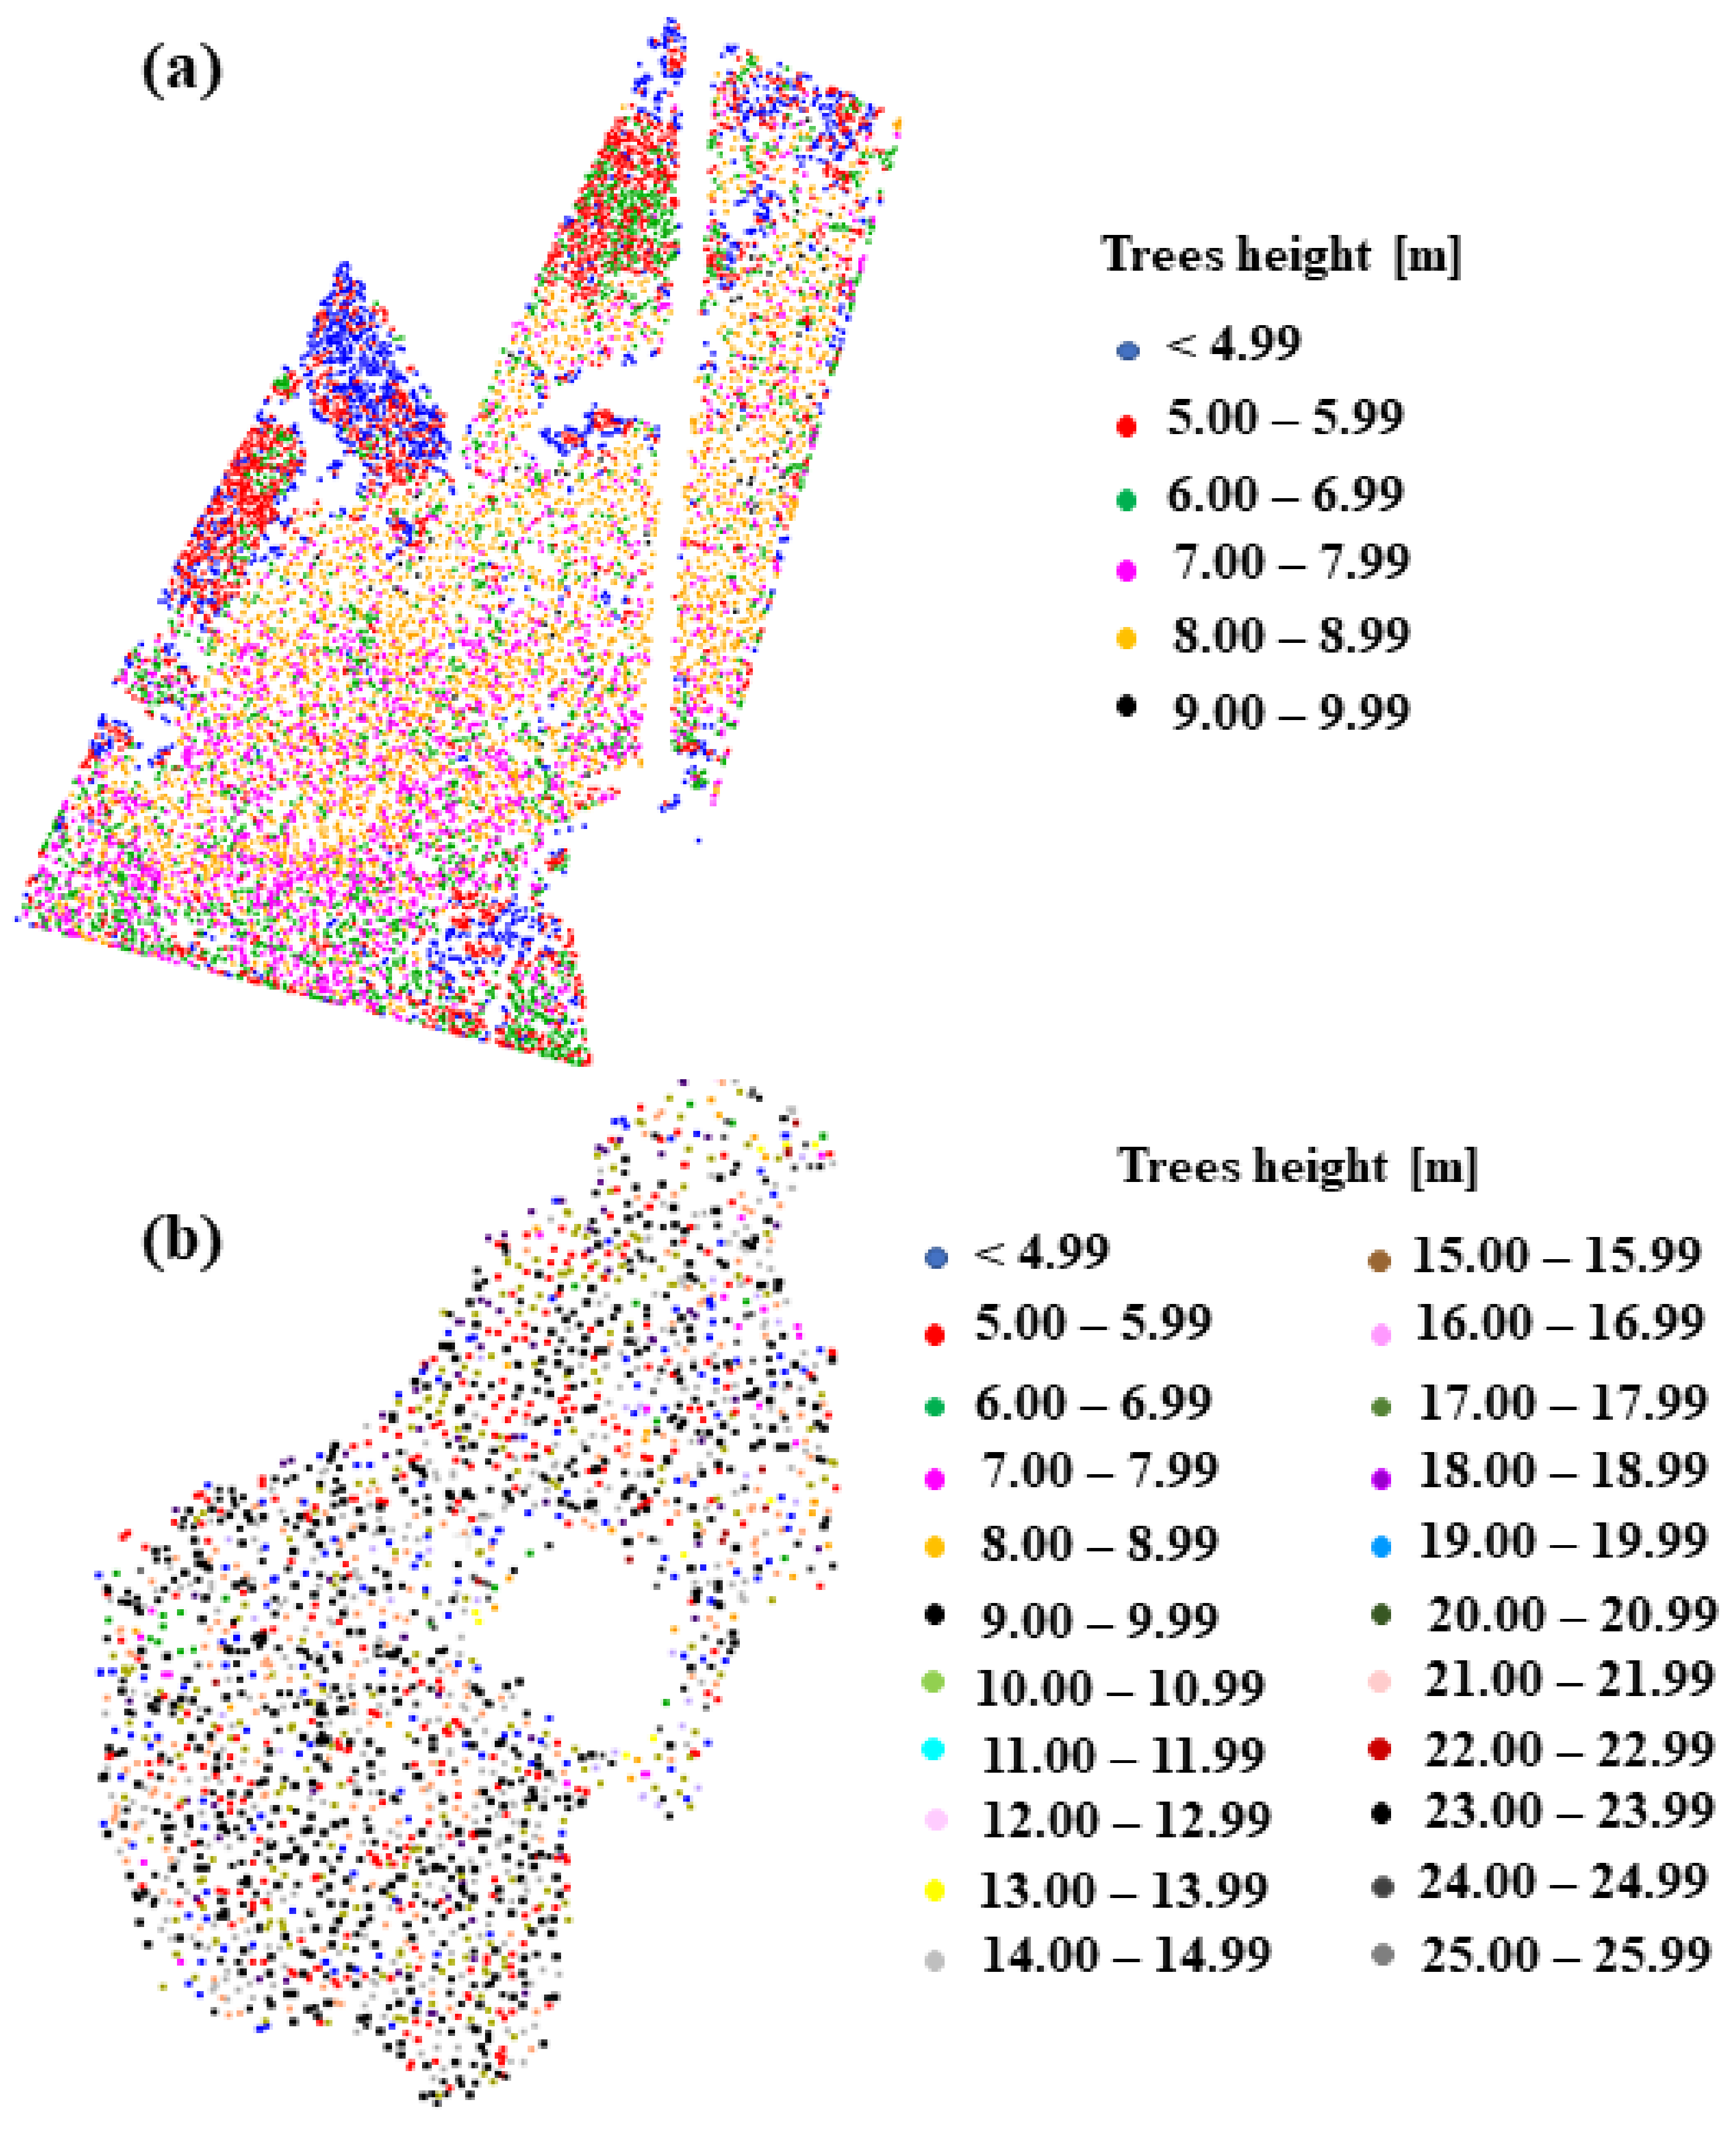
Based on the results obtained from stage 6, in which the segments (areas) with a single tree were obtained, the final number of trees was calculated. The trees found were also categorized by height. There were five height ranges, the same for both forest addresses. The results are presented in
Table 3.
In the area of forest address 13b, a total of 7285 trees were detected, while in the area of forest address 30a 2356 trees. Comparing with the statistics provided in the tables available in the chronicles of the Samławki Forest District, it can be stated that there is much more larch than oak, although the area of the forest addressed with oaks is only half a hectare larger.
After the field interview and analysis of the records in the archives of the Samławki Forest District, it should also be noted that larch is located in the upper story of the stand, and beech is still growing in the lower story. Therefore, there is a high probability that the lower parts (5 m and less than 5 m) are beeches. It is similar at the forest address 30a. There are also beeches on the lower floor of the oak stand.
The visualization with the division into tree height intervals is presented in
Figure 8a,b.
The Forest Management Plan (FMP) for the period from 1 January 2017 to 31 December 2026 drawn up by the Regional Directorate of State Forests in Olsztyn includes statistics that confirm the results obtained. The average height of larches in 2017 was 11 m, while the average height of oaks was 24 m, which agrees with the results obtained from the proposed methodology.
Calculating the Volume of Standing Trees
In order to calculate the volume of stands, apart from the number of trees and their height, it was necessary to know the dbh and form factor for thick or general cargo, read from tables for a specific species and stand valuation (). The dbh is the most common parameter used in the measurement of standing timber and in Poland it is a measurement at 1.30 m height of a tree. Then the cross-sectional area (csa) of the tree is calculated based on dbh. The form factor for the studied stands was obtained from the tables Szymkiewicz, Boleslaw. “Tables of holdings measurement and growth of timber stock.” (1971).
It is a study used in Poland to check selected tree parameters. The tables are described in the literature, e.g., [
17].
The general formulas for calculating the volume of standing trees are:
where:
—the volume of standing trees [m3],
—cross-sectional area of the tree [m2],
—tree height [m],
—form factor.
During the site visit, for the so-called representative sample of 20 trees dbh was measured and the mean value was calculated. The mean dbh, csa and f are presented in
Table 4.
The mean height in the group was used to calculate the volume for individual groups (according to the tree height), except for the group <4.99. For this group, the amount of 4.99 was assumed for the calculations. Then for the next groups: 5.50 m, 6.50 m, 7.50 m, 8.50 m, 9.50 m, 10.50 m, 11.50 m, respectively. The mean height from the group was multiplied by csa and form factor, thus obtaining the thicknesses in individual groups, and in the next step, the obtained volumes were multiplied by the number of trees in the group. The calculated volumes of standing trees are presented in
Table 5.
The volume of the stand expressed in cubic meters of timber per 1 hectare in 2017 given in the FMP for larch was 90 m3/ha (365 m3/ha for the entire forest address), while for oak it was 665 m3/ha (3091 m3/ha for the entire forest address).
A summary of the obtained results and data from the FMP is presented in
Table 6.
Comparing the volume of stand obtained with the proposed methodology and the values contained in the FMP, it can be noticed that there are some differences. In the case of the larch forest, the volume differs about 25%, and in the case of the oak forest about 5%.
Thus, the effectiveness of the proposed method can be determined at the level of about 76% in the case of larch about 96% in the case of oak.
5. Conclusions
The aim of the study was to propose a new methodology for tree detection with the use of ALS data. The methodology was based on free data from the geoportal.gov.pl portal and free software, which allowed to minimize the costs of data preparation for the needs of forestry activities. In cooperation with the Samławki Forest District, the proposed methodology was used to detect the number and heights of trees for two forest addresses 13b and 30a, and then to calculate the volume of stands.
As the research shows: (a) detection of the number of trees from the ALS data, (b) determination of the height of these trees, (c) field interview, (d) parameters available in the FMP, and (e) tables used in forestry, it was possible to calculate the volume of stands.
As a result of the methodology used, the volume of oak and larch stands was calculated. Unfortunately, it is difficult to unequivocally assess the effectiveness of the proposed method. In the case of oak, in the study, it was almost 96%, while in the case of larch it was about 76%. It could result from the segmentation method implemented in the Saga GIS software, compactness and density of stand. It should be emphasized that when determining the volume of a stand, we talk only about estimating, not about the exact value. FMP is prepared for a period of 10 years, therefore, the value of the stand volume is calculated at a given moment and the assumed value at the end of the FMP period is an approximate value. Consultations with a forester (co-author of the publication) confirmed that the obtained results are satisfactory, and the proposed methodology can be a tool supporting the work of forest districts.
The number of identified trees has the greatest impact on the calculation of the stand volume. However, the number of identified trees is influenced by stand compactness and ALS scanning density, which was 4 points/m2. These two factors combined influenced the identified number of individual trees in both stands.
The density of an oak stand at the analyzed forest address is defined as horizontal, moderate/ interrupted. The density of the larch stand is defined as horizontal, moderately large. This means that the crowns of oaks are significantly spaced apart, and the crowns of larches are close to each other or touching. According to our assessment, some larch trees have not been identified as separate trees due to the fact that the crowns are very dense. To summarize it can be stated that the most important goal of our work has been achieved because, on the basis of generally available (covering the territory of Poland) data from ALS and commonly used software, it was possible to determine the volume of stand for any selected forest address. The proposed methodology is simple and may constitute an additional source of information for foresters.
As ALS data is not updated every year for the entire territory of the country, the next stage of work will be to collect data using an unmanned aerial vehicle (UAV) and then assess their quality and suitability for the purpose of tree stand assessment.


 ,
, 


