Article

Design of a Local Nested Grid for the Optimal Combined Use of Landsat 8 and Sentinel 2 Data

by
David Hernández-López
1,
Laura Piedelobo
2,3,
Miguel A. Moreno
1,
Amal Chakhar
1,
Damián Ortega-Terol
2,4 and
Diego González-Aguilera
2,*
1
Institute for Regional Development (IDR), University of Castilla-La Mancha, Campus Universitario s/n, 02071 Albacete, Spain
2
Department of Cartographic and Land Engineering, University of Salamanca, Hornos Caleros 50, 05003 Ávila, Spain
3
Istituto Universitario di Studi Superiori di Pavia (IUSS), Palazzo del Broletto, Piazza della Vittoria 15, 27100 Pavia, Italy
4
National Geographical Institute, Regional Service in Castilla-La Mancha, Av. de España, 7, 02002 Albacete, Spain
*
Author to whom correspondence should be addressed.
Remote Sens. 2021, 13(8), 1546; https://doi.org/10.3390/rs13081546
Submission received: 9 March 2021 / Revised: 13 April 2021 / Accepted: 14 April 2021 / Published: 16 April 2021
(This article belongs to the Special Issue Sentinel Analysis Ready Data (Sentinel ARD))

Abstract

:
Earth Observation (EO) imagery is difficult to find and access for the intermediate user, requiring advanced skills and tools to transform it into useful information. Currently, remote sensing data is increasingly freely and openly available from different satellite platforms. However, the variety of images in terms of different types of sensors, spatial and spectral resolutions generates limitations due to the heterogeneity and complexity of the data, making it difficult to exploit the full potential of satellite imagery. Addressing this issue requires new approaches to organize, manage, and analyse remote-sensing imagery. This paper focuses on the growing trend based on satellite EO and the analysis-ready data (ARD) to integrate two public optical satellite missions: Landsat 8 (L8) and Sentinel 2 (S2). This paper proposes a new way to combine S2 and L8 imagery based on a Local Nested Grid (LNG). The LNG designed plays a key role in the development of new products within the European EO downstream sector, which must incorporate assimilation techniques and interoperability best practices, automatization, systemization, and integrated web-based services that will potentially lead to pre-operational downstream services. The approach was tested in the Duero river basin (78,859 km2) and in the groundwater Mancha Oriental (7279 km2) in the Jucar river basin, Spain. In addition, a viewer based on Geoserver was prepared for visualizing the LNG of S2 and L8, and the Normalized Difference Vegetation Index (NDVI) values in points. Thanks to the LNG presented in this paper, the processing, storage, and publication tasks are optimal for the combined use of images from two different satellite sensors when the relationship between spatial resolutions is an integer (3 in the case of L8 and S2).

Graphical Abstract

1. Introduction

Earth Observation (EO) is considered a crucial tool for achieving the 2030 United Nations Sustainable Development Goals (SDGs) [1]. Especially, climate change-, natural hazards- and environmental protection-related SDGs represent focal challenges worldwide [2]. Currently, the development of multiscale data (i.e., with different resolutions) and open-source tools and models that help in evidence-based policy- and decision-making is mostly based on processing open data from the Landsat 8 (L8) [3] and Sentinel 2 (S2) satellite missions [4,5,6], e.g., using vegetation indices in agronomical applications, such as crop type mapping and monitoring [7,8], snow cover evolution [9] and monitoring vegetation changes [10], among others.
The development of the European EO downstream sector, and thereby increasing its economic value, depends on such tools and models offering value-added information to the end-user (e.g., advisors, public institutions, farmers, policy- and decision-makers) in comparison with already available products [11,12]. In this sense, using multisource data (i.e., data coming from different sensors and formats), artificial intelligence and semiautomatic or automatic processes pop up as the most tactical developments [11].
However, exploiting data from different sensors, particularly for time-series analysis, implies dealing with: (i) different acquisition and processing approaches; (ii) different spatial, spectral, temporal and radiometric resolutions; (iii) image georeferencing; and (iv) the possible change in the retrieved variable due to the aforementioned differences, especially the bands configuration of each satellite mission, i.e., its spectral resolution [13,14,15,16].
Considering that the complexity of exploiting data acquired from different sensors with different characteristics may pose a limitation for dense time-series analysis, different authors have developed some initiatives based on the Earth observation data cube (EODC) technology [17,18,19,20,21,22]. A complete analysis of the latest EODC developments and implementations is provided at [23].
When related with geospatial information, a systematic and regular provision of analysis-ready data (ARD), optimized for the problem in question, is required. The open-source project gdalcubes [24,25,26] addresses this issue by proposing a solution based on obtaining data cubes on demand for specific applications. In this project, tools are available for most space missions and can be easily adapted for any other mission or type of platform, such as sensors embedded in drones.
In [27], the main problems mentioned are described and the importance of finding a solution in which the pixels have an integer size in most of the Levels of Detail (LODs) is pointed out. The solution proposed is based on that adopted by Google Maps and OpenStreetMap (OSM) through the global Web Mercator [28,29] by choosing a tangency parallel for the Secant Web Mercator projection.
This article proposes the design of a Local Nested Grid (LNG) as the solution [27]. The approach spatially structures remotely sensed data from L8 and S2 optimally from the georeferencing and processing points of view. Currently, the Operational Land Imager (OLI) and the Multispectral Instrument (MSI) sensors, onboard L8 and S2, respectively, are frequently used in combination to increase the input data temporal resolution, i.e., the possibility for using cloud-free images [30]. The proposed design pursues an additional purpose: easing the exploitation and publication of the derived results into further processing models, guaranteeing a higher accuracy, efficiency and reliability on the results obtained. The issues that justify the need for the proposed approach are explained further in detail as follows [27]:
1. Differences within satellite georeferenced scenes.
Each satellite mission distributes remotely sensed data within georeferenced scenes. These scenes comprise spectral bands. The bands could share the same temporal resolution but have different spectral resolutions and either the same or different spatial and radiometric resolutions [13,14]. Spectral indices are a mathematical combination of two or more of these bands and are used because they are more clearly related to biophysical parameters of interest [31]. The indices, such as the Normalized Difference Vegetation Index (NDVI) [32], are retrieved as a raster file with the same georeferencing system as the processed bands, thereby differing between scenes and satellite missions.
2. Pixels’ misalignment.
Pixels’ misalignment is an important handicap derived. It occurs both between the same bands of different scenes from the same satellite mission and between equivalent bands of different satellite missions, even if having the same spatial resolution [16]. This issue leads to the need for introducing time-consuming resampling processes of the satellite input data, sometimes even more than once within the same approach [33]. The LNG designed is more efficient since it assures individual pixels’ alignment at the same spatial resolution and as a set of pixels for the Maximum Spatial Resolution (MSR) between the satellite missions. Therefore, each L8 pixel, of 30 × 30 m, comprises 9 S2 pixels, of 10 × 10 m, as a 3 × 3 matrix. Moreover, the approach establishes integer coordinates for the pixels’ squares at all levels of detail until the MSR. Integer pixel sizes are highly preferable to non-integer ones since operations will lead to rounding errors. These errors accumulate when processing many pixels, thus becoming a noticeable error in the form of visual artifacts such as moiré, missing lines and other problems. Our design solves the issue of pixels’ misalignment as an initial conversion, thereby avoiding the need for further intermediate resampling in subsequent processing algorithms, as long as working at the MSR. Pixel alignment is a consequence of the bounding box of each file in the LOD4 and an integer number of the pixels included. In addition, the corner coordinates are integer numbers.
3. Coordinate Reference System (CRS).
Selecting the appropriate CRS is a usual handicap within cartographic projects. No ideal solution exists given the impossibility of representing the reference surface of a terrestrial geodesic system, the ellipsoid, over a map without deformations. Therefore, a compromised solution must be always adopted depending on each case study [34]. In this context, it is important to differ between considering the whole Earth surface or a regional study area [35]. The latter is the case considered in this paper, although the design can be generalized to the context of the whole Earth. Particularly, the proposed solution adopts the same CRS used in the spatial missions, based on UTM projection, and takes the zone that covers most of the Region of Interest (ROI). This is the correct option considering the linear and surface deformations. Furthermore, this choice guarantees the minimum alteration in the value resulting from the conversion for the region of the terrain corresponding to each pixel of MSR of the satellite missions considered.
4. Spatial size of the raster files derived.
Finally, another important choice is the spatial resolution of the files and, consequently, the size of the resulting files [28]. In the proposed solution, an LOD must be selected within the LNG structure. The solution proposed is based on that adopted by Google Maps and OpenStreetMap (OSM) through the global Web Mercator [28,29]. Its associated Tiling Schema recently became an official OGC standard, known as the Web Map Tile Service Simple Profile (WMTS). This schema is described further in detail in Section 2.3 as being the theoretical base point for the approach presented in this paper.
In the context of spatial planning and environmental management, local stakeholders continue highlighting the need for high-resolution, value-added and easily understandable information that is continuously available, reliable and updated, and that helps in achieving EU policies [36]. The presented approach considers the tactical developments proposed by the European Commission. Firstly, the further development of the EU EO downstream sector within the Copernicus programme, particularly into the EU Space Programme 2021–2027, aims at maintaining the EU leadership in the Space domain worldwide, thereby using, and further developing, the Sentinels and the derived services [37]. Secondly, the EU Research and Innovation (R&I) actions in the frame of the H2020 and H2030 highlight the need for new, transparent and integrated solutions to better understand the Earth’s ecosystems, minimise climate-change impacts, support accountability towards long-term goals, and inform climate services and decision making [1,2].
The LNG designed plays a key role in the development of new EO products, which must incorporate assimilation techniques and interoperability best practices, automatization, systemization and integrated web-based services that will potentially lead to preoperational downstream services [37]. Therefore, it represents an open, multiscale and multisource design that ensures the interoperability of the two most currently used optical satellite missions: L8 and S2.
The strategies of the new Green Deal towards sustainable nature-based agriculture activities, e.g., through the “farm to fork” strategy [38] and the special interest of the European Environment Agency (EEA) on mapping and assessing the Earth’s ecosystem [39], led the authors to focus this work on aiding a perfect coherence between different sensors when using vegetation indices to monitor large areas accurately and efficiently. The LNG has been successfully applied in the Spanish region covered by the Duero river basin, which accounts for almost 80,000 km2. Multitemporal series of the NDVI, retrieved from different scenes from L8 and S2 that covered the river basin in the period of March to October 2017, were automatically downloaded and processed within the spatial regions designed. In addition, to test and compare the advantages of the proposed LNG, another case study was selected in the Jucar river basin: the groundwater Mancha Oriental (7279 km2). In this case study, the period selected was January to October 2019, thereby taking advantage of already atmospherically corrected scenes (Level 2A of S2 and Level 2SP of L8).
After outlining the need for designing the LNG and describing existing solutions that served as a baseline as well as its impact on the NVDI mapping of a large case study area, the article is organized as follows. Section 2 describes the input data, the proposed tiling schema and the study area where it has been tested. Section 3 shows the results and accuracies obtained using this approach. Finally, Section 4 summarizes all conclusions derived and future works, especially focusing on the further development of the EU EO downstream market.

2. Materials and Methods

2.1. Case Studies: The Duero River Basin and the Groundwater Mancha Oriental

The Duero river basin constitutes the largest hydrographic basin in Spain (78,859 km2). It is mainly located in the community of Castilla y Leon (Figure 1) and presents great heterogeneity in its climate, landscape and land use [40]. Given its size, it is crucial to rely on various satellite missions that guarantee the best possible coverage and thus respond to the needs of the stakeholders with greater precision and reliability. The irrigated area of the case study accounts for 4885 km2 [40].
The hydroclimatic variability in the Duero river basin, both spatially and temporally [41], and the intensive irrigation activity (around 80% of the consumptive demand) [42] made the Hydrological Planning Office outline the need for a tool that facilitated inspection and surveillance tasks. In this sense and given the large study area, remote sensing is considered an ideal information source, especially in the current context of free access to data provided by satellite missions such as L8 (United States Geological Survey, USGS, Hunter Mill, VA, USA) and S2 (European Space Agency, ESA, Paris, France), which also justify its use in this type of application. [5,6,7,8,9,10].
The groundwater Mancha Oriental belongs to the Jucar river basin (South–Eastern Spain) and has a surface of 7279 km2 within the full aquifer. This case study was selected since this aquifer covers a total area of 8500 km2 and has relatively uniform agroclimatic conditions. The most important economic activity in this region is agriculture. Annual average precipitation is below 400 mm/year and has an average annual reference evapotranspiration of more than 1200 mm/year. This aquifer supplies water to more than 110,000 ha of high-water-demanding crops with an average water table level of around 100 m. These restrictive agroclimatic and hydrological conditions demand measures that ensure sustainable water resource management. Remote-sensing techniques have been applied for a long time by water managers in this area. However, although proper measures to ensure high radiometry quality have been applied, less attention has been paid to adequate georeferencing and interoperability of the wide range of available products, which can lead to inaccurate results, primarily when products from different dates and platforms are compared. The overlapping of the paths of the L8 and S2 scenes that capture the case study is visible in Figure 2.

2.2. Satellite Data: L8 and S2

In the Duero river basin, given the large extension of the study area, 11 scenes of L8 and 16 granules of S2 are needed to cover it (Table 1). In the groundwater Mancha Oriental, 1 scene of L8 and 2 granules of S2 are needed. In the first case study, the study period is March–October 2017, and Level 1C images have been automatically downloaded from S2 and Level 1T from L8. In the second case study, the studied period is January–October 2019, and Level 2A and 2SP have been automatically downloaded from S2 and L8, respectively. In both case studies, the scenes are projected at EPSG 25830 (ETRS89 UTM zone 30 N).
The interoperability between S2 and L8 has been proven [13], concluding that the satellite platforms can be used jointly to collect data with higher temporal, spatial and spectral resolutions, increasing opportunities for more frequent cloud-free EO [28]. However, this means working with different spatial and temporal resolutions (Table 1), among other differential factors of image acquisition and processing. Furthermore, the overlaps between images make the initial input dataset extremely large, comprising up to 4908 bands/year in certain areas (Figure 3).
Another critical issue caused by the aspects highlighted above is the misalignment of pixels between the same spectral bands, both between different scenes of the same satellite mission and between different missions. This problem directly affects resampling processes prior to processing satellite data, e.g., for the calculation of biophysical indices. The proposed solution, based on the design of an LNG, eliminates these problems, thereby allowing for the optimal combined use of L8 and S2 data.

2.3. Design of the LNG

2.3.1. Global Web Mercator Tiling Schema

The proposed solution is based on the global Web Mercator Tiling Schema, which is based on the quadtree structure. Quadtrees are a tree data structure used to divide a two-dimensional space by recursively subdividing it into four quadrants or regions [43].
On the Web Mercator tiling schema, each tile (square) is given in (x,y) coordinates, ranging from (0,0) in the upper left to (2LOD-1, 2LOD-1) in the lower right. Figure 4a displays this coordinate system at LOD 3: tile coordinates ranging from (0,0) to (7,7). Figure 4b shows how tile 2 (LOD 1) is the parent of tiles 20 through 23 (LOD 2), and tile 13 (LOD 2) is the parent of tiles 130 through 133 (LOD 3).
The tiles do not overlap and have perfectly aligned borders at all LODs, so the pixels are perfectly aligned at all pyramid levels. The tiles inside each level are always 256 × 256 pixels. This size is chosen to optimize the visualization speed for WMTS services.
The tile coordinates can be combined into strings, called quadtree keys or Quadkeys. To do this, the tile coordinates (Tile_X and Tile_Y) are converted to binary based on the LOD (the equations and examples can be found in [44]). Quadkeys constitute a geographic identifier reference system. A unique identifier is assigned to each tile in the multilevel set of tiles for the entire world.
The number of digits in each Quadkey always equals the LOD of the corresponding tile. In addition, the Quadkey of any tile always starts with the Quadkey of its parent tile (the containing tile at the previous LOD) (Figure 4).
This solution entails the following drawbacks: (i) the CRS is not optimal for the ROI (cases study: the Duero river basin and the groundwater Mancha Oriental, Spain); (ii) the relationship between consecutive LODs is 2 × 2, which does not guarantee the interoperability of the MSR of L8 and S2, of 30 m and 10 m, respectively; and (iii) the coordinates of the pixels are not integers, with the subsequent inefficiencies in the processing that entails.

2.3.2. The Proposed Tiling Schema

The proposed solution improves the Web Mercator Tiling Schema. Firstly, the geographic scope is restricted to an ROI, so the most suitable CRS is selected. Secondly, the relationship between consecutive LODs is 3 × 3 (Figure 5), and all pixels have perfectly aligned borders at all levels. In this way, the pixel size in two consecutive LODs matches with the MSR of the sensors considered (each 30 × 30 m pixel of L8 contains 9 10 × 10 m pixels of S2). Thirdly, the coordinates of the pixels are set as integer numbers.
A tool has been developed (see Supplementary Materials at the end of the manuscript) to automatize the definition of the LNG based on the following input parameters:
  • CRS EPSG Code: 25830, projected CRS: UTM zone 30 North. Geographic base CRS EPSG Code: 4258 (ETRS89).
  • Recursive ratio factor in LODs: 3
  • Ground Sampling Distance (GSD) for the maximum LOD: 10 m
  • Tile dimensions: 256 × 256 (rows × columns)
  • ROI definition: This initial ROI covers the entire Iberian Peninsula, the Balearic Islands and the autonomous cities of Ceuta and Melilla, so that the defined LNG can be used for any project in Spain, except for the Canary Islands. The parameters for the ROI definition are as follows: NW longitude −10 DEG, NW latitude 44 DEG. Projected width: 1500 km. Maximum raster size: 183 km (L8). Then, a ROI is defined specifically for this project, which is the Spanish part of the Duero river basin and the groundwater Mancha Oriental.

2.3.3. Definition of the Tiling Schema: The Tuplekeys

The term Quadkey, used when the relationship between subsequent LODs is 2 × 2, is generalized to the term Tuplekey, where the relationship becomes 3 × 3. This relationship could be changed by convenience to any integer number depending on the multisource EO data used. The process of defining the tiling schema, based on Tuplekeys, is as follows:
  • Obtaining the NW point in the projected CRS.
  • Translation of the NW point: the NW point is translated in the projected CRS. The maximum size of the raster is subtracted from the X coordinate and added to the Y coordinate. In this way, the bounding box of a maximum size is fully integrated. Subsequently, the NW point is moved in the projected CRS to get its coordinates as integers and multiples of the GSD for the maximum LOD (in this case 10 m as the MSR of S2).
  • Determination of the ROI: it is obtained as the sum of the initial area and the maximum size of the raster, resulting in this case 1683 km.
  • Determination of the Region of Grid (ROG): it must be equal to or greater than the ROI and correspond to a certain LOD. Computed LOD is 6, corresponding to the MSR of S2, 10 m GSD, and 256 × 256 pixels. The geometry of the ROG and ROI is stored in a report file of results.
  • Assessment of the suitability of the chosen projected CRS: For the four corners of the ROG and ROI, the linear deformation of the projected CRS is obtained. The corresponding GSD on the ellipsoid is calculated for the GSD of the LOD of MSR. For any case study in Spain, the chosen projected CRS is suitable since the maximum difference is around 10 cm (1%) within the ROG, and less than 1% within the ROI.

2.3.4. Selection of the Storage LOD

Once the LNG has been defined, the MSR of the satellite data used, corresponding to S2 (10 m), is reached in LOD 6 whereas the MSR of L8 (30 m) is reached in LOD 5. The next question to address is the choice of the optimal size of the files transformed to this tiling schema. This choice must be justified based on the requirements of each project and the processing requirements of the data.
The adopted solution in the Web Mercator Tiling Schema is optimal from a publication point of view (256 × 256). However, it is a very small size that would lead to the existence of a large number of files. Therefore, the following processes would involve such opening and closing operations among files.
LOD 4 is defined as the common storage LOD for all the files of both satellite missions (S2 and L8) and for all the files resulting from the subsequent processes. The Duero river basin is covered by 192 Tuplekeys and the groundwater Mancha Oriental is covered by 26 Tuplekeys in LOD 4 (Figure 6). In addition, LOD 4 has been chosen so that:
  • The files that reach LOD 6, corresponding to the MSR of S2, will have dimensions of 256 × 256.
  • The files that reach LOD 5, corresponding to the MSR of L8, will have dimensions of 768 × 768, (768 = 256 × 3). The size of these files on disk without compression will be of the order of 2.25 Mb for floating type (32 bits), 1.12 Mb for unsigned integer (16 bits) and 0.6 Mb for byte type.
  • The files that reach LOD 4 will have dimensions of 2304 × 2304, (2304 = 256 × 3 × 3). The size of these files on disk without compression will be of the order of 20 Mb for floating type (32 bits), 10 Mb for unsigned integer (16 bits) and 5 Mb for byte type.

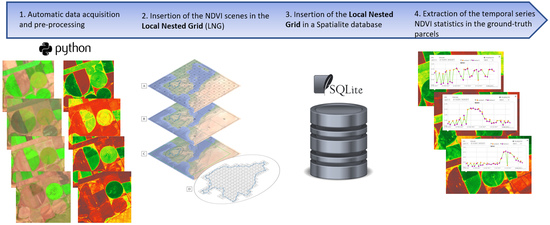
2.4. Processing Methodology

To make easier the subsequent processing operations, the developed tool meets the following requirements (Figure 7):
  • Automatic downloading of all the EO products and pre-processing of the raw bands, obtaining directly the NDVI values.
  • Operating only in one zone, the one corresponding to most of the study area (zone 30), which corresponds to the EPSG 25830 projection.
  • Initial conversion of the pixel corners’ coordinates into integer numbers at all LODs up to the MSR of the satellite missions used.
  • Perfect alignment of the pixels at the same spatial resolution and at different LODs up to the MSR of the satellite missions used, so that a pixel of L8 (30 × 30 m) includes exactly 9 pixels of S2 (10 × 10 m), as a 3 × 3 matrix.
  • Image resampling based on a bilinear interpolation method, used only for the computation of NDVI values in each satellite mission. During this resampling method, the radiometric resolution can be fixed to the original one or reduced to 8 bits for other types of products, such as combinations of images for photointerpretation.
  • Finally, a conversion to Cloud Optimized GeoTIFF (COG) format is applied. COG is a regular GeoTIFF file, aimed at being hosted on a HTTP file server, with an internal organization that enables more efficient workflows on the cloud.
After this operation, for any band, the corners of all files and pixels will be integer coordinates, making easier any operation that integrates raster and vector layers. Finally, regarding temporal resolution, each Tuplekey storage includes the NDVI file labelled by mission and date.

2.4.1. Automatic Data Acquisition and Pre-Processing

First, to increase the efficiency of the process, a Python script was developed based on Application Programming Interfaces (APIs) using WEB RESFULL services and the management and raster operation functionality through the GDAL library. The script automatically downloads and performs a first processing of the L8 L1T and S2 L1C products that cover the study area as they become available, directly obtaining the images with NDVI values [8].
NDVI is used to perform the crop classification so as to allow the standardization of the EO data from both satellite missions. Many works have used this index since its development in 1973 [32] for monitoring vegetation [29], providing high accuracies in crop classifications [7,8]. Crop types differ on the temporal signature of NDVI.
The main goal of the developed tool is to ease the processing of a large amount of multitemporal EO data in the study area. In this way, the processing is carried out in the most efficient way possible, optimizing analysis times without compromising the accuracy of the result.
The result of this process is stored in GeoTiFF format in the original CRS of the scene of each satellite mission, which can be EPSG 32629 or EPSG 32630, using floating type (32 bits) as the data type and assigning the value 9999 to those values without data (e.g., the wedge areas). A record of the downloaded products and those derived from the processing is kept in a PostGIS database.

2.4.2. Insertion of the NDVI Scenes in the LNG

The tool developed is based on the functionalities of the GDAL library. It automatically processes geomatic products in raster format and generates an LNG structure. It is guided through a project file in XML format in which the input data, processes to be carried out and necessary parameters are established. This file contains the information of the processing and the processed files.
To transform the NDVI raster files to the LNG structure, the following steps are performed:
  • The type of product and the date are retrieved from the file name, checking its validity.
  • The CRS of the LNG is reprojected.
  • The storage LOD and the MSR LOD are established based on the GSD.
  • The relation of tiles is obtained based on the storage LOD and the bounding box of the file.
  • For each tile, using GDAL tools, the resulting file is created by extracting the plot corresponding to its boundary and using the parameters defined in the project file: data type, resampling method, internal tiling, and compression algorithm. In particular, through the gdal_translate command the image values are rescaled, so that the maximum value of NDVI is 1.0. Furthermore, with the a_scale and a_offset parameters the LNG software converts the digital levels on the fly, so that even if a value is stored as an integer (8 bits), the value shown by the LNG software will be the original one. Finally, the files are converted to COG format and compressed.
  • If the pixels within the resulting file have a null value, the file is deleted. This happens in the wedge areas, especially in L8-derived NDVI products.
  • Finally, using gdaladdo, pyramid levels are added with the number of steps equal to that between the storage LOD and the MSR LOD. For this case, one for the L8 NDVI products and two for the S2 NDVI products.

2.4.3. Inserting the LNG Structure into a SpatiaLite Database

To allow queries in an optimized way, including spatial criteria, a database in SpatiaLite format is queried from C++ library. SpatiaLite format is selected since: (i) it is an embedded database; (ii) it does not require a database server; (iii) it includes a spatial query language with all the necessary functionality; (iv) the volume of information to handle is very limited; and (v) it is a format contemplated within the GDAL library. The latter allows its use in software that includes this library in its architecture, such as QGIS, the software used in this project. The structure of this database is saved as an ASCII file. This file is used by the program to create the database for each project. The information from the database is inserted in two processes:
  • Insertion of the information of the L8 and S2 NDVI products from the XML file generated in the previous step.
  • Region of Ground-Truth Plot Files (ROGTPF) in shapefile format. The fields that include the information to be inserted for each plot must be indicated: unique identifier and crop code.
The usability of this database is, for example, the query to obtain the tiles that spatially intersect with the geometry of a ground-truth plot. This query is performed with the QSpatiaLite plugin in QGIS.

2.4.4. Time Series Extraction of NDVI Statistics on Ground-Truth Plots

The objective of this step is to obtain the time series of NDVI statistics by plot and by satellite mission, L8 and S2, in a format that can be used by subsequent processes—in this case, by the classification model developed in Matlab [8]. For the time interval (1 March–31 October 2017), a different file is obtained for each satellite mission. For each plot of ground-truth the following features are defined: its id, its centroid (to be used in the classification algorithm as a proximity criterion), the crop code, and the area (to be used as a weighting criterion). In addition, for each date, the mean value of NDVI and its standard deviation are included. These values are obtained for all the pixels inside the plot. NaN is used to indicate that there is no data for a date.
Optimizing this process justifies the usefulness of the LNG design. The NDVI statistics extraction algorithm takes advantage of the fact that the information is structured in regions of the same dimensions (each tile of the storage LOD) and that in each tile the volume of information is controlled according to the time interval. In this way, the maximum size that an L8 and S2 NDVI file occupies, without wedge areas, is less than 3.2 MB and 32 MB, respectively.
The optimization of this step is achieved based on the following steps:
  • The relationship of all ROGTPFs s is obtained, together with all the necessary data.
  • Two containers are defined: one for ROGTPFs and one for Tiles.
  • In the ROGTPFs container, the list of tiles that contains is inserted for each ROGTPF.
  • In the tile container, the list of ROGTPFs that contains, totally or partially, is stored for each tile. These steps involve simple spatial operations.
  • For each tile, each NDVI file is sequentially opened.
  • ROGTPFs affected by this tile are recovered.
  • For each ROGTPF, the interior pixels are determined by a spatial operation.
  • The date and mission of the NDVI file are extracted and stored in a container for each ROGTPF, which will be updated with the values of other tiles. These values constitute the sample on which the statistics will be performed.
  • From the ROGTPF container that includes the list of tiles, the tile that has just been processed is removed.
  • If there is no tile left to process, the extraction of samples of NDVI values by date and mission is completed, and the statistics are obtained and stored: mean and standard deviation.

3. Results

3.1. LNG Definition Tool

The tool developed automates the definition of the LNG based on the parameters mentioned in Section 2.3.2., namely CRS, EPSG Code, recursive ratio factor in LODs, GSD for the maximum LOD, tile dimensions (rows and columns) and the local ROI definition (Figure 8a). It also allows automatically generating shapefiles of the different LODs. Store an LOD in each shapefile and create an attribute table in which the coordinates of each tile and its Tuplekey appear.
The tool also allows: (i) obtaining the Tuplekey from the x and y coordinates of the tile converted to binary based on its LOD, and (ii) obtaining the x and y coordinates of the tile from the Tuplekey (Figure 8b).

3.2. Insertion of the NDVI Scenes in the LNG

Figure 9 illustrates the result for a process of storing a LOD tile with an NDVI scene from L8 and S2 (Table 2). The corner coordinates are integers, the GSD is 30 and 10 m, respectively, and one pixel from L8 contains exactly 9 pixels from S2.
Figure 9 aims at clearly illustrating the achievement of the two main objectives pursued with the development of the LNG for the spatial distribution of the NDVI values derived from the two space missions: (i) allowing an exact coincidence in the upscaling or downscaling processes between pixels of both S2 and L8 missions; (ii) allowing the division of the space into tiles that can be processed through algorithms with parallelization strategies.

3.3. Extraction of Time Series of NDVI Statistics in Ground-Truth Plots for Calibration of the Crop Classification Model

Figure 10 represents the result of the estimation of an average value of NDVI for L8 and S2, by plot and date. The optimized estimation in terms of processing time has been achieved thanks to the spatiotemporal structuring of the information reached with the LNG. For each date with satellite data, two values appear: mean and standard deviation, calculated with all the pixels inside the geometry of each plot. NaN is set on those dates with no satellite data as to ease the data reading in the machine learning algorithm developed in Matlab.

3.4. Analysis of LNG Approach

Finally, our LNG approach was analysed based on data storage and processing requirements. Regarding data storage, there is not too much difference between applying LNG or not (Table 3).
Table 3 illustrates the storage optimization achieved by using LNG for storing the NDVI raster products in two different case studies, with an improved solution in the second one. In the first case study (the Duero river basin), by storing NDVI raster files with the same type of data, float32, applying the LNG the reduction is greater than 2% for S2 and 7% for L8, being logical as the area without information in L8 is greater. In the second case study (the Jucar river basin), the LNG approach entails a much greater reduction, 82% for S2 and 83% for L8, since the data is stored in byte type instead of float32, using the ability of the GeoTiff format to store and apply (on the fly) a scale and offset parameter to convert the stored digital level into the real value, with a strategy that guarantees a precision of 0.5% of NDVI.
The main advantage of the proposed solution is the optimization of the processing algorithms. In particular, the extraction of time series for NVDI statistics is performed within the Tuplekeys, instead of opening the original NDVI files. Furthermore, the algorithm is easily parallelizable. First, the algorithm determines the list of all NDVI files to read and the affected parcels for each one. Next, a multithreaded algorithm is launched that uses one processor per NDVI file. It should be noted that it obtains improved storage with the LNG-COG based on the gdal_translate command and the compression to COG format, achieving an accuracy in NDVI of 0.5%, higher than the average accuracy value achieved relative to average surface reflectance reference, which is below or near to 5% [45].
Finally, a Tuplekey Viewer based on Geoserver was developed for the case study of Mancha Oriental (see Supplementary Materials and Data Availability Statement at the end of the manuscript). One can view the LNG mesh, the Tuplekeys of L8 and S2, and check the NDVI values in points (Figure 11).

4. Discussion

The LNG approach has proved its usefulness as an ARD tool in the two case studies presented (the Duero river basin and the Jucar river basin) to create time series of NDVI for the monitoring and spatial comparison of the crops’ phenological stages using the Tuplekey viewer developed.
Comparing our LNG approach with the EODC technology, the LNG approach includes a structured definition of the geographic space that allows an optimization of the analysis processes, thereby contributing to the ARD purpose. Some authors of this work have taken part in the implementation of an ODC prototype at the National Geographic Institute of Spain, with the objective of analysing the utility for the combined use of S1 and S2 imagery [46]. Particularly, this work aims at carrying out a review of the state of the art about the problems in the generation of ARDs in Spain. Additionally, they developed a complement for QGIS that allows, among other functionalities, making available S1 and S2 images to final users and generating certain ARDs for some products. They implemented a DC pilot in areas of interest in Spain using ODC technology. Other authors [47] developed interesting materials based on the “Bringing Open Data Cube into Practice” workshop within the framework of the Swiss Data Cube (SDC) and the Armenian Data Cube for Sustainable Development (ADC4SD) projects. Both the documentation and the source code provided have been of special interest in the view for adopting and understanding the ODC technology. Despite the complete documentation cited, fully installing and configuring an implementation of the ODC core is complex currently due to, on the one hand, the numerous geospatial libraries and components of the ODC system and their corresponding dependencies of software versioning and, on the other hand, the inherent complexity of remote-sensing data, computing and storage resources that must be managed. Trying to minimize these difficulties, some authors [23] proposed the approach Data Cube on Demand (DCoD), which eases the generation and provision of a DC instance based on simple user requirements, thereby reducing the burden of software installation, configuration and data ingestion.
Finally, comparing our LNG approach and the gdalcubes [28,29], it was identified that the combination of gdalcubes and LNG may provide an optimal solution for the projects in which the research group has been working. The idea to further develop in future research works would consist of designing and implementing a tool, such as a QGIS plugin, that can define and structure the geographic space with LNG and perform the ARD processes with gdalcubes based on an iterative process on the Tuplekeys of the ROI. In this sense, LNG would complement gdalcubes by providing a space division strategy. This idea has already been put into practice in an agronomic application project, to be published shortly, combining multispectral images from S1, S2 and drones.
As for the tiling schema approach, some authors [17] have proposed the need of nested grids for aerial and satellite images, and digital elevation models. Our LNG approach is a local solution, applicable in the context of a national territory, whereas the approach proposed in [17] is global, thereby applicable to the entire Earth. The choice in the LNG of the UTM cartographic projection results in lower deformations in the pixels compared to the Web Secant Mercator projection of [17], especially for the high latitudes of Europe. In addition, in the definition of the LNG, another cartographic projection could be chosen, i.e., the Lambert Azimuthal Equal Area (LAEA) equivalent cartographic projection, used in Europe (ETRS-LAEA, EPSG: 3035) for a multitude of Copernicus products. Additionally, in [17], the entire size of the pixels would be fulfilled up to LOD17, whereas in LNG, up to the maximum proposed LOD is achieved, with a pixel size of 10 m, the main objective of the combination of L8 and S2 being to make it possible to preserve whole pixels at larger scales by integrating a solution.
The United Nations’ 2030 Agenda on Sustainable Development engages 17 Sustainable Development Goals (SDGs) and 169 targets, which have been translated into 232 indicators as a tool to monitor the progress towards the targets [48]. EO can help in this regard, easing the development and implementation of management strategies by the countries [49].
The increasing spatial, temporal and spectral resolutions of EO data offer an invaluable tool for getting timely and reliable data for better informing development policies and quantifying the SDG indicators. However, the issues regarding the acquisition, multisource data integration, processing, analysis and understanding of the data lead to the need for developing innovative and dedicated EO tools that ensure the operational applicability of the data by users of all levels [50].
The Copernicus family of Sentinels consists of different satellite platforms with subsequently different spatial, spectral, temporal and radiometric resolutions. Each Sentinel was developed for a specific goal of delivering EO information that serves the development of products within the Copernicus services, divided in 6 core thematic areas: land, marine, atmosphere, climate change, emergency management, and security. Copernicus was therefore created by the European Union as a program for EO and monitoring towards the achievement of the SDGs and subsequent targets. In this sense, the two satellite missions used in this paper, Landsat-8 from NASA USGS, and Sentinel-2 from ESA, were developed specifically for improving land monitoring. Therefore, any SDG oriented towards better land monitoring can benefit from the LNG approach [51,52].
As an example, the developed LNG can help in achieving SDGs 12, 13 and 15. SDG 12 aims at ensuring sustainable consumption and production patterns. The LNG has been applied in two of the most intensive agricultural areas in Spain: the Duero river basin and the Jucar river basin, which also suffer from spatiotemporal climatic variability. In this sense, developing and monitoring sustainable agricultural practices towards the achievement of the SDG 12 can benefit from our approach. SDG 13 aims at taking urgent action to combat climate change and its impacts. SDG 15 aims at protecting, restoring and promoting the sustainable use of terrestrial ecosystems, reversing land degradation and biodiversity loss. The monitoring and achievement of the latter SDGs requires robust EO methods that tackle multisource data integration (e.g., active/passive remote sensing, EO/in situ, optical/microwave data), thereby developing EO algorithms and workflows that coherently and in combination benefit from data from different sources, allowing for quantifying the SDG indicators related to natural ecosystems and their services, thereby supporting sustainable and environmental policies. Our approach allows for the coherent and efficient combined use of two of the most-used satellite platforms for monitoring the environment, climate change- and human-induced impacts, and can be scaled up to ease the efficient combined use of current and upcoming European and global satellite missions, such as the Copernicus Hyperspectral Imaging Mission for the Environment (CHIME) [53], towards a global sustainable development, thereby also supporting SDG 17 towards a global capacity development that benefits from partnering with other space agencies, companies and institutions.

5. Conclusions

This paper proposes an efficient solution for dealing with different spatial resolutions and spatial pixels’ misalignment when working in combination with L8 and S2 imagery. We showed that usual workflows for production, archiving, dissemination and use of raster geographic data pose big interoperability problems. The LNG approach presented in this paper allows the integration of information in a more efficient way, making easier its analysis and consequently contributing to cover the most recent advances in ARD developments and implementations for Sentinel data. We developed a method and a tool based on LNG for generating ARD for both optical S2 and L8 imagery. The LNG and the computer tool developed were designed to be applied in any region of the Earth. In fact, for the LNG proposed, any projected CRS included in the EPSG database could be used, it being advisable to use the CRS corresponding to the WGS84/UTM zone of the project’s geographic area. In particular, the Duero river basin encloses several UTM zones, so that in this case we could apply as many LNGs as WGS84/UTM zones exist in the area, being duplicated in the limits of the UTM zones. The LNG developed allows for the interoperable access and processing of L8 and S2 imagery. The approach spatially structures L8 and S2 data optimally from the georeferencing and processing points of view. The approach was tested in the Duero river basin, the largest river basin in Spain (78,859 km2), through a multitemporal crop classification. Thanks to the LNG, the whole basin was analysed in 16 h, obtaining an overall accuracy of 92%. Therefore, the LNG could guarantee higher accuracy, efficiency and reliability on results derived from multisource remote sensing data.
Moreover, the LNG approach was tested in the groundwater of Mancha Oriental (7279 km2), which belongs to Jucar river basin. In addition, in this case a new improvement was applied regarding the storage based on the gdal_translate command and the compression to COG format, achieving an accuracy in NDVI of 0.5%. The development of an LNG entails three important advantages. First, the automatic downloading of L8 and S2 imagery, including a pre-processing of the raw bands, thereby obtaining directly the NDVI values. Second, the management of the most relevant remote sensing data avoiding resampling processes and issues regarding pixel misalignment. Third, an efficient spatial resolution schema based on Tuplekeys that allows dealing with large areas and improves the overall accuracy in the EO products obtained.
The design of LNG proves its importance currently as the growth of the European EO downstream sector depends on the development of value-added EO products according to evolving users’ needs and requirements [12]. Considering the evolution of the current use of Copernicus data and products, and the European Commission’s six high-priority candidate missions to address EU’s policies and gaps in Copernicus users’ needs, the existing operational services, based on multispectral data, could be further expanded [11,37]—specifically, considering the six upcoming missions such as CHIME (Copernicus Hyperspectral Imaging Mission for Environment) [53] and ROSE-L (L-band Synthetic Aperture Radar), and therefore the future access to data from new sensors with the consequently different spatial, spectral, temporal, and radiometric resolutions. The LNG will allow for the interoperability and efficient structuring of data from different sensors.
As for future developments, a plugin is being developed currently for QGIS to integrate the LNG and gdalcubes (R version). The goal is taking advantage of the spatial structuring of the LNG and the versatility of gdalcubes to operate on data cubes with information not only from satellite missions but also from georeferenced products from sensors embedded in drones, visible cameras, thermal cameras and multispectral or hyperspectral sensors [24,25,26]. In addition, in this solution, the results will be generated in the Cloud Optimized GeoTIFF (COG) format [54] and, whenever possible, an offset and scale will be used for the results of the real data type to store digital levels as integers of the appropriate type and thus reduce the size of the files. The possibility to integrate different spatial resolutions coming from other sensors will pass through densifying the LNG based on a tree structure.

Supplementary Materials

The Tuplekey (Nested grid for the optimal combined use of Landsat and Sentinel imagery) is available online at http://tidop.usal.es/software (accessed on 8 March 2021). The Tuplekey Viewer is available online at http://5.135.36.60 (accessed on 8 March 2021).

Author Contributions

Conceptualization, D.H.-L. and M.A.M.; methodology, D.H.-L.; software, D.H.-L.; validation, D.H.-L. and L.P.; formal analysis, D.H.-L., L.P. and A.C.; investigation, D.H.-L. and L.P.; resources, D.H.-L. and M.A.M.; data curation, D.H.-L., M.A.M. and L.P.; writing—original draft preparation, L.P., D.H.-L. and D.G.-A.; all the authors contributed to writing—review and editing; visualization, D.H.-L., D.G.-A. and M.A.M.; supervision, D.H.-L., D.G.-A. and M.A.M.; project administration, D.H.-L., D.G.-A. and M.A.M.; funding acquisition, D.G.-A. All authors have read and agreed to the published version of the manuscript.

Funding

This research received no external funding.

Institutional Review Board Statement

Not applicable.

Informed Consent Statement

Not applicable.

Data Availability Statement

The Tuplekey Viewer presented in this study is openly available in http://5.135.36.60 (accessed on 8 March 2021). User: paper_lng@correo.com. Password: vitilogy#123.

Conflicts of Interest

The authors declare no conflict of interest.

References

  1. European Commission. Europe in a Changing World-Inclusive, Innovative and Reflective Societies; Decision C (2020)6320 of 17 September 2020. Work Programme 2018–2020 13; European Commission: Luxembourg, 2020. [Google Scholar]
  2. United Nations. Treaty Collection. Chapter XXVII—Environment: 7.d Paris Agreement; United Nations: Paris, France, 2016. [Google Scholar]
  3. Roy, D.P.; Wulder, M.A.; Loveland, T.R.; Woodcock, C.E.; Allen, R.G.; Anderson, M.C.; Helder, D.; Irons, J.R.; Johnson, D.M.; Kennedy, R.; et al. Landsat-8: Science and product vision for terrestrial global change research. Remote Sens. Environ. 2014, 145, 154–172. [Google Scholar] [CrossRef] [Green Version]
  4. van der Werff, H.; van der Meer, F. Sentinel-2A MSI and Landsat 8 OLI Provide Data Continuity for Geological Remote Sensing. Remote Sens. 2016, 8, 883. [Google Scholar] [CrossRef] [Green Version]
  5. Piedelobo, L.; Ortega-Terol, D.; del Pozo, S.; Hernández-López, D.; Ballesteros, R.; Moreno, M.; Molina, J.-L.; González-Aguilera, D. HidroMap: A New Tool for Irrigation Monitoring and Management Using Free Satellite Imagery. Isprs Int. J. Geo-Inf. 2018, 7, 220. [Google Scholar] [CrossRef] [Green Version]
  6. Piedelobo, L.; Taramelli, A.; Schiavon, E.; Valentini, E.; Molina, J.-L.; Nguyen Xuan, A.; González-Aguilera, D. Assessment of Green Infrastructure in Riparian Zones Using Copernicus Programme. Remote Sens. 2019, 11, 2967. [Google Scholar] [CrossRef] [Green Version]
  7. Inglada, J.; Arias, M.; Tardy, B.; Hagolle, O.; Valero, S.; Morin, D.; Dedieu, G.; Sepulcre, G.; Bontemps, S.; Defourny, P.; et al. Assessment of an Operational System for Crop Type Map Production Using High Temporal and Spatial Resolution Satellite Optical Imagery. Remote Sens. 2015, 7, 12356–12379. [Google Scholar] [CrossRef] [Green Version]
  8. Piedelobo, L.; Hernández-López, D.; Ballesteros, R.; Chakhar, A.; Del Pozo, S.; González-Aguilera, D.; Moreno, M.A. Scalable pixel-based crop classification combining Sentinel-2 and Landsat-8 data time series: Case study of the Duero river basin. Agric. Syst. 2019, 171, 36–50. [Google Scholar] [CrossRef]
  9. Poussin, C.; Guigoz, Y.; Palazzi, E.; Terzago, S.; Chatenoux, B.; Giuliani, G. Snow Cover Evolution in the Gran Paradiso National Park, Italian Alps, Using the Earth Observation Data Cube. Data 2019, 4, 138. [Google Scholar] [CrossRef] [Green Version]
  10. Nazarova, T.; Martin, P.; Giuliani, G. Monitoring Vegetation Change in the Presence of High Cloud Cover with Sentinel-2 in a Lowland Tropical Forest Region in Brazil. Remote Sens. 2020, 12, 1829. [Google Scholar] [CrossRef]
  11. European Commission. Copernicus Market Report—February 2019. Prepared by PwC for the European Commission as Part of the Study ‘Update of the Copernicus Market Report‘; European Commission: Luxembourg, 2019. [Google Scholar]
  12. European Commission. Commission Staff Working Document. Expression of User Needs for the Copernicus Programme. SWD(2019) 394 Final; European Commission: Luxembourg, 2019. [Google Scholar]
  13. Mandanici, E.; Bitelli, G. Preliminary Comparison of Sentinel-2 and Landsat 8 Imagery for a Combined Use. Remote Sens. 2016, 8, 1014. [Google Scholar] [CrossRef] [Green Version]
  14. Storey, J.; Roy, D.P.; Masek, J.; Gascon, F.; Dwyer, J.; Choate, M. A note on the temporary misregistration of Landsat-8 Operational Land Imager (OLI) and Sentinel-2 Multi Spectral Instrument (MSI) imagery. Remote Sens. Environ. 2016, 186, 121–122. [Google Scholar] [CrossRef] [Green Version]
  15. Gascon, F.; Bouzinac, C.; Thépaut, O.; Jung, M.; Francesconi, B.; Louis, J.; Lonjou, V.; Lafrance, B.; Massera, S.; Gaudel-Vacaresse, A.; et al. Copernicus Sentinel-2A Calibration and Products Validation Status. Remote Sens. 2017, 9, 584. [Google Scholar] [CrossRef] [Green Version]
  16. Stumpf, A.; Michéa, D.; Malet, J.-P. Improved Co-Registration of Sentinel-2 and Landsat-8 Imagery for Earth Surface Motion Measurements. Remote Sens. 2018, 10, 160. [Google Scholar] [CrossRef] [Green Version]
  17. Purss, M.B.J.; Lewis, A.; Oliver, S.A.; Sixsmith, J.; Evans, B.; Edberg, R.; Frankish, G.; Hurst, L.; Chan, T. Unlocking the Australian Landsat Archive—From dark data to High Performance Data infrastructures. GeoResJ 2015, 6, 135–140. [Google Scholar] [CrossRef] [Green Version]
  18. Giuliani, G.; Chatenoux, B.; Bono, A.D.; Rodila, D.; Richard, J.-P.; Allenbach, K.; Dao, H.; Peduzzi, P. Building an Earth Observations Data Cube: Lessons learned from the Swiss Data Cube (SDC) on generating Analysis Ready Data (ARD). Big Earth Data. 2017, 1, 100–117. [Google Scholar] [CrossRef] [Green Version]
  19. Giuliani, G.; Masó, J.; Mazzetti, P.; Nativi, S.; Zabala, A. Paving the Way to Increased Interoperability of Earth Observations Data Cubes. Data 2019, 4, 113. [Google Scholar] [CrossRef] [Green Version]
  20. Navacchi, C.; Bauer-Marschallinger, B.; Wagner, W. Flood Monitoring using ACube—An Austrian Data Cube Solution. EGU Gen. Assem. 2020, 22, 21575. [Google Scholar]
  21. Picoli, M.; Simoes, R.; Chaves, M.; Santos, L.; Ipia, A.; Soares, A.; Sanches, I.; Ferreira, K.; Queiroz, G. CBERS DATA CUBE: A Powerfull Technology for Mapping and Monitoring Brazilian Biomes; Brazil’s National Institute for Space Research (INPE): São José dos Campos, Brazil, 2020; p. 539. [Google Scholar] [CrossRef]
  22. Maso, J.; Zabala, A.; Serral, I.; Pons, X. A Portal Offering Standard Visualization and Analysis on top of an Open Data Cube for Sub-National Regions: The Catalan Data Cube Example. Data 2019, 4, 96. [Google Scholar] [CrossRef] [Green Version]
  23. Giuliani, G.; Camara, G.; Killough, B.; Minchin, S. Earth Observation Data Cubes. In Book of the Special Issue Earth Observation Data Cubes, Data; MDPI: Basel, Switzerland, 2020; p. 302. [Google Scholar] [CrossRef] [Green Version]
  24. Earth Observation Data Cubes from GDAL Image Collection—Gdalcubes 0.2.0 Documentation. Available online: https://gdalcubes.github.io/docs/index.html (accessed on 17 December 2020).
  25. GitHub. Appelmar/Gdalcubes: Earth Observation Data Cubes from GDAL Image Collections. Available online: https://github.com/appelmar/gdalcubes (accessed on 17 December 2020).
  26. Appel, M.; Pebesma, E. On-Demand Processing of Data Cubes from Satellite Image Collections with the gdalcubes Library. Data 2019, 4, 92. [Google Scholar] [CrossRef] [Green Version]
  27. Villa, G.; Mas, S.; Fernández-Villarino, X.; Martínez-Luceño, J.; Ojeda, J.C.; Pérez-Martín, B.; Tejeiro, J.A.; García-González, C.; López-Romero, E.; Soteres, C. The need of nested grids for aerial and satellite images and digital elevation models. Isprs Int. Arch. Photogramm. Remote Sens. Spat. Inf. Sci. 2016, XLI-B2, 131–138. [Google Scholar] [CrossRef] [Green Version]
  28. Stefanakis, E. Web Mercator and raster tile maps: Two cornerstones of online map service providers. Geomatica 2017, 71, 100–109. [Google Scholar] [CrossRef]
  29. Battersby, S.E.; Finn, M.P.; Usery, E.L.; Yamamoto, K.H. Implications of Web Mercator and Its Use in Online Mapping. Cart. Int. J. Geogr. Inf. Geovis. 2014, 49, 85–101. [Google Scholar] [CrossRef]
  30. Li, J.; Roy, D.P. A Global Analysis of Sentinel-2A, Sentinel-2B and Landsat-8 Data Revisit Intervals and Implications for Terrestrial Monitoring. Remote Sens. 2017, 9, 902. [Google Scholar] [CrossRef] [Green Version]
  31. Xue, J.; Su, B. Significant remote sensing vegetation indices: A review of developments and applications. J. Sensors 2017, 2017. [Google Scholar] [CrossRef] [Green Version]
  32. Rouse, J.W.J.; Haas, R.H.; Schell, J.A.; Deering, D.W. Monitoring Vegetation Systems in the Great Plains with Erts. NASSP 1974, 351, 309. [Google Scholar]
  33. Yan, L.; Roy, D.; Zhang, H.; Li, J.; Huang, H. An Automated Approach for Sub-Pixel Registration of Landsat-8 Operational Land Imager (OLI) and Sentinel-2 Multi Spectral Instrument (MSI) Imagery. Remote Sens. 2016, 8, 520. [Google Scholar] [CrossRef] [Green Version]
  34. Dey, V.; Zhang, Y.; Zhong, M. A Review on Image Segmentation Techniques with Remote Sensing Perspective. In Proceedings of the ISPRS TC VII Symposium—100 Years ISPRS, Vienna, Austria, 5–7 July 2010; Wagner, W., Székely, B., Eds.; Institute of Photogrammetry and Remote Sensing, Vienna University of Technology: Vienna, Austria, 2010; Volume XXXVIII, Part 7A; p. 12. [Google Scholar]
  35. Stoimenov, L.; Djordjević-Kajan, S. An architecture for interoperable GIS use in a local community environment. Comput. Geosci. 2005, 31, 211–220. [Google Scholar] [CrossRef]
  36. van Oudenhoven, A.P.E.; Schröter, M.; Drakou, E.G.; Geijzendorffer, I.R.; Jacobs, S.; van Bodegom, P.M.; Chazee, L.; Czúcz, B.; Grunewald, K.; Lillebø, A.I.; et al. Key criteria for developing ecosystem service indicators to inform decision making. Ecol. Indic. 2018, 95, 417–426. [Google Scholar] [CrossRef]
  37. European Parliament. Regulation (EU) No 377/2014 of the European Parliament and of the Council of 3 April 2014 Establishing the Copernicus Programme and Repealing Regulation (EU) No 911/2010 Text with EEA Relevance; European Parliament: Brussels, Belgium, 2014; pp. 44–66. [Google Scholar]
  38. Haines, A.; Scheelbeek, P. European Green Deal: A major opportunity for health improvement. Lancet 2020, 395, 1327–1329. [Google Scholar] [CrossRef]
  39. Maes, J.; Teller, A.; Erhard, M.; Grizzetti, B.; Barredo, J.I.; Paracchini, M.L.; Condé, S.; Somma, F.; Orgiazzi, A.; Jones, A.; et al. Mapping and Assessment of Ecosystems and Their Services: An Analytical Framework for Mapping and Assessment of Ecosystem Condition in EU. Anal. Framew. Ecosyst. Assess. Action 2013, 5, 1–58. [Google Scholar]
  40. Herrero Lizano, J. Informe de Seguimiento del Plan Hidrológico de la Parte Española de la Demarcación Hidrográfica del Duero; Oficina de Planificación Hidrológica de la Confederación Hidrográfica del Duero: Valladolid, Spain, 2017. [Google Scholar]
  41. Ceballos, A.; Martínez-Fernández, J.; Luengo-Ugidos, M.Á. Analysis of rainfall trends and dry periods on a pluviometric gradient representative of Mediterranean climate in the Duero Basin, Spain. J. Arid Environ. 2004, 58, 215–233. [Google Scholar] [CrossRef]
  42. Fernández Pereira, J.; Rodríguez Arroyo, J.; del Barrio, V.; Ramos, M.; Castrillón, M.; Vaquerizo, E.; Trujillo, H.; Hernández, V.; Gómez, S.; Seisdedos, P.; et al. Plan Hidrológico de la Parte Española de la Demarcación Hidrográfica del Duero 2015–2021; Oficina de Planificación Hidrológica de la Confederación Hidrográfica del Duero: Valladolid, Spain, 2014. [Google Scholar]
  43. Samet, H. The Quadtree and Related Hierarchical Data Structures. Acm Comput. Surv. 1984, 16, 187–260. [Google Scholar] [CrossRef] [Green Version]
  44. Bing Maps Tile System. Bing Maps | Microsoft Docs. Available online: https://docs.microsoft.com/en-us/bingmaps/articles/bing-maps-tile-system#map-projection (accessed on 17 December 2020).
  45. MPC. Level 2A Data Quality Report S2 MPC; MPC: Toulouse, France, 2020. [Google Scholar]
  46. Ortega-Terol, D.; Perez-Martin, B. Hacia la implantación de una infraestructura de datos de imágenes de satélite en el Instituto Geográfico Nacional con Open Data Cube y QGIS. XI Jornadas Ibéricas de Infraestruturas de Datos Espaciales, JIIDE 2020, 28–30. [Google Scholar]
  47. Chatenoux, B.; Richard, J.-P.; Guigoz, Y.; Poussin, C.; Giuliani, G. Bringing Open Data Cube into Practice. Workshop Material; GRID-Geneva & University of Geneva: Geneva, Switzerland, 2019; 65p. [Google Scholar] [CrossRef]
  48. THE 17 GOALS. Sustainable Development. Available online: https://sdgs.un.org/goals (accessed on 13 April 2021).
  49. ESA. ESA and the Sustainable Development Goals. Available online: http://www.esa.int/Enabling_Support/Preparing_for_the_Future/Space_for_Earth/ESA_and_the_Sustainable_Development_Goals (accessed on 13 April 2021).
  50. Pérez Martín, B.; Serna Martínez, A.; Delgado Hernández, J.; Caballero García, M.; Villa Alcázar, G. El Programa Copernicus Para la Monitorización del Territorio y los Objetivos del Desarrollo Sostenible. Available online: https://www.ign.es/web/ign/portal/libros-digitales/programa-copernicus-monitorizacion-territorio (accessed on 13 April 2021).
  51. Kussul, N.; Lavreniuk, M.; Kolotii, A.; Skakun, S.; Rakoid, O.; Shumilo, L. A workflow for Sustainable Development Goals indicators assessment based on high-resolution satellite data. Int. J. Digit. Earth 2020, 13, 309–321. [Google Scholar] [CrossRef]
  52. Hakimdavar, R.; Hubbard, A.; Policelli, F.; Pickens, A.; Hansen, M.; Fatoyinbo, T.; Lagomasino, D.; Pahlevan, N.; Unninayar, S.; Kavvada, A.; et al. Monitoring Water-Related Ecosystems with Earth Observation Data in Support of Sustainable Development Goal (SDG) 6 Reporting. Remote Sens. 2020, 12, 1634. [Google Scholar] [CrossRef]
  53. Taramelli, A.; Valentini, E.; Piedelobo, L.; Marinelli, C.; Tornato, A.; Geraldini, S. CHIME—Hyperspectral Imaging Mission: Value-added offered by PRISMA. In AGU Fall Meeting Abstracts, Proceedings of the AGU Fall Meeting, Online Everywhere, 1–17 December 2020; American Geophysical Union: Washington, DC, USA, 2020.PRISMA. In AGU Fall Meeting Abstracts, Proceedings of the AGU Fall Meeting, Online Everywhere, 1–17 December 2020; American Geophysical Union: Washington, DC, USA, 2020. [Google Scholar]
  54. Cloud Optimized GeoTIFF. Available online: https://www.cogeo.org/ (accessed on 17 December 2020).
Figure 1. Location of the Spanish region covered by the Duero river basin (adapted from [8]).
Remotesensing 13 01546 g001
Figure 2. Location of the groundwater Mancha Oriental in the Jucar river basin. Overlapping of the products paths of L8 and S2 that cover the study area.
Remotesensing 13 01546 g002
Figure 3. Large amount of data within the original input dataset due to the overlapping of the satellite missions’ paths.
Remotesensing 13 01546 g003
Figure 4. Global Web Mercator Tiling Schema on which the LNG design is based (adapted from [42]). (a) Coordinate system at LOD 3: tile coordinates ranging from (0,0) to (7,7). (b) Tile 2 of LOD 1 is divided in tiles 20 to 23 in LOD 2, and tile 13 in LOD 2 is divided in tiles 130 to 133 in LOD 3.
Remotesensing 13 01546 g004
Figure 5. The proposed Tiling Schema (3 × 3): The tile 3 in LOD 1 is the parent of 3 × 3 tiles 30 through 38 in LOD 2.
Remotesensing 13 01546 g005
Figure 6. ROG (grey), ROI (blue) and Tuplekeys that cover the study areas for the storage LOD selected, LOD 4: (up) the Duero river basin. (down) the groundwater Mancha Oriental.
Remotesensing 13 01546 g006
Figure 7. Flowchart of the processing methodology carried out by the designed LNG tool.
Remotesensing 13 01546 g007
Figure 8. Tool created for the automatic definition of an LNG (see Supplementary Materials at the end of the manuscript). (a) Parameters for the LNG definition. (b) Geographic positions, coordinates and Tuplekey conversions.
Remotesensing 13 01546 g008
Figure 9. Insertion of the NDVI scenes in the LNG in LOD4 assuring the pixels’ alignment between different sensors and at all LODs and containing 1 pixel of L8 exactly 9 pixels of S2: (a) L8. (b) S2.
Remotesensing 13 01546 g009
Figure 10. NDVI statistics for L8 and S2.
Remotesensing 13 01546 g010
Figure 11. Tuplekey viewer in the case study of Mancha Oriental, in the Jucar river basin: (A) LNG mesh. (B) Tuplekeys of L8 and S2. (C) NDVI values in points.
Remotesensing 13 01546 g011
Table 1. Characteristics of the scenes and bands used from Landsat 8 (L8) and Sentinel 2 (S2).
Satellite PlatformLandsat 8Sentinel 2
SensorOperational Land Imager (OLI)Multispectral Instrument (MSI)
Scenes Duero river basinPath/Row: 200/31, 201/30, 201/31, 201/32, 202/30, 202/31, 202/32, 203/30, 203/31, 203/32 and 204/31Granules: 29TPE, 29TPF, 29TPG, 29TQH, 30TTK, 30TTL, 30TTM, 30TUK, 30TUL, 30TUM, 30TUN, 30TVL, 30TVM, 30TVN, 30TWL, 30TWM; in orbits R37, R94 and R137
Scenes groundwater Mancha OrientalPath/Row: 199/33Granules: T30SWJ, T30SXJ; in orbits R51 and R94
Scenes size170 × 185 km100 × 100 km
Band set usedBand 4 (Red: 630–680 nm)
Band 5 (Near Infrared: 845–885 nm)
Band 4 (Red: 645–683 nm)
Band 8 (Near Infrared: 762–907 nm)
Spatial resolution of the band set used30 m10 m
Temporal resolution16 days10 days (5 with 2 satellites) 1
Radiometric resolution12 bits12 bits
1 S2 B was launched in 2017, during the development of the project in the Duero river basin.
Table 2. Characteristics of the NDVI scenes derived from L8 and S2 in Figure 9.
NDVI Imageab
Satellite platformLandsat 8Sentinel 2A
Date (yyyy/mm/dd)2017/08/202017/08/20
Scene202/31T30TUM in orbit R137
DimensionsX: 768, Y: 768, Bands: 1X: 2304, Y: 2304, Bands: 1
Extension (m)308,690, 4,617,960
331,730, 4,641,000
308,690, 4,617,960
331,730, 4,641,000
Pixel size (m)3010
Table 3. Data storage analysis in terms of size of files and number of files for both cases of study.
Duero River Basin
Satellite platformWith LNGWithout LNG
Sentinel 2511.4 GB; 19,221 files526.2 GB; 1063 files
Landsat 843.9 GB; 28,415 files47.5 GB; 209 files
Groundwater Mancha Oriental–Jucar river basin
Satellite platformWith LNGWithout LNG
Sentinel 29.4 GB; 567 files9.6 GB; 20 files
Landsat 81.9 GB; 811 files2.3 GB; 10 files
Groundwater Mancha Oriental–Jucar river basin
Satellite platformWith LNG-COGWithout LNG
Sentinel 21.7 GB; 567 files9.6 GB; 20 files
Landsat 8383 Mb; 811 files2.3 GB; 10 files
Publisher’s Note: MDPI stays neutral with regard to jurisdictional claims in published maps and institutional affiliations.

