Article

Global Aerosol Classification Based on Aerosol Robotic Network (AERONET) and Satellite Observation

1
Key Laboratory of Meteorological Disaster, Ministry of Education, Nanjing University of Information Science and Technology, Nanjing 210044, China
2
Joint International Research Laboratory of Climate and Environment Change, Nanjing University of Information Science and Technology, Nanjing 210044, China
3
Collaborative Innovation Center on Forecast and Evaluation of Meteorological Disasters, Nanjing University of Information Science and Technology, Nanjing 210044, China
4
State Key Laboratory of Severe Weather (LASW) and Key Laboratory of Atmospheric Chemistry (LAC), Chinese Academy of Meteorological Sciences, CMA, Beijing 100081, China
5
Southern Marine Science and Engineering Guangdong Laboratory (Zhuhai), Zhuhai 519082, China
*
Author to whom correspondence should be addressed.
Remote Sens. 2021, 13(6), 1114; https://doi.org/10.3390/rs13061114
Submission received: 31 January 2021 / Revised: 8 March 2021 / Accepted: 9 March 2021 / Published: 15 March 2021
(This article belongs to the Special Issue Artificial Intelligence in Remote Sensing of Atmospheric Environment)

Abstract

:
The particle linear depolarization ratio (PLDR) and single scatter albedo (SSA) in 1020 nm from the Aerosol Robotic Network (AERONET) level 2.0 dataset was utilized among 52 stations to identify dust and dust dominated aerosols (DD), pollution dominated mixture (PDM), strongly absorbing aerosols (SA) and weakly absorbing aerosols (WA), investigate their spatial and temporal distribution, net radiative forcing and radiative forcing efficiency in global range, and further compare with VIIRS Deep Blue Production. The conclusion about net radiative forcing suggests that the high values of radiative forcing from dust and dust dominated aerosols, pollution dominated mixture both mainly come from western Africa. Strongly absorbing aerosols in South Africa and India contribute greatly to the net radiative forcing and the regions with relative high values of weakly absorbing aerosols are mainly located at East Asia and India. Lastly, the observation of VIIRS Deep Blue satellite monthly averaged products depicts the characteristics about spatial distribution of four kinds of aerosol well, the result from ground-based observation presents great significant to validate the measurements from remote sensing technology.

Graphical Abstract

1. Introduction

It is well known that aerosols are ubiquitous and exert different impacts on regional and global climate, including scattering and absorbing incoming radiation [1]. Aerosol effects above will be also enhanced by nature and intensive anthropogenic emission [2]. Diverse particle size and aerosol mass determinate the different aerosol effects and atmosphere behavior, but the aerosol properties are still difficult to characterize because of spatial and temporal variation of the aerosol component [3,4]. On the other hand, temporal and spatial variation of aerosols in the atmosphere and earth system will perturb the radiative budget balance, as a result, radiative forcing is adapted to evaluate the magnitude of solar energy changes. To increase the accuracy of measurement about the aerosol radiative forcing, classifying aerosol categories is inevitable [5]. For the reasons above, long-term observation of different kinds of aerosol types is significant to improve our knowledge about properties and radiative forcing of aerosol.
Ground-based measurement and remote sensing from satellite are two regular manners to characterize aerosol optical properties and aerosol effects to the climate [6,7]. Aerosol Robotic Network (AERONET) is an automatic monitoring network of global aerosols, which retrieves the column integrated aerosol optical properties accurately and shows great significance to validate the satellite aerosol products [8,9]. In addition, much attention and progress has been given to satellite-based aerosol measurements in the pass decades, because of the limitation of relatively sparse numbers of stations (especially in the remote countryside) and discontinuous time series [7]. In recent years, VIIRS (Visible Infrared Imaging Radiometer Suite) has been launched into space by Suomi-National Polar-orbiting Partnership (S-NPP) satellite in late 2011, which is the next generation polar-orbiting operational environment sensor and it is expected to offer long-term, global aerosol retrievals [10]. Two algorithms, Deep Blue (DB) algorithm and Satellite Ocean Aerosol Retrieval (SOAR) algorithm, have been adapted to VIIRS measurements to retrieve the aerosol parameters and aerosol types in the global range [11]. More details and brief description about the AERONET and VIIRS will be shown in the second section.
To improve understanding about the climate effects from multiple aerosols to climate systems, aerosol classification is crucial as it provides the fundamental aerosol information [12]. Previous studies usually propose combining particle size parameters with aerosol absorption to distinguish various aerosol categories. Hamill et al. (2016) exploit the EAE (Extinction Angström Exponent), SSA (single-scattering albedo) and some other optical parameters to retrieve five kinds of aerosol during the period from 1993 to 2012 [13]. Lee et al. (2010) have explored spatial distribution of aerosol component on the basis of fine-mode fraction (FMF) and SSA in global range and suggest that the absorption of urban or industrial aerosols in North America and Europe is lower than those in Asia [14]. Che et al. (2018) have pointed out that under the framework of distinguishing aerosol clusters by SSA, FMF and Angström exponent (AE), fine-mode aerosol is the main contributor to aerosol component in the south of China [15]. In addition, increasing numbers of studies have exploited remote sensing observations including satellite production to characterize the aerosol optical properties and to verify the ground-based results [16]. For instance, Zhao et al. (2018) investigate the spatial distribution of AOD for dust events, anthropogenic pollution, the mixed pollution event, and local accumulation by Moderate Resolution Imaging Spectroradiometer (MODIS) products [17]. Bibi et al. (2016) have contrasted the result of aerosol identification from AERNOET with those from Cloud-Aerosol Lidar and Infrared Pathfinder Satellite Observation (CALIPSO) in Indo-Gangetic plains [18]. Tutsak et al. (2020) analyzed air masses in Erdemli (located at Eastern Mediterranean) and revealed that the region is under the influence of air flow from east of Sahara by five-day air mass back trajectories [19].
The aerosol emission from natural sources and intensive anthropogenic activities in the world will have profound impact on the optical and microphysical properties of aerosol, spatial and temporal distribution of aerosol types, and further affect the aerosol radiative forcing in the air. Although there are a lot of studies focused on distinguishing aerosol categories, few of them utilize the PLDR as classification parameters. In this paper, 52 stations spread over the Asia, Europe, America, Africa, and Australia will be taken into account when investigating optical properties and radiative forcing of aerosols in global range. Section 2 will introduce the AERONET, VIIRS Deep Blue production, optical parameters and the method of classification specifically. In Section 3, we investigate several optical parameter distributions at first, classify four kinds of aerosol according to particle linear depolarization ration (PLDR) and single scatter albedo (SSA), explore the spatial and temporal distribution of these four aerosol types, the net radiative forcing and radiative forcing efficiency from four kinds of aerosol will be also shown in this part to evaluate the climatological effects from aerosol. Last but not least, VIIRS Deep Blue Aerosol Products will be imported to contrast with the classification result. The discussion about the results and the opinions from other research will be presented in Section 4. Section 5 will provide some strong conclusions in the end.

2. Materials and Methods

2.1. Descriptions of AERONET

In this research, the data in each station are all derived from AERONET Version 3 Level 2.0 dataset, which can be obtained from the official web (https://aeronet.gsfc.nasa.gov/, accessed on 31 January 2021). Established by NASA (National Aeronautics and Space Administration), and LOA-PHOTONS (CNRS), AERONET currently has more than a thousand stations equipped with CE-318 sunphotometers in the worldwide range constituting an automatic global aerosol observation network. The measurements are performed under the condition of 1.2° full field of view every 15 min at each channel. Within the spectral bands of 340–1640 nm, CE-318 photometers can measure the direct and diffuse solar radiation in cloud-screened condition [20]. With the help of inversion algorithm from Dubovik and King [21,22], the data above can be inverted to columnar optical aerosol parameters at four wavelengths of 440, 675, 870, 1020 nm. The aerosol Level 2.0 data are quality assured with prefield and postfield calibration, the uncertainty of AOD is smaller than 0.01 when the wavelengths larger than 440 nm, smaller than 0.02 when the wavelengths are shorter and the uncertainty is less than 5% for sky radiance measurements [20,23].

2.2. Optical Parameters Retrieve from AERONET

Inferred from the measurements of almucantar sky irradiance, some optical and microphysical parameters about particle size and absorption including AE, SSA, PLDR, AAOD (absorption aerosol optical depth), AAE (absorption Angström exponent) should be discussed worldwide at first to master the base information about aerosol properties.
As a qualitative indicator of aerosol size, AE is widely used in the aerosol classification [15,24]. A lower value of AE (less than 1.0) means relative larger sizes of aerosol such as dust and sea salt, while the higher AE (greater than 2.0) corresponding to fine-mode aerosol associated with combustion byproducts [25]. The wavelength of AE in this article is from 440 to 870 nm. As the ratio of aerosol scattering coefficient compared to the total extinction coefficient, SSA is a fundamental parameter to describe the scattering ability of aerosol mass. The uncertainty of SSA is ranges from 0.03 to 0.05 when the solar zenith angles larger than 50° [26]. The formulation of particle linear depolarization ratio from the AERONET is shown in the Equation (1):
δ ( λ ) =   1 F 22 λ , 180 ˚ / F 11 λ , 180 ˚ 1 + F 22 λ , 180 ˚ / F 11 λ , 180 ˚
F11 (λ) is proportional to the flux of scattering light when the incident light is unpolarized, and F22 (λ) is influenced by angular and spectral distribution of the radiative intensity, both parameters can be calculated by particle size distribution and the complex refractive index [27]. Compared with the PLDR from lidar in 532 nm, the reliability of PLDR retrieved from AERONET at long wavelengths (870 and 1020 nm) has been proved by Noh in previous research [28]. PLDR is closely related to the shape of particle, high value of PLDR (larger than 3.0) indicates the coarse-mode aerosol, while the smaller value represents the more spherical particle [29], as a result, PLDR can easily distinguish spherical particles from nonspherical (such as dust and volcano ash). Two parameters with respective to aerosol absorption, AAOD and AAE, should be discussed, two formulations are shown in Equations (2) and (3), respectively.
AAOD(λ) = [1 − SSA(λ)] × AOD(λ)
AAE = −dln [AAOD(λ)]/dln(λ)
AAOD evaluates the quantity of absorption aerosol and large values of AAOD suggest that there is abundant absorption aerosol in the air. Represented as the wavelength dependence of absorption, AAE is sensitive to the absorption of aerosol mass, previous research has shown that the values of AAE near 1 imply the urban industrial aerosol, and the larger AAE for aerosol from biomass burning and mineral dust plume [30].

2.3. Radiative Forcing and Radiative Forcing Efficiency

Integrated into the operational AERONET inversion code, radiative transfer module using DIScrete Ordinate Radiative Transfer (DISORT) model to evaluate the radiative forcing and radiative forcing efficiency by the use of AOD, SSA, asymmetry parameter (ASY), complex refractive index from sky radiance measurements [31], and the uncertainties of radiative forcing are mostly related to the factors above [32].
The radiative forcing retrieved from the radiative transfer module is defined as the flux variation of solar radiation when total aerosol is present (FP) or (FA) absent under the cloud-free conditions and which can quantify the aerosol effect to the climate. The radiative forcing and other optical properties data retrieved from AERONET under the condition of the solar zenith angle is between 50° and 80°. As the radiative forcing is susceptible to the solar zenith angle during the measurement, the radiative forcing data in this article are filtered when the solar zenith angle is above 55°, but lower than 65° as previous research [5]. The equation of radiative forcing is shown in Equation (4):
ADRF = (F↓P − F↑P) − (F↓A − F↑A)
The up and down arrows in Equation (4) represent the upward and downward radiation. The direct radiative forcing from the AERONET is defined as Equations (5) and (6), which only take downward fluxes at bottom of atmosphere (BOA) and upward fluxes at the top of atmosphere (TOA). The radiative forcing coming from the bottom of atmosphere have taken the surface albedo into account [5]. The net radiative forcing indicated the heating remains in the atmosphere and is calculated by the difference between radiative forcing in the top and the bottom, as a result, a positive/negative net radiative forcing suggests the warming/cooling effect in the air.
FBOA = (FBOAP − FBOAA)
FTOA = (FTOAA − FTOAP)
Additionally retrieved from the AERONET inversion algorithm, aerosol radiative forcing efficiency efficiently quantifies the cooling or heating effect from the aerosol without considering the aerosol loading, and it is defined as the rate at which the atmosphere is forced per unit of AOD; its equation is shown in the Equation (7):
F eff = Δ F A O D 500 n m

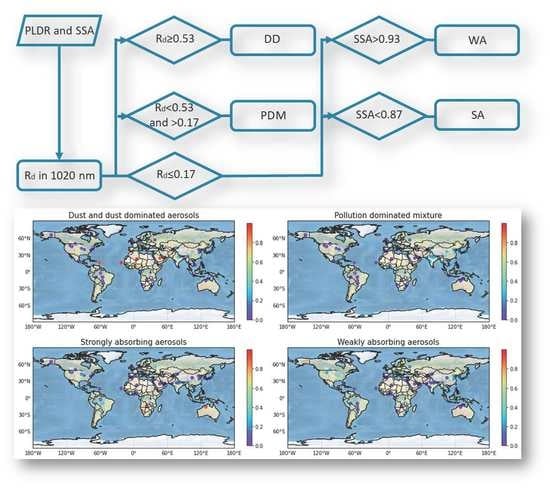
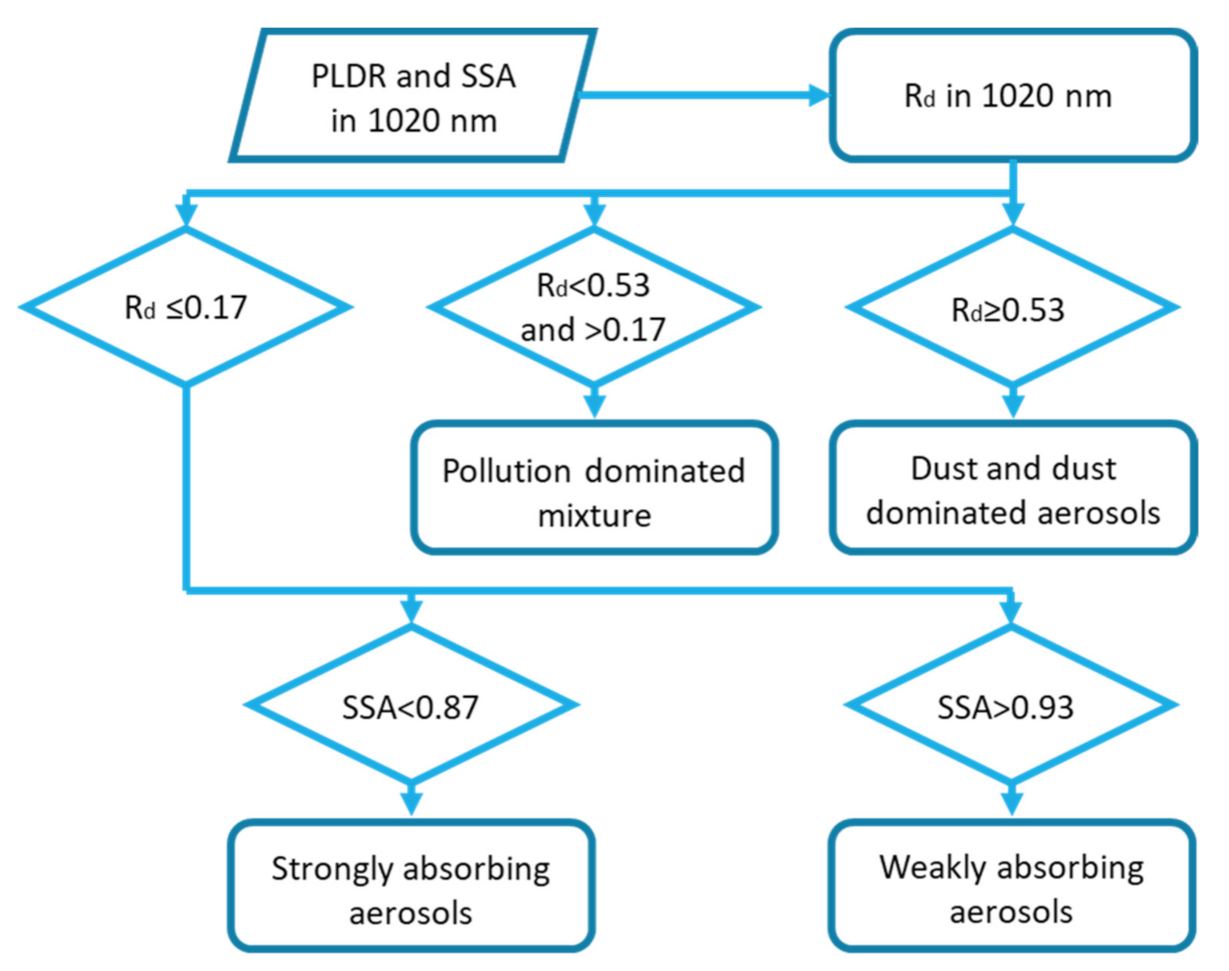
2.4. Aerosol Classification

Based on spectral optical and microphysical parameters, aerosol classification not only improves the accuracy of the satellite observation results, but also plays an essential role on improving our understanding of the internal relations between aerosol types and radiative forcing effects. Previous research usually focused on a variety of parameters in terms of aerosol size and absorption and contributed their efforts to confirm the proper threshold; at the same time, taking FMF as a proxy of classification is a prevailing approach among the classification framework and identifying the coarse-mode and fine-mode aerosol effectively. However, previous research has investigated the FMF and concluded that FMF could not separate the dust and nondust aerosol properly, leading to a systematic underestimation of the contribution from nondust aerosol to AOD [25,33]. As a result, increasing attention has been transferred into PLDR, which is sensitive to shape of particles with respective to spherical or not, the value of PLDR is generally smaller than 0.35 and larger than 0, the value of PLDR between 0.3 and 0.35 indicated the nonspherical aerosol, while corresponding to spherical particles when the PLDR is close to 0 [29]. Lidar is a powerful measurement to retrieve the PLDR [34], however, because of the relatively fewer numbers of lidar measurement sites, the limitation in spatially and temporally resolved measured data is obvious. Fortunately, large quantity of sun–sky ratiometers in the AERONET have provided the inversion products including PLDR at four wavelengths in global range and recommended by research of Dubovik [22]. For convenience and suggested by Shimizu, Rd is the result of homogenization and calculated by PLDR at 1020 nm [35,36]:
R d = δ δ 2 1 + δ 1 δ 1 δ 2 1 + δ
The δ, δ1 and δ2 denote the PLDR in 1020 nm, PLDR for pure dust and nondust aerosol, respectively. The values of δ1 and δ2 are presented by 0.3 and 0.02 empirically, when the PLDR is larger than δ1 or smaller than δ2, Rd will be set to 1 or 0, respectively.
The property of wavelength dependence for various aerosol categories and the selection of thresholds in different wavelengths have a great impact on the absorption aerosol classification result, such as black carbon (BC) with relative weak wavelength dependence and show strong absorption throughout the spectrum, while other aerosol masses can only reveal absorption in visible and ultraviolet bands [37]. As the SSA of different aerosol types has a wide range at near-infrared wavelength than at shorter wavelength, SSA in 1020 nm is widely utilized to refine and characterize different kinds of aerosol.
As shown by Figure 1 below, inspired by the threshold from Shin [29], when the Rd is larger than or equal to 0.53, the aerosol mass will be classified as dust and dust dominated aerosols (DD). When the Rd is smaller than 0.53 but larger than 0.17, aerosol mass is regarded as pollution dominated mixture (PDM), which implies the dust plume coat with fine-mode aerosol and changes the shape of aerosol externally. Furthermore, for the Rd smaller than 0.17, SSA in 1020 nm will classify the rest of the aerosol mass into strongly absorbing aerosols (SA) or weakly absorbing aerosols (WA) when the SSA is smaller than 0.87 or larger than 0.93, respectively. Shin has investigated that the relationship between SSA and volume size distribution vary with respect to different intervals of PLDR as the feasibility analysis, which proposed that SSA combined with PLDR in 1020 nm can classify the aerosol effectively [29].

2.5. The Deep Blue Algorithm and Visible Infrared Imaging Radiometer Suite

As a function of recording long term aerosol in a global range, the Deep Blue algorithm was adapted to the Moderate Resolution Imaging Spectroradiometer (MODIS) operational Atmospheres data product suite MODIS collection 5 (C5) by sensors installed in Terra and Aqua satellite. The main production derived from Deep Blue algorithm is AOD in 550 nm and AE in bright-reflection surface region, filling the vacancy especially in the desert for MODIS operational Dark Target (DT) aerosol algorithms originally [38]. Launching of Suomi National Polar-orbiting Partnership (SNPP) satellite and carrying the Visible Infrared Imaging Radiometer Suite (VIIRS) offer a long-term aerosol record. Recently, researchers have combined the Deep Blue algorithm and VIIRS aboard SNPP and provide the aerosol information over continents and sea [39]. In addition to AOD, VIIRS Deep Blue data set also supplies the aerosol identification information especially for absorption properties by a spectral curvature approach. The VIIRS/SNPP Deep Blue Level 3 monthly aerosol data set with 1° × 1° degree points utilized in this research are derived from https://ladsweb.modaps.eosdis.nasa.gov/ (accessed on 31 January 2021). Eight years (from 2012 to 2019) averaged dust (over land and ocean), mixed (over land and ocean), smoke, nonsmoke fine mode aerosol datasets are selected to investigate the spatial distribution of aerosol categories, the result about four kinds of aerosol above will be compared with dust and dust dominated aerosols, pollution dominated mixture, strongly absorbing aerosols and weakly absorbing aerosols from AERONET ground-based measurement result.
Lastly, the research selects representative stations all over the world as the study objects, they are both affected by natural aerosol sources and anthropogenic activities, spread over the Asian, European, American, African, and Australian continents. The detailed information of these representative stations is shown in Table 1.

3. Results

3.1. Global Distribution of Key Optical Parameters

As shown in Figure 2, the regions with high value of AOD are located at the east and north of China, south of the Tibetan Plateau and the most obvious area is west of Africa, the principal sites are Koforidua ANUC and Ilorin, where the mean values of AOD are 1.10 ± 0.60 and 0.96 ± 0.49, respectively. This result is similar to results from other research that proposed that the west of Africa, northern India and northeastern China are major global aerosol emission source regions [40]. The north of Africa, Middle East, Central Asia, Southeast Asia, and South America are regions with moderate values of AOD, where the mean AOD mostly ranges from 0.20 to 0.60. North America, Europe and northern Australia present the lowest AOD (most of sites below 0.20). For the AE distribution in the global range, the Figure 2 shows that low AE values are in West Africa, Middle East, and Northwest Asia. The relative lower AE values indicate that aerosols are mostly composed by coarse-mode aerosol. For the other regions, the AE are mostly above 1.0 and controlled by fine-mode aerosols. High AOD values are accompanied with low AE in Middle Asia and Sahara also noted that frequent dust activities contribute AOD greatly in previous research [41,42]. Generally speaking, SSA shows less variability than other parameters. SSA in global range is mainly higher than 0.90, which implies strong backscatter to the incident radiation and solar energy. The major low value centers of SSA are located in the Southern Hemisphere. Concluding from the observations, the mean values of PLDR all over the world range from 0 to 0.35. The high and low values of PLDR correspond to the nonspherical and spherical shape of aerosols. As shown above, the area with highest PLDR is in the northwest of Africa (Tamanrasset INM, Cape Verde, and Guadeloupe with the values of 0.32 ± 0.02, 0.31 ± 0.04 and 0.29 ± 0.07), followed by Middle East (Solar village and Mezaira with the value of 0.25 ± 0.06 and 0.23 ± 0.07), and Central Asia (0.21 ± 0.08 in Dushanbe). Most parts of Europe, North America and South America are dominated by spherical aerosols since they are far away from dust sources. AAE measures the absorption capacity of aerosol, while, AAOD behaves according to the quantity of absorptive aerosols in the air. High uncertainty level for AAE has been proved by previous research [3], as a result, this article takes into account these two parameters to analyze the results and will get a comprehensive conclusion about of scatter and absorption from aerosols. South America, West Africa, southern of Africa, southern foothill of Qinghai-Tibet plateau, and northern Australia with a large value of AAOD, indicating larger quantity of absorptive aerosol suspended in the air than other regions. High AAE mainly appear in the west of Africa and Middle East such as 2.85 ± 0.72 in Cape Verde and 2.31 ± 0.90 in Mezaira. Previous research has also noted that high fraction of black carbon has been released into the atmosphere by flames outdoors which release relatively strongly absorbing aerosols over the Sahel region in West Africa [43].

3.2. Spatial Distribution of Four Kinds of Aerosol

As shown in Figure 3, dust and dust dominated aerosols prevail in West Africa, southwest of Europe, Middle East, northwest of China and Pakistan. In detail, the occurrence frequency is 0.94 0.87, 0.93, 0.83, 0.87, 0.99, 1.00 for Guadeloupe, Mezaira, Solar village, Dushanbe, Granada, Cape Verde, Tamanrasset INM station, respectively. The spatial distribution of dust and dust dominated aerosols are also stretched to the Caribbean area by the high proportion in Guadeloupe station. The result is corresponding to a famous “dust belt”. As the major emission source of dust plume in the Northern Hemisphere [44], the dust belt crosses over the eastern subtropical Atlantic to Arabian Peninsula region and with frequent dust plume resuspension. Furthermore, air quality in the south of Europe is mainly associated with dust long-distance transport from northern Africa, resulting in frequent occurrence of mineral dust and dust dominated aerosols in there (especially in Granada site located at the Iberian Peninsula) [45]. The result from observations also shows the spatial distribution of dust and dust dominated aerosols occurrence with a marked South-to-North gradient from the north of Africa to the south of Europe, and this phenomenon is linked to frequent African dust plumes [46].
Pollution dominated mixture is produced by the combination between fine-mode aerosol which comes from anthropogenic activities and coarse-mode mostly comes from nature [40]. The distribution of pollution dominated mixture is spread evenly all over the world, characterized by higher occurrence frequency (varies from about 0.45 to 0.2) among the east and middle of Asia, north of India, eastern Mediterranean area. For the middle of Asia, coarse-mode aerosol mass usually mixed with fine-mode aerosol produced from polluted regions and industry activities of China in the transport path of dust [47]. Similar generative mechanism also applies to some other regions, such as in East Asia and northern India, adjacent to natural dust sources (Gobi Desert and Thar Desert), located at the downwind direction and with substantial anthropogenic activities [48].
Generally, strongly absorbing aerosols (e.g., black carbon) are closely related to biomass burning. Compared with the Northern Hemisphere, the occurrence frequency of strongly absorbing aerosols is higher in the Southern Hemisphere, such as South America, South Africa, northern Australia. The highest occurrence frequency of strongly absorbing aerosols is in the Mongu station, where the occurrence frequency has exceeded 0.98. Another finding is that nearly all the sites with high occurrence frequency of strongly absorbing aerosols are located in the tropical region and adjacent to savanna or forest. High temperature in tropical regions and large areas of vegetation may easily induce biomass burning by nature or human activities. The black carbon aerosol emissions from biomass burning in the air will exert strong absorption in the entire solar spectrum whether by opening combustion or smoldering.
Relatively high proportion of weakly absorbing aerosols are observed in the northeast of North America (such as 50% and 68% for GSFC and Lisco stations), and followed by the west of America, Europe, and eastern China. This conclusion is corresponding with previous research, which concerned significant positive trends of SSA and negative trends of AAOD in North America, Europe and Asia by long-term observation [49]. The weakly absorbing aerosols are mostly appearing in the east of America, but for western America, black carbon emission from wild fires is prevalent which will improve the ability of absorption in the air [50].

3.3. Temporal Distribution of Four Kinds of Aerosol

As shown by Figure 4, dust is persistently existing in the north of Africa and Arabian Peninsula region during the whole year, while dust activities in central Asia and Caribbean region is intermittent. Dust spread is widest among Africa and Asia from March to August. For the other areas, there are nearly no dust events as they are far from the dust source regions. From December to February, the area mostly affected by mineral dust are limited at west of Africa and the Arabian Peninsula.
The transportation of dust plume in West Africa brings about large fraction of dust and dust dominated aerosols over the Caribbean Basin (Guadeloupe) from March to November, which revealed the remarkable seasonal cycle with mineral dust transported from North Africa especially in Sahel and Bodélé region (Western Africa) by the northeasterly winds. The winter of West Africa (from December to February) corresponds to a dry season and accompanied with northwestern air flow, which is called ‘Harmattan’. Harmattan is the main mechanism of dynamics for the dust diffusion in dry seasons, which decreases the northeastern air flow and carries coarse-mode aerosol from Saharan region and Chad basin, taking a southwesterly trajectory over Nigeria and inducing the high incidence of dust plume activities from November to February [51,52,53].
In the Iberian Peninsula, dust plume is the main contributor to aerosol loading from March to August [54], the percentage of fine-mode aerosol from local emission is increasing from September to February. The occurrence frequency of dust and dust dominated aerosols in Granada station is 0.92 from March to May, but decreases to 0 in the period from September to November. The result echoes previous research, which propose high concentration of black carbon in December and January, while low values in July and August as a result of resident heating and lower planet boundary layer from December to February [55]. Furthermore, a convective system located in North Africa is the main contributor for dust transport in climate dynamics, when the desert in North Africa takes in a large quantity of solar energy from May to October, updraft can take dust plumes up to 5 km altitudes and convenient for long-term transmission to the Iberia Peninsula [56].
The occurrence frequency of dust and dust dominated aerosols in western and northern India also shows strong seasonal variability, where a large quantity of dust is exhibited from March to May (the occurrence proportion is 92% and 68.9% in Jaipur and Kanpur station), but the proportion nearly reaches zero from December to February. Under the strong influence of southeastward airflow from Thar Desert and further Arabian Peninsula from March to May, abundance of coarse-mode aerosol adverted from dust source results in relatively higher AOD values than nondust days in both sites [57], which demonstrates dust should account for the main radiation extinction effects in the north and northwest of India from March to August.
Spatial and temporal variation of aerosol emission sources bring about the complex change in the properties of pollution aerosols [29]. Dust coated with fine-mode aerosols or internally mixed with organic material will have a great impact on aerosol physical and optical properties [58].
Concluded from Figure 5, the high occurrence frequency of pollution dominated mixture in Xuzhou, CAMS, and Pune station from March to May is 0.53, 0.40, 0.48, respectively. High concentration of polluted dominated aerosol in the eastern part of China and north of India is a comprehensive result. For the nature of aerosol, dust activities are a non-negligible factor in western China and northern India, especially during the periods of March, April and May. In addition, emission from large numbers of populations in two regions exert important rules in aerosol component, for instance, the active emission of fine-mode aerosol mixed with dust plume during tourism season (from June to August) results in relatively higher concentration of pollution dominated mixture in Dunhuang, northwestern China [59]. Similar with northwestern China, the intensive fine-mode aerosol emission from combustion of coal, industrial wasted gas, internal combustion engine coexists with seasonal dust plume (prevails from March to May) also appears in Indo-Gangetic Plain.
Another impressive station is IMS METU ERDEMLI station, located at the eastern Mediterranean region, with a high proportion of pollution dominated mixture from June to August (50.0%) and from September to November (53.3%). On one hand, the period from June to November corresponding to the maximum values of AE in IMS METU ERDEMLI, and fine-mode aerosol generated from anthropogenic activities is dominated during this time, on the other hand, the highest values of asymmetry parameters also appear from March to August, implying the intensive dust activities [60]. Mineral dust aerosol trajectory from North Africa and Middle East is not only active from March to May, but also exerts a significant effect in aerosol composition during transitional seasons (from June to August) [61]. Besides the contribution of dust aerosol, intensive fine-mode aerosol emission from local emission as well as Central and Eastern Europe is observed from September to November [62]. Two kinds of aerosol mix well in the atmosphere and produce large values of pollution dominated mixture over the northeastern Mediterranean from June to November.
The fine-mode particle or coarse-mode aerosol may contain strong absorption material in solar spectrum. For anthropogenic emissions, black carbon comes from activities such as biomass burning and consumption of fossil fuel and presents strong absorption thorough the whole solar spectrum, while for the nature of emission, the quality and quantity of iron oxides in mineral dust determines the ability of absorption in the ultraviolet band. Figure 6 exhibits the temporal distribution of strongly absorbing aerosols over the world. Compared with the Northern Hemisphere, the Southern Hemisphere shows a wide spread of strongly absorbing aerosols, especially from June to November, mainly coincident with the majority of biomass burning activities [8].
The high values of occurrence frequency of strongly absorbing aerosols in Mongu, Gobabeb and Skuzaza (in the southern of Africa) are 0.99, 0.97 and 0.55 from June to August, 0.99, 0.77 and 0.73 from September to November. The open flame combustion in South Africa is the main reason of why South Africa is the strongest emission source of strongly absorbing aerosols among the three places, this kind of combustion in South Africa generates more black carbon than smoldering in other places [63,64]. Aerosols (black carbon or organic carbon aerosol) with low SSA in south of Africa that come from fossil fuel consumption during winter (June to September) have also been mentioned in previous research [65], which may be regarded as a strongly absorbing aerosols incident in aerosol classification.
Similar with South Africa, the occurrence of strongly absorbing aerosols in South America also exhibits an obvious seasonal cycle. The high values of occurrence frequency appear from June to November in South America. Biomass burning is the main emission source for organic matter and black carbon, and which is mainly triggered by anthropogenic activities such as burning of agriculture residues and deforestation of the tropical jungle in South America [66,67]. Different from the mainly combustion phase in South Africa, smoldering is a more efficient way for combustion than flaming, producing less black carbon and organic matter, weakening the capacity of aerosol absorption in the Amazon jungle region. This assumption may account for relatively low values of strongly absorbing aerosols occurrence in the Amazon region when compared with South Africa. In detail, there is a maximum value of occurrence frequency station (CUIABA_MIRANDA station with 0.80) located at the center of Cerrado region where it is heavily affected by biomass burning in savanna from June to August, which is an outcome of a higher percentage of flaming phase and bringing about more strongly absorbing aerosols such as black carbon [68].
Lastly, Australia is also a main contributor to strongly absorbing aerosols emission source in the Southern Hemisphere. It ranks third in the amount of global total biomass burning emission. Australia takes up 8% of biomass burning emissions in the world, while Africa and South America contribute 48% and 27% of biomass burning to the total biomass burning emission, respectively [69]. Figure 6 reveals that there is a distinct seasonal cycle about the occurrence of strongly absorbing aerosols in the north of the Australia continent, a higher proportion (93.5% in Jabiru and 100% in Lake Argyle) of strongly absorbing aerosols appear from June to August, while a lower proportion appears in other months among two stations. The period from May to September coupled with large vegetated region by savanna forest and grassland in the tropical north, results in vegetation that is highly susceptible to fire [70].
Weakly absorbing aerosols are usually emitted by anthropogenic activities, such as SO2 produced by industries, injected into the air and translated to sulfate by gas-to-particle conversion, strengthening the abilities about solar scattering and extinction of aerosol. As shown in Figure 7, the high proportion of weakly absorbing aerosols regions are mainly focused on North America, Europe, east of Asia and southern Africa. It is worth mentioning that there are no aerosol types in America from December to February because of a lack of valid data, the dominated rules of weakly absorbing aerosols in Rio Branco, CUIABA MIRANDA located at South America from December to May, Gobabeb station located at South Africa from December to February are less reliable because of small sample sizes.
For North America, the scattering in eastern parts is stronger than those in western regions mainly from March to May, such as Missoula station with no weakly absorbing aerosols while GSFC station with 38.2% of weakly absorbing aerosols. The gap between the proportion of weakly absorbing aerosols in two regions is decreasing from June to November. The period from June to August and from September to November are two high proportions of weakly absorbing aerosols seasons, and especially, Lisco station with highest proportion (92.9%) from September to November. The conclusion is similar with previous research, which has elucidated that in the eastern America, abundant moisture is a main contributor to favor the increase of SSA from May to September by hygroscopic growth of fine-mode aerosol [14]. Additionally, mainly influenced by industry wasted gas, aerosol in Europe is dominated by weakly absorbing aerosols mainly from March to August such as in Humburg with value of 0.53 from March to May; this conclusion is corresponding with low AAOD in the previous result (shown in Figure 2).
The coastal station in Eastern Asia features high proportion values for weak absorption from June to August, such as Osaka (60.7%), Gwangju GIST (72.0%), CAMS (52.6%), Xuzhou (58.4%). As previous research pointed out, three factors (high temperature, high relative humidity and strong solar radiation) strengthen the photochemical reaction and bring about more scattering materials in the east of Asia [71,72,73]. In addition, high occurrence frequency may also result in the intensive polluted aerosol emission including sulfate and nitrate from factories in East Asia, especially in China. Although, the high occurrence frequency of weakly absorbing aerosols is a seasonal phenomenon in East Asia continent mainly from June to August, which is still a main contributor of weakly absorbing aerosols in the world.

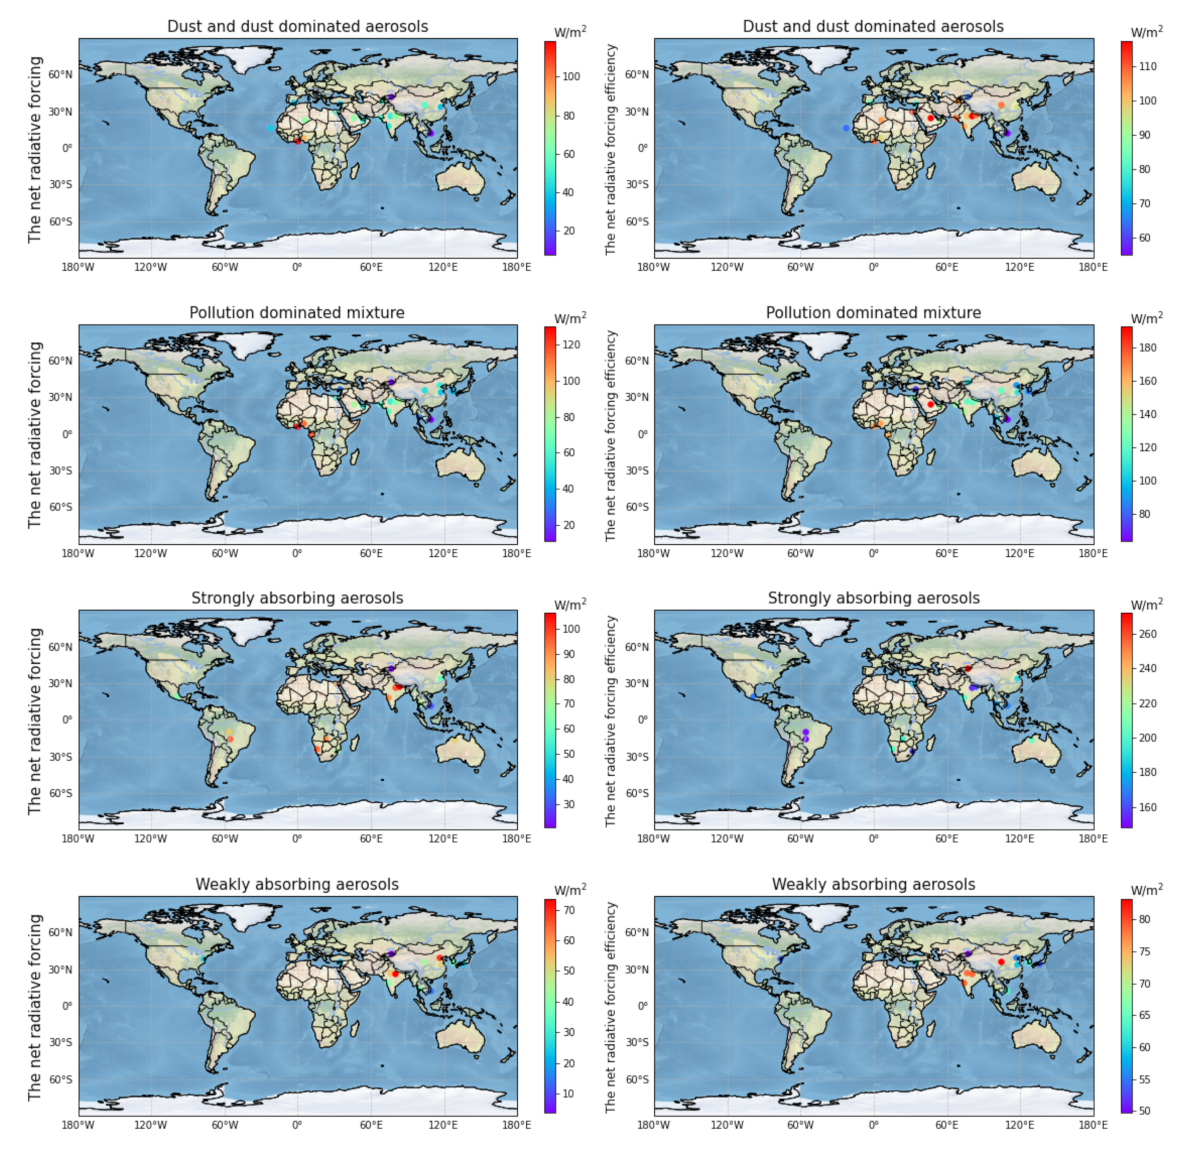
3.4. The Net Radiative Forcing and Radiative Forcing Efficiency for Each Kind of Aerosol

This section discusses the quantity of net radiative forcing and radiative forcing efficiency from four kinds of aerosol categories in each station, we distinguish each kind of aerosol in each station firstly, and only when the sample size in station exceeds 50 will we take into account and evaluate the net radiative forcing and radiative forcing efficiency in each site. The net radiative forcing calculated from the difference between the radiative forcing at the top of atmosphere and the bottom of atmosphere, which means solar energy saved in the atmosphere by the influence of each aerosol. In the end, an appropriate measurement, radiative forcing efficiency [74], was utilized here to compare the radiative forcing from aerosol in the air.
As shown in Figure 8, the high values of net radiative forcing from dust and dust dominated aerosols is mostly spread among the west of Africa, Middle East, Northern India, and Middle Asia region, while in North America and South America, the climatological impact from dust and dust dominated aerosols is nearly scarce. The most predominant sites are Koforidua ANUC station and Ilorin station when it comes to the contribution of net radiative forcing form dust and dust dominated aerosols, with highest values of 118.6 ± 53.0 W/m2 in Koforidua ANUC station and 90.0 ± 38.6 W/m2 in Ilorin. García has pointed out that the high surface albedo (especially larger than 0.3) in semiarid or arid regions like desert will improve the absorption in the atmosphere [5], and the dust belt regions (5–40°N) above substantial values to net radiative forcing may come from relative high surface albedo to some extent. Another two represented sites, Kanpur and Lumbini, with the values of 67.0 ± 24.5 and 69.7 ± 26.0 W/m2 also reveal the relatively large contribution from dust and dust dominated aerosols to the net radiative forcing in the air. The mean values of net radiative forcing efficiency produced by dust and dust dominated aerosols is 95.9 ± 18.5 W/m2 over 19 stations in the world. Stations with high radiative forcing efficiency are Solar village, Kanpur, Cairo, with values of 117.3 ± 35.0, 117.5 ± 30.9, 111.5 ± 32.1 W/m2, respectively, mainly focused on the Middle East and south of Asia.
The magnitude of net radiative forcing from pollution dominated mixture present three levels distribution over the world, highest in the west of Africa, moderate in Middle East and lowest in East Asia. In detail, three stations, SEGC Lope Gabon, Koforidua ANUC and Ilorin in the northern and equatorial Africa with high values of net radiative forcing (117.3 ± 29.6, 130.1 ± 33.4, 113.7 ± 39.1 W/m2, respectively). Apart from the sites located at West Africa, sites in Arabian Peninsula (Solar village with value of 80.6 ± 24.1 W/m2), India and Nepal (71.9 ± 26.1 W/m2, 78.9 ± 30.1 W/m2 for Kanpur, Lumbini) also show relatively high values. Lastly, the low values of radiative forcing in East Asia are 55.3 ± 18.0 and 43.8 ± 18.4 W/m2 for CAMS, Xuzhou station. The spatial distribution of radiative forcing efficiency from pollution dominated mixture is highest in Arabian Peninsula (192.8 ± 52.8 W/m2 in Solar village), moderate in the west of Africa (165.8 ± 28.2 W/m2 in Koforidua ANUC) and with relative lower values in East Asia (89.5 ± 31.3 and 86.5 ± 26.4 W/m2 in CAMS, Gwangju GIST).
Strongly absorbing aerosols in three areas including South Africa, South America and India Peninsula contribute greatly to the net radiative forcing (94.2 ± 32.2, 88.7 ± 35.6, 95.2 ± 39.7, 96.6 ± 29.3, and 106.5 ± 33.2 W/m2 in Gobabeb, Mongu, CUIABA MIRANDA, Kanpur, and Lumbini, respectively). The result is similar to previous research, which has proposed that the production of large absorption aerosol by biomass burning in September over Mongu station can be revealed by the high value of net radiative forcing in the air [75]. The highest value of radiative forcing from strongly absorbing aerosols station is located at Lumbini which may be attributed to biomass burning release absorbing nature [76,77]. Large values of radiative forcing efficiency are among the south of Africa (200.8 ± 27.7, 196.9 ± 35.6, and 159.7 ± 23.7 W/m2 for Gobabeb, Mongu, and Skukuza) and north of Australia (205.5 ± 33.4 W/m2 in Lake Argyle), the highest station is Issyk-Kul, where the radiative forcing efficiency is 272.4 ± 124.3 W/m2.
In eastern Asia and northern India, weakly absorbing aerosols contribute much net radiative forcing in the air. With the substantial values of 69.0 ± 30.0 and 73.7 ± 32.5 W/m2 for CAMS, and Kanpur, the stations are all located at high population regions with large magnitude of aerosol emission. In addition, the function of high net radiative forcing that comes from weakly absorbing aerosols is comparable to black carbon aerosol among eastern China, which plays a significant role in the heating of the top of the atmosphere and cooling of the bottom of the atmosphere, affecting the planet boundary layer [78]. The mean value for radiative forcing efficiency from weakly absorbing aerosols is 65.6 ± 11.3 W/m2 including 13 stations over the world, the regions with large magnitude are mainly in India (78.9 ± 18.7, 78.9 ± 18.4, 78.4 ± 18.1 W/m2, in Pune, Kanpur, Jaipur, respectively), due to relatively higher radiative forcing.

3.5. Aerosol Classification from VIIRS Deep Blue Production and Bias Analysis

Figure 9 presents the spatial distribution of monthly averaged days for four aerosol categories in global range retrieved from VIIRS Deep Blue Production. Generally speaking, dust and mixed aerosol spread over the continent and ocean except the polar area, smoke aerosol and nonsmoke fine mode aerosol are mainly concentrated on the ground. Dust aerosol identified by VIIRS sensors are focused on northern Africa including Niger, Chad, Algeria, Libya, Mauritania, the whole Arabian Peninsula and northwest of China, not revealed as the shape of the belt. High value regions are almost over the continent, which implies the perpetual dust area above, for example, the Sahara Desert, Rubhali Desert and Taklimakan Desert. Analogous to spatial distribution of dust and dust dominated aerosols in Figure 3, dust aerosol is absent in South Africa, the eastern part of America, north of South America, most of Russia, west of Australia and south of China continent near the tropical area. The phenomenon of mineral dust from northern Africa transport to the Caribbean region is well presented by VIIRS Deep Blue Production. Mixed aerosol is dominated in West Africa, Middle Asia (such as Iran and Afghan), India Peninsula, and spread widest in a global range when compared with other kinds of aerosol. The high averaged days of mixed aerosol in northern China and India depicts the feature of spatial distribution well. In addition, there is a blank over the Qinghai-Tibet Plateau as lack of emission from anthropogenic activities. Smoke aerosols play a dominant role in the south of Africa, spread sporadically among western Brazil, and the centre of the Asia continent, the result is similar with previous research that used MODIS Level 3 data before [79]. The high value center in South Africa lies in the northern direction when compared with classification result from the AERONET. Even with the highest frequency of strong absorption in southern Africa, eight days of which for the monthly average suggest the seasonal cycle of biomass burning activities. Nonsmoke fine mode aerosol mostly distributes in eastern China where with crowed places, the rapid development in China accelerates the emission of fine-mode aerosols from urban or industry activities. The conclusion is similar with previous research, that emphasized the dominant role of sulfate in East Asia by the use of Moderate Resolution Imaging Spectroradiometer and Ozone Monitoring Instrument algorithm [80]. However, VIIRS Deep Blue Production could not present the large magnitude of weakly absorbing aerosols in North America well, furthermore, the high magnitude of days with nonsmoke fine mode aerosol in India Peninsula and Pakistan are different from the classification result from AERNOET.
Satellite derived AOD are typically validated by station datasets on the ground. Due to the biased result in the India Peninsula and Pakistan, the comparison about AOD retrieved from AERONET and VIIRS Deep Blue production in four South Asia stations are shown in Figure 10. The station data from AERONET are monthly averaged manually. The AOD values from VIIRS Deep Blue Production for each city is the average result calculated by the data in the nearest four grids. Figure 10 presents the good relationship from spatially averaged VIIRS Deep Blue Production and temporally averaged AERONET data except in Pune. The correlation coefficients are 0.69, 0.23, 0.65, and 0.55 for Kanpur, Pune, Jaipur, and Karachi, respectively. Exactly, the averaged PLDR and SSA retrieved from AERONET are 0.17, 0.10, 0.06, 0.19, 0.05 and 0.94, 0.91, 0.89, 0.94, 0.86 for Jaipur, Kanpur, Lumbini, Karachi and Pune. Low values of SSA for Kanpur, Lumbini and Pune imply the lower levels of weakly absorbing aerosols, although with relatively higher SSA in Karachi and Jaipur, the 0.19 and 0.17 averaged PLDR from AERONET also suggest the absence of fine-mode aerosol in the western of India Peninsula and Pakistan, as a result, the VIIRS Deep Blue production overestimate the quantity of nonsmoke fine mode aerosol in India Peninsula and Pakistan area. Finally, the different criterion (spectral curvature approach utilized in the VIIRS Deep Blue Production [39]) is the main contributor for the distinct classification result between AERONET and VIIRS Deep Blue Production.

4. Discussion

With the help of PLDR, the aerosol classification result is different with previous research. Dust and dust dominated aerosols are widely spread among Africa and the Arabian Peninsula. Concluded from Figure 5, the stations with high concentration of polluted dominated aerosol are mainly located in the eastern part of China, east of the Mediterranean region and north of India. On the condition of greater wind speed, high air temperature and drought environment will improve the contribution of coarse-mode aerosol in the Middle East [81], and produce the high proportion of pollution dominated mixture in the northern of Middle East. Compared with Northern Hemisphere, the Southern Hemisphere shows a wide spread of strongly absorbing aerosols, especially from June to November, nearly coincident with the majority of biomass burning activities [82]. Under the influence of subsidence from Botswana anticyclone and peak periods of agricultural burning, maximum values of AOD also occur in August and September [83]. Different biomass burning styles should account for the occurrence frequency of strongly absorbing aerosols [83,84,85,86]. Three factors (higher temperature environment, relatively higher relative humidity ambient and stronger incident solar radiation) bring about more scattering materials resulting in the high occurrence frequency of weakly absorbing aerosols over North America, Europe, and the east of Asia [71,72,73]. High occurrence of weakly absorbing aerosols may also result from subtropical anticyclones in the western Pacific, which favors the transport of moisture eastward and the hygroscopic growth of fine-mode aerosols in East Asia [15]. The article further talks about the net radiative forcing and the net radiative forcing efficiency from four kinds of aerosol, and helps improve our understanding about aerosol climate effects. In the end, the article compared two aerosol classification results from AERONET and VIIRS Deep Blue production, and the different methods in classification should account for the overestimation of weak absorption concentration in India Peninsula and Pakistan area [39]. In general, the methods of aerosol classification in this article provide a new angle for readers and a novel approach for other researchers, the method can also be applied to other stations in the world. On the other hand, uncertainty also existed during the investigation. Uncertainty may come from the inversion of optical parameters and satellite observation. The result from this method should be further validated by other manners of observation or simulation to improve the reliability in the future.

5. Conclusions

In this work, the PLDR and SSA in 1020 nm obtained from 52 AERONET stations (level 2.0 dataset) were used to identify four different types of aerosol categories, investigate their spatial and temporal distribution, their net radiative forcing and net radiative forcing efficiency in global range, and compared with VIIRS Deep Blue production lastly. The article presents the spatial distribution of six optical parameters firstly. With high values of AOD, eastern China, western Africa, and northern India present relatively stronger ability of backscattering the solar energy to space (e.g., the averaged values of AOD is 1.1 ± 0.60 in Koforidua ANUC station). SSA in the Southern Hemisphere are generally lower than those in Northern Hemisphere. AE and PLDR have a good inverse relationship in general. South America, West Africa, southern Africa, southern foothill of Qinghai-Tibet plateau and northern Australia present a large value of AAOD. High values of AAE are mainly focused on the middle of Africa and Middle East.
Dust and dust dominated aerosols are abundant in the famous dust belt, and the occurrence frequencies are 0.94, 0.87, 0.93, 0.83, 0.87, 0.99, 1.00 for Guadeloupe, Mezaira, Solar village, Dushanbe, Granada, Cape Verde, Tamanrasset INM station, respectively. Dust spread is widest among Africa and Asia from March to August. Dust coated with fine-mode aerosol or internally mixed with organic material, which will have a great impact on aerosol physical and optical properties, producing more pollution dominated mixture at the eastern China, Indo-Gangetic Plain, and eastern Mediterranean regions from June to November. Compared with the Northern Hemisphere, the Southern Hemisphere shows a wide spread of strongly absorbing aerosols, especially from June to November. Southern Africa, northern Australia and Amazon regions are the main contributors to strongly absorbing aerosols emission in the Southern Hemisphere, such as the occurrence frequency in Mongu, Gobabeb, and IABA_MIRANDA is 0.99, 0.97, 0.80 from June to August, respectively. The spatial distribution of weakly absorbing aerosols region is mainly focused on North America, Europe, eastern Asia. The coastal station in Eastern Asia features high occurrence frequency region for weak absorption from June to August, such as Osaka (60.7%), Gwangju GIST (72.0%), CAMS (52.6%), and Xuzhou (58.4%).
The conclusion from net radiative forcing and radiative forcing efficiency shows that the high values of net radiative forcing from dust and dust dominated aerosols are mostly spread among the west of Africa, Middle East, north of India, and Middle Asia region where there are numerous sources of natural dust. For the net radiative forcing from pollution dominated mixture, SEGC Lope Gabon, Koforidua ANUC and Ilorin in northern and equatorial Africa with high values of net radiative forcing (117.3 ± 29.6, 130.1 ± 33.4, and 113.7 ± 39.1 W/m2, respectively). Strongly absorbing aerosols in three areas, South Africa, South America, and India Peninsula, contribute greatly to the net radiative forcing, emissions of smoke particles from biomass burning activities producing the exhaust of elemental or organic carbon metrical which may bring about such phenomenon above. In the east of Asia and north of India, weakly absorbing aerosols contribute much net radiative forcing (with the substantial values of 69.0 ± 30.0 and 73.7 ± 32.5 W/m2 for CAMS, and Kanpur) in the air.
Lastly, the observation of VIIRS Deep Blue satellite monthly averaged production depicts the characteristics about spatial distribution of four kinds of aerosol, including high proportion of pure dust in northern Africa, Arabian Peninsula, and Central Asia, pollution dominated mixture spread relatively medially over the world, seasonal activities bring about the emission of strongly absorbing aerosols among southern Africa and high fraction of weakly absorbing aerosols over India and eastern China.

Author Contributions

Conceptualization, H.C.; methodology, H.C. and J.L.; software, J.L.; validation, J.L. and L.X.; formal analysis, J.L.; investigation, J.L. and X.S.; resources, H.C. and X.S.; data curation, J.L.; writing—original draft preparation, L.X.; writing—review and editing, J.L. and L.X.; visualization, J.L.; supervision, Y.Z. and X.S.; project administration, Y.Z. and X.S.; funding acquisition, X.S. and H.C. All authors have read and agreed to the published version of the manuscript.

Funding

This research was funded by National Science Fund for Distinguished Young Scholars (41825011), the National Key Research and Development Program of China (2019YFC1510400), and the National Natural Science Foundation of China (41975054 and 41930967).

Acknowledgments

The authors thank principal investigators and coinvestigators for daily maintenance of the instrument and providing the level 2.0 AERONET data.

Conflicts of Interest

The authors declare no conflict of interest.

References

  1. Fernández, A.J.; Molero, F.; Salvador, P.; Revuelta, A.; Becerril-Valle, M.; Gómez-Moreno, F.J.; Artíñano, B.; Pujadas, M. Aerosol optical, microphysical and radiative forcing properties during variable intensity African dust events in the Iberian Peninsula. Atmos. Res. 2017, 196, 129–141. [Google Scholar] [CrossRef]
  2. Gui, K.; Che, H.; Wang, Y.; Wang, H.; Zhang, L.; Zhao, H.; Zheng, Y.; Sun, T.; Zhang, X. Satellite-Derived PM2.5 Concentration Trends over Eastern China from 1998 to 2016: Relationships to Emissions and Meteorological Parameters. Environ. Pollut. 2019, 247, 1125–1133. [Google Scholar] [CrossRef]
  3. Giles, D.M.; Holben, B.N.; Eck, T.F.; Sinyuk, A.; Smirnov, A.; Slutsker, I.; Dickerson, R.R.; Thompson, A.M.; Schafer, J.S. An analysis of AERONET aerosol absorption properties and classifications representative of aerosol source regions. J. Geophys. Res. Atmos. 2012, 117. [Google Scholar] [CrossRef] [Green Version]
  4. Perrone, M.R.; Romano, S.; Orza, J. Particle optical properties at a Central Mediterranean site: Impact of advection routes and local meteorology. Atmos. Res. 2014, 145, 152–167. [Google Scholar] [CrossRef]
  5. García, O.E.; Díaz, J.P.; Expósito, F.J.; D´ıaz, A.M.; Dubovik, O.; Derimian, Y.; Dubuisson, P.; Roger, J.-C. Shortwave radiative forcing and efficiency of key aerosol types using AERONET data. Atmos. Chem. Phys. 2012, 12, 5129–5145. [Google Scholar] [CrossRef] [Green Version]
  6. Lee, J.; Hsu, N.C.; Sayer, A.M.; Bettenhausen, C.; Yang, P. AERONET-based nonspherical dust optical models and effects on the VIIRS deep blue/SOAR over water aerosol product. J. Geophys. Res. Atmos. 2017, 122, 10384–10401. [Google Scholar] [CrossRef]
  7. Meng, F.; Cao, C.; Shao, X. Spatio-temporal variability of Suomi-NPP VIIRS-derived aerosol optical thickness over China in 2013. Remote Sens. Environ. 2015, 163, 61–69. [Google Scholar] [CrossRef]
  8. Holben, B.N.; Tanré, D.; Smirnov, A.; Eck, T.F.; Slutsker, I.; Abuhassan, N.; Newcomb, W.W.; Schafer, J.S.; Chatenet, B.; Lavenu, F.; et al. An emerging ground-based aerosol climatology: Aerosol optical depth from AERONET. J. Geophys. Res. Atmos. 2001, 106, 12067–12097. [Google Scholar] [CrossRef]
  9. Li, Z.; Li, C.; Chen, H.; Tsay, S.-C.; Holben, B.; Huang, J.; Li, B.; Maring, H.; Qian, Y.; Shi, G.; et al. East Asian studies of tropospheric aerosols and their impact on regional climate (EAST-AIRC): An overview. J. Geophys. Res. Atmos. 2011, 116. [Google Scholar] [CrossRef] [Green Version]
  10. He, L.; Wang, L.; Lin, A.; Zhang, M.; Bilal, M.; Wei, J. Performance of the NPP-VIIRS and Aqua-MODIS aerosol optical depth products over the Yangtze River Basin. Remote Sens. 2018, 10, 117. [Google Scholar] [CrossRef] [Green Version]
  11. Sayer, A.M.; Hsu, N.C.; Lee, J.; Kim, W.V.; Dutcher, S.T. Validation, stability, and consistency of MODIS Collection 6.1 and VIIRS Version 1 Deep Blue aerosol data over land. J. Geophys. Res. Atmos. 2019, 124, 4658–4688. [Google Scholar] [CrossRef]
  12. Schmeisser, L.; Andrews, E.; Ogren, J.A.; Sheridan, P.; Jefferson, A.; Sharma, S.; Kim, J.E.; Sherman, J.P.; Sorribas, M.; Kalapov, I.; et al. Classifying aerosol type using in situ surface spectral aerosol optical properties. Atmos. Chem. Phys. 2017, 17, 12097–12120. [Google Scholar] [CrossRef] [Green Version]
  13. Hamill, P.; Giordano, M.; Ward, C.; Giles, D.; Holben, B. An AERONET-based aerosol classification using the Mahalanobis distance. Atmos. Environ. 2016, 140, 213–233. [Google Scholar] [CrossRef]
  14. Lee, J.; Kim, J.; Song, C.H.; Kim, S.B.; Chun, Y.; Sohn, B.J.; Holben, B.N. Characteristics of aerosol types from AERONET sunphotometer measurements. Atmos. Environ. 2010, 44, 3110–3117. [Google Scholar] [CrossRef]
  15. Che, H.; Qi, B.; Zhao, H.; Xia, X.; Eck, T.F.; Goloub, P.; Dubovik, O.; Estelles, V.; Cuevas-Agulló, E.; Blarel, L.; et al. Aerosol optical properties and direct radiative forcing based on measurements from the China Aerosol Remote Sensing Network (CARSNET) in eastern China. Atmos. Chem. Phys. 2018, 18, 405–425. [Google Scholar] [CrossRef] [Green Version]
  16. Chen, Q.X.; Shen, W.X.; Yuan, Y.; Tan, H.-P. Verification of aerosol classification methods through satellite and ground-based measurements over Harbin, Northeast China. Atmos. Res. 2019, 216, 167–175. [Google Scholar] [CrossRef]
  17. Zhao, H.; Che, H.; Wang, Y.; Dong, Y.; Ma, Y.; Li, X.; Hong, Y.; Yang, H.; Liu, Y.; Wang, Y.; et al. Aerosol vertical distribution and typical air pollution episodes over northeastern China during 2016 analyzed by ground-based lidar. Aerosol Air Qual. Res. 2018, 18, 918–937. [Google Scholar] [CrossRef]
  18. Bibi, H.; Alam, K.; Bibi, S. In-depth discrimination of aerosol types using multiple clustering techniques over four locations in Indo-Gangetic plains. Atmos. Res. 2016, 181, 106–114. [Google Scholar] [CrossRef]
  19. Tutsak, E.; Koçak, M. Optical and microphysical properties of the columnar Aerosol burden over the Eastern Mediterranean: Discrimination of Aerosol types. Atmos. Environ. 2020, 229, 117463. [Google Scholar] [CrossRef]
  20. Holben, B.N.; Eck, T.F.; Slutsker, I.; Tanré, D.; Buis, J.P.; Setzer, A.; Vermote, E.; Regan, J.A.; Kaufman, Y.J.; Nakajima, T.; et al. AERONET—A federated instrument network and data archive for aerosol characterization. Remote Sens. Environ. 1998, 66, 1–16. [Google Scholar] [CrossRef]
  21. Dubovik, O.; King, M.D. A flexible inversion algorithm for retrieval of aerosol optical properties from Sun and sky radiance measurements. J. Geophys. Res. Atmos. 2000, 105, 20673–20696. [Google Scholar] [CrossRef] [Green Version]
  22. Dubovik, O.; Sinyuk, A.; Lapyonok, T.; Holben, B.N.; Mishchenko, M.; Yang, P.; Eck, T.F.; Volten, H.; Muñoz, O.; Veihelmann, B. Application of spheroid models to account for aerosol particle nonsphericity in remote sensing of desert dust. J. Geophys. Res. Atmos. 2006, 111. [Google Scholar] [CrossRef] [Green Version]
  23. Eck, T.F.; Holben, B.N.; Reid, J.S.; Dubovik, O.; Smirnov, A.; Neill, N.T.O.; Slutsker, I.; Kinne, S. Wavelength dependence of the optical depth of biomass burning, urban, and desert dust aerosols. J. Geophys. Res. Atmos. 1999, 104, 31333–31349. [Google Scholar] [CrossRef]
  24. Mielonen, T.; Arola, A.; Komppula, M.; Kukkonen, J.; Koskinen, J.; De Leeuw, G.; Lehtinen, K.E.J. Comparison of CALIOP level 2 aerosol subtypes to aerosol types derived from AERONET inversion data. Geophys. Res. Lett. 2009, 36. [Google Scholar] [CrossRef]
  25. Schuster, G.L.; Dubovik, O.; Holben, B.N. Angstrom exponent and bimodal aerosol size distributions. J. Geophys. Res. Atmos. 2006, 111. [Google Scholar] [CrossRef] [Green Version]
  26. Yu, X.; Kumar, K.R.; Lü, R.; Ma, J. Changes in column aerosol optical properties during extreme haze-fog episodes in January 2013 over urban Beijing. Environ. Pollut. 2016, 210, 217–226. [Google Scholar] [CrossRef]
  27. Bohren, C.F.; Huffman, D.R. Absorption and Scattering of Light by Small Particles; John Wiley & Sons: Hoboken, NJ, USA, 2008. [Google Scholar]
  28. Noh, Y.; Müller, D.; Lee, K.; Kim, K.; Lee, K.; Shimizu, A.; Sano, I.; Park, C.B. Depolarization ratios retrieved by AERONET sun–sky radiometer data and comparison to depolarization ratios measured with lidar. Atmos. Chem. Phys. 2017, 17, 6271–6290. [Google Scholar] [CrossRef] [Green Version]
  29. Shin, S.K.; Tesche, M.; Noh, Y.; Müller, D. Aerosol-type classification based on AERONET version 3 inversion products. Atmos. Meas. Tech. 2019, 12, 3789–3803. [Google Scholar] [CrossRef] [Green Version]
  30. Russell, P.B.; Bergstrom, R.W.; Shinozuka, Y.; Clarke, A.D.; DeCarlo, P.F.; Jimenez, J.L.; Livingston, J.M.; Redemann, J.; Dubovik, O.; Strawa, A. Absorption Angstrom Exponent in AERONET and related data as an indicator of aerosol composition. Atmos. Chem. Phys. 2010, 10, 1155–1169. [Google Scholar] [CrossRef] [Green Version]
  31. Che, H.; Zhao, H.; Wu, Y.; Xia, X.; Zhu, J.; Wang, H.; Wang, Y.; Sun, J.; Yu, J.; Zhang, X.; et al. Analyses of aerosol optical properties and direct radiative forcing over urban and industrial regions in Northeast China. Meteorol. Atmos. Phys. 2015, 127, 345–354. [Google Scholar] [CrossRef]
  32. Adesina, A.J.; Piketh, S.; Kanike, R.K.; Venkataraman, S. Characteristics of columnar aerosol optical and microphysical properties retrieved from the sun photometer and its impact on radiative forcing over Skukuza (South Africa) during 1999–2010. Environ. Sci. Pollut. Res. 2017, 24, 16160–16171. [Google Scholar] [CrossRef]
  33. Shin, S.K.; Tesche, M.; Müller, D.; Noh, Y. Technical note: Absorption aerosol optical depth components from AERONET observations of mixed dust plumes. Atmos. Meas. Tech. 2019, 12, 607–618. [Google Scholar] [CrossRef] [Green Version]
  34. Tesche, M.; Müller, D.; Gross, S.; Ansmann, A.; Althausen, D.; Freudenthaler, V.; Weinzierl, B.; Veira, A.; Petzold, A. Optical and microphysical properties of smoke over Cape Verde inferred from multiwavelength lidar measurements. Tellus B Chem. Phys. Meteorol. 2011, 63, 677–694. [Google Scholar] [CrossRef] [Green Version]
  35. Shimizu, A.; Sugimoto, N.; Matsui, I.; Arao, K.; Uno, I.; Murayama, T.; Kagawa, N.; Aoki, K.; Uchiyama, A.; Yamazaki, A. Continuous observations of Asian dust and other aerosols by polarization lidars in China and Japan during ACE-Asia. J. Geophys. Res. Atoms. 2004, 109. [Google Scholar] [CrossRef]
  36. Shin, S.K.; Tesche, M.; Kim, K.; Kezoudi, M.; Tatarov, B.; Müller, D.; Noh, Y. On the spectral depolarisation and lidar ratio of mineral dust provided in the AERONET version 3 inversion product. Atmos. Chem. Phys. 2018, 18, 12735–12746. [Google Scholar] [CrossRef] [Green Version]
  37. Hess, M.; Koepke, P.; Schult, I. Optical properties of aerosols and clouds: The software package OPAC. Bull. Am. Meteorol. Soc. 1998, 79, 831–844. [Google Scholar] [CrossRef]
  38. Remer, L.A.; Kleidman, R.G.; Levy, R.C.; Kaufman, Y.J.; Tanré, D.; Mattoo, S.; Martins, J.V.; Ichoku, C.; Koren, I.; Yu, H.; et al. Global aerosol climatology from the MODIS satellite sensors. J. Geophys. Res. Space Phys. 2008, 113, 14. [Google Scholar] [CrossRef] [Green Version]
  39. Hsu, N.C.; Lee, J.; Sayer, A.M.; Kim, W.; Bettenhausen, C.; Tsay, S.-C. VIIRS Deep Blue Aerosol Products over Land: Extending the EOS Long-Term Aerosol Data Records. J. Geophys. Res. Atmos. 2019, 124, 4026–4053. [Google Scholar] [CrossRef]
  40. Eck, T.F.; Holben, B.N.; Sinyuk, A.; Pinker, R.T.; Goloub, P.; Chen, H.; Chatenet, B.; Li, Z.; Singh, R.P.; Tripathi, S.N.; et al. Climatological aspects of the optical properties of fine/coarse mode aerosol mixtures. J. Geophys. Res. Space Phys. 2010, 115, 19. [Google Scholar] [CrossRef] [Green Version]
  41. Yan, N.; Wu, G.; Zhang, X.; Zhang, C.; Xu, T. Lazhu Variation of aerosol optical properties from AERONET observation at Mt. Muztagh Ata, Eastern Pamirs. Atmos. Res. 2015, 153, 480–488. [Google Scholar] [CrossRef]
  42. Tanre, D.; Kaufman, Y.J.; Holben, B.N.; Chatenet, B.; Karnieli, A.; Lavenu, F.; Blarel, L.; Dubovik, O.; Remer, L.A.; Smirnov, A. Climatology of dust aerosol size distribution and optical properties derived from remotely sensed data in the solar spectrum. J. Geophys. Res. Space Phys. 2001, 106, 18205–18217. [Google Scholar] [CrossRef] [Green Version]
  43. Eck, T.F.; Holben, B.N.; Ward, D.E.; Dubovik, O.; Reid, J.S.; Smirnov, A.; Mukelabai, M.M.; Hsu, N.C.; O’Neill, N.T.; Slutsker, I. Characterization of the optical properties of biomass burning aerosols in Zambia during the 1997 ZIBBEE field campaign. J. Geophys. Res. Space Phys. 2001, 106, 3425–3448. [Google Scholar] [CrossRef]
  44. Prospero, J.M.; Ginoux, P.; Torres, O.; Nicholson, S.E.; Gill, T.E. Environmental characterization of global sources of atmospheric soil dust identified with the Nimbus 7 Total Ozone Mapping Spectrometer (TOMS) absorbing aerosol product. Rev. Geophys. 2002, 40, 1002. [Google Scholar] [CrossRef]
  45. Lyamani, H.; Olmo, F.J.; Alados-Arboledas, L. Physical and optical properties of aerosols over an urban location in Spain: Seasonal and diurnal variability. Atmos. Chem. Phys. 2010, 10, 239–254. [Google Scholar] [CrossRef] [Green Version]
  46. Basart, S.; Pérez, C.; Cuevas, E.; Baldasano, J.M.; Gobbi, G.P. Aerosol characterization in Northern Africa, Northeastern Atlantic, Mediterranean Basin and Middle East from direct-sun AERONET observations. Atmos. Chem. Phys. Discuss. 2009, 9, 8265–8282. [Google Scholar] [CrossRef] [Green Version]
  47. Sun, Y.; Zhuang, G.; Wang, Y.; Zhao, X.; Li, J.; Wang, Z.; An, Z. Chemical composition of dust storms in Beijing and implications for the mixing of mineral aerosol with pollution aerosol on the pathway. J. Geophys. Res. Space Phys. 2005, 110, 24. [Google Scholar] [CrossRef]
  48. Verma, S.; Prakash, D.; Ricaud, P.; Payra, S.; Attié, J.; Soni, M. A new classification of aerosol sources and types as measured over Jaipur, India. Aerosol Air Qual. Res. 2014, 15, 985–993. [Google Scholar] [CrossRef]
  49. Li, J.; E Carlson, B.; Dubovik, O.; A Lacis, A. Recent trends in aerosol optical properties derived from AERONET measurements. Atmos. Chem. Phys. Discuss. 2014, 14, 12271–12289. [Google Scholar] [CrossRef] [Green Version]
  50. Spracklen, D.V.; Logan, J.A.; Mickley, L.J.; Park, R.J.; Yevich, R.; Westerling, A.L.; Jaffe, D.A. Wildfires drive interannual variability of organic carbon aerosol in the western U.S. in summer. Geophys. Res. Lett. 2007, 34. [Google Scholar] [CrossRef] [Green Version]
  51. Kalu, A.E. The African dust plume: Its characteristics and propagation across West Africa in winter. Scope 1979, 14, 95–118. [Google Scholar]
  52. Ogunjobi, K.O.; He, Z.; Simmer, C. Spectral aerosol optical properties from AERONET Sunphotometric measurements over West Africa. Atmos. Res. 2008, 88, 89–107. [Google Scholar] [CrossRef]
  53. Pinker, R.T.; Pandithurai, G.; Holben, B.N.; Dubovik, O.; Aro, T.O. A dust outbreak episode in sub-Sahel West Africa. J. Geophys. Res. Atmos. 2001, 106, 22923–22930. [Google Scholar] [CrossRef]
  54. Wagner, F.; Bortoli, D.; Pereira, S.; Costa, M.J.; Silva, A.M.; Weinzierl, B.; Esselborn, M.; Petzold, A.; Rasp, K.; Heinold, B.; et al. Properties of dust aerosol particles transported to Portugal from the Sahara desert. Tellus B Chem. Phys. Meteorol. 2009, 61, 297–306. [Google Scholar] [CrossRef] [Green Version]
  55. Granados-Muñoz, M.J.; Navas-Guzmán, F.; Bravo-Aranda, J.A.; Guerrero-Rascado, J.L.; Lyamani, H.; Fernández-Gálvez, J.; Alados-Arboledas, L. Automatic determination of the planetary boundary layer height using lidar: One-year analysis over southeastern Spain. J. Geophys. Res. Space Phys. 2012, 117. [Google Scholar] [CrossRef] [Green Version]
  56. Cachorro, V.E.; Burgos, M.A.; Mateos, D.; Toledano, C.; Bennouna, Y.; Torres, B.; Frutos, Á.M.; Herguedas, Á. Inventory of African desert dust events in the north-central Iberian Peninsula in 2003–2014 based on sun-photometer–AERONET and particulate-mass–EMEP data. Atmos. Chem. Phys. 2016, 16, 8227–8248. [Google Scholar] [CrossRef] [Green Version]
  57. Dey, S.; Tripathi, S.N.; Singh, R.P.; Holben, B.N. Influence of dust storms on the aerosol optical properties over the Indo-Gangetic basin. J. Geophys. Res. Space Phys. 2004, 109. [Google Scholar] [CrossRef] [Green Version]
  58. Pöschl, U.; Martin, S.T.; Sinha, B.; Chen, Q.; Gunthe, S.S.; Huffman, J.A.; Borrmann, S.; Farmer, D.K.; Garland, R.M.; Helas, G.; et al. Rainforest aerosols as biogenic nuclei of clouds and precipitation in the Amazon. Science 2010, 329, 1513–1516. [Google Scholar] [CrossRef] [PubMed] [Green Version]
  59. Ma, Y.; Xin, J.; Ma, Y.; Kong, L.; Zhang, K.; Zhang, W.; Wang, Y.; Wang, X.; Zhu, Y. Optical properties and source analysis of aerosols over a desert area in Dunhuang, Northwest China. Adv. Atmos. Sci. 2017, 34, 1017–1026. [Google Scholar] [CrossRef]
  60. Gharibzadeh, M.; Alam, K.; Abedini, Y.; Bidokhti, A.A.; Masoumi, A.; Bibi, H.; Zeb, B. Climatological analysis of the optical properties of aerosols and their direct radiative forcing in the Middle East. J. Atmos. Sol. Terr. Phys. 2019, 183, 86–98. [Google Scholar] [CrossRef]
  61. Kubilay, N.; Cokacar, T.; Oguz, T. Optical properties of mineral dust outbreaks over the northeastern Mediterranean. J. Geophys. Res. Space Phys. 2003, 108. [Google Scholar] [CrossRef]
  62. Logothetis, S.A.; Salamalikis, V.; Kazantzidis, A. Aerosol classification in Europe, Middle East, North Africa and arabian Peninsula based on AERONET version 3. Atmos. Res. 2020, 239, 104893. [Google Scholar] [CrossRef]
  63. Kaufman, Y.J.; Tanré, D.; Boucher, O. A satellite view of aerosols in the climate system. Nature 2002, 419, 215–223. [Google Scholar] [CrossRef]
  64. Ward, D.E.; Hao, W.M.; Susott, R.A.; Babbitt, R.E.; Shea, R.W.; Kauffman, J.B.; Justice, C.O. Effect of fuel composition on combustion efficiency and emission factors for African savanna ecosystems. J. Geophys. Res. Atmos. 1996, 101, 23569–23576. [Google Scholar] [CrossRef]
  65. Kumar, K.R.; Kang, N.; Sivakumar, V.; Griffith, D. Temporal characteristics of columnar aerosol optical properties and radiative forcing (2011–2015) measured at AERONET’s Pretoria_CSIR_DPSS site in South Africa. Atmos. Environ. 2017, 165, 274–289. [Google Scholar] [CrossRef] [Green Version]
  66. Bond, T.C.; Doherty, S.J.; Fahey, D.W.; Forster, P.M.; Berntsen, T.; DeAngelo, B.J.; Flanner, M.G.; Ghan, S.; Kärcher, B.; Koch, D.; et al. Bounding the role of black carbon in the climate system: A scientific assessment. J. Geophys. Res. Atmos. 2013, 118, 5380–5552. [Google Scholar] [CrossRef]
  67. Van Marle, M.J.E.; Field, R.D.; Van der Werf, G.R.; Wagt, I.A.; Houghton, R.A.; Rizzo, L.V.; Artaxo, P.; Tsigaridis, K. Fire and deforestation dynamics in Amazonia (1973–2014). Glob. Biogeochem. Cycles 2017, 31, 24–38. [Google Scholar] [CrossRef] [PubMed] [Green Version]
  68. Reid, J.S.; Eck, T.F.; Christopher, S.A.; Koppmann, R.; Dubovik, O.; Eleuterio, D.P.; Holben, B.N.; Reid, E.A.; Zhang, J. A review of biomass burning emissions part III: Intensive optical properties of biomass burning particles. Atmos. Chem. Phys. 2005, 5, 827–849. [Google Scholar] [CrossRef] [Green Version]
  69. Schultz, M.G.; Heil, A.; Hoelzemann, J.J.; Spessa, A.; Thonicke, K.; Goldammer, J.G.; Held, A.C.; Pereira, J.M.C.; Bolscher, M.V.H. Global wildland fire emissions from 1960 to 2000. Glob. Biogeochem. Cycles 2008, 22. [Google Scholar] [CrossRef]
  70. Meyer, C.P.M.; Luhar, A.K.; Mitchell, R.M. Biomass burning emissions over northern Australia constrained by aerosol measurements: I—Modelling the distribution of hourly emissions. Atmos. Environ. 2008, 42, 1629–1646. [Google Scholar] [CrossRef]
  71. Jung, J.; Lee, H.; Kim, Y.J.; Liu, X.; Zhang, Y.; Hu, M.; Sugimoto, N. Optical properties of atmospheric aerosols obtained by in situ and remote measurements during 2006 Campaign of Air Quality Research in Beijing (CAREBeijing-2006). J. Geophys. Res. Space Phys. 2009, 114. [Google Scholar] [CrossRef]
  72. Kang, N.; Kumar, K.R.; Yu, X.; Yin, Y. Column-integrated aerosol optical properties and direct radiative forcing over the urban-industrial megacity Nanjing in the Yangtze River Delta, China. Environ. Sci. Pollut. Res. 2016, 23, 17532–17552. [Google Scholar] [CrossRef]
  73. Xia, X.; Che, H.; Zhu, J.; Chen, H.; Cong, Z.; Deng, X.; Fan, X.; Fu, Y.; Goloub, P.; Jiang, H.; et al. Ground-based remote sensing of aerosol climatology in China: Aerosol optical properties, direct radiative effect and its parameterization. Atmos. Environ. 2016, 124, 243–251. [Google Scholar] [CrossRef]
  74. Che, H.; Xia, X.; Zhu, J.; Li, Z.; Dubovik, O.; Holben, B.N.; Goloub, P.; Chen, H.; Estelles, V.; Cuevas-Agulló, E.; et al. Column aerosol optical properties and aerosol radiative forcing during a serious haze-fog month over North China Plain in 2013 based on ground-based sunphotometer measurements. Atmos. Chem. Phys. 2014, 14, 2125–2138. [Google Scholar] [CrossRef] [Green Version]
  75. Yoon, S.C.; Won, J.G.; Omar, A.H.; Kim, S.-W.; Sohn, B.-J. Estimation of the radiative forcing by key aerosol types in worldwide locations using a column model and AERONET data. Atmos. Environ. 2005, 39, 6620–6630. [Google Scholar] [CrossRef]
  76. Rupakheti, D.; Kang, S.; Rupakheti, M.; Cong, Z.; Tripathee, L.; Panday, A.K.; Holben, B.N. Observation of optical properties and sources of aerosols at Buddha’s birthplace, Lumbini, Nepal: Environmental implications. Environ. Sci. Pollut. Res. 2018, 25, 14868–14881. [Google Scholar] [CrossRef]
  77. Wan, X.; Kang, S.; Li, Q.; Rupakheti, D.; Zhang, Q.; Guo, J.; Chen, P.; Tripathee, L.; Rupakheti, M.; Panday, A.K.; et al. Organic molecular tracers in the atmospheric aerosols from Lumbini, Nepal, in the northern Indo-Gangetic Plain: Influence of biomass burning. Atmos. Chem. Phys. 2017, 17, 8867–8885. [Google Scholar] [CrossRef] [Green Version]
  78. Ding, A.J.; Huang, X.; Nie, W.; Sun, J.N.; Kerminen, V.-M.; Petäjä, T.; Su, H.; Cheng, Y.F.; Yang, X.-Q.; Wang, M.H.; et al. Enhanced haze pollution by black carbon in megacities in China. Geophys. Res. Lett. 2016, 43, 2873–2879. [Google Scholar] [CrossRef]
  79. Ichoku, C.; Kaufman, Y.J.; Remer, L.A.; Levy, R. Global aerosol remote sensing from MODIS. Adv. Space Res. 2004, 34, 820–827. [Google Scholar] [CrossRef]
  80. Lee, J.; Kim, J.; Lee, H.C.; Takemura, T. Classification of aerosol type from MODIS and OMI over East Asia. Asia Pac. J. Atmos. Sci. 2007, 43, 343–357. [Google Scholar]
  81. Alam, K.; Trautmann, T.; Blaschke, T.; Subhan, F. Changes in aerosol optical properties due to dust storms in the Middle East and Southwest Asia. Remote Sens. Environ. 2014, 143, 216–227. [Google Scholar] [CrossRef]
  82. Mitchell, R.M.; Forgan, B.W.; Campbell, S.K.; Qin, Y. The climatology of Australian tropical aerosol: Evidence for regional correla tion. Geophys. Res. Lett. 2013, 40, 2384–2389. [Google Scholar] [CrossRef]
  83. Eck, T.F.; Holben, B.N.; E Ward, D.; Mukelabai, M.M.; Dubovik, O.; Smirnov, A.; Schafer, J.S.; Hsu, N.C.; Piketh, S.J.; Queface, A.J.; et al. Variability of biomass burning aerosol optical characteristics in southern Africa during the SAFARI 2000 dry season campaign and a comparison of single scattering albedo estimates from radiometric measurements. J. Geophys. Res. Space Phys. 2003, 108. [Google Scholar] [CrossRef]
  84. Radhi, M.; Box, M.A.; Box, G.P.; Mitchell, R.M. Biomass-burning aerosol over northern Australia. Aust. Meteorol. Oceanogr. J. 2012, 62, 25. [Google Scholar] [CrossRef]
  85. Rizzo, L.V.; Correia, A.L.; Artaxo, P.; Procópio, A.S.; Andreae, M.O. Spectral dependence of aerosol light absorption over the Amazon Basin. Atmos. Chem. Phys. 2011, 11, 8899–8912. [Google Scholar] [CrossRef] [Green Version]
  86. Ward, D.E.; Susott, R.A.; Kauffman, J.B.; Babbitt, R.E.; Cummings, D.L.; Dias, B.; Holben, B.N.; Kaufman, Y.J.; Rasmussen, R.A.; Setzer, A.W. Smoke and fire characteristics for cerrado and deforestation burns in Brazil: BASE-B experiment. J. Geophys. Res. Atmos. 1992, 97, 14601–14619. [Google Scholar] [CrossRef] [Green Version]
Figure 1. The flowchart of classification base on PLDR (particle linear depolarization ratio) and SSA (single scatter albedo) in 1020 nm.
Remotesensing 13 01114 g001
Figure 2. Scatter plots of AOD, AE, SSA, PLDR, AAOD, AAE distribution in the global range. The color dot in each station implies the mean values in the color bar.
Remotesensing 13 01114 g002
Figure 3. Spatial distribution of four kinds of aerosol. The color dot in each station implies the values of occurrence frequency in the color bar.
Remotesensing 13 01114 g003
Figure 4. Temporal distribution of dust and dust dominated aerosols. The color dot in each station implies the values of occurrence frequency in the color bar.
Remotesensing 13 01114 g004
Figure 5. Temporal distribution of pollution dominated mixture. The color dot in each station implies the values of occurrence frequency in the color bar.
Remotesensing 13 01114 g005
Figure 6. Temporal distribution of strongly absorbing aerosols. The color dot in each station implies the values of occurrence frequency in the color bar.
Remotesensing 13 01114 g006
Figure 7. Temporal distribution of weakly absorbing aerosol. The color dot in each station implies the values of occurrence frequency in the color bar.
Remotesensing 13 01114 g007
Figure 8. The net radiative forcing and radiative forcing efficiency for each kind of aerosol (dust and dust dominated aerosols, pollution dominated mixture, strongly absorbing aerosols, weakly absorbing aerosols), the color dot in each site means the mean values of net radiative forcing or the net radiative forcing efficiency.
Remotesensing 13 01114 g008
Figure 9. The contour map for four kinds of aerosol categories retrieved from VIIRS Deep Blue Production (the blank implies the absence of corresponding aerosol).
Remotesensing 13 01114 g009
Figure 10. Regression plots about the AOD from AERONET Version 3 Level 2.0 dataset against AOD from VIIRS Deep Blue Production in four stations of India and Pakistan (different colored lines and points suggest data from different places).
Remotesensing 13 01114 g010
Table 1. The latitude, longitude and quantity of valid data (if the PLDR are available) collected from 52 stations used in this research. The stations are grouped in eight regions.
RegionStationLatitudeLongitudeQuantity of Valid DataTime Series (Year)
South AmericaAlta Floresta−9.9−56.13822008–2020
Campo Grande SONDA−20.4−54.52612007–2017
CUIABA MIRANDA−15.7−56.15212009–2019
Manaus EMBRAPA−2.9−60.01162011–2018
Rio Branco−10.0−67.92552009–2019
Guadeloupe16.2−61.51002008–2020
North AmericaAmes42.0−93.81332004–2020
Bonanza Creek64.7−148.31032005–2019
BONDVILLE40.1−88.41442010–2020
Bozeman45.7−111.01692008–2019
Bratts Lake50.2−104.71112001–2012
GSFC39.0−76.84402007–2019
Lisco41.0−73.31032009–2019
Mexico City19.3−99.24342007–2017
Missoula46.9−114.11082009–2019
Middle East IMS METU ERDEMLI36.634.37802005–2015
Mezaira23.153.819502008–2019
Solar village25.046.437982003–2015
AsiaBandung−6.9107.64172009–2020
CAMS40.0116.312152012–2019
Dushanbe38.668.99252010–2020
Gwangju GIST35.2126.810662004–2019
Issyk Kul42.677.073492010–2020
jaipur27.075.831222009–2018
Kanpur26.580.294842010–2020
Karachi24.967.116482007–2020
Lumbini27.583.311642013–2019
Manila Observatory14.6121.12162009–2020
Nha trang12.2109.221562011–2019
Osaka34.7135.65002009–2019
Pune18.573.829392004–2019
Silpakorn Univ13.8100.055312009–2020
SACOL35.9104.111282006–2013
Xuzhou CUMT34.2117.146312013–2019
AustraliaJabiru−12.7132.91832009–2020
Lake Argyle−16.1128.73582009–2019
EuropeBarcelona41.42.11852008–2020
Chilbolton51.1−1.41472010–2020
EL Arenosillo37.1−6.71062009–2019
Granada37.2−3.62362010–2020
Hamburg53.610.01692003–2019
Lecce University40.318.12892010–2020
Moscow MSU MO55.737.51042008–2020
North AfricaCairo30.131.331912010–2019
Cape Verde16.7−23.06452009–2020
Koforidua ANUC6.1−0.37642015–2020
Ilorin8.54.723772009–2019
Tamanrasset INM22.85.510722006–2020
South AfricaMongu−15.323.212072000–2010
Gobabeb−23.615.01782014–2019
Skukuza−25.031.62872004–2020
SEGC Lope Gabon−0.211.63292015–2019
Publisher’s Note: MDPI stays neutral with regard to jurisdictional claims in published maps and institutional affiliations.

