Article

Detection of a Dust Storm in 2020 by a Multi-Observation Platform over the Northwest China

1
Key Laboratory for Semi-Arid Climate Change of the Ministry of Education, College of Atmospheric Sciences, Lanzhou University, Lanzhou 730000, China
2
Forecast Department, Gansu Province Environmental Monitoring Center, Lanzhou 730020, China
3
School of Atmospheric Sciences, Key Laboratory of Tropical Atmosphere-Ocean System of the Ministry of Education, Sun Yat-sen University, Zhuhai 519082, China
4
Southern Marine Science and Engineering Guangdong Laboratory (Zhuhai), Zhuhai 519082, China
5
Forecast Department, Lanzhou Ecological Environment Monitoring Center, Lanzhou 730000, China
6
Marketing Center, Wuxi CAS Photonics Co., Ltd., Wuxi 214135, China
*
Author to whom correspondence should be addressed.
Remote Sens. 2021, 13(6), 1056; https://doi.org/10.3390/rs13061056
Submission received: 29 December 2020 / Revised: 1 March 2021 / Accepted: 2 March 2021 / Published: 10 March 2021

Abstract

:
Dust storms have occurred frequently in northwest China and can dramatically reduce visibility and exacerbate air quality in downwind regions through long-range transport. In order to study the distribution characteristics of dust particles sizes, structures and concentrations in the process of dust storm, especially for the vertical distributions, the multi-observation platform composed of six Lidars and nine aerosol analytical instruments is first used to detect a severe dust storm event, which occurred in Northwest China on 3 May 2020. As a strong weather system process, the dust storm has achieved high intensity and wide range. When the intensity of a dust storm is at its strongest, the ratios of PM2.5 (particulate matter with diameter < 2.5 µm) and PM10 (particulate matter with diameter < 10 µm) (PM2.5/PM10) in cities examined were less than 0.2 and the extinction coefficients became greater than 1 km−1 based on Lidar observations. In addition, the growth rates of PM2.5 were higher than that of PM10. The dust particles mainly concentrated at heights of 2 km, after being transported about 200–300 km, vertical height increased by 1–2 km. Meanwhile, the dust concentration decreased markedly. Furthermore, the depolarization ratio showed that dust in the Tengger Desert was dominated by spherical particles. The linear relationships between 532 nm extinction coefficient and the concentration of PM2.5 and PM10 were found firstly and their R2 were 0.706 to 0.987. Our results could give more information for the physical schemes to simulate dust storms in specific models, which could improve the forecast of dust storms.

1. Introduction

In recent decades, dust storms have occurred frequently, along with climate change, on a global scale [1,2]. Global dust storms mainly come from the Sahara desert, the Middle East, Central Asia and East Asia [3,4,5]. With atmospheric circulation, dust particles mixed with bacteria, viruses, minerals and other chemical components are transported thousands of kilometers to downwind regions [6,7,8], which may affect the climate [9,10,11,12,13], environment [8,14], biology [15], and human activities and health [16,17]. Therefore, dust event monitoring is not only providing great help for dust forecast, early warning and ecological environment impact assessment, but also has a profound and lasting impact on global climate change and human life [13].
Generally, observations from the air quality automatic stations are commonly used to study dust events. However, limited by monitoring techniques, these datasets can’t reflect the vertical characteristics of dust particles, which may lead to larger uncertainties in the research of dust events. As advanced aerosol monitoring equipment, satellite remote sensing can provide monitoring results in regional and global scales, and these datasets are widely used in meteorology [18], environmental [19], hydrology [20], agriculture [21] and other disciplines. In particular, a lot of remarkable progress has been made in the remote sensing monitoring of dust events. For example, a new dust index based on Moderate Resolution Imaging Spectroradiometer (MODIS) data has been proposed and evaluated based on ground observations in different locations in Japan, which could help to understand these Asian dust events better [22]. Based on the MODIS data from 2002 to 2011, dust storm detections in Saudi Arabia were studied [23]. Yu et al. [24] estimated the African dust deposition flux and loss frequency along the trans-Atlantic transit by using three-dimensional distributions of aerosol retrieved from Cloud-Aerosol Lidar with Orthogonal Polarization (CALIOP) and MODIS. Based on the ground observation data and CALIPSO (The Cloud-Aerosol Lidar and Infrared Pathfinder Satellite Observation) data, the dust storm event occurred over the Taldamakan desert in the spring 2015 was evaluated, which was simulated by WRF-Chem model [25]. However, Yerong W. et al. [26] mentioned that the uncertainties in the MODIS aerosol optical depth (AOD) still had deviation due to the assumed aerosol optical properties and the vertical distribution of aerosols, and their research had shown that the aerosol vertical distribution had a great impact on AOD retrievals. Konsta D. et al. [27] analyzed the limitations and uncertainties of CALIPSO in detecting strong dust activities, which led to differences in simulation and observation over Bodele and Algeria dust sources. MODIS is an important sensor on terra and Aqua satellites. Terra passes through the equator at about 10:30 local time from north to south, and Aqua is at about 13:30 local time from south to north. The two satellites cooperate with each other to observe the complete earth surface every 1–2 days. Therefore, they are unsuitable for detecting rapidly changing events such as a dust storm.
The Himawari-8 was launched on 7 October 2014, as stationary satellites with a time resolution of 10 min, and its spatial resolution is 0.5 to 2 km based on different bands. It provides new levels of capacity for the identification and tracking of rapidly changing weather phenomena and for the derivation of quantitative products [28]. Lu S., et al. [29] used a simple dust process to compare the AOD retrieved from himawari-8 with that retrieved from AERONET and MODIS. These results showed a good agreement between them. Xia X., et al. [30] verified the positive effects of forecasts by assimilating the AOD data from Himawari-8. Zhang Z.Y., et al. [31] evaluated the performance of AOD data from Himawari-8 based on sixteen sun-photometers stations in Aerosol Robotic Network (AERONET) over China. The correlation (R2) between AHI AOD and ground AOD was 0.67, and there were large differences between AOD from Himawari-8 and MODIS aerosol products, especially for Northwest China. Although Himawari-8 can better detect the dust event based on high temporal resolution, it is impossible to detect the atmospheric conditions under the clouds, which are important over these regions, especially for human activity areas. In recent years, ground-based Lidar has been continually set up to observe the meteorology and environment due to its unique advantages of high spatial and temporal resolution. The ground-based Lidar could detect aerosol optical properties, realize the temporal and spatial distribution characteristics of aerosol particle in the atmosphere, and provide scientific basis for the generation, dissipation, transportation and evolution of pollutants, especially for dust storm weather. Due to the fact that light-scattering characteristics of aerosol particles were altered after up-taking water vapor, Tong Wu et al. [32] studied the aerosol hygroscopic growth from micropulse Lidar. A long-range transported Saharan dust over Sofia, Bulgaria was detected by two-wavelength (1064/532 nm) Lidar including the optical, microphysical, and dynamical properties of dust aerosols at different stages [33]. The results shown that the dust backscatter-related Angstrom exponents (BAEs) values were in the range of 0.3 to 0.6 (±0.2), which indicated domination of coarse particles in the micron size range. Using an instrumented balloon and a ground-based Raman Lidar over Tsukuba, Japan, the influence of Asian mineral dust on an ice cloud formation in the upper troposphere was investigated, and the results pointed that the predominance of nonspherical particles were in the range of 6 to 12 km [34].
In order to make up for the ground monitoring and understand the temporal and spatial evolution characteristics of particulate matter, the relationship of mass concentration of PM2.5 and extinction coefficient is studied. Also, the distribution and transport of fine particles by using mobile Lidar was discussed by Lv L.H. et al. [35], and they found that the southwestern Beijing was the main dust transport pathway. Xiang Y. et al. [36] used linear and exponential models to retrieve PM2.5 concentration based on extinction coefficient from 355 nm Lidar, and the results showed that the PM2.5 concentration and the measured values of the two models had a strong correlation coefficient. The surface PM mass distribution was obtained by synergy usage of satellite and Lidar measurements [37], and the results showed that the correlation coefficients between the estimated aerosol extinction coefficients and the surface PM mass were 0.57–0.86 for PM2.5 and 0.59–0.78 for PM10, respectively.
Nevertheless, most of the above studies were based on a single Lidar, and a single Lidar is difficult to reveal the source, transmission and development trend of sand and dust. On the other hand, the fitting formula obtained by a single Lidar does not necessarily apply to all dust processes in all regions. Therefore, a multi-observation platform is need to research the dust transport processes. In order to obtain the temporal and spatial distribution information of dust, especially the vertical distribution, and solve the problem of single dust monitoring, it is useful to establish the multi-observation platform including six Lidars and nine aerosol analytical instruments. In addition, the relationship between PM2.5 mass concentration and extinction coefficient was studied mostly; however, few studies researched the relationship between PM10 mass concentration and extinction coefficient.
This paper analyzed the occurrence and development process of a severe dust event in Northwest China on 3 May 2020. It revealed the evolution characteristics of particles in the dust event, especially the dust vertical characteristics. Moreover, it estimated the particles concentration in vertical through fitting the extinction coefficient with particles concentration.
The data and methodology are introduced briefly in Section 2. The cause, transmission and development of the dust event and the extinction coefficient fitting the particulate concentration are shown in Section 3. Section 4 gives the conclusion and possible further improvements to this study.

2. Data and Methodology
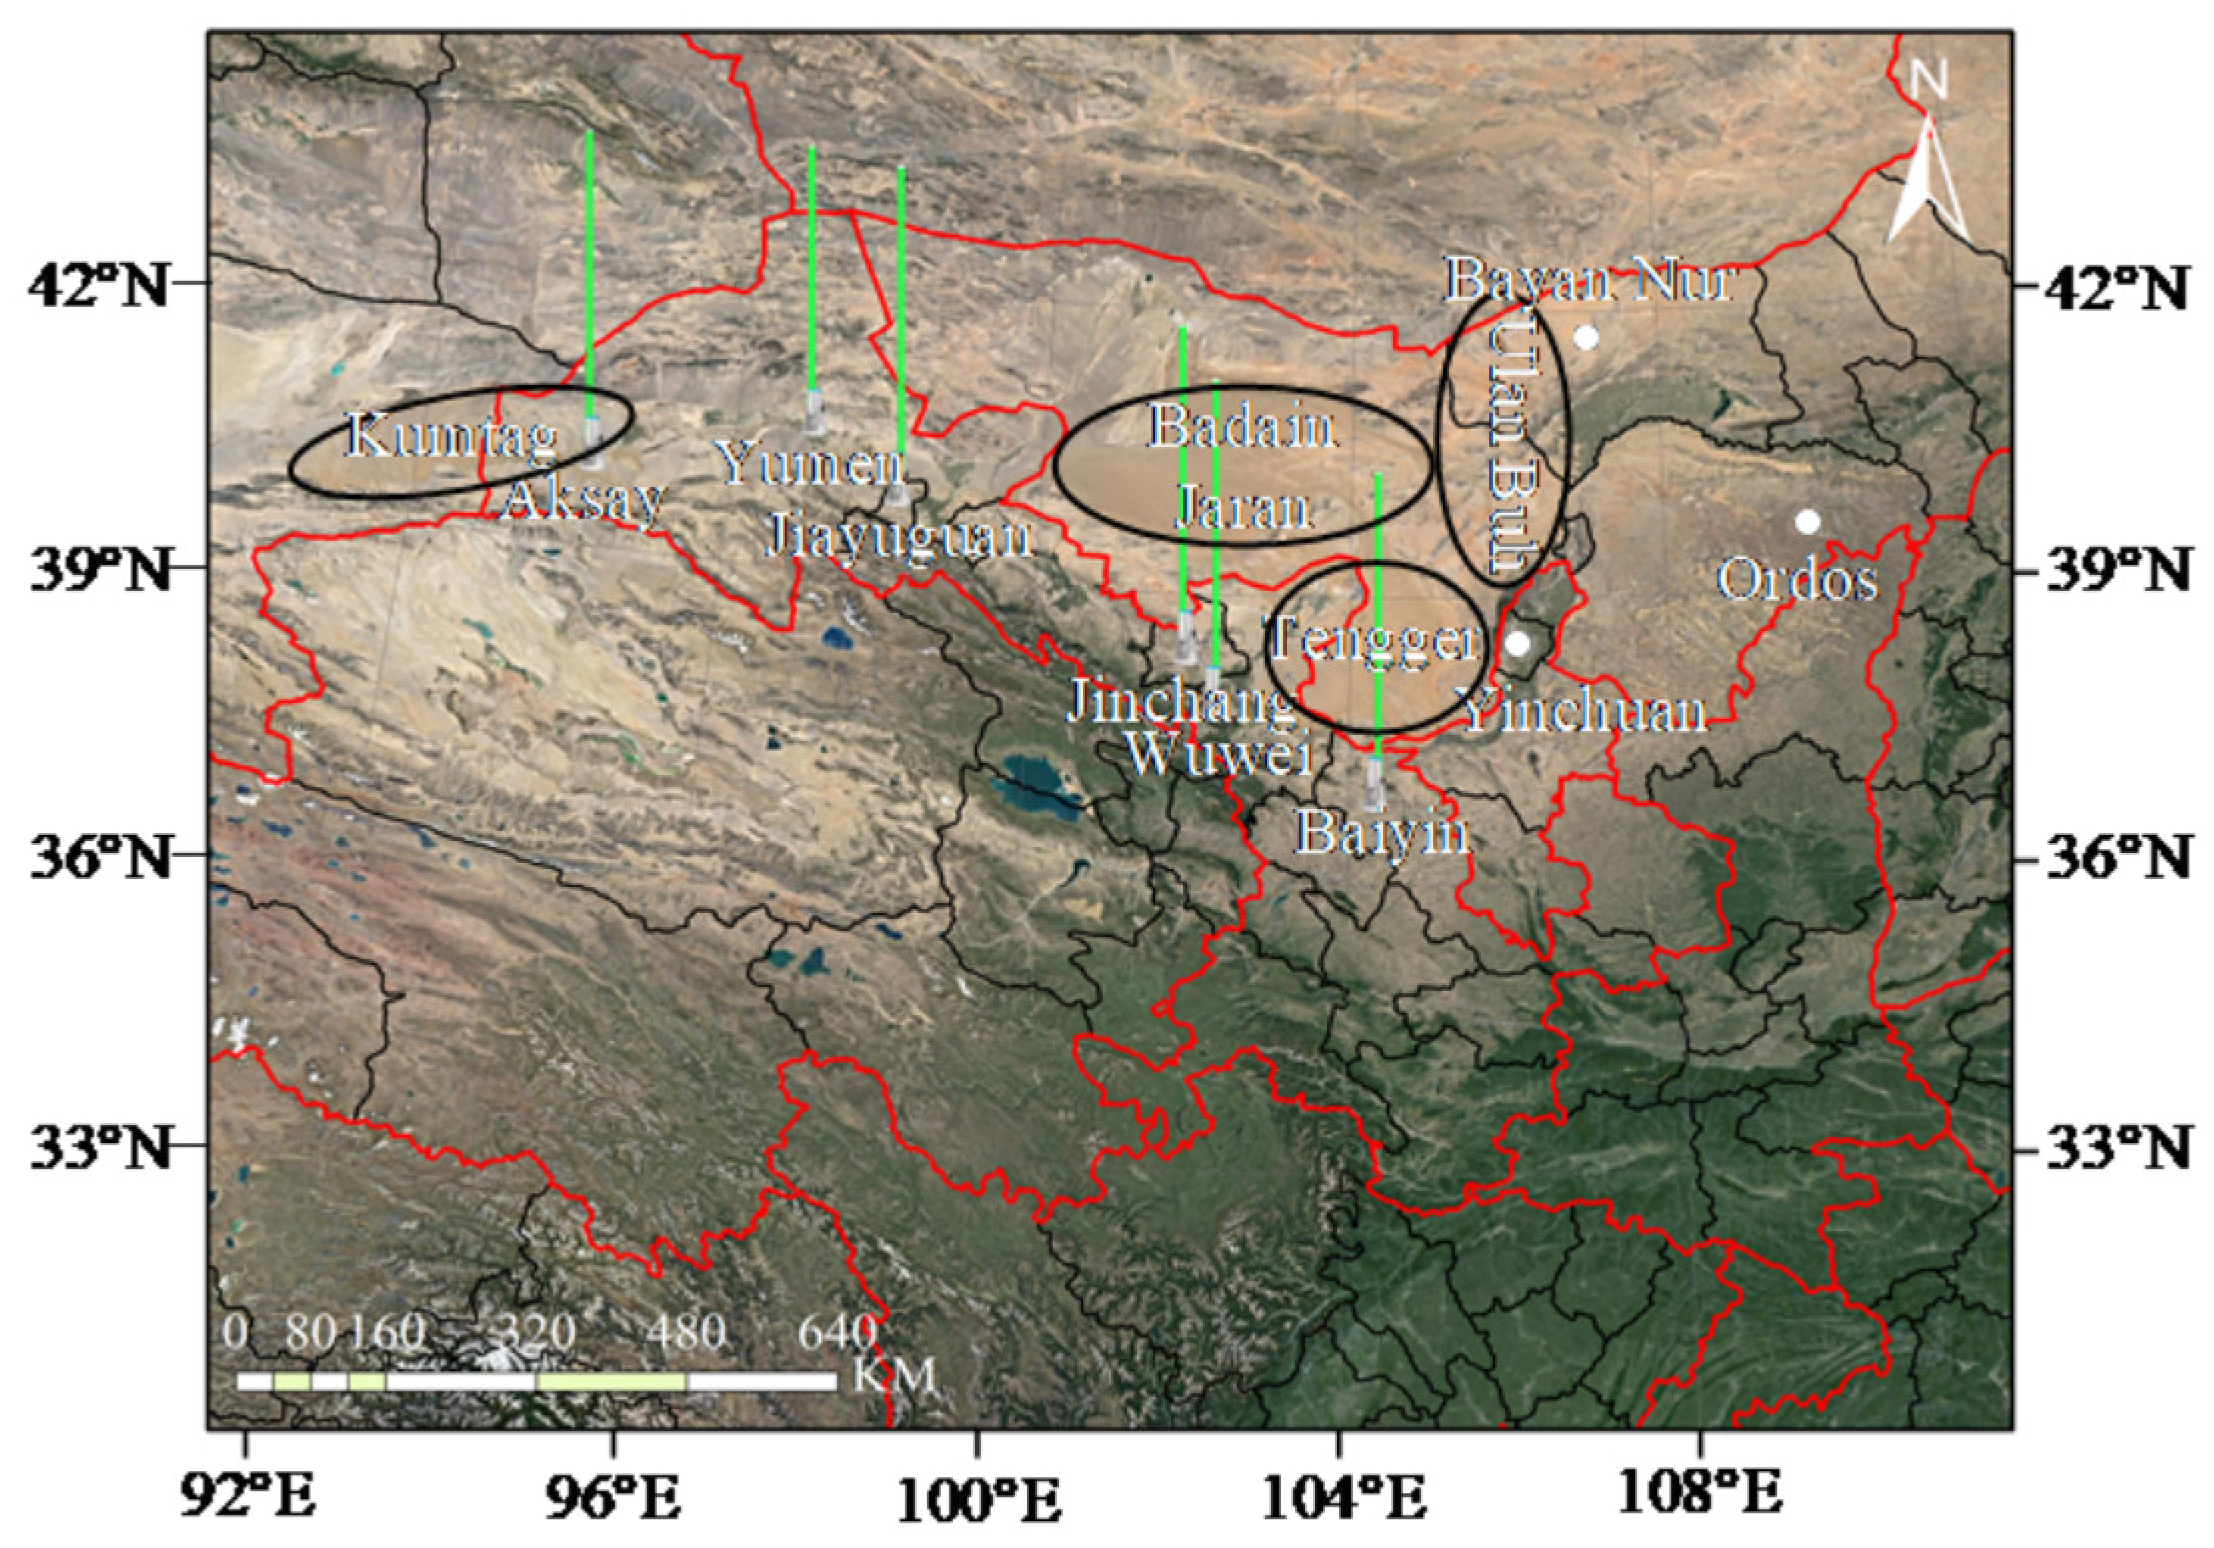
2.1. Lidars

2.1.1. Instrumentation

The Lidars (Light Detection and Ranging) in the study are all dual wavelength three channel Lidar, the main performance are shown in Table 1. The laser emits pulses of a specific wavelength (355 nm, 532 nm) and enters the atmosphere after collimation and expansion. The particles in the atmosphere produce the Mie scattering [38,39]. The scattering light with the direction of 180° (backscattering) is received by the telescope system, and is divided into three channels, which are 355 nm, 532 nm parallel and 532 nm vertical light. The echo of the three channels are detected by the detection system, and then it is retrieved to the extinction coefficient and depolarization ratio to study the atmosphere.

2.1.2. Retrieval Method for the Extinction Coefficient

The backscattering echo power P(r) of atmospheric molecules and aerosol particles at distance r received by Lidar can be expressed as follows [40]:
P ( r ) = P t k r 2 [ β m ( r ) + β a ( r ) ] exp { 2 0   r [ α m ( r ) + α a ( r ) ] d r }
where Pt is the laser emission power (W), K is the Lidar system constant (W·km3·Sr), βa(r) and βm(r) are the backscattering coefficients (km−1·Sr−1) of aerosol particles and atmospheric molecules at distance r, respectively. αa(r) and αm(r) are the extinction coefficients (km−1) of aerosol particles and atmospheric molecules at distance r, respectively.
The most frequently used retrieval methods for the extinction coefficient α(r) are Collis method, Klett method and Fernald method [41]. Most studies [35,36,42,43] have proved that the retrieval method of extinction coefficient by Fernald is not only mature and stable, but also has the smallest error. The formula for the aerosol extinction coefficient can be written as [44]:
α a ( r ) = ( S a S m ) α m ( r ) + P ( r ) r 2 exp [ 2 ( S a S m 1 ) r r c α m ( r ) d r ] P ( r c ) r 2 α a ( r c ) + S a S m α m ( r c ) + 2 r r c P ( r ) r 2 exp [ 2 ( S a S m 1 ) r r c α m ( r ) d r ] d r
where Sa = αa(r)/βa(r), Sa depends on the incident laser wavelength, the size spectrum distribution of atmospheric aerosol particles and refractive index, and the numerical value is generally between 0 ~ 90. It is assumed that they are constants, which means that the size spectrum and chemical composition of atmospheric aerosol particles do not change with the altitude, and the extinction and scattering characteristics change only due to the change of their number density. For 532 nm wavelength, Sa = 50 [45,46]. Sm = αm(r)/βm(r), according to the Rayleigh scatter theory, Sm is generally taken as 8π/3 [47].

2.1.3. Retrieval Method for the Depolarization Ratio

The depolarization ratio δ(r) of polarization Lidar can be expressed as follows [47]:
δ ( r ) =   P r s ( r ) / k s P r p ( r ) / k p = k P r s ( r ) P r p ( r )
where Prs(r) and Prp(r) are the backscattering echo power of the vertical and parallel channel at distance r, respectively. ks and Kp are the gain constant ratio of the vertical and parallel channel, respectively. k = kp/ks.
The depolarization ratio of atmospheric molecules is very small with the value of 0.0297 [48]. The depolarization ratio mainly comes from the nonspherical particles [47], and the dust event is mainly nonspherical particles.

2.1.4. The Fitting Method between Particulate Mass Concentration and Extinction Coefficient, Depolarization Ratio

Due to the extinction coefficient reflecting the particle mass concentration, some researchers [35,36,49] have studied their relationship. In this study, the formula Mp = + c is used for the PM2.5 and PM10 mass concentration. Mp = b + c is used for the PM10-PM2.5 mass concentration. Mp is the particle mass concentration. α is the extinction coefficient. a, b, and c are all specific coefficients.

2.1.5. Lidar Network

Based on the dust transmission and the characteristics of dust particles in different regions, Gansu Environmental Monitoring Center of China has built a Lidar network in Gansu Province in 2020. In the dust storm event, six Lidars, which captured the process, were selected for further study. The six Lidars distribution are shown in Figure 1 and their coordinates are shown in Table 2. Figure 1 also shows the topographic and geomorphic features of Northern China. Obviously, there are large deserts at the junction between Gansu Province and Inner Mongolia. The black circles in the Figure 1 represent Badain Jaran Desert (the third largest desert in China), Tengger Desert (the fourth largest desert in China), Kumtag desert (the sixth largest desert in China), Ulan Buh Desert (the eighth largest desert in China). The green lines represent the six Lidars stations. It can be seen that the Lidars are mainly distributed around the deserts. The white dots represent the locations of the cities examined in the dust process besides the six Lidars stations; the red lines represent the provincial boundaries.

2.2. Ground Observation Data

Nine aerosol analytical instruments were used to monitor the surface PM2.5 and PM10 concentrations. More detail data information can be found in China National Environmental Monitoring Centre (CNEMC) (http://www.cnemc.cn/ (accessed on 28 December 2020)). The average daily temperature of the cities examined were derived from Air Quality Online Monitoring and Analysis Platform (https://www.aqistudy.cn/ (accessed on 28 December 2020)). Besides, datasets used to analyze the synoptic situation are taken from NCEP/NCAR reanalysis (https://psl.noaa.gov/data/gridded/data.ncep.reanalysis.html (accessed on 28 December 2020)). The data are used for quality control and assimilated various data (ground, ship, radiosonde, anemometer balloon, aircraft, satellite, etc.) with horizontal grid distance of 2.5° × 2.5° and 17 isobaric surfaces (1000, 925, 850, 700, 600, 500, 400, 300, 250, 200, 150, 100, 70, 50, 30, 20, 10).

3. Results and Discussion

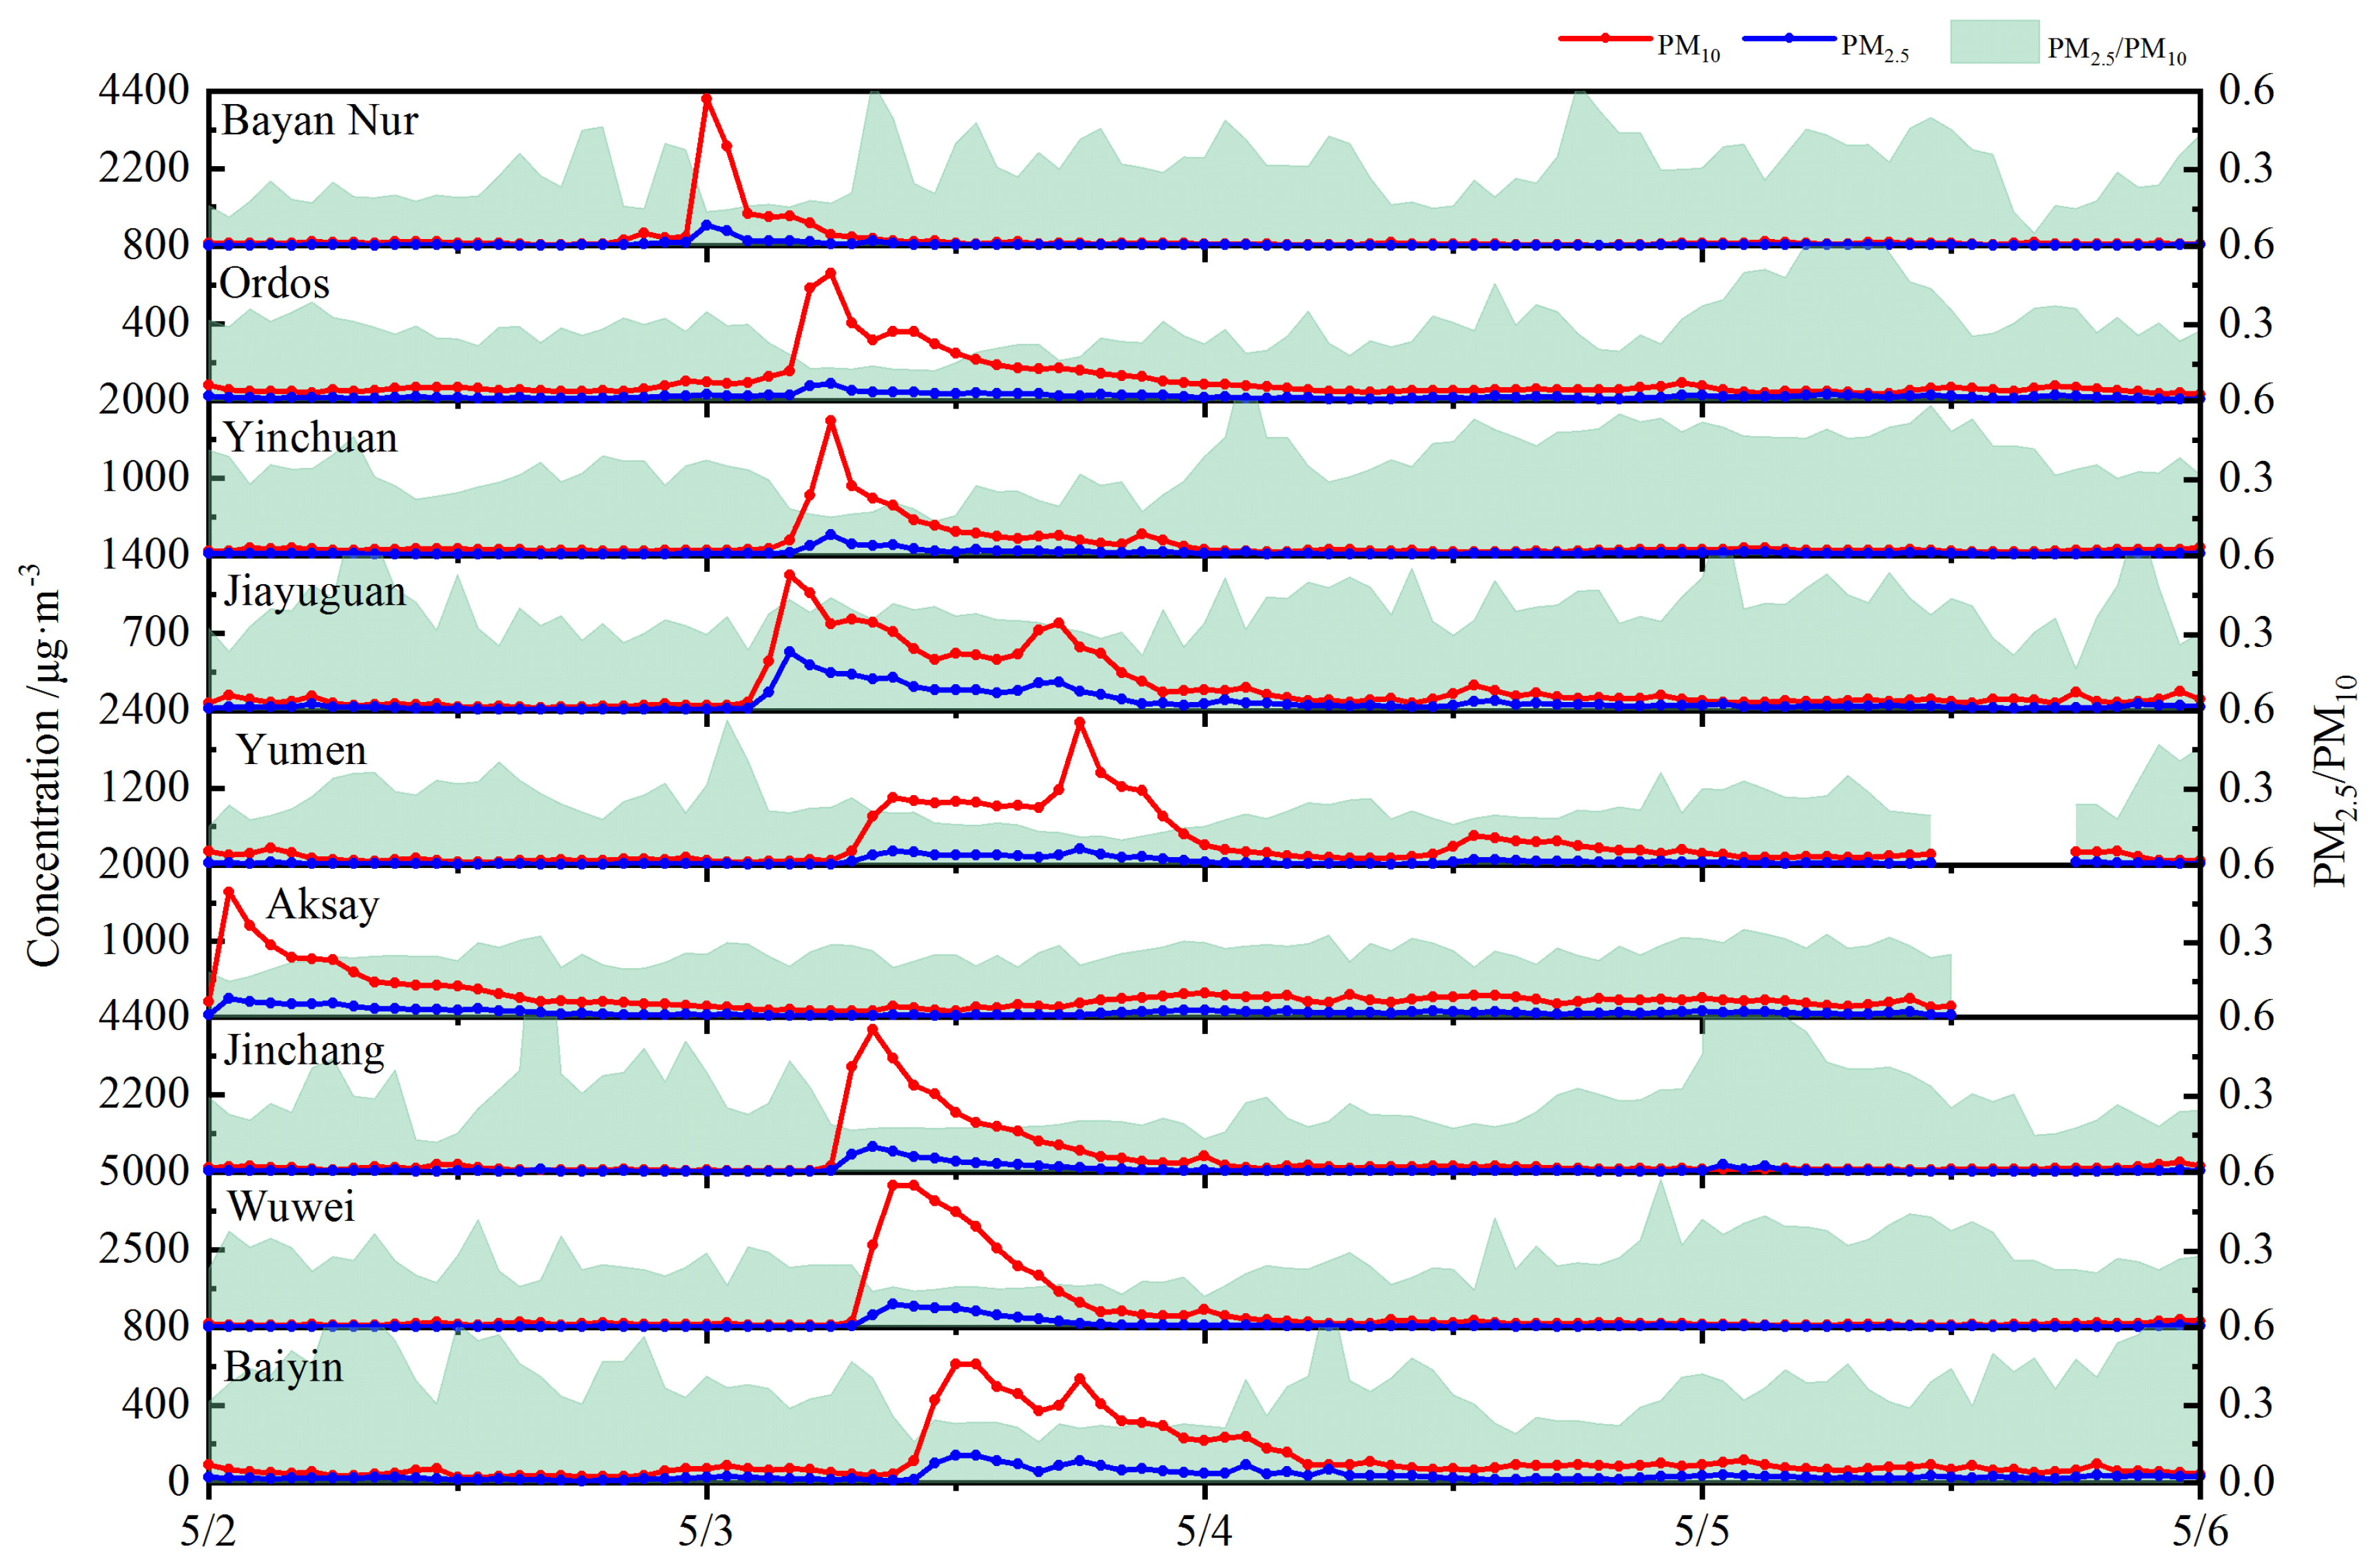
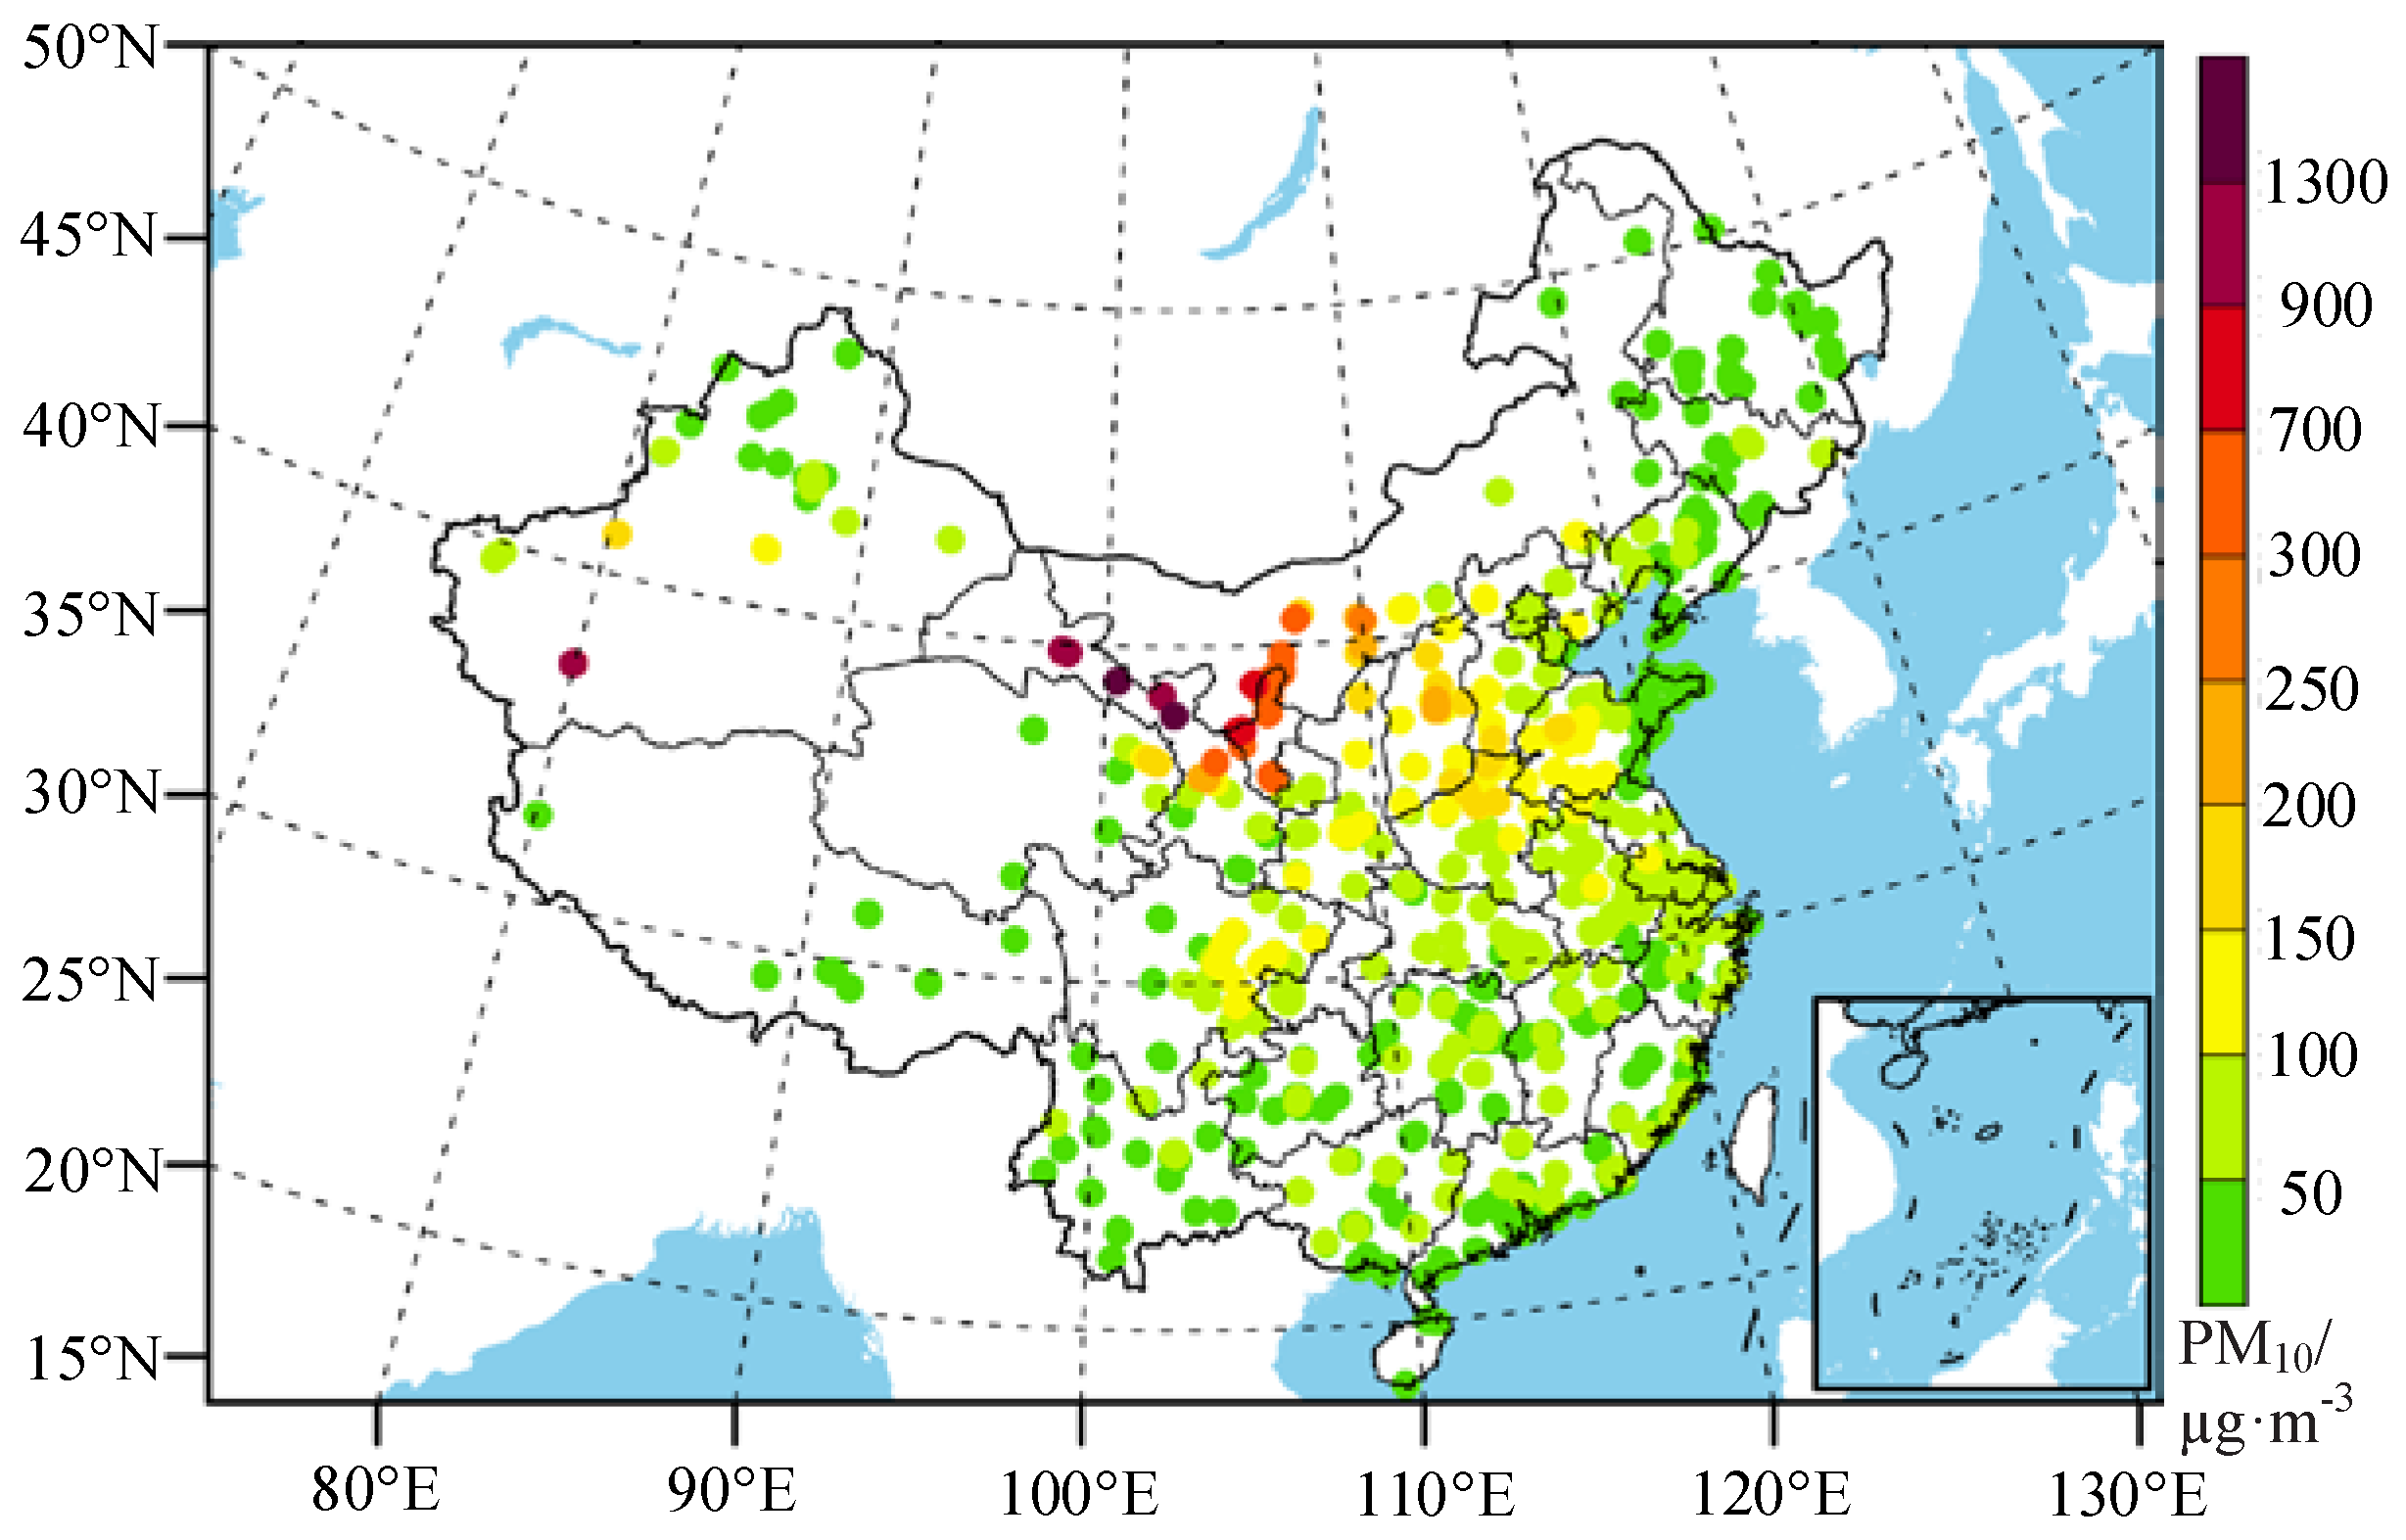
3.1. Analysis of the Concentration of Particles Monitored on the Ground

A severe dust event occurred in Northwest China on 3 May 2020. In order to understand the transportation of the dust, Figure 2 shows the hourly variation of PM10 and PM2.5 mass concentrations in the cities examined. The red and blue dotted lines represent the PM10 and PM2.5, respectively, and the green shadows represent the values of PM2.5/PM10. It can be seen that Bayan Nur which neared Ulan Buh Desert was affected firstly by the dust event, and the PM10 concentration suddenly increased to 4171 µg·m−3 at 00:00 on 3 May. Then, the dust moved southwest under the influence of a surface northeast wind. At 04:00, the dust event reached Jiayuguan with a peak surface PM10 concentration of 1224 µg·m−3. The maximum PM10 concentration in Ordos and Yinchuan occurred at 06:00 with a value of 657 µg·m−3 and 1741 µg·m−3, respectively. Different from other cities, Yumen was affected by the dust storm in a long term from 09:00 to 18:00, and the maximum concentration of PM10 was about 2215 µg·m−3. When the dust was transported to Aksay, its intensity was obviously weakened with the maximum PM10 concentration of 317 µg·m−3. The concentration of PM10 reached 4053 µg·m−3 at 08:00 in Jinchang and 4591 µg·m−3 at 09:00 in Wuwei. The dust intensity gradually weakened when it was transported to Baiyin and the peak concentration of PM10 was 612 µg·m−3. In addition, except for Yumen and Aksay, the PM10 concentration in other cities reached the peak within two hours after being affected by the dust. Jinchang and Wuwei had been affected severely, and their hourly PM10 concentration exceeded 4000 µg·m−3, which were about 27 times of the daily average secondary standard of PM10 (150 µg·m−3) [50], according to China’s air pollutant concentration limit standard.
Due to the variation of PM2.5 concentration being consistent with that of PM10 in this dust event, the peak values of PM2.5 and PM10 concentration occured at the same time. The corresponding maximum concentrations of PM2.5 in Bayan Nur, Ordos, Yinchuan, Yumen, Jinchang and Wuwei were 584 µg·m−3, 89 µg·m−3, 271 µg·m−3, 261 µg·m−3, 720 µg·m−3 and 750 µg·m−3, respectively. Also, the corresponding values of PM2.5/PM10 were 0.14, 0.14 0.16, 0.12, 0.18 and 0.16, respectively. The smaller values of PM2.5/PM10 (all were less than 0.2) indicated that the proportions of fine particles in the dust event were very small. The peak concentration of PM2.5 in Baiyin was 140 µg·m−3 and the value of PM2.5/ PM10 was 0.23. The proportion of fine particles was significantly larger than that in upstream cities, which indicated that the proportion of fine particles was gradually increasing when the dust was transported to downstream areas. It is worth noting that the PM2.5 concentration reached 530 µg·m−3, and the value of PM2.5/PM10 was 0.43 in Jiayuguan at 04:00, which indicated that the proportion of the fine particles was similar to the coarse particles. Moreover, during the study period, the values of PM2.5/PM10 of Jiayuguan were significantly higher than that in other cities, which indicated that Jiayuguan had more local dust than other cities.
Significantly, the dust storm event disappeared in the early morning on 4 May (Figure 2). In order to understand the impact of the dust over the whole China, the daily average concentrations of PM10 on 4 May are analyzed (as shown in Figure 3). The dust storm event had a significant impact on most cities in Northern China. Although the duration was short, the intensity was very strong, especially in Inner Mongolia, Ningxia and Gansu Province. The daily average PM10 concentrations of some stations were close to 1500 µg·m−3, which is 10 times of the daily average secondary standard of PM10.

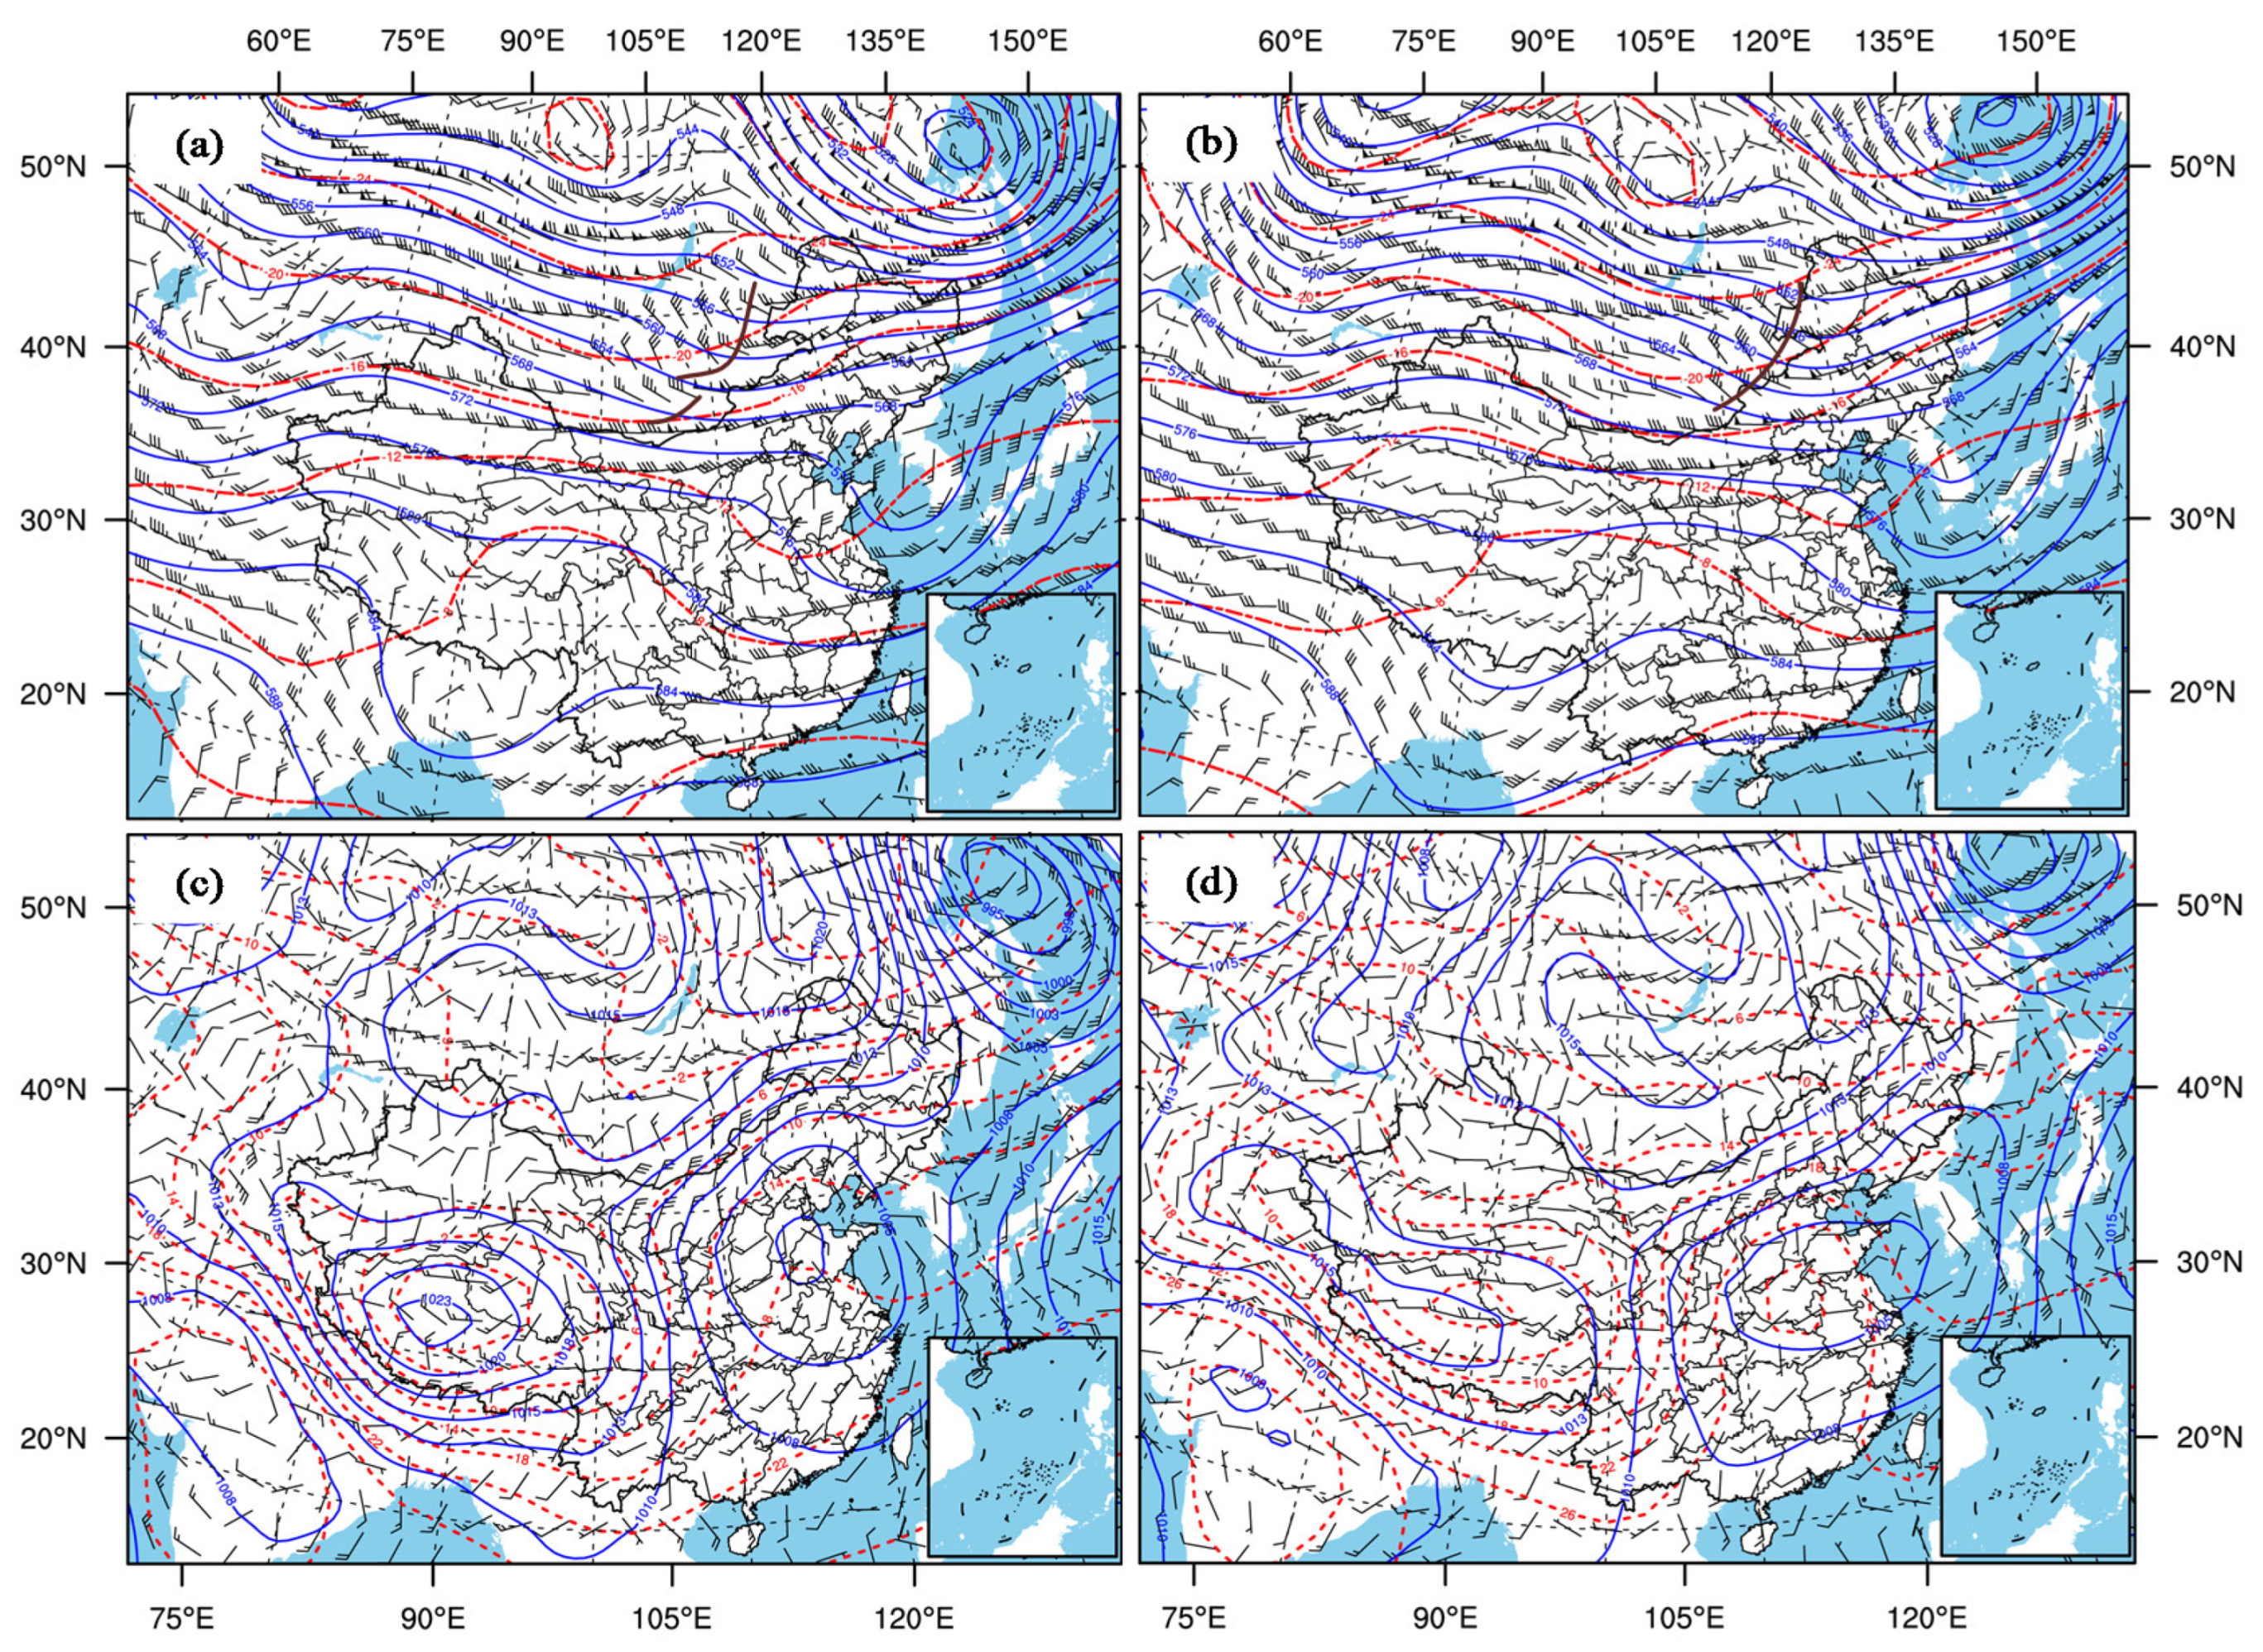
3.2. Meteorological Conditions Causing the Dust

3.2.1. Dynamic Conditions

In order to analyze the dynamic conditions of the dust, Figure 4a,b show the 500 hPa synoptic situation at 20:00 on the 2nd and 08:00 on the 3rd, respectively. The blue solid lines represent the height, and the red dotted lines represent the temperature. Significantly, there were two troughs and one ridge at 50°N. The cold trough was over the west of Baikal Lake and an upper-level trough was over Mongolia. Inner Mongolia was located in the trough area. The temperature trough lagged behind the height trough, and the wind fields were vertical to the temperature fields. That is to say, the cold advection behind the trough was strong. With the continuous accumulation of cold air, the height trough would be further strengthened and became the guiding system for the ground cold air movement. At 08:00 on the 3rd, the cold trough over west of Baikal Lake moved eastward to Baikal Lake. Meanwhile, its tail was located in the northwest of Hexi, which belonged to Northwest Gansu. In addition, at 20:00 on the 2nd, the high level of westerly jet stream appeared in Inner Mongolia and Gansu, and strengthened at 08:00 on the 3rd. The sandstorm was likely to occur at the right rear, where the high level of westerly jet entered. The relationship between the upper jet stream and the dust was consistent with the result of Cheng et al. [51].
According to the analysis of the surface synoptic situation, Hexi and Inner Mongolia were located in the front of the surface high pressure at 20:00 on the 2nd (Figure 4c), and the cold front at the junction of Mongolia and Inner Mongolia moved slowly to the southeast. The strong wind after the cold front caused sand in the Badain Jaran Desert and Tengger Desert to rise, and then the dust particles were transported to the southeast. At 08:00 on the 3rd (Figure 4d), the cold front arrived near Jinchang and Wuwei, and brought the dust storm event. With the cold front pressing southward, the gale behind the front was mainly located in the Midwest of Inner Mongolia and Hexi. Since then, the high latitude vortex weakened, and the northwest jet stream continuously transported cold air to the southeast.
The northern section of the high trough had reached the mountain area in the northwest of Greater Khingan Range in China, and the southern part was still in the middle of Hexi. At 14:00 on the 3rd, the cold front moved out of Gansu, the southward movement of the cold center and high pressure center weaked. In combination with the surface cold center and high pressure center, the direction of cold front gradually turned to the east-west. Due to the dominant airflow of upper-level being mainly the westerly jet stream at the bottom of the upper-level trough, the ground cold front on the 3rd moved mainly eastward. Meanwhile, the dust particles gradually moved to the downstream cities. However, due to the maintenance of a weak east wind, the settlement was relatively slow. The center of cold and high pressure moved eastward obviously, and Jinchang and Wuwei were at the bottom of high pressure. The strong wind behind the front was northerly, bringing the dust particles to these areas.

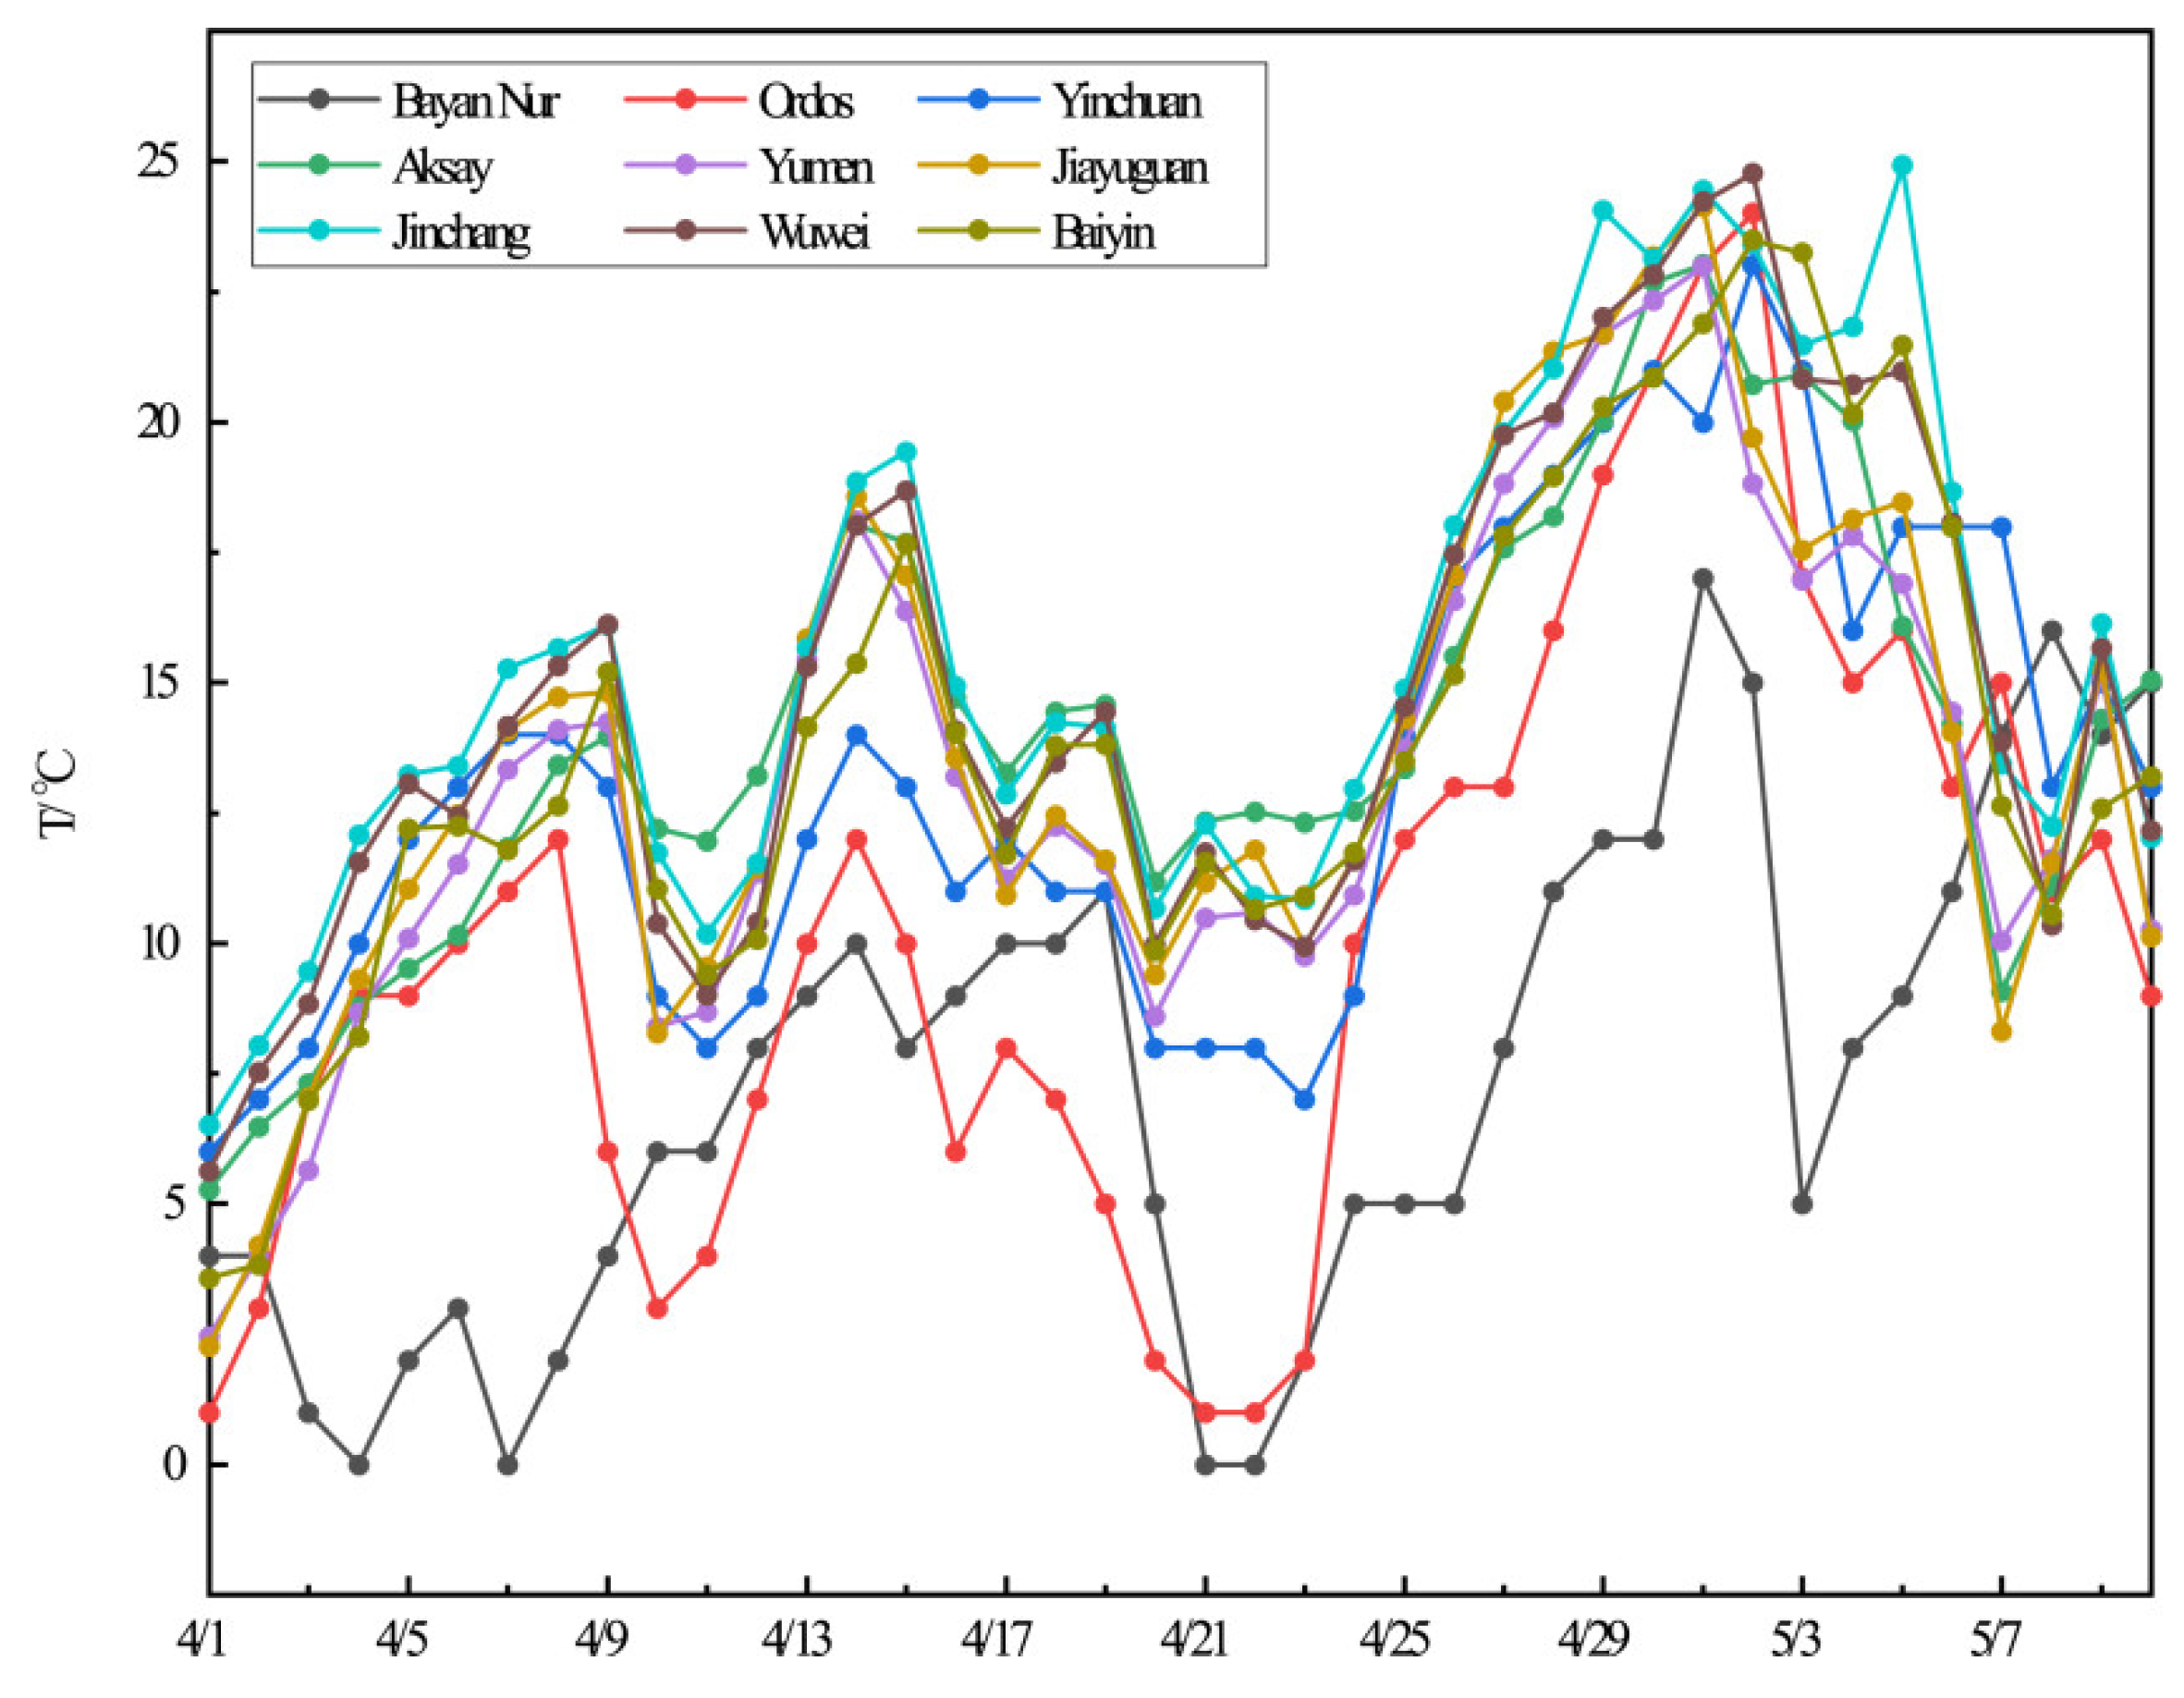
3.2.2. Thermal Conditions

In order to further analyze the thermal conditions that caused the sandstorm, the daily average temperatures of the cities examined from 1 April to 10 May were analyzed in Figure 5. Obviously, the temperatures of cities examined continued to rise from 23 April to 2 May, and the rising range was about 10 °C. After the occurrence of sand dust and the invasion of cold air, the temperature of each city gradually decreased. In the early stage, the rising temperature and lack of precipitation led to the dust process.
Due to continuous heating over many days, the dust storm occurred over the desert regions. In addition, the cold air guided by high trough and high level of westerly jet stream gave rise to the dust emission, and more dust particles were brought into the atmosphere. In the atmosphere, the dust particles were transported westward firstly following the northeast wind, then transported southeastward with the surface cold front.

3.3. Results from Lidar Network

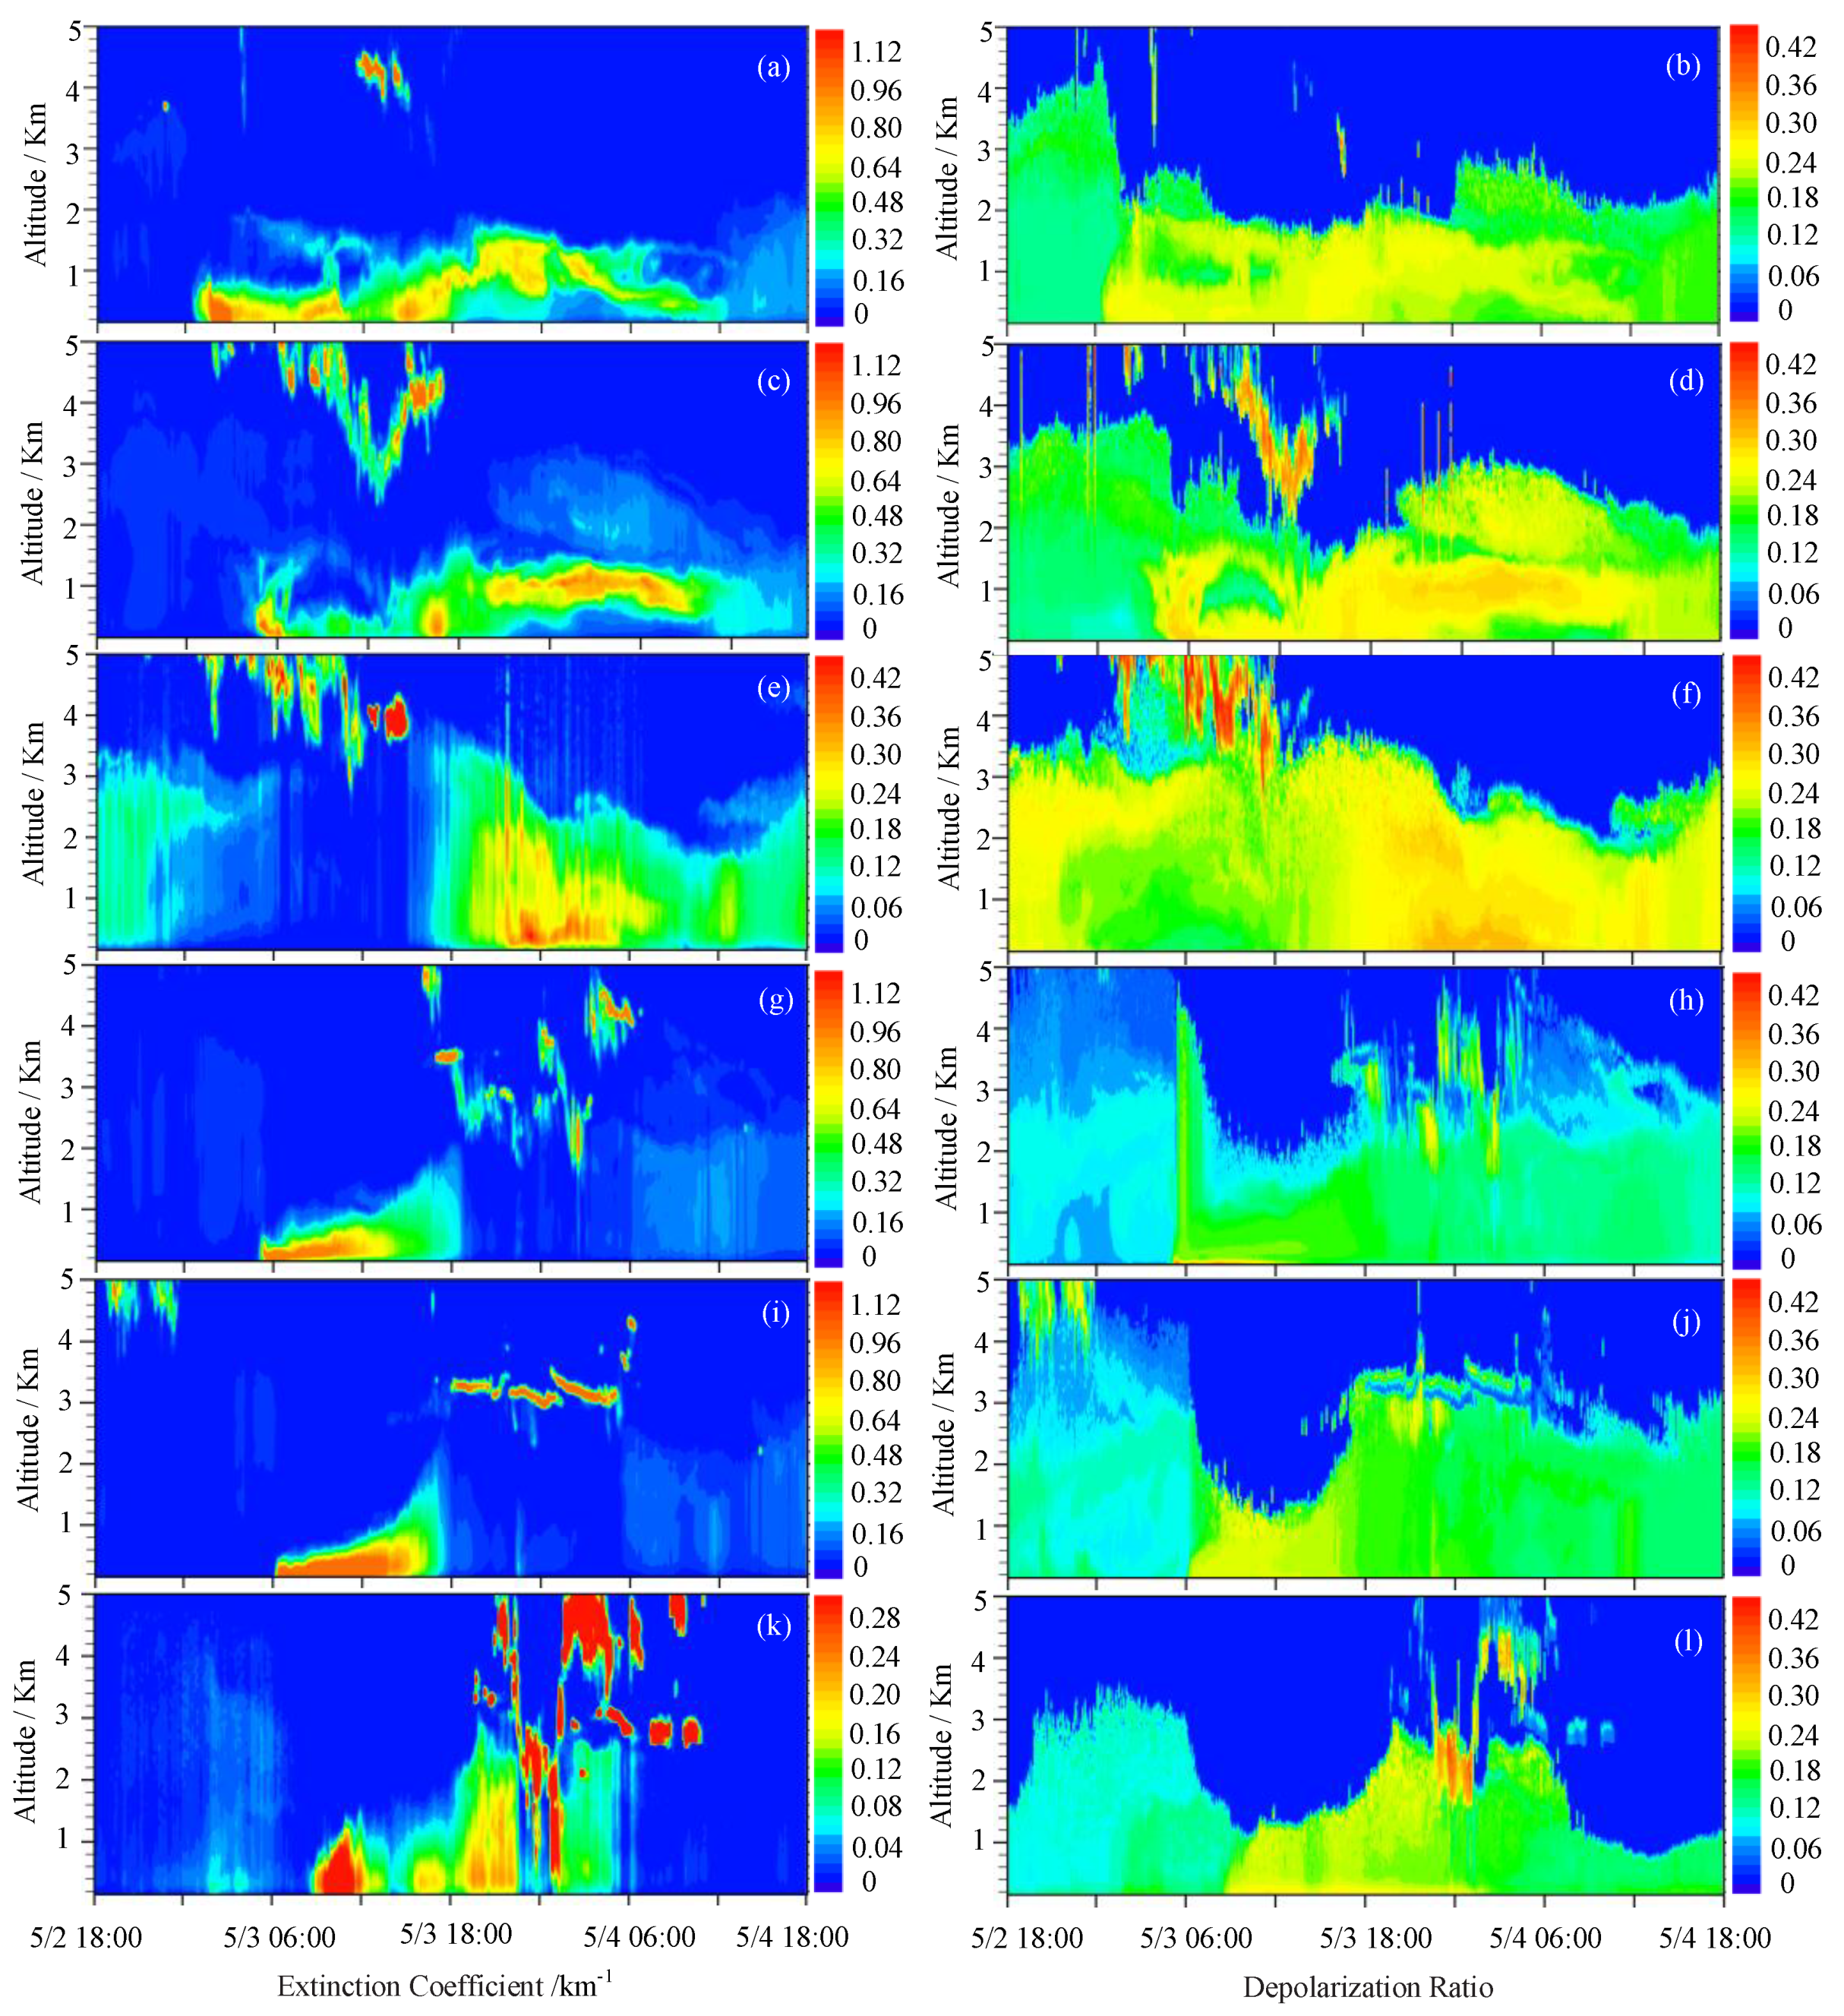
3.3.1. Extinction Coefficient and Depolarization Ratio

In order to understand the source, transmission, evolution trend and impact on urban air quality of the sandstorm further, six Lidars were used to study the temporal and spatial distribution characteristics of the sandstorm in the process of long-distance and cross-border transportation, especially in regards to the vertical distribution characteristics of dust. In this paper, only the retrieval products with wavelength of 532 nm are studied. Due to the Lidar blind area and the vertical development height of dust, the extinction coefficient and depolarization ratio of 0.15–5 km height retrieved by Lidars are shown in Figure 6.
Extinction coefficient of Jiayuguan Lidar (Figure 6a) show that the dust storm began at 02:00 on the 3rd, and the lower layer extinction coefficient suddenly increased from less than 0.1 km−1 to more than 0.6 km−1. The extinction coefficient was greater than 1 km−1 from 02:00 to 04:00. There was a pollution belt at the height of 1–2 km from 02:00 to 12:00 on the 3rd, in which the extinction coefficient was obviously small. In addition, there was a fault phenomenon with the pollution lower layer, which indicates that the dust in the height was mainly external transmission. At the duration, the sudden increase of extinction coefficient at the height of 1 km indicated that the dust was mainly concentrated in 1 km height. The dust mainly concentrated in the height of 1–2 km from 18:00 on the 3rd to 00:00 on the 4th, and then subsided and dissipated gradually. The extinction coefficient was still closed to 1 km−1 at 1.0 km height from 00:00 to 06:00 on the 4th, and it led to the ground particulate concentration increasing again in the future. Corresponding to Figure 2, it is found that the ground particulate concentration in Jiayuguan showed a slight upward trend at the same time, and the PM10 concentration increased to 228 µg·m−3 at 13:00. The extinction coefficient and depolarization ratio (Figure 6b) of Jiayuguan Lidar were lager, but the depolarization ratio did not change significantly with the increasing of extinction coefficient. It is attributed that the change of aerosol morphology was stable in the dust process.
The extinction coefficient of Yumen Lidar (Figure 6c) suddenly increased to 0.8 km-1 from the lower layer to 1.5 km height at about 06:00 on the 3rd, but the duration was very short. The dust mainly concentrated in the height of 0.6 km from 06:00 to 13:00 with the extinction coefficient in the range of 0.2–0.3 km−1, and the corresponding ground PM10 concentration was maintained at 500–1000 µg·m−3. From 21:00 on the 3rd to 12:00 on the 4th, the lower layer extinction coefficient decreased obviously, but there was obvious dust pollution zone in the height of 0.5–1.5 km, which implied that the ground particulate concentration would increase in the future. Corresponding to Figure 2, the ground particulate concentration in Yumen showed a small upward trend, and PM10 concentration increased again to 457 µg·m−3 at 13:00. Compared with the depolarization ratio of Yumen Lidar (Figure 6d), the results were similar to those obtained from Jiayuguan Lidar. When the extinction coefficient was large, the corresponding depolarization ratio was also large. However, with the increasing of extinction coefficient, the depolarization ratio did not change significantly.
When the dust was transported to Aksay, which is about 330 km away from Jiayuguan, the dust intensity had been obviously weakened, the extinction coefficient of Aksay (Figure 6e) was significantly lower than that of Jiayuguan and Yumen. Since 18:00 on the 3rd, the extinction coefficient slightly increased to about 0.2 km−1, and the corresponding ground particulate concentration also increased, but this range was small. PM10 concentration reached the maximum of 317 µg·m−3 at 00:00 on the 4th. The extinction coefficient of Aksay Lidar was low, but the development height of dust was high, which was close to 4 km. It is expected that the particulate concentration of ground would increase slightly in the future. Compared with Jiayuguan and Yumen Lidars, the biggest difference existed in the depolarization ratio (Figure 6f). The extinction coefficient of Aksay Lidar was not high, but the depolarization ratio was obviously higher than that of Jiayuguan and Yumen, indicating that the proportion of irregular particles in Aksay was significantly higher than that in Jiayuguan and Yumen.
Due to Jinchang and Wuwei being very close to each other and adjacent to the Tengger Desert, the detection results of the two Lidars were very close. The extinction coefficients (Figure 6g,i) of Jinchang Lidar and Wuwei Lidar at the height of 0.6 km altitude suddenly increased to about 1 km−1 at 05:00 and 06:00, respectively, which shown that dust aerosols were mainly concentrated in the height of 0.6 km. The high extinction coefficient of Jinchang lasted for about 7 h and that of Wuwei lasted for about 9 h. The maximum PM10 hourly concentration was more than 4000 µg·m−3 in Wuwei, which was more serious than Jinchang. At this time, the Lidar extinction coefficient of Jinchang and Wuwei were very small above the height of 0.8 km, which indicated that the height of dust was not high. In other words, the dust concentration near the ground was very strong, but the height was not high, of which it was expected that the future dust weather intensity would be large but the duration would be short. After 18:00, the extinction coefficient of the two Lidars decreased significantly, and the corresponding particulate concentration of ground decreased significantly. Although the particle concentrations in Jinchang and Wuwei were very high and the corresponding extinction coefficients were large, their Lidar depolarization ratios were reduced significantly compared with Jiayuguan, Yumen and Aksay. This indicates that the particles in Jinchang and Wuwei were more spherical than those in Jiayuguan, Yumen and Aksay, especially in Jinchang.
With the cold air moving southeast, the intensity had been obviously weakened when the dust was transported to Baiyin (about 280 km away from Jinchang), the extinction coefficient (Figure 6k) slightly increased at 9:00–12:00 on the 3rd, ranging from 0.1 km−1 to 0.3 km−1, and then the extinction coefficient decreased significantly. From 18:00 on the 3rd to 00:00 on the 4th, the dust mainly concentrated in the height of 1 km, and the extinction coefficient increased again to 0.2 km−1. Compared with Jinchang, the height of dust increased by 2–3 km. The precipitation process occurred at 00:00 on the 4th. Due to the high extinction of water vapor, the extinction coefficient increased abruptly from near ground to 3 km height. The dust concentration decreased gradually by wet sedimentation. During the dust period, the depolarization ratio of Baiyin Lidar (Figure 6l) was about 0.23, which was close to Wuwei and larger than that of Jinchang.
Combined with the weather synoptic, the dust in Jiayuguan, Yumen and Aksay were affected mainly by Badain Jaran Desert, while the dust in Jinchang, Wuwei and Baiyin mainly came from adjacent Tengger Desert. According to the Lidar extinction coefficient and depolarization ratio, it was found that when the extinction coefficient was large, the depolarization ratio was large, but with the increase of extinction coefficient, the depolarization ratio did not change obviously. The high concentration of dust mainly concentrated within 1 km and the height of dust was about 2 km near the sand source. The height of dust was not high, resulting in a short distance to the downstream. The vertical development increased by 1–2 km with the horizontal transmission was about 200–300 km, and the concentration decreased significantly. The extinction coefficient of Aksay Lidar was significantly lower than that of Jiayuguan and Yumen, but the depolarization ratio was very high, while similarly, the extinction coefficient of Baiyin Lidar was significantly lower than that of Jinchang and Wuwei, but the depolarization ratio was very high. These indicated that irregular particles were easier to transmit downstream than spherical particles in the dust process. It is also possible that the proportion of irregular particles increased because spherical particles were easily made into sedimentation. The extinction coefficients of Jinchang and Wuwei Lidars were significantly higher than those of Jiayuguan and Yumen were, but the depolarization ratios were smaller obviously, which indicated that the dust particles in Tengger Desert were closer to sphere than those in Badain Jaran Desert were.

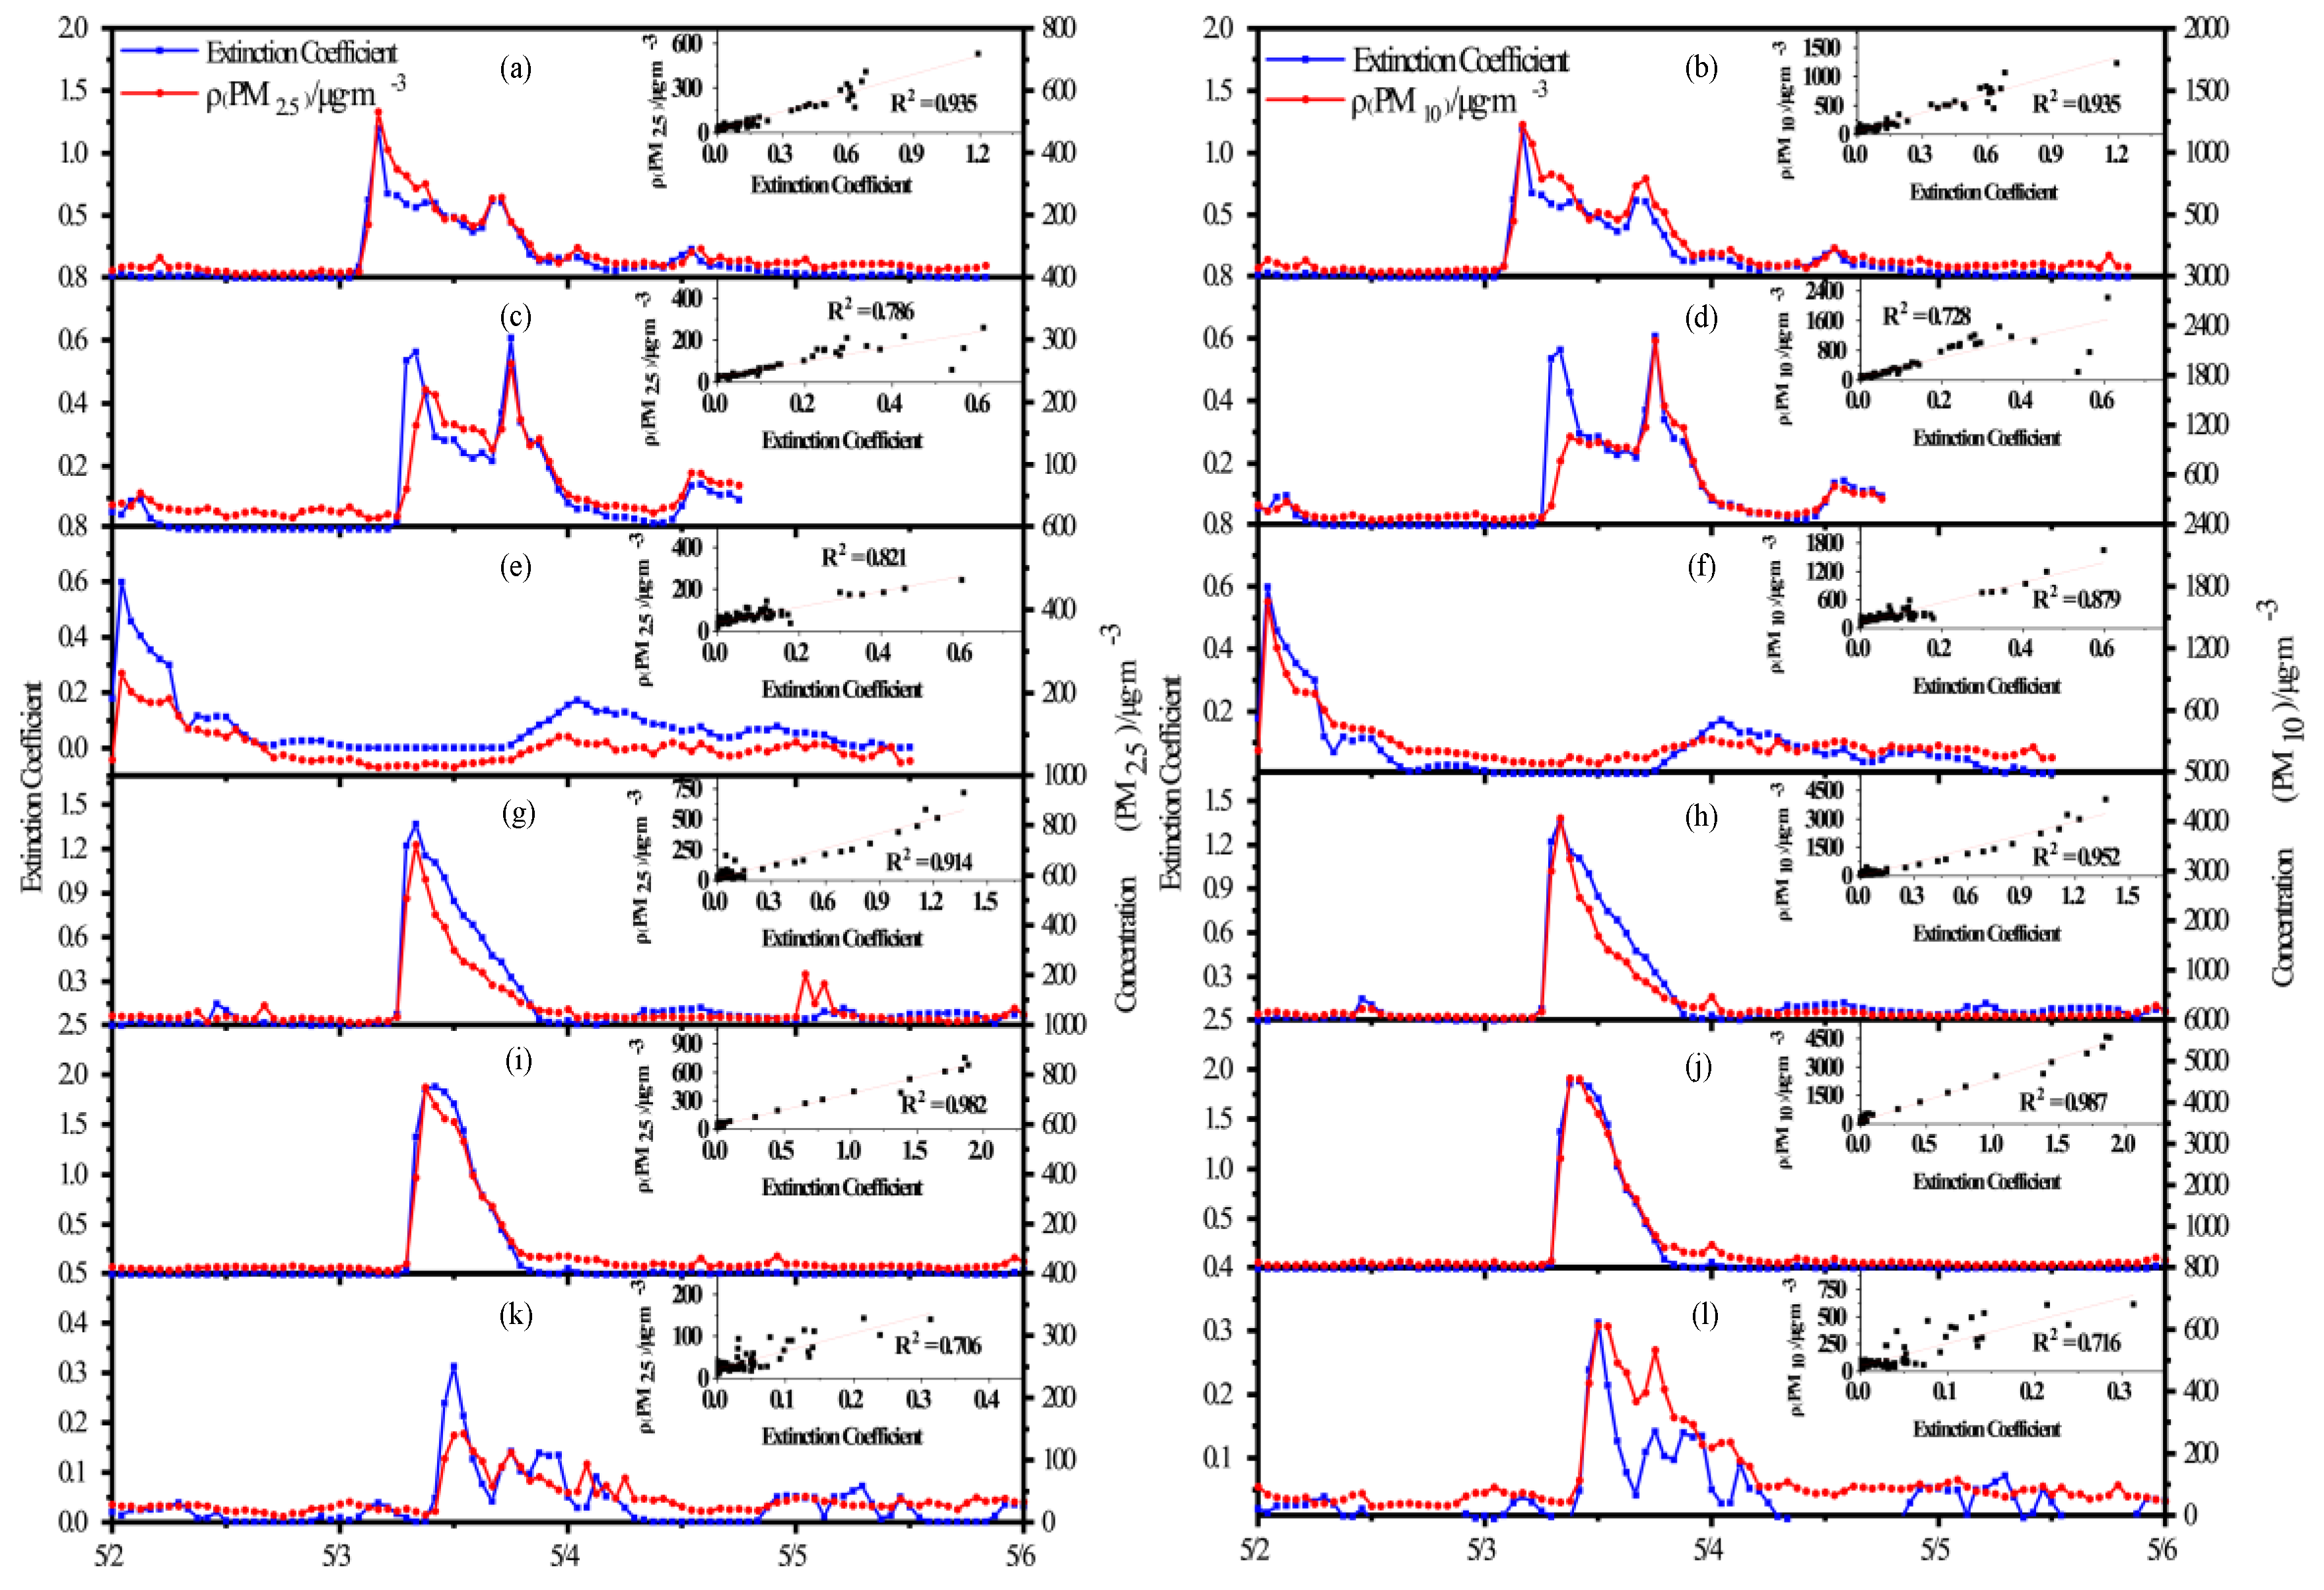
3.3.2. The Fitting of the Extinction Coefficient with the Particulate Concentration

Figure 7 shows the fitting curve of the hourly extinction coefficient of 532 nm at 150 m height with the ground PM2.5 and PM10 concentration. In order to reduce the influence of water vapor on the fitting effect [35], the data were removed when the relative humidity of Lidar station was greater than 80%. It can be seen that the change of extinction coefficients of all Lidars were very consistent with the change of particulate concentrations, which indicated that 532 nm at 150 m height can reflect the concentration of ground particles. The fitting results are shown in Table 3. The extinction coefficients of 532 nm with PM2.5 and PM10 concentration were larger and showed a good relationship. Due to the weak intensity of dust in Yumen, Aksay and Baiyin, the square of the correlation coefficient (R2) were slightly inferior, ranging from 0.706 to 0.879. The R2 of other stations were greater than 0.9. Further, two periods of 07:00–09:00 and 17:00–20:00 on the 3rd were selected to analyze the reason that why the R2 of Yumen was slightly inferior. It was found that the extinction coefficients of the two periods were similar, but the particulate concentration from 07:00 to 09:00 was significantly lower than that from 17:00 to 20:00, especially for the difference of PM10 concentration. Compared with the relative humidity of the two periods, the relative humidity from 07:00 to 09:00 was 37%–40%, and that from 17:00 to 20:00 was 24%–28%. This shows that the influence of water vapor on extinction coefficient cannot be ignored.
The linear relationship between 532 nm extinction coefficient and particulate concentration was used to explore the vertical change of particulate concentration further during the dust period. The fitting formula for the PM2.5, PM10 mass concentration in the linear model can be written as [35]: y = ax + b. When the extinction coefficient was the same, it is considered that the error of particulate concentrations within the acceptable range. Therefore, according to the fitting formula in Table 3, the particulate concentration at the vertical 26 of each Lidar station can be obtained, as shown in Figure 8.

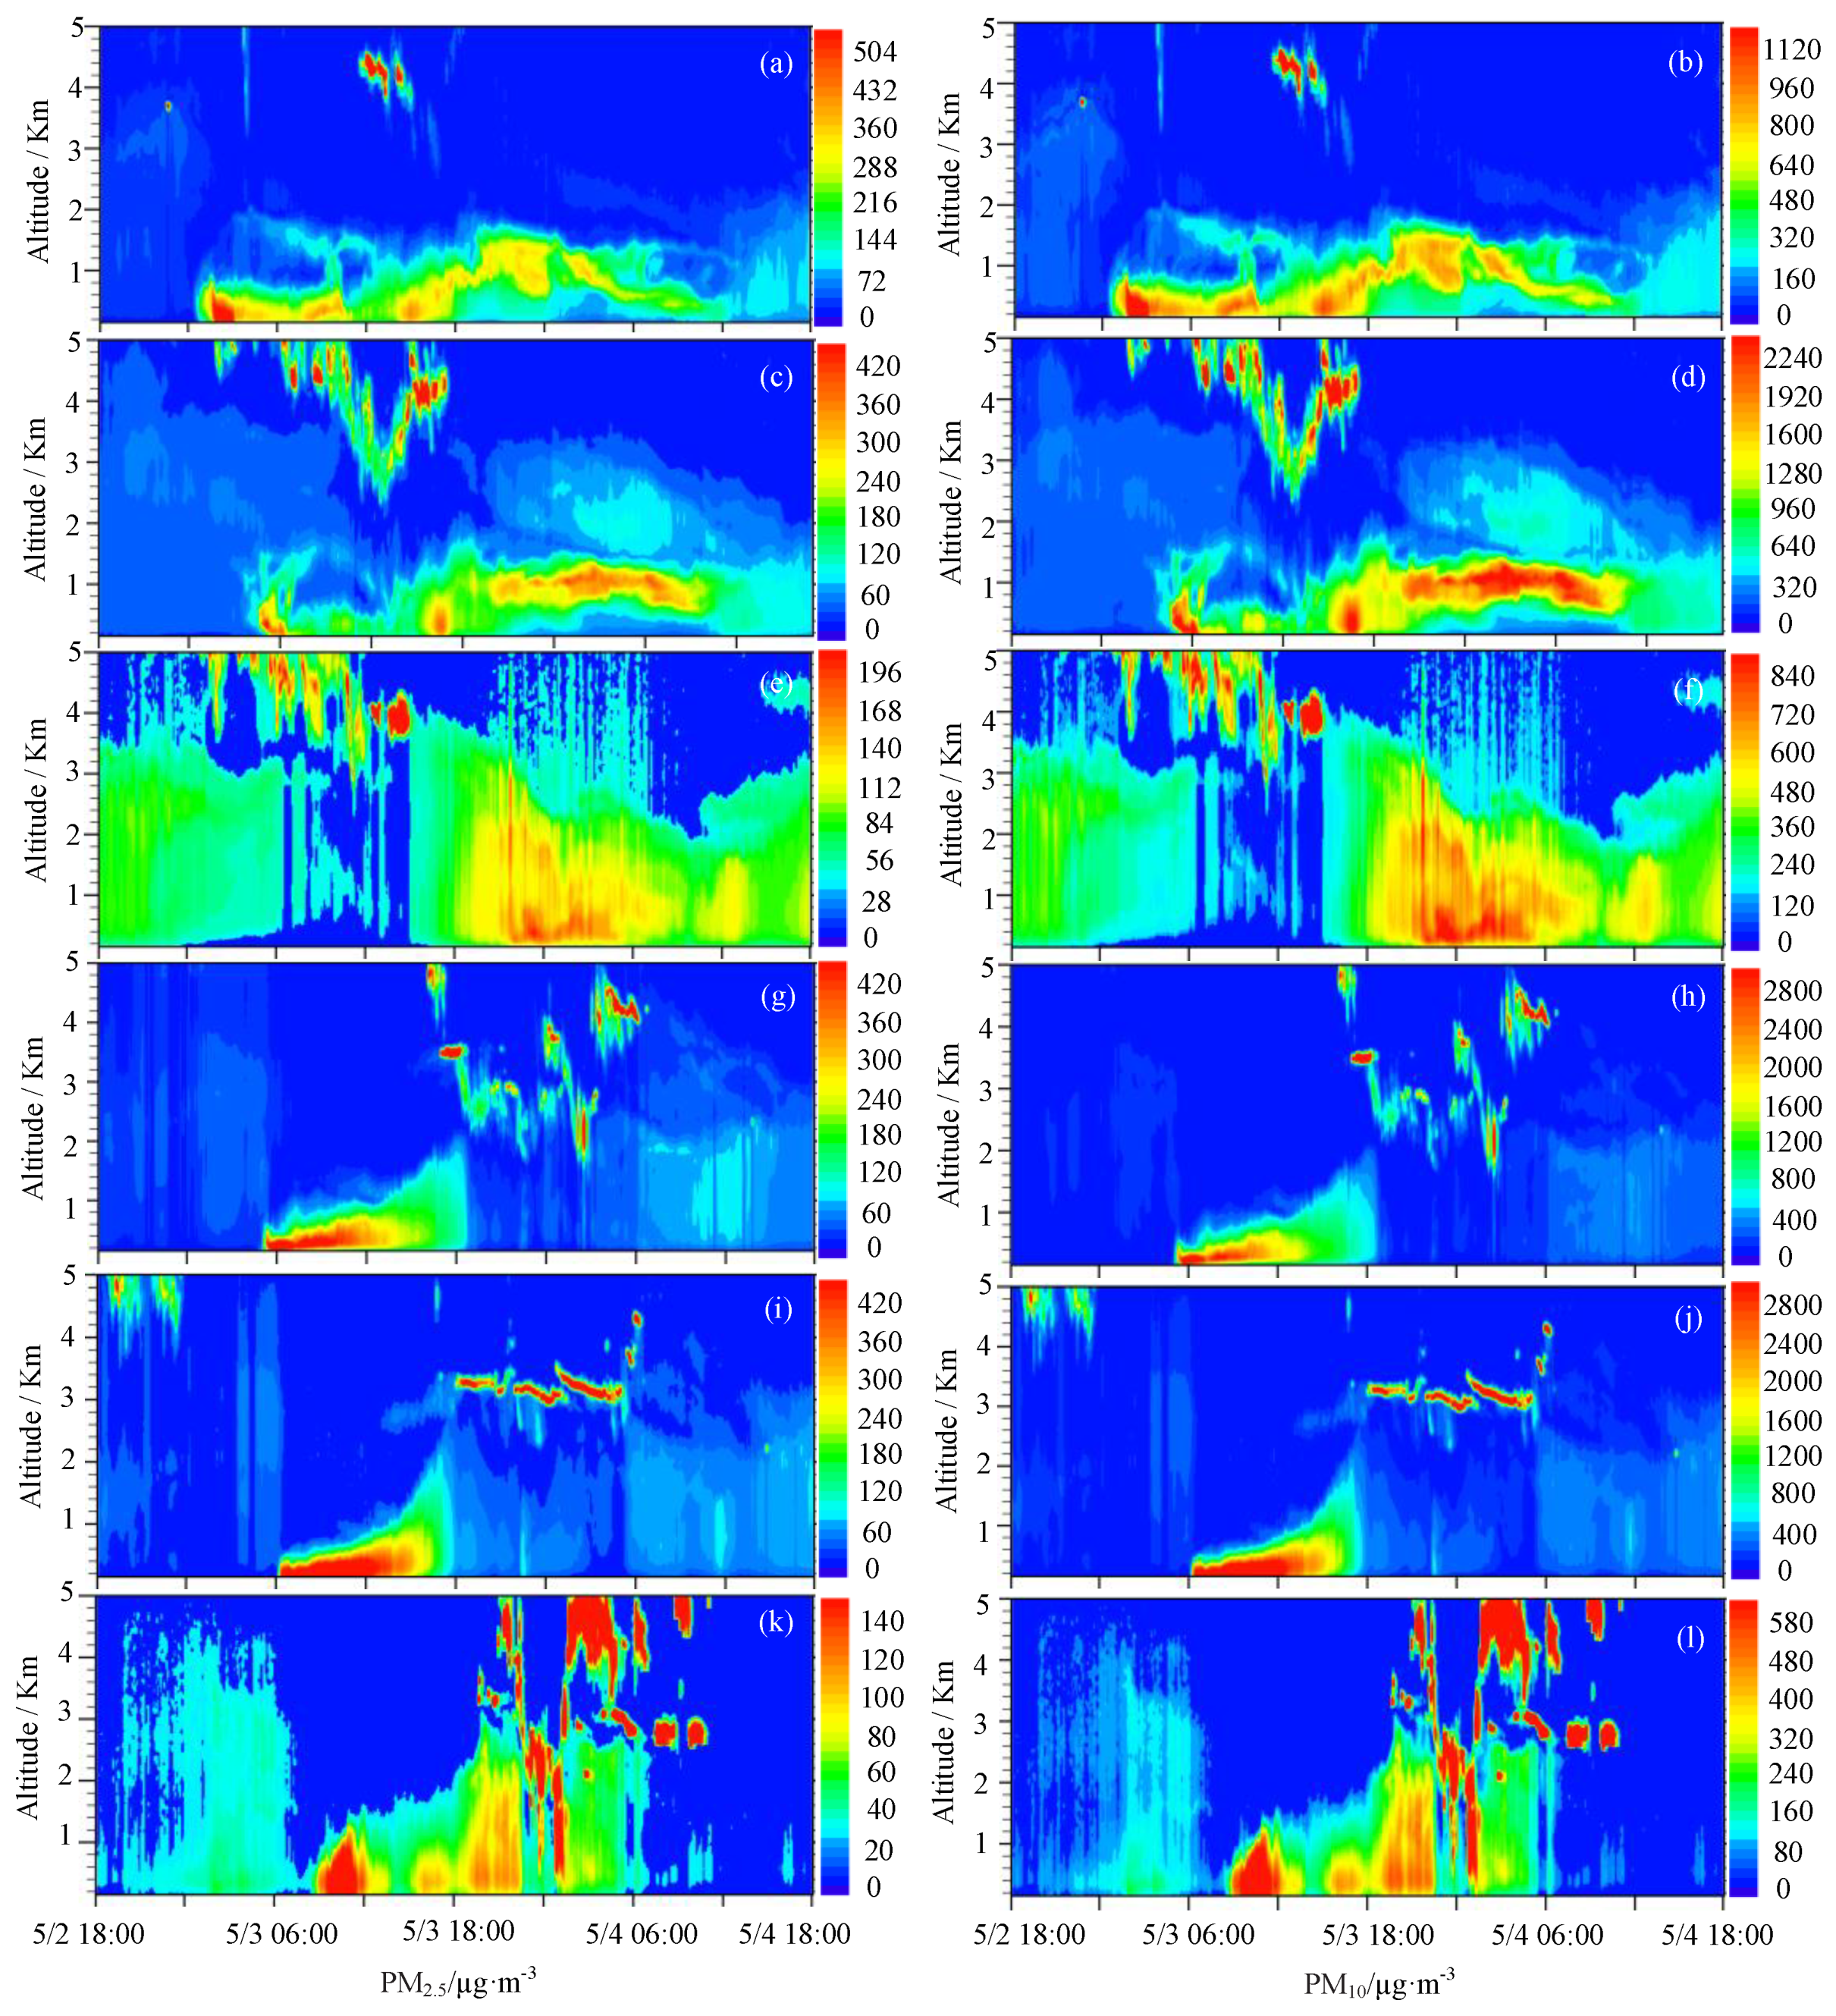
3.3.3. Retrieval of Vertical Distribution of Particulate Concentration

In Figure 8, the left column represents the retrieved PM2.5 concentration of each Lidar station, and the right column represents the retrieved PM10 concentration. The particulate in Jiayuguan (Figure 8a,b) was mainly concentrated in the height of 2 km, in which it was mainly concentrated within 0.8 km from 00:00 to 12:00 on the 3rd day. The maximum concentration of PM2.5 and PM10 were about 500 µg·m−3 and 1000 µg·m−3, respectively. The particulate concentration in the height of 0.6–0.8 km decreased obviously with a concentration of 100–200 µg·m−3. The PM2.5 and PM10 were lower than 100 µg·m−3 in the height of 1–1.4 km. At the same time, there was external dust at 1–2 km height, PM2.5 and PM10 concentrations were 100–150 µg·m−3 and 200–300 µg·m−3, respectively. The particulate concentration was significantly lower than that of the low level, and the values of PM2.5/PM10 were estimated to be 0.5. After that, the main pollution belt gradually diffused to the upper level, and the PM2.5 concentration was 360 µg·m−3 and the PM10 concentration was 1000 µg·m−3. The values of PM2.5/PM10 decreased from 0.5 to 0.36 when compared with the transport dust, indicating that the contribution of external dust to local PM2.5 concentration was greater. The particulate concentration above 2 km was significantly reduced to about 100 µg·m−3.
The vertical development of dust in Yumen (Figure 8c,d) was close to Jiayuguan, and it was mainly concentrated within 0.4 km height from 06:00 to 14:00 on the 3rd, and then gradually lifted to 1.6 km. During this period, the concentration of PM2.5 was about 150 µg·m−3, and the concentration of PM10 varied greatly from 400–1000 µg·m−3. From 21:00 on the 3rd to 12:00 on the 4th, the particulate concentration within 0.4 km was very small, the concentration of PM2.5 was less than 60 µg·m−3, and the concentration of PM10 was less than 250 µg·m−3, which is consistent with the analysis in Figure 2. However, there was an obvious dust pollution at the height of 0.5–1.5 km. The concentrations of PM2.5 and PM10 reaches the maximum, which were about 400 µg·m−3 and 1600 µg·m−3, respectively. There was dust transported within 1.5–3 km height, which was significantly higher than that of Jiayuguan. The PM2.5 concentration was about 90 µg·m−3, and the values of PM2.5/PM10 were 0.2–0.4, which was higher than that of ground in Figure 2, indicating that the contribution of external transportation to local PM2.5 was greater than that to PM10.
The dust process had little impact on Aksay (Figure 8e,f) from 18:00 on the 3rd to 12:00 on the 4th. The height of dust reached about 4 km, and the high concentration area was mainly concentrated within 2 km. The maximum concentration of PM2.5 and PM10 were about 150 µg·m−3 and 800 µg·m−3, respectively. The depolarization ratio of Aksay Lidar (Figure 6f) could prove that there was obvious external transport over Aksay during this period. The concentration of PM2.5 and PM10 decreased to about 60 µg·m−3 and 300 µg·m−3 within 2–4 km, respectively.
The dust in Jinchang (Figure 8g,h) and Wuwei (Figure 8i,j) were mainly affected from 06:00 to 18:00 on the 3rd, and concentrated within 0.6 km from 06:00 to 12:00 with very strong intensity. The peak concentration of PM2.5 exceeded 400 µg·m−3, and the maximum concentration of PM10 exceeded 2500 µg·m−3. From 12:00 to 18:00, the height of the dust gradually developed to 2 km, and the intensity of dust was weakened obviously. The concentration of PM2.5 and PM10 were about 150 µg·m-3 and 1000 µg·m−3 in 1–2 km, respectively. Subsequently, the dust was affected by clouds, and its height development was not obvious.
When the dust was transported to Baiyin, its intensity had weakened obviously and mainly concentrated in the height of 1.5 km. The strong intensity period was 9:00–12:00 on the 3rd, the maximum concentrations of PM2.5 and PM10 were about 140 µg·m−3 and 500 µg·m−3, respectively. Then the dust lifted to 3 km, and the concentration of PM2.5 and PM10 decreased to about 50 µg·m−3 and 200 µg·m−3, respectively. The intensity of dust in Baiyin was not strong, and was affected by the long-distance transportation in the upstream. It can be seen that although the ground particulate concentration of Baiyin was not high, and its upper level particulate concentration was close to the ground particulate concentration, which had a continuous contribution to the ground particulate concentration later, resulting in a longer duration of dust.
Combined with Figure 8 and Figure 2, it was found that during the dust process, the particulate concentration of the upper level in Jiayuguan, Yumen, Jinchang and Wuwei decreased significantly when compared with that of ground, at least more than 50%, and the particulate concentrations of the upper level in Aksay and Baiyin were close to the ground. The results show that the particulate concentrations near the sand source area decreased rapidly with the increasing of height, and the particulate concentration causes by long-distance transport was relatively uniform in the vertical direction. The particulate concentration retrieved from Jiayuguan and Yumen Lidars shows that the contribution of the external dust to local PM2.5 was higher than that to PM10.

4. Conclusions

The multi-observation platform composed of six Lidars and nine aerosol analytical instruments was first used to detect a severe dust storm event, which occurred in Northwest China on 3 May 2020. The distribution characteristics of dust particles sizes, structures and concentrations in the process of the dust storm were studied, which can help us to better understanding the vertical distribution of dust. Some of our conclusions are as follows:
  • The duration of the dust event was short, but its area of influence was wide and the intensity was very strong. The peak hourly-concentration of PM10 in Jinchang and Wuwei was more than 4000 µg·m−3. During the period of strong dust, the values of PM2.5/PM10 in cities examined were less than 0.2 and the extinction coefficient became greater than 1 km−1 using Lidar observations. In addition, the growth rates of PM2.5 were higher than that of PM10 after long distance transportation of dust.
  • The strong concentration of dust mainly concentrated in 1 km, and the height of dust near the sand source was 2 km. When the dust particles were transported about 200–300 km, the height increased by 1–2 km. However, the concentration decreased obviously.
  • The depolarization ratios showed that the particles over Tengger Desert were more spherical than those over Badain Jaran Desert.
  • The formula of fitting the concentration of particulate with extinction coefficient in Northwest China was found firstly, which realized the research of dust event from qualitative to quantitative. There was a linear relationship between 532 nm extinction coefficient and the concentration of PM2.5 and PM10. The R2 in Yumen, Aksay and Baiyin were inferior slightly, which were 0.706 to 0.879. The R2 in Jiayuguan, Jinchang and Wuwei were greater than 0.9.
The results could give more information for the physical schemes to simulate the dust aerosol process in models, which can improve the forecast of dust storms, and provide timely warning information for heavy pollution caused by dust storms. In the following work, the relationship between extinction coefficient and particulate concentration will be further improved by reducing the impact of water vapor to obtain more accurate particulate concentrations in three-dimensional space.

Author Contributions

Z.H. (Zhiyuan Hu) conceived and designed the experiments; L.Y. analyzed the data and wrote the manuscript; Z.H. (Zhongwei Huang) and L.W. review and edit the manuscript; W.H. contributed and analyzed Figure 1; Y.Y. and H.T. helped with discussion; J.W. processing Lidar preliminary data. All authors have read and agreed to the published version of the manuscript.

Funding

This research was supported by the Foundation for National Natural Science Foundation of China (No. 41805116 and No. 42075105).

Institutional Review Board Statement

Not applicable.

Informed Consent Statement

Not applicable.

Data Availability Statement

Data available in a publicly accessible repository that does not issue DOIs. The surface PM2.5 and PM10 concentrations datasets can be found here: http://www.cnemc.cn/ (accessed on 28 December 2020). NCEP reanalyzed synoptic situation datasets can be found here: https://psl.noaa.gov/data/gridded/data.ncep.reanalysis.surface.html (accessed on 28 December 2020). The average daily temperature datasets can be found here: https://www.aqistudy.cn/ (accessed on 28 December 2020). The Lidar datasets were 3rd Party Data, restrictions apply to the availability of these data.

Acknowledgments

We are grateful to NOAA (USA) for distributing the NCEP/NCAR reanalysis data (https://psl.noaa.gov/data/gridded/data.ncep.reanalysis.surface.html# (accessed on 28 December 2020)). The authors acknowledge the anonymous reviewers and the editor for their valuable comments and suggestions.

Conflicts of Interest

The authors declare no conflict of interest.

References

  1. Achakulwisut, P.; Anenberg, S.C.; Neumann, J.E.; Penn, S.L.; Weiss, N.; Crimmins, A.; Fann, N.; Martinich, J.; Roman, H.; Mickley, L.J. Effects of Increasing Aridity on Ambient Dust and Public Health in the U.S. Southwest Under Climate Change. GeoHealth 2019, 3, 127–144. [Google Scholar] [CrossRef]
  2. Kok, J.F.; Ward, D.S.; Mahowald, N.M.; Evan, A.T. Global and regional importance of the direct dust-climate feedback. Nat. Commun. 2018, 9, 1–11. [Google Scholar] [CrossRef] [PubMed]
  3. Soleimani, Z.; Teymouri, P.; Boloorani, A.D.; Mesdaghinia, A.; Middleton, N.; Griffin, D.W. An overview of bioaerosol load and health impacts associated with dust storms: A focus on the Middle East. Atmos. Environ. 2020, 223, 117187. [Google Scholar] [CrossRef]
  4. Hu, Z.; Huang, J.; Zhao, C.; Bi, J.; Jin, Q.; Qian, Y.; Leung, L.R.; Feng, T.; Chen, S.; Ma, J. Modeling the contributions of Northern Hemisphere dust sources to dust outflow from East Asia. Atmos. Environ. 2019, 202, 234–243. [Google Scholar] [CrossRef]
  5. Hu, Z.; Huang, J.; Zhao, C.; Jin, Q.; Ma, Y.; Yang, B. Modeling dust sources, transport, and radiative effects at different altitudes over the Tibetan Plateau. Atmos. Chem. Phys. 2020, 20, 1507–1529. [Google Scholar] [CrossRef] [Green Version]
  6. Huang, Z.; Huang, J.; Hayasaka, T.; Wang, S.; Zhou, T.; Jin, H. Short-cut transport path for Asian dust directly to the Arctic: A case study. Environ. Res. Lett. 2015, 10, 114018. [Google Scholar] [CrossRef] [Green Version]
  7. Hu, Z.Y.; Zhao, C.; Huang, J.P.; Leung, L.R.; Qian, Y.; Yu, H.B.; Huang, L.; Kalashnikova, O. Trans-Pacific transport and evolu- tion of aerosols: Evaluation of quasi-global WRF-Chem simula- tion with multiple observations. Geosci. Model Dev. 2016, 9, 1725–1746. [Google Scholar] [CrossRef] [Green Version]
  8. Hu, Z.; Huang, J.; Zhao, C.; Ma, Y.; Jin, Q.; Qian, Y.; Leung, L.R.; Bi, J.; Ma, J. Trans-Pacific transport and evolution of aerosols: Spatiotemporal characteristics and source contributions. Atmos. Chem. Phys. Discuss. 2019, 19, 12709–12730. [Google Scholar] [CrossRef] [Green Version]
  9. Huang, J.; Yu, H.; Guan, X.; Wang, G.; Guo, R. Accelerated dryland expansion under climate change. Nat. Clim. Chang. 2016, 6, 166–171. [Google Scholar] [CrossRef]
  10. Huang, J.; Fu, Q.; Zhang, W.; Wang, X.; Zhang, R.; Ye, H.; Warren, S.G. Dust and Black Carbon in Seasonal Snow Across Northern China. Bull. Am. Meteorol. Soc. 2011, 92, 175–181. [Google Scholar] [CrossRef] [Green Version]
  11. Wang, X.; Doherty, S.J.; Huang, J. Black carbon and other light-absorbing impurities in snow across Northern China. J. Geophys. Res. Atmos. 2013, 118, 1471–1492. [Google Scholar] [CrossRef]
  12. Jiménez, L.; Rühland, K.M.; Jeziorski, A.; Smol, J.P.; Pérez-Martínez, C. Climate change and Saharan dust drive recent cladoceran and primary production changes in remote alpine lakes of Sierra Nevada, Spain. Glob. Chang. Biol. 2018, 24, e139–e158. [Google Scholar] [CrossRef] [PubMed] [Green Version]
  13. Zhao, C.; Hu, Z.; Qian, Y.; Leung, L.R.; Huang, J.; Huang, M.; Jin, J.; Flanner, M.G.; Zhang, R.; Wang, H.; et al. Simulating black carbon and dust and their radiative forcing in seasonal snow: A case study over North China with field campaign measurements. Atmos. Chem. Phys. Discuss. 2014, 14, 11475–11491. [Google Scholar] [CrossRef] [Green Version]
  14. Reed, K.A.; Bacmeister, J.T.; Huff, J.J.A.; Wu, X.; Bates, S.C.; Rosenbloom, N.A. Exploring the Impact of Dust on North Atlantic Hurricanes in a High-Resolution Climate Model. Geophys. Res. Lett. 2019, 46, 1105–1112. [Google Scholar] [CrossRef]
  15. Smets, W.; Moretti, S.; Denys, S.; Lebeer, S. Airborne bacteria in the atmosphere: Presence, purpose, and potential. Atmos. Environ. 2016, 139, 214–221. [Google Scholar] [CrossRef]
  16. Soleimani, Z.; Boloorani, A.D.; Khalifeh, R.; Griffin, D.W.; Mesdaghinia, A. Short-term effects of ambient air pollution and cardiovascular events in Shiraz, Iran, 2009 to 2015. Environ. Sci. Pollut. Res. 2019, 26, 6359–6367. [Google Scholar] [CrossRef]
  17. Soleimani, Z.; Boloorani, A.D.; Khalifeh, R.; Teymouri, P.; Mesdaghinia, A.; Griffin, D.W. Air pollution and respiratory hospital admissions in Shiraz, Iran, 2009 to 2015. Atmos. Environ. 2019, 209, 233–239. [Google Scholar] [CrossRef]
  18. Katiraie-Boroujerdy, P.-S.; Naeini, M.R.; Asanjan, A.A.; Chavoshian, A.; Hsu, K.-L.; Sorooshian, S. Bias Correction of Satellite-Based Precipitation Estimations Using Quantile Mapping Approach in Different Climate Regions of Iran. Remote Sens. 2020, 12, 2102. [Google Scholar] [CrossRef]
  19. He, L.; Lin, A.; Chen, X.; Zhou, H.; Zhou, Z.; He, P. Assessment of MERRA-2 Surface PM2.5 over the Yangtze River Basin: Ground-based Verification, Spatiotemporal Distribution and Meteorological Dependence. Remote Sens. 2019, 11, 460. [Google Scholar] [CrossRef] [Green Version]
  20. Kim, D.; Lee, H.; Jung, H.C.; Hwang, E.; Hossain, F.; Bonnema, M.; Kang, D.-H.; Getirana, A. Monitoring River Basin Development and Variation in Water Resources in Transboundary Imjin River in North and South Korea Using Remote Sensing. Remote Sens. 2020, 12, 195. [Google Scholar] [CrossRef] [Green Version]
  21. Sakuma, A.; Yamano, H. Satellite Constellation Reveals Crop Growth Patterns and Improves Mapping Accuracy of Cropping Practices for Subtropical Small-Scale Fields in Japan. Remote Sens. 2020, 12, 2419. [Google Scholar] [CrossRef]
  22. Kalpoma, K.A.; Nagatani, I.; Kawano, K.; Kudoh, J.-I. Development of a new dust index NDLI for Asian dust extraction system based on Aqua MODIS data and monitoring of trans-boundary Asian dust events in Japan. Int. J. Remote Sens. 2018, 40, 1030–1047. [Google Scholar] [CrossRef]
  23. Butt, M.J.; Mashat, A.S. MODIS satellite data evaluation for sand and dust storm monitoring in Saudi Arabia. Int. J. Remote Sens. 2018, 39, 8627–8645. [Google Scholar] [CrossRef]
  24. Yu, H.; Tan, Q.; Chin, M.; Remer, L.A.; Kahn, R.A.; Bian, H.; Kim, D.; Zhang, Z.; Yuan, T.; Omar, A.H.; et al. Estimates of African Dust Deposition Along the Trans-Atlantic Transit Using the Decadelong Record of Aerosol Measurements from CALIOP, MODIS, MISR, and IASI. J. Geophys. Res. Atmos. 2019, 124, 7975–7996. [Google Scholar] [CrossRef] [PubMed]
  25. Meng, L.; Yang, X.; Zhao, T.; He, Q.; Lu, H.; Mamtimin, A.; Huo, W.; Yang, F.; Liu, C. Modeling study on three-dimensional distribution of dust aerosols during a dust storm over the Tarim Basin, Northwest China. Atmos. Res. 2019, 218, 285–295. [Google Scholar] [CrossRef]
  26. Wu, Y.; De Graaf, M.; Menenti, M. The impact of aerosol vertical distribution on aerosol optical depth retrieval using CALIPSO and MODIS data: Case study over dust and smoke regions. J. Geophys. Res. Atmos. 2017, 122, 8801–8815. [Google Scholar] [CrossRef] [Green Version]
  27. Konsta, D.; Binietoglou, I.; Gkikas, A.; Solomos, S.; Marinou, E.; Proestakis, E.; Basart, S.; García-Pando, C.P.; El-Askary, H.; Amiridis, V. Evaluation of the BSC-DREAM8b regional dust model using the 3D LIVAS-CALIPSO product. Atmos. Environ. 2018, 195, 46–62. [Google Scholar] [CrossRef]
  28. Bessho, K.; Date, K.; Hayashi, M.; Ikeda, A.; Imai, T.; Inoue, H.; Kumagai, Y.; Miyakawa, T.; Murata, H.; Ohno, T.; et al. An Introduction to Himawari-8/9— Japan’s New-Generation Geostationary Meteorological Satellites. J. Meteorol. Soc. Jpn. 2016, 94, 151–183. [Google Scholar] [CrossRef] [Green Version]
  29. She, L.; Xue, Y.; Yang, X.; Guang, J.; Li, Y.; Che, Y.; Fan, C.; Xie, Y. Dust Detection and Intensity Estimation Using Himawari-8/AHI Observation. Remote Sens. 2018, 10, 490. [Google Scholar] [CrossRef] [Green Version]
  30. Xia, X.; Min, J.; Wang, Y.; Shen, F.; Yang, C.; Sun, Z. Assimilating Himawari-8 AHI aerosol observations with a rapid-update data assimilation system. Atmos. Environ. 2019, 215, 116866.1–116866.101. [Google Scholar] [CrossRef]
  31. Zhang, Z.; Wu, W.; Fan, M.; Tao, M.; Wei, J.; Jin, J.; Wang, Q. Validation of Himawari-8 aerosol optical depth retrievals over China. Atmos. Environ. 2019, 199, 32–44. [Google Scholar] [CrossRef]
  32. Wu, T.; Li, Z.; Chen, J.; Wang, Y.; Wu, H.; Jin, X.; Liang, C.; Li, S.; Wang, W.; Cribb, M. Hygroscopicity of Different Types of Aerosol Particles: Case Studies Using Multi-Instrument Data in Megacity Beijing, China. Remote Sens. 2020, 12, 785. [Google Scholar] [CrossRef] [Green Version]
  33. Peshev, Z.Y.; Dreischuh, T.N.; Evgenieva, T.T.; Deleva, A.D.; Tonev, D.; Stoyanov, D.V. Lidar observations of long-range transported Saharan dust over Sofia, Bulgaria: A case study of dust mixed with local aerosols. J. Appl. Remote Sens. 2016, 10, 036009. [Google Scholar] [CrossRef]
  34. Sakai, T.; Orikasa, N.; Nagai, T.; Murakami, M.; Tajiri, T.; Saito, A.; Yamashita, K.; Hashimoto, A. Balloon-borne and Raman lidar observations of Asian dust and cirrus cloud properties over Tsukuba, Japan. J. Geophys. Res. Atmos. 2014, 119, 3295–3308. [Google Scholar] [CrossRef]
  35. Lv, L.; Liu, W.; Zhang, T.; Chen, Z.; Dong, Y.; Fan, G.; Xiang, Y.; Yao, Y.; Yang, N.; Chu, B.; et al. Observations of particle extinction, PM2.5 mass concentration profile and flux in north China based on mobile lidar technique. Atmos. Environ. 2017, 164, 360–369. [Google Scholar] [CrossRef]
  36. Xiang, Y.; Zhang, T.; Zhao, X.S.; Liu, J.; Dong, Y.S.; Fan, G.; Liu, Y. Retrieval of PM2.5 Concentration from Lidar Data. In Light, Energy and the Environment; OSA Technical Digest (Online), Paper EM3A.6; Optical Society of America: Washington, DC, USA, 2015. [Google Scholar] [CrossRef]
  37. Li, Q.; Li, C.; Wang, Y.; Lin, C.; Yang, D.; Li, Y. Retrieval on mass concentration of urban surface suspended particulate matter with LIDAR and satellite remotesensing. Acta Sci. Nat. Univ. Pekin. 2013, 49, 673–682. [Google Scholar]
  38. Zerull, R.H.; Giese, R.H.; Weiss, K. Scattering functions of nonspherical dielectric and absorbing particles vs Mie theory. Appl. Opt. 1977, 16, 777–778. [Google Scholar] [CrossRef]
  39. Pinnick, R.G.; Rosen, J.M.; Hofmann, D.J. Measured Light-Scattering Properties of Individual Aerosol Particles Compared to Mie Scattering Theory. Appl. Opt. 1973, 12, 37–41. [Google Scholar] [CrossRef] [PubMed] [Green Version]
  40. Uchino, O.; Tabata, I.; Kai, K.; Okada, Y. Polarization Properties of Middle and High Level Clouds Observed by Lidar. J. Meteorol. Soc. Jpn. 1988, 66, 607–616. [Google Scholar] [CrossRef] [Green Version]
  41. Xiang, Y. Study on the Three-Dimensional Assimilation and Comprehensive Analysis of the Regional Network Data of Lidar. Ph.D. Thesis, University of Science and Technology of China, Hefei, China, 2018. (In Chinese). [Google Scholar]
  42. Eguchi, K.; Uno, I.; Yumimoto, K.; Takemura, T.; Shimizu, A.; Sugimoto, N.; Liu, Z. Trans-pacific dust transport: Integrated analysis of NASA/CALIPSO and a global aerosol transport model. Atmos. Chem. Phys. Discuss. 2009, 9, 3137–3145. [Google Scholar] [CrossRef] [Green Version]
  43. Huang, Z.; Huang, J.; Bi, J.; Wang, G.; Wang, W.; Fu, Q.; Li, Z.; Tsay, S.-C.; Shi, J. Dust aerosol vertical structure measurements using three MPL lidars during 2008 China-U.S. joint dust field experiment. J. Geophys. Res. Space Phys. 2010, 115. [Google Scholar] [CrossRef] [Green Version]
  44. Fernald, F.G. Analysis of atmospheric lidar observations: Some comments. Appl. Opt. 1984, 23, 652–653. [Google Scholar] [CrossRef] [PubMed]
  45. Sasano, Y. Tropospheric aerosol extinction coefficient profiles derived from scanning lidar measurements over Tsukuba, Japan, from 1990 to 1993. Appl. Opt. 1996, 35, 4941–4952. [Google Scholar] [CrossRef] [PubMed] [Green Version]
  46. Slavov, L.; Iliev, M.; Ilieva, R.; Angelova, R.; Ghelev, C.; Grigorov, I.; Kolarov, G.; Gurdev, L.; Grurdeva, V.; Stoyanov, D.; et al. Lidar monitoring of air pollution over urban areas combined with in-situ sampling of particulate matter. Int. Sci. J. Mach. Technol. Mater. 2018, 10, 412–414. [Google Scholar]
  47. Liu, D. Development of Polarization-Mie Lidar and Lidar Observation of Atmosphere Boundary Layer. Ph.D. Thesis, Anhui Institute of Optics and Fine Mechanics, Chinese Academy of Sciences, Hefei, China, 2005. [Google Scholar]
  48. Gobbi, G.P. Polarization lidar returns from aerosols and thin clouds: A framework for the analysis. Appl. Opt. 1998, 37, 5505–5508. [Google Scholar] [CrossRef] [PubMed]
  49. He, T.; Hou, L.J.; Lü, B.; Liu, Y.T. Study of Accuracy of Lidar Inversion PM2.5 Concentration. Chin. J. Lasers 2013, 40, 0113001. [Google Scholar] [CrossRef]
  50. Ministry of Ecology and Environment of the People’s Republic of China. Ambient Air Quality Standards. Available online: http://www.mee.gov.cn/ywgz/fgbz/bz/bzwb/dqhjbh/dqhjzlbz/201203/t20120302_224165.shtml (accessed on 1 January 2016).
  51. Cheng, H.X.; Ding, Z.Y.; Shuai, K.J. Statistic analysis on relationship between Sandstorm and High level jet stream in China in latest 5 years. J. Desert Res. 2005, 25, 891–896. [Google Scholar]
Figure 1. The Lidars distribution. The black circles represent the deserts around the Lidar network, the green lines represent the Lidar stations, the white dots represent the locations of the cities examined in the dust process besides the six Lidars stations, the red lines represent the provincial boundaries.
Remotesensing 13 01056 g001
Figure 2. Hourly PM2.5 and PM10 concentrations and PM2.5/PM10 from ground observation in cities examined.
Remotesensing 13 01056 g002
Figure 3. Daily average concentrations of PM10 at 1470 national control stations in China on 3 May 2020.
Remotesensing 13 01056 g003
Figure 4. NCEP reanalyzed synoptic situation at 500 hPa (top panel, (a,b)) and surface (bottom panel, (c,d)) at 20:00 on 2 May (left panel, (a,c)) and at 08:00 on 3 May (right panel, (b,d)). The red dashed lines represent the isotherms (°C). The blue solid lines represent the height contours (dagpm) in (a) and (b) and surface pressure (hPa) in (c) and (d).
Remotesensing 13 01056 g004
Figure 5. The average daily temperature of cities examined from 1 April to 10 May 2020.
Remotesensing 13 01056 g005
Figure 6. Vertical structure of aerosols from Lidar observation in different cities. Left panel: extinction coefficient of 532 nm, right panel: depolarization ratio of 532 nm. (From top to bottom: Jiayuguan (a,b), Yumen (c,d), Aksay (e,f), Jinchang (g,h), Wuwei (i,j), Baiyin (k,l)).
Remotesensing 13 01056 g006
Figure 7. Relationship between extinction coefficient of 532 nm at 150 m and PM2.5, PM10 concentration from ground observation in different cities (from top to bottom: Jiayuguan (a,b), Yumen (c,d), Aksay (e,f), Jinchang (g,h), Wuwei (i,j), Baiyin (k,l)).
Remotesensing 13 01056 g007
Figure 8. Hourly concentration of PM2.5, PM10 at vertical fitted by the formula in Table 3 (from top to bottom: Jiayuguan (a,b), Yumen (c,d), Aksay (e,f), Jinchang (g,h), Wuwei (i,j), Baiyin (k,l)).
Remotesensing 13 01056 g008
Table 1. Main performance of Lidar.
PerformanceParameter
Laser transmitterNd: YAG laser
wavelength532 nm/355 nm
Maximum pulse energy30 mJ@355 nm; 25 mJ@532 nm
spatial resolution7.5 m
time resolution5 min
Receiving channel355 nm ∥; 532 nm ∥; 355 nm ⊥
Blind zone30 m
Incomplete-overlap zone120 m
Table 2. Location of Lidars.
LidarLongitude (°E)Latitude (°N)
Aksay94.34039.633
Yumen97.04840.289
Jiayuguan98.32139.750
Jinchang102.19438.532
Wuwei102.64937.914
Baiyin104.13136.537
Table 3. The fitting formula between PM2.5, PM10 concentration from ground observation and extinction coefficient (y = ax + b) of 532 nm at 150 m.
LidarNumber (RH < 80%)The Fitting FormulaR2
PM2.5PM10PM2.5PM10
Jiayuguan93y = 415.665 x + 18.248y = 1070.651x + 50.7660.9350.935
Yumen67y = 357.712 x + 25.618y = 2519.977x + 97.3700.7860.728
Aksay85y = 370.178 x + 40.317y = 2117.709x + 115.6630.8210.879
Jinchang97y = 409.400 x + 13.669y = 2392.236x − 10.3050.9140.952
Wuwei97y = 340.963 x + 32.053y = 2229.356x + 121.9590.9820.987
Baiyin97y = 422.350 x + 21.971y = 2060.090x + 47.6240.7060.716
Publisher’s Note: MDPI stays neutral with regard to jurisdictional claims in published maps and institutional affiliations.

