Article

Improving the Selection of Vegetation Index Characteristic Wavelengths by Using the PROSPECT Model for Leaf Water Content Estimation

1
School of Geography and Information Engineering, China University of Geosciences, Wuhan 430074, China
2
Artificial Intelligence School, Wuchang University of Technology, Wuhan 430223, China
3
College of Resources and Environmental Sciences, Gansu Agricultural University, Lanzhou 730070, China
4
State Key Laboratory of Information Engineering in Surveying, Mapping and Remote Sensing, Wuhan University, Wuhan 430079, China
*
Author to whom correspondence should be addressed.
Remote Sens. 2021, 13(4), 821; https://doi.org/10.3390/rs13040821
Submission received: 6 January 2021 / Revised: 6 February 2021 / Accepted: 13 February 2021 / Published: 23 February 2021
(This article belongs to the Section Remote Sensing in Agriculture and Vegetation)

Abstract

:
Equivalent water thickness (EWT) is a major indicator for indirect monitoring of leaf water content in remote sensing. Many vegetation indices (VIs) have been proposed to estimate EWT based on passive or active reflectance spectra. However, the selection of the characteristics wavelengths of VIs is mainly based on statistical analysis for specific vegetation species. In this study, a characteristic wavelength selection algorithm based on the PROSPECT-5 model was proposed to obtain characteristic wavelengths of leaf biochemical parameters (leaf structure parameter (N), chlorophyll a + b content (Cab), carotenoid content (Car), EWT, and dry matter content (LMA)). The effect of combined characteristic wavelengths of EWT and different biochemical parameters on the accuracy of EWT estimation is discussed. Results demonstrate that the characteristic wavelengths of leaf structure parameter N exhibited the greatest influence on EWT estimation. Then, two optimal characteristics wavelengths (1089 and 1398 nm) are selected to build a new ratio VI (nRVI = R1089/R1398) for EWT estimation. Subsequently, the performance of the built nRVI and four optimal published VIs for EWT estimation are discussed by using two simulation datasets and three in situ datasets. Results demonstrated that the built nRVI exhibited better performance (R2 = 0.9284, 0.8938, 0.7766, and RMSE = 0.0013 cm, 0.0022 cm, 0.0030 cm for ANGERS, Leaf Optical Properties Experiment (LOPEX), and JR datasets, respectively.) than that the published VIs for EWT estimation. It is demonstrated that the built nRVI based on the characteristic wavelengths selected using the physical model exhibits desirable universality and stability in EWT estimation.

1. Introduction

Leaf water content (LWC) is a significant variable involved in physiological processes and drought stress of plants and is an influencing factor on short-term risk of fire [1,2,3,4,5]. Hence, LWC variation is a significant factor in estimating plant growth status and in providing guidance for agricultural water management [6,7,8].
Traditional methods for monitoring LWC are time-consuming, laborious, and destructive [9]. Remote sensing technology can be an effective method for quantitative assessment of a crop’s water content from the leaf-scale to canopy-scale [10]. In addition, accurately obtaining LWC is the foundation of evaluating canopy water content [11]. Due to the characteristic wavelengths of water absorption in short-wave infrared (SWIR) (1300–2500 nm) and near-infrared (NIR) (750–1300 nm), changes in LWC will result in differentiation of reflectance spectra. Then, the reflectance spectrum can be used to estimate LWC [12,13,14]. Equivalent water thickness (EWT), which refers to the leaf water mass per leaf area unit, is a major indicator for quantitatively estimating LWC [15].
At present, two major remote sensing methods are used to retrieve EWT based on reflectance measurements. First, reflectance spectra can be obtained based on a physical model by setting different leaf biochemical parameters. Leaf biochemical parameters can be retrieved based on the model by using the reflectance spectrum as input parameter [16,17,18,19]. The forward model can be used to simulate the physical process of interaction between different leaf components and radiation, whereas the backward model can invert different leaf components, such as EWT, through spectral information [20]. Among these physical models, PROSPECT is widely used as a leaf level radiative transfer model (RTM). PROSPECT is based on the plate model [21] and can simulate the directional-hemispherical reflectance and transmittance spectra of different species leaves in the range of 400–2500 nm with 1 nm resolution by using the input parameters of N and other different leaf biochemical components [22]. Several versions of PROSPECT have been proposed. PROSPECT-4 and 5 were published, meanwhile, which provided improved specific absorption coefficients and a new refractive index of leaf traits compared with the previous versions [23]. The difference between PROSPECT-5 and 4 was the separation of carotenoid (Car) from total chlorophyll (Cab). The newest version, PROSPECT-D, adds anthocyanins (Canth) to Cab and Car. Due to the addition of new leaf pigment and the recalibrated refractive index, PROSPECT-D can simulate real leaf optical properties with minimal error in the visible range. However, the performance of PROSPECT-D in the near-infrared and shortwave infrared domains was similar to that of other versions [24] and retrieval of EWT by PROSPECT-5 and PROSPECT-D versions was slightly biased [25]. According to the difference of versions and the spectral characteristics of EWT [26], PROSPECT-5 was used to select the characteristic wavelengths for EWT estimation in this paper. However, model inversion often contains the well-known “ill-posed” problem [19,27] and generally exhibits complexity and difficulty.
Compared with physical models, the empirical statistical method was more widely used because of its advantages of simplicity and speed. Additionally, many vegetation indices (VIs) were proposed for estimations of leaf biochemical content. For EWT estimation, the NIR and SWIR spectral regions were selected from two or more bands to build VIs [1,2,18,28]. In contrast to model inversion, VIs are simpler and exhibit better correlations with EWT. Some studies have successfully used empirical models to monitor EWT through VIs [9,11,29]. However, the wavelength selection for building VIs is mainly dependent on the statistical model for specific vegetation species, experimental area, and growth stage of vegetation. The statistical model lacks a certain physical mechanism and universality [18,30]. Hence, a significant target for the development of quantitative remote sensing is how to combine the advantages of physical and statistical models to select the optimal wavelengths to construct a VI. Then, the accuracy of EWT monitoring can be efficiently improved. There have been efforts to build spectral indexes of leaf biochemical traits using the RTM [31,32].
Nowadays, machine learning regression algorithms are considered to be effective in estimating vegetation parameters, using hyperspectral remote sensing data [33]. Machine learning regression algorithms can efficiently represent complex relationships and capture the nonlinear relationships of image features without specifying the underlying data distribution. Due to the facts above, a variety of different machine learning algorithms were used for the estimation of vegetation parameters, such as artificial neural network, support vector regression, and random forest, which performed well in the current biophysical parameter estimation [34,35,36]. Furthermore, Gaussian process regression (GPR) with flexible kernels was also considered to be a fast and stable nonlinear regression method [37].
The main objectives of the current study are as follows: (1) to extract the characteristic wavelengths of leaf biochemical parameters (N, Cab, Car, EWT, and dry matter content (LMA)) by using the proposed characteristic wavelength selection algorithm based on the PROSPECT model; (2) to analyze the effect of the combined characteristic wavelengths of different biochemical parameters and EWT on the accuracy of EWT estimation, and to select two optimal characteristics wavelengths to calculate the new ratio VI for EWT estimation; (3) to analyze the robustness of the new ratio VI and the four published VIs; (4) to validate the performance of the new ratio VI for EWT estimation by using two simulation datasets (without and with 2% random Gaussian noise) and three in situ datasets (ANGERS, Leaf Optical Properties Experiment (LOPEX), and JR) by comparing with the published VIs based on the GPR model.

2. Materials and Methods

2.1. Datasets

In this study, two simulation datasets generated by the PROSPECT model and three publicly available measured datasets (ANGERS, LOPEX, and JR) were used.

2.1.1. Simulation Datasets

The PROSPECT model is a radiative transfer model developed based on the plate model to simulate hemispheric reflectance and transmittance in the 400–2500 nm spectral range of broadleaf [21]. It assumes that the leaf is superimposed by N homogeneous layers, with the upper layer denoted as leaf surface, and that the light exhibits non-diffuse properties on the leaf surface and diffuse properties inside the leaf [23]. The optical properties of vegetation leaves are mainly dependent on the biochemical components of leaves. The PROSPECT model is widely used for the simulation of leaf spectral information and corresponding biochemical components [7,38]. Different plant species and growth states under different environmental conditions can be simulated based on the range of variation in the input parameters of the PROSPECT model. The PROSPECT model includes five main input parameters, which are four biochemical parameters: Cab, Car, EWT, and LMA, and one leaf structure parameter N. N represents the number of leaf layers and is generally entered as continuous values for the model, taking into account the subtle variations of the leaf structure.
The variation ranges of all input parameters in the PROSPECT model were set according to Féret et al. [32] and Sun et al. [39] (Table 1). To avoid unrealistic combinatorial generations of leaf biochemical parameters, the covariance between leaf traits should be considered when generating the simulated datasets. The combination of leaf biochemical parameters was simulated using a Gaussian distribution while considering the correlation matrix between the parameters [32]. Then, based on the PROSPECT forward model, two simulated datasets containing 2000 leaf spectra in the 400–2500 nm spectral range with 1 nm bandwidth were generated using the generated combinations of leaf biochemical parameters, with one synthetic dataset simulating random errors with 2% random Gaussian noise (n = 1000) [23] and another synthetic dataset simulating ideal state without noise (n = 1000).

2.1.2. In Situ Datasets

To avoid using synthetic datasets without the factors that emerged in field measurements, we applied experimental datasets. As we wished to evaluate VIs for different types of datasets, three experimental datasets were utilized. The first dataset was the ANGERS Leaf Optical Properties dataset, which was built in Angers, France, in June 2003 by S. Jacquemound et al. [23]. It measured a total of 276 leaf samples from 43 different plant species. The second dataset was the Leaf Optical Properties Experiment (LOPEX) dataset, the first publicly available experiment dataset established by the Joint Research Center of the European Commission in 1993 [40]. The dataset measured a total of 320 leaf samples from 45 different plant species, which were sampled multiple times throughout their growth, and each sample consisted of five individual leaves. The last dataset is JR, which was measured in Jasper Ridge, California [41]. This dataset contains only 30 leaf samples after removing the spectral errors during the measurement. For JR dataset, reflectance measurements were averaged over approximately ten leaf samples from a single plant. Besides, different leaf samples were used for reflectance measurements and biochemical analysis [42]. All these factors may affect the correlation between EWT and the reflectance spectra with JR dataset and reduce its estimation accuracy. For the three datasets, the spectral ranges of ANGERS, LOPEX, and JR are 400–2450 nm, 400–2500 nm, and 400–2498 nm, respectively. The leaf spectral sampling interval for the ANGERS and LOPEX datasets is 1 nm, and for the JR dataset is 2 nm (ANGERS and LOPEX datasets can be found at http://opticleaf.ipgp.fr/index.php?page=database (accessed on 9 December 2020)).

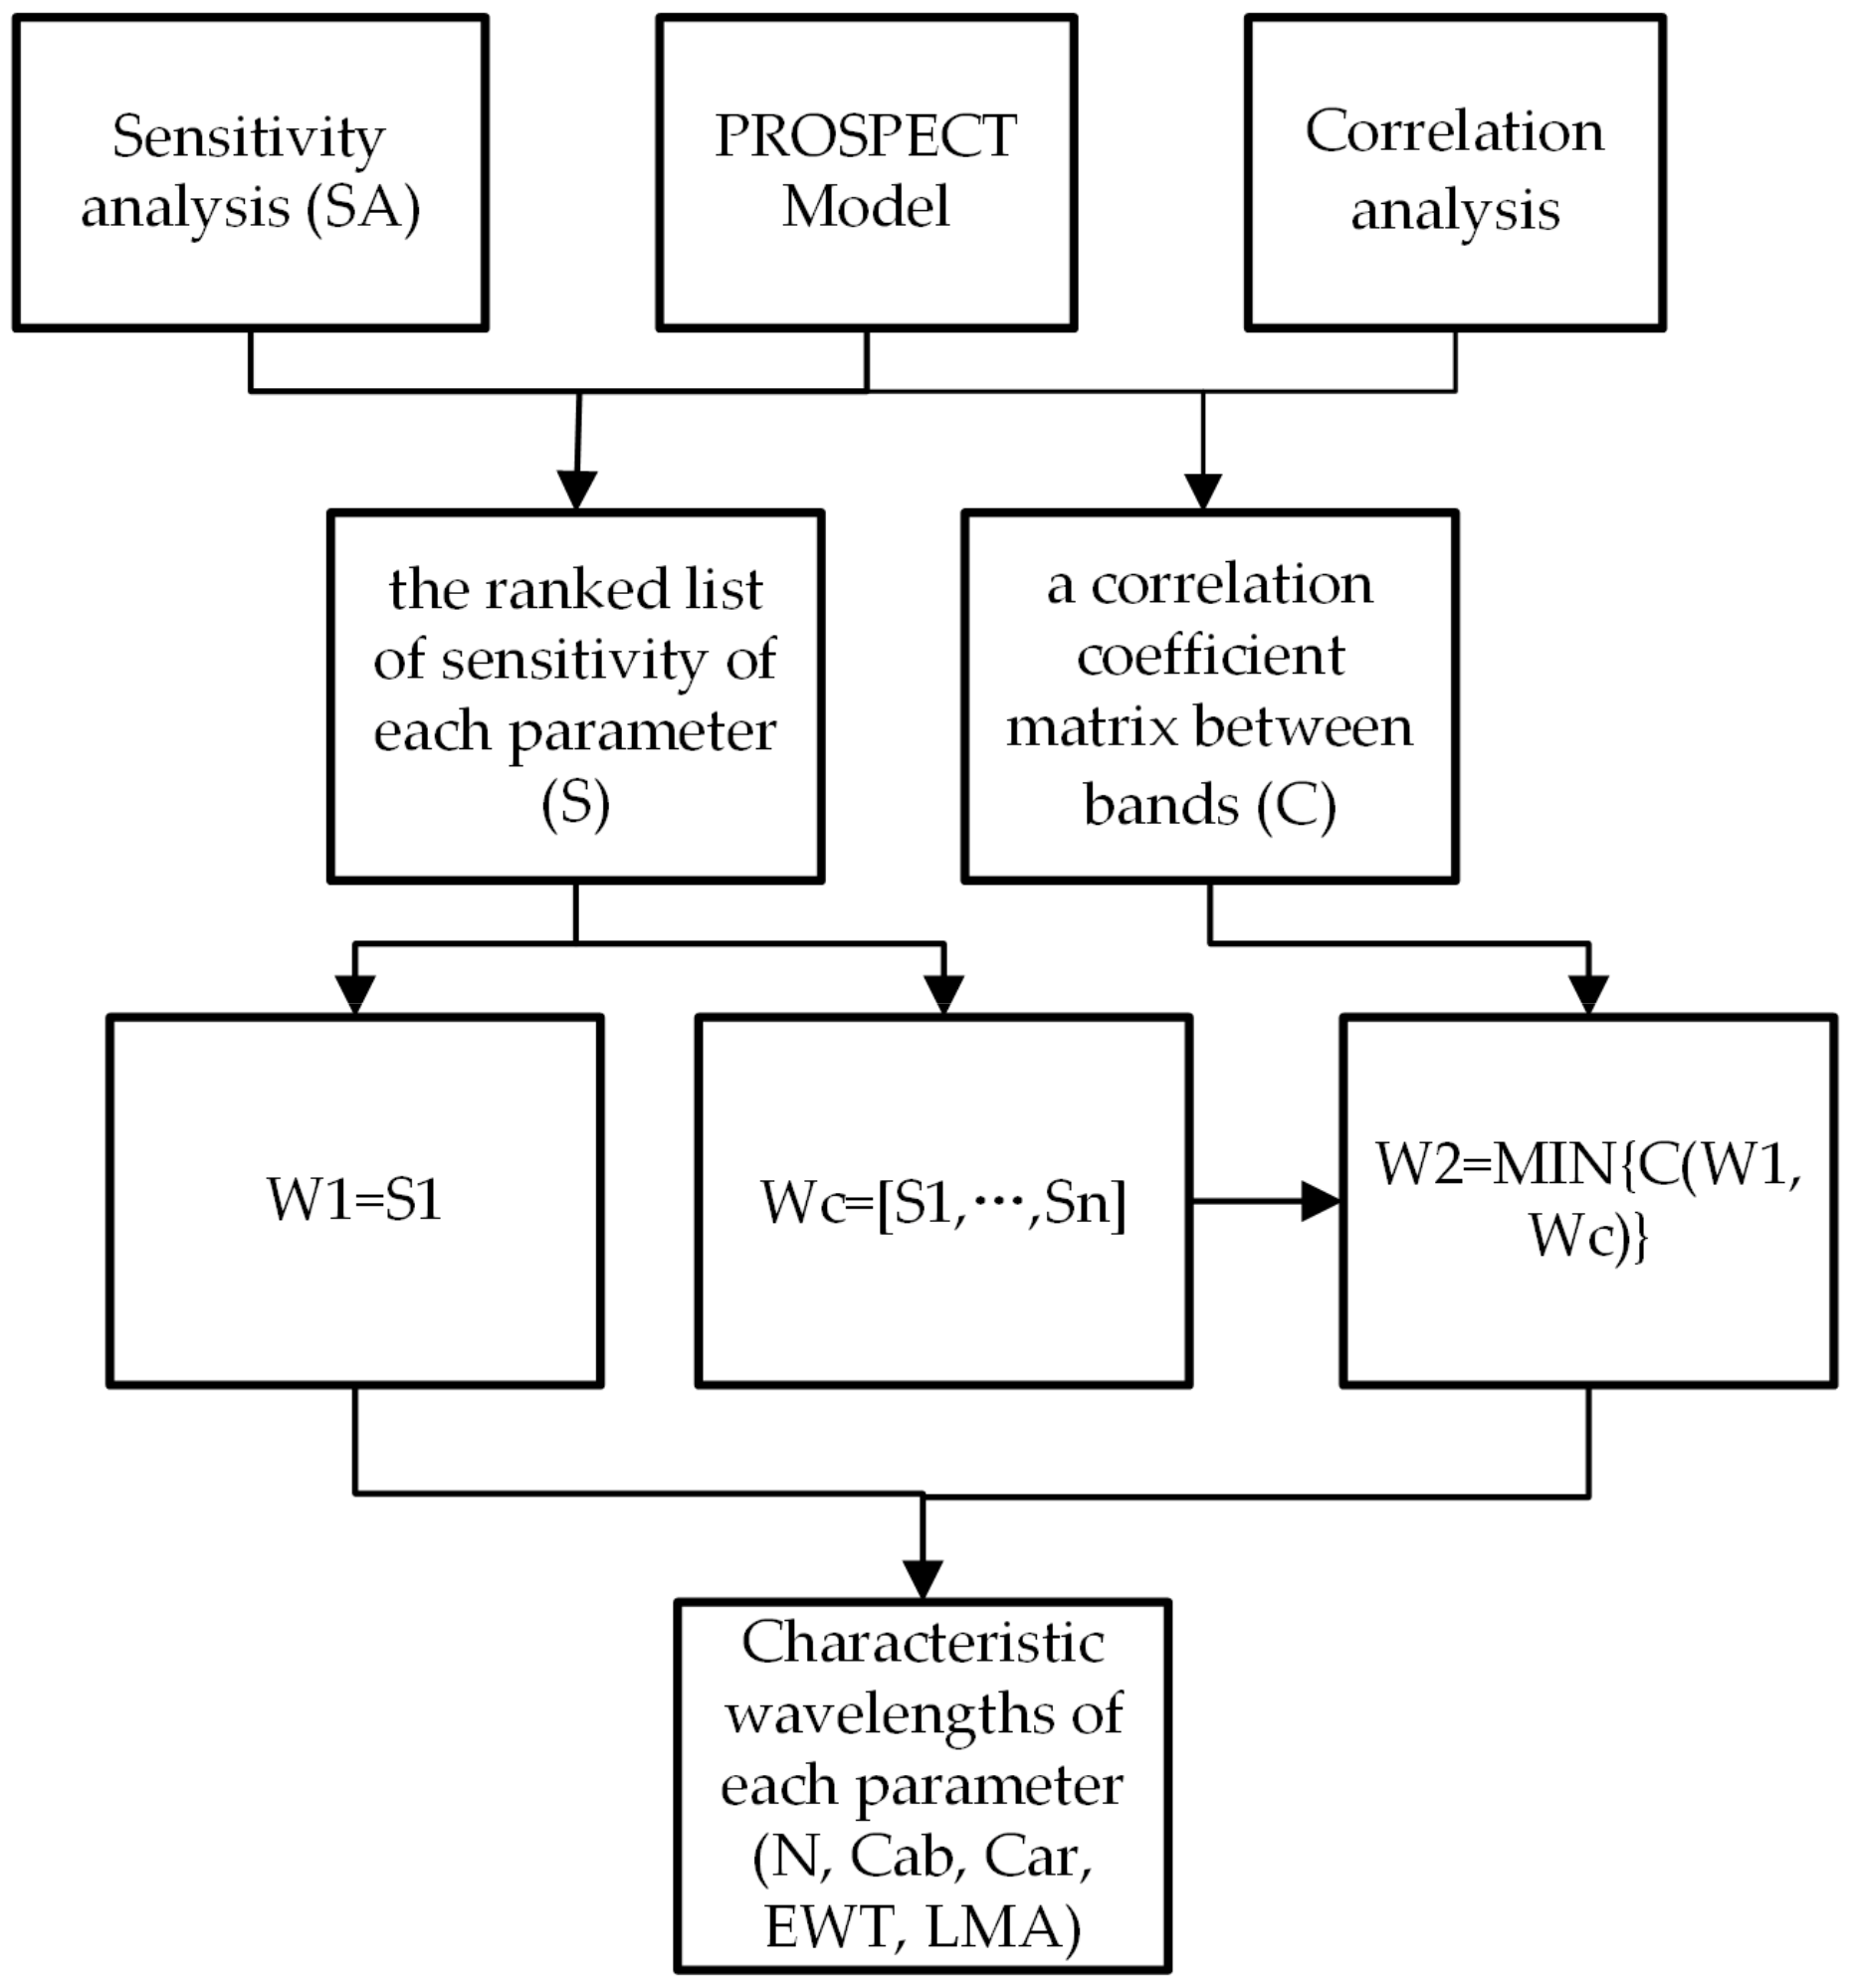
2.2. Characteristic Wavelength Selection Algorithm

Characteristic wavelength selection is based on sensitivity analysis (SA) and correlation analysis between different bands. In this study, SA was applied to calculate the contributions of different leaf biochemical parameters in the PROSPECT5 model towards the leaf reflectances. Sobol’s global SA was completed using a software tool (GSAT) of MATLAB R2015b (MathWorks, Inc.) [43,44]. A ranking list of wavelengths in the range of 400–2500 nm was derived based on the sensitivity of each model parameter to different wavelengths. In addition, the information redundancy between selected wavelengths was reduced by correlation analysis to improve the information validity of the selected wavelengths. The characteristic wavelength selection used the simulation dataset without noise [39].
The workflow chart of the characteristic wavelengths selection algorithm is shown in Figure 1 and the details are as follows.
Step (1) A ranking list of contribution rates/sensitivities (S) of PROSPECT5 input parameters (N, Cab, Car, EWT, and LMA) to leaf reflectance over the 400–2500 nm spectral range was obtained by SA, and a correlation coefficient matrix (C) between bands over the 400–2500 nm spectral range was obtained by correlation analysis (Figure S1).
Step (2) Select the wavelength with the highest sensitivity as the initial wavelength for each model parameter (W1). The first n wavelengths in the ranked list of the sensitivity of each parameter were taken as the candidate wavelength set (Wc). The n value was set according to the sensitivity of each parameter to leaf reflectance (N: n = 400; Cab: n = 100; Car: n = 50; EWT: n = 300; LMA: n = 50).
Step (3) The wavelength with the smallest correlation coefficient between the candidate wavelength set and the initial wavelength was then selected (W2).

2.3. VIs Correlation Analysis and Robustness Analysis

Many VIs have been proposed and utilized to monitor leaf biochemical parameters in previous literature [45,46,47]. In this study, the new ratio VI (nRVI) was constructed by selecting the two characteristic wavelengths that are suitable for EWT estimation based on the characteristic wavelength selection algorithm. To compare the performance of nRVI for EWT estimation, four optimal published VIs were selected based on different datasets by using the statistical model with the highest coefficient of determination (R2) (Table 2). To evaluate the correlation between the selected published VIs, nRVI, and EWT, correlation analysis was performed using the five datasets.
To construct a suitable VI for EWT estimation requires not only achievable correlation with the target parameter EWT but also robustness to other disturbances [48,49]. To assess the robustness of VIs to interfering factors, the effects of wide range variations of N, LMA, and spectral noise on the estimated EWT of VIs were simulated separately using the PROSPECT model.

2.4. Gaussian Process Regression

Different machine learning regression algorithms (MLRAs) are applied for the RTM estimation, for instance, artificial neural network (ANN), support vector regression (SVR), random forest (RF), and Gaussian process regression (GPR) [50,51,52,53]. Several studies have shown that GPR is more accurate among these MLRAs [50,54,55]. GPR is a non-parametric model that prioritizes Gaussian processes and assumes that the training sample is a sample of Gaussian processes for data regression analysis. GPR is essentially a model that uses Bayesian inference for solving, and the kernel function closely influences the model estimates. Indeed, the kernel function in the GPR model describes the covariance function of the correlation between training samples. In this study, the squared exponential kernel function was used. For further details about GPR, see Verrelst et al. and Camps-Valls [50,56,57].

2.5. Statistical Analysis

In this paper, the synthetic datasets were randomly divided into two parts: 70% for training and 30% for validation. Due to the small sample number, in situ datasets were utilized through three-fold cross-validation. Considering the prediction values of GPR mostly based on the training samples, the process of GPR was repeated 100 times for all datasets to ensure stable results. To evaluate the predictive capability of nRVI and selected published VIs for EWT estimation, the R2, root mean square error (RMSE), and normalized RMSE (NRMSE) were used.

3. Results

3.1. Selection of Characteristic Wavelengths and nRVI Construction

The characteristic wavelengths of different leaf components were obtained based on the synthetic dataset without noise (n = 1000). Table 3 lists the selected characteristics wavelengths.
This study focused on the estimation of EWT by using constructed nRVI based on selected characteristic wavelengths. Thus, how to effectively determine the wavelength of VI according to the selected characteristic wavelengths of different biochemical parameters is the first problem that needs to be solved. Then, the effect of combined characteristic wavelengths of different biochemical parameters and EWT on the accuracy of EWT estimation were analyzed.
Table 4 presents the effect of combined characteristic wavelengths of different biochemical parameters and EWT on the accuracy of EWT estimation by using the five datasets. The results showed that the combination with the characteristic wavelengths of EWT and N is optimal for EWT estimation with higher R2 values and lower RMSE and NRMSE values than other combinations. However, two characteristic wavelengths of EWT, which does not contain enough information, were selected to estimate EWT. The accuracy of EWT estimation by adding the characteristic wavelengths of N was improved further than by adding the characteristic wavelengths of other biochemical parameters (Cab, Car, and LMA). Thus, the characteristic wavelengths of EWT + N (746, 1089, 1398, and 1906 nm) were extracted and used for further analysis.
Two feature bands are selected for each biochemical parameter and whether it will influence the precision of EWT estimation. Then, the effect of the number of wavelengths on EWT reversion is discussed, and the results are listed in Table 5.
Table 5 shows that the accuracy of EWT estimation based on GPR is not directly proportional to the number of bands. The estimation results of full-wavelength (400–2500 nm) are obviously inferior to that of full-characteristics wavelengths (10), and characteristic wavelength EWT + N (4). For the full-wavelength (400–2500 nm), the reflectance information between adjacent bands has a great correlation and collinearity. Thus, it can influence the convergence and efficiency of regression algorithms using full-band variables that serve as input parameters to train the statistical model [58]. However, the difference between the performance of full-characteristic wavelengths (10) and characteristic wavelength EWT + N (4) for EWT estimation does not clearly exclude the data synthetic spectrum with 2% random Gaussian noise. For the synthetic data with 2% random Gaussian noise, the possible interpretation is that the Gaussian noise differs from the actual measurement error, and such a difference will influence the analysis results. In addition, the superior capacity of the four characteristic wavelengths of EWT + N compared with that of the two characteristic wavelengths of EWT for EWT estimation based on the five datasets. Thus, the spectral information is adequate for EWT estimation based on the selected characteristic wavelengths of EWT + N (4).
Table 4 and Table 5 demonstrate that the characteristic wavelengths of N exhibited the greatest influence on EWT estimation among these biochemical parameters. Therefore, two characteristic wavelengths from N and EWT were selected, then constructed the new ratio VI (nRVI) for EWT estimation. Two optimal wavelengths were selected based on the SA of the spectrum by using the PROSPECT model and the correlation between the reflectance spectra of characteristic wavelengths of N + EWT and EWT parameter. The position of four characteristic wavelengths of N and EWT was listed in the SA of biochemical parameters (Figure 2). The correlation between the reflectance spectra of characteristic wavelengths of N + EWT and EWT parameter is shown in Figure 3.
Figure 2 demonstrates that the region of EWT characteristic wavelengths was influenced by other biochemical parameters. Thus, the influence of other parameters needs to be eliminated to improve the accuracy of EWT monitoring. The characteristic wavelength at 746 nm is located at the range of the red-edge band, which belongs to a transition band. The reflectance spectrum at 746 nm was affected by Cab and LMA. However, the spectrum at 1089 nm was less affected by other pigments than the characteristic wavelength at 746 nm. Thus, the characteristic wavelength of N at 1089 nm was selected as a band for constructing nRVI.
For the characteristic wavelength of EWT, the major influencing factors include N, EWT, and their interaction. The contribution ratio of interaction at 1096 nm is higher than that at 1398 nm based on SA. In addition, the correlation between the spectrum information at 1398 nm and the EWT parameter is higher than that at 1906 nm (Figure 3). The characteristic wavelengths of N at 746 and 1089 nm exhibited low correlations with EWT parameter. Hence, the characteristic wavelength at 1398 nm was selected as another band to construct nRVI. Therefore, two characteristics wavelengths (1089 and 1398 nm) were selected to build the nRVI (nRVI = R1089/R1398) in this study.

3.2. Correlation Analysis Between the nRVI, Selected Published VIs, and EWT

The correlations between the four selected published VIs and EWT for five corresponding datasets are provided in Figure 4. The correlations between the nRVI and EWT for all five datasets are shown in Figure 5.
Figure 5 shows that nRVI formed a significant positive relationship with EWT for all five datasets. The correlation between nRVI and EWT was stronger than the selected VIs for synthetic spectrum with 2% random Gaussian noise, ANGERS, LOPEX and JR datasets. For synthetic spectrum with 2% random Gaussian noise, LOPEX and JR datasets, the correlations (R2 = 0.782, 0.907, and 0.813; RMSE = 0.311%, 0.209%, and 0.27%) between nRVI and EWT (Figure 5b,d,e) were better than the correlations (R2 = 0.681, 0.828, and 0.701; RMSE = 0.376%, 0.284%, and 0.34%) among WBI, NDII, SR, and EWT (Figure 4b,d,e). For the synthetic dataset without noise, the unremarkable differences were observed in the correlations (R2 = 0.952, RMSE = 0.147%) between WBI and EWT (Figure 4a) and between nRVI and EWT (R2= 0.948, RMSE = 0.152%, Figure 5a). These results suggested that the built nRVI based on the selected characteristic wavelengths using a physical model can be applied in estimating EWT in this study.

3.3. Robustness Analysis

The results of Section 3.2 show that the nRVI was more likely to achieve high precision EWT estimation than other VIs. However, the robustness of nRVI to interference factors, for instance, N, LMA, and spectral noise, should be explored in depth for EWT estimation. The results of the robust analysis are as follows.

3.3.1. Robustness to the Change of N

The influences of N on nRVI and the other VIs are shown in Figure 6. For the five VIs, the value of N affected the relationships between the VIs and EWT, especially at high EWT contents. Among them, the influences of N on SR were relatively large in the case of the lowest value of N (N = 1) and the high EWT values (0.045–0.07 cm). Compared to SR, the other VIs revealed less variability and more stability in the change of N.
Figure 7 indicates the performance of the five VIs for EWT estimation across various N values based on the synthetic dataset with 2% Gaussian noise. WBI performed worst for the whole range of N in Figure 7. While Figure 6 showed that the effect of N on WBI was small, the worst performance of WBI may be caused by the artificial noise of synthetic dataset. SR had the worst R2 for EWT estimation only at a low N value (N = 1) that was consistent with Figure 6. The performance of MSI and NDII for EWT estimation was almost the same. Hence, the robustness of VIs to N changes was only related to the associated bands and independent of the form of indices. Compared to the other VIs, nRVI had the highest accuracy and the best stability for EWT estimation across various N values.

3.3.2. Robustness to the Change of LMA

The influence of LMA on nRVI and the published VIs are shown in Figure 8. For nRVI, WBI, and SR, the effect of LMA content on the relationship between EWT and VIs was less than that of MSI and NDII, especially at low EWT values (0.005–0.035 cm). nRVI, SR, and WBI all showed lower variability and higher resistance to the changing LMA content at low EWT values (0.005–0.035 cm). For MSI and NDII, LMA (0.005–0.03 g/cm2) effects were greater throughout the range of EWT variation (0.005–0.07 cm).
Figure 9 indicates the performance of the five VIs for EWT estimation across various LMA contents based on the synthetic dataset with 2% Gaussian noise. WBI still performed worst for the whole range of LMA values that are similar to N changes, according to Figure 7 and Figure 9, and the possible reason was the adding artificial noise in the synthetic dataset. The precision of MSI and NDII was also almost the same. When LMA = 0.005 g/cm2, the R2 of MSI, NDII, and SR were 0.6816, 0.6816, and 0.6932, while when LMA = 0.03 g/cm2, the R2 of MSI, NDII, and SR decreased to 0.3375, 0.3350, and 0.5439. This indicated that the accuracy of MSI, NDII, and SR for EWT estimation decreased obviously with the increase of LMA content. The nRVI still performed best no matter how the LMA content changed.

3.3.3. Robustness to the Change of Spectral Noise

Figure 10 indicates the performance of nRVI, WBI, MSI, SR, and NDII for EWT estimation based on synthetic datasets with various random Gaussian noise. According to the results, all VIs performed the best accuracy without added noise. For the effects of adding noise, the higher the level of added noise, the greater the impact on VIs, but the five VIs were affected to varying degrees. WBI had no resistance to spectral noise regardless of the level of added noise, which was consistent with its performance in Figure 7 and Figure 9. The worst performance of WBI in Figure 7 and Figure 9 was due to the use of synthetic datasets with added artificial noise. SR had poor accuracy and great instability when the level of added noise was high (>2%). Therefore, the WBI and SR are maybe not appropriate indices for EWT estimation due to the sensitivity to the spectral noise. The accuracy of MSI and NDII for EWT estimation decreased sharply with the increase of noise level. However, nRVI had the best performance for EWT estimation in spectral noise resistance compared with the other VIs. Therefore, nRVI had the highest robustness to interference factors for EWT estimation.

3.4. Validation of the Performance of nRVI and Selected VIs for EWT Estimation

The performances of nRVI and four selected VIs (WBI, MSI, SR, and NDII) for EWT estimation are analyzed based on the GPR model using two synthetic and three public experimental datasets. The reversion results are shown in Table 6.
The capabilities of nRVI and selected VIs for EWT monitoring based on the GPR model by using different datasets are validated (Table 6). All indices exhibited the best performance for the synthetic dataset without noise, followed by ANGERS, and with the poorest performance observed in JR. Possibly, the synthesized dataset without noise was ideal, whereas the ANGERS, LOPEX, and JR datasets contained different species and measurement errors, especially for the JR dataset, which included too few samples. For the synthetic data with noise, the addition of noise significantly reduced the accuracy of EWT estimation for the five VIs compared to the synthesized dataset without noise, but the noise had the least effect on the nRVI.
Among these VIs, nRVI exhibited better performance in EWT estimation compared with the other VIs with the five different datasets. Due to the sensitivity to spectral noise, WBI performed worst on EWT estimation in the synthetic data with noise. MSI and NDII still showed similar results on EWT estimation in all datasets as in robustness analysis. They were just superior to the WBI and SR and almost consistent with nRVI for EWT estimation using the LOPEX dataset. But for the other datasets, MSI and NDII cannot perform as well as nRVI all the time. nRVI possesses a better capability to estimate EWT than other VIs and provides satisfactory accuracy in EWT estimation for different datasets.
The results presented in Table 6 suggest that the nRVI performed well in EWT estimation for synthetic and in situ datasets. Thus, nRVI, which was built based on the selected characteristic wavelengths by using the physical model, exhibited better universality and stability in the evaluation of EWT than the four selected optimal VIs based on the statistical model.

4. Discussion

In this study, nRVI was built for EWT estimation based on two selected optimal characteristic wavelengths (1089 and 1398 nm) by using a physical model. Then, the correlation between the nRVI and EWT and that between the published four VIs and EWT were analyzed. Results showed that the nRVI features a remarkably positive correlation with EWT (Figure 5). Additionally, the nRVI and four other optimal published VIs were evaluated in the sensitivity of EWT and the insensitivity of the interference (e.g., N, LMA, and spectral noise). Last, the performance of nRVI and published VIs for EWT estimation based on the GPR model was analyzed and compared using five datasets (one synthetic dataset without noise, one synthetic dataset with 2% random Gaussian noise, and ANGERS, LOPEX, and JR datasets).
In previous studies, numerous researchers have investigated the selection of sensitive wavelength for leaf biochemical parameter estimation based on the PROSPECT model. Zarco-Tejada et al. [59] indicated that in the inversion of coupling of the canopy model to PROSPECT, utilizing red-edge spectral index (e.g., 750 and 710 nm) in function minimization outperformed that utilizing all single spectral reflectance bands from hyperspectral images. Song et al. [60] used multivariate analysis and correlation between adjacent bands methods to obtain major wavelengths; then, four selected narrow bands (552, 675, 705, and 776 nm) were subsequently used to monitor nitrogen stress in paddy rice, and wavelengths of 1158, 1378, and 1965 nm were selected and applied to estimate irrigation stress. He et al. [61] proposed an angular insensitivity vegetation index (AIVI) based on green, blue, and red-edge bands; AIVI exhibited the highest association with leaf nitrogen concentration compared with traditional VIs. Sun et al. [39] proposed a method of wavelength selection by the PROSPECT model and established band combinations to evaluate leaf Cab and EWT. These studies showed the feasibility of wavelength selection for leaf trait estimation. According to Table 5, the precision of EWT estimation using characteristic wavelengths was superior to the performance of full-wavelengths for EWT estimation based on GPR. Compared with full-wavelength, the characteristic wavelengths can be efficient and time-saving in the estimation of leaf biochemical parameters. However, previous studies rarely focused on the application of characteristic wavelengths for the biochemical parameter estimation based on a physical model.
Furthermore, most of the published VIs were established based on water absorption wavelengths selected by the statistical model, for instance, 970 nm for WBI [9], 1450 nm for SR [46], and 1600 nm for NDII and MSI [11,62]. The published VIs for EWT estimation is limited by certain datasets or plant species. Moreover, the selection of wavelengths for the construction of VIs is based on the statistical model for specific vegetation species and lacks a certain physical mechanism and universality. Considering the restriction of wavelength selection and published VIs for leaf biochemical parameter estimation based on a statistical model, characteristic wavelengths were selected by using the physical model PROSPECT based on the SA. Then, two optimal characteristic wavelengths (1089 and 1398 nm) were selected to build the nRVI (nRVI = R1089/R1398) for EWT estimation. Additionally, the robustness of nRVI and the four published VIs in N, LMA, and spectral noise was analyzed, and the anti-interference ability of the published four VIs was weak. But nRVI exhibited better anti-interference ability and sensitivity to target parameters. Meanwhile, based on the results shown in Table 6, the nRVI method exhibited better accuracy and robustness in EWT estimation than the four selected optimal VIs based on the statistical model. Furthermore, nRVI can partly decouple the influence of N and LMA on EWT estimation. Hence, the built nRVI based on the selected characteristic wavelengths by using the physical model exhibited better universality and stability in the EWT estimation than the published VIs, which can guide agricultural water management.
The results in Section 3.3 and Section 3.4 indicated that the MSI and NDII performed significant similarity in robustness analysis and EWT estimation based on GPR. MSI and NDII involved the same wavelengths but only in a different form of the indices. This maybe illustrates that the selected wavelengths of VIs are more critical than the selection form of indices in EWT estimation or other biochemical parameters.
Different methods were used for the estimation of leaf biochemical parameters. Colombo et al. [18] used inverse ordinary least squares (OLS) and reduced major axis (RMA) regression methods to estimate EWT by different spectral indices, and RMA obtained the best regression results by spectral indices related to the continuous removal area at 1200 nm with 61% explained variance and 6.6% prediction error. Feret et al. [32] used two regression methods, spectral indices, and partial least squares (PLS) for the retrieval of leaf biochemical parameters, and the RMSEs of the two methods in EWT estimation of experimental data were 0.0037 cm and 0.0025 cm, respectively. Sun et al. [39] performed the inversion of Cab and EWT by the PROSPECT model using selected characteristic wavelengths; the RMSE of EWT estimation for ANGERS, LOPEX, and JR datasets was 0.0023 cm, 0.0029 cm, and 0.0059 cm. Verrelst et al. [37] estimated Cab form hyperspectral reflectance data using GPR, and the GPR regression model was well validated for measured data. This study used the constructed new ratio VI (nRVI) to perform well in the EWT estimation of simulated and in situ datasets through the GRP model. Compared with the traditional methods for estimating leaf biochemical parameters, machine learning methods are more robust and stable, and their application in leaf and canopy scale parameter retrieval is becoming more widespread.
Although significant discoveries were revealed in this study, the limitations require further discussion. First, to determine the optimal wavelength of VIs, two characteristic wavelengths were selected for each leaf biochemical parameter through the PROSPECT-5 model. The effect of the number of characteristic wavelengths on the performance of built nRVI for EWT estimation should be discussed in the following researches. In addition, the optimal characteristic wavelengths of nRVI were determined through a physical model, and universality was verified by using large quantities of synthetic and experimental datasets. However, the discussion about the effect of plant species and different growth stages on EWT estimation remains lacking. Hence, more vegetation species and measured field datasets should be included in future work. Although nRVI has performed well in different datasets at the leaf scale, there has been no further study at canopy or aerial, or even spaceborne scale. Canopy water concentration is an important variable for the evaluation of plant water status. The effect of leaf area index (LAI) on nRVI performance needs to be considered at the canopy scale, as changes in LAI can lead to confusion of spectral features with water, which can reduce the accuracy of canopy water concentration estimation [63]. In addition to LAI, canopy water content estimation using nRVI also needs to consider the effects of soil background, leaf inclination, and canopy structure. These factors affect not only the nRVI to canopy scale, but also all leaf scale biochemical parameter retrieval methods up to canopy scale [61]. For the scale issue, a model retrieval method for estimating leaf reflectance spectra using canopy remote sensing canopy spectra data was proposed [64,65]. Using the top-down inversion model, leaf reflectance spectra can be obtained from remote sensing data, thus allowing nRVI to be used for canopy water content estimation.

5. Conclusions

This study extracted the characteristic wavelengths of leaf biochemical parameters (N, Cab, Car, EWT, and LMA) by using the proposed characteristic wavelengths selection algorithm based on the PROSPECT model. The effect of combined characteristic wavelengths of EWT and different biochemical parameters on the accuracy of EWT estimation was analyzed. Results demonstrated that the characteristic wavelengths of N exhibited the greatest effect on EWT estimation, and two characteristics wavelengths (1089 and 1398 nm) were selected to build nRVI (nRVI = R1089/R1398) for EWT estimation. The robustness of nRVI and the four published VIs in N, LMA, and spectral noise was analyzed, and nRVI exhibited better anti-interference ability and sensitivity to target parameter than other parameters. Furthermore, the performance of nRVI for EWT estimation was validated by using two simulation datasets (without and with 2% random Gaussian noise) and three in situ datasets (ANGERS, LOPEX, and JR) based on the GPR model. The nRVI exhibited higher accuracy and robustness in EWT estimation for different types of datasets than published VIs. The characteristic wavelengths of nRVI were selected based on a physical model and could be applied for monitoring crop water deficiency stress accurately, which can provide the guidance for agricultural water management. Besides, the proposed method features the promising potential for application in different environments for various kinds of plants water deficiency stress.

Supplementary Materials

The following are available online at https://www.mdpi.com/2072-4292/13/4/821/s1, Figure S1: Correlation coefficient (R) between bands over the 400–2500 nm spectral range.

Author Contributions

Conceptualization, J.Y. and Y.Z.; methodology, J.Y. and Y.Z.; software, J.Y. and Y.Z.; validation, J.Y., L.D. and Y.Z.; formal analysis, J.Y., X.L., Y.Z., S.S. and B.C.; investigation, J.Y. and Y.Z.; resources, J.Y. and Y.Z.; data curation, J.Y. and Y.Z.; writing—original draft preparation, J.Y. and Y.Z.; writing—review and editing, J.Y., X.L., Y.Z., L.D., S.S. and B.C.; visualization, J.Y. and Y.Z.; supervision, J.Y.; project administration, J.Y.; funding acquisition, J.Y. All authors have read and agreed to the published version of the manuscript.

Funding

This research was funded by the National Key R&D Program of China (No. 2018YFB0504500), the National Natural Science Foundation of China (No. 41801268), Natural Science Foundation of Hubei Province (2019CFB532), Gansu Province Science and Technology Foundation (20JR10RA559).

Institutional Review Board Statement

Not applicable.

Informed Consent Statement

Not applicable.

Data Availability Statement

Data available on request.

Acknowledgments

We also thank the open access to the LOPEX, ANGERS, and JR datasets, and the PROSPECT model.

Conflicts of Interest

The authors declare no conflict of interest.

References

  1. Ceccato, P.; Flasse, S.; Gregoire, J.M. Designing a spectral index to estimate vegetation water content from remote sensing data—Part 2. Validation and applications. Remote Sens. Environ. 2002, 82, 198–207. [Google Scholar] [CrossRef]
  2. Ceccato, P.; Gobron, N.; Flasse, S.; Pinty, B.; Tarantola, S. Designing a spectral index to estimate vegetation water content from remote sensing data: Part 1: Theoretical approach. Remote Sens. Environ. 2002, 82, 188–197. [Google Scholar] [CrossRef]
  3. Stimson, H.C.; Breshears, D.D.; Ustin, S.L.; Kefauver, S.C. Spectral sensing of foliar water conditions in two co-occurring conifer species: Pinus edulis and Juniperus monosperma. Remote Sens. Environ. 2005, 96, 108–118. [Google Scholar] [CrossRef]
  4. Ullah, S.; Skidmore, A.K.; Groen, T.A.; Schlerf, M. Evaluation of three proposed indices for the retrieval of leaf water content from the mid-wave infrared (2–6 µm) spectra. Agric. For. Meteorol. 2013, 171, 65–71. [Google Scholar] [CrossRef]
  5. Fang, M.H.; Ju, W.M.; Zhan, W.F.; Cheng, T.; Qiu, F.; Wang, J. A new spectral similarity water index for the estimation of leaf water content from hyperspectral data of leaves. Remote Sens. Environ. 2017, 196, 13–27. [Google Scholar] [CrossRef]
  6. Cheng, T.; Rivard, B.; Sanchez-Azofeifa, A. Spectroscopic determination of leaf water content using continuous wavelet analysis. Remote Sens. Environ. 2011, 115, 659–670. [Google Scholar] [CrossRef]
  7. Cheng, T.; Rivard, B.; Sanchez-Azofeifa, A.G.; Feret, J.B.; Jacquemoud, S.; Ustin, S.L. Predicting leaf gravimetric water content from foliar reflectance across a range of plant species using continuous wavelet analysis. J. Plant Physiol. 2012, 169, 1134–1142. [Google Scholar] [CrossRef]
  8. Penuelas, J.; Pinol, J.; Ogaya, R.; Filella, I. Estimation of plant water concentration by the reflectance water index WI (R900/R970). Int. J. Remote Sens. 1997, 18, 2869–2875. [Google Scholar] [CrossRef]
  9. Penuelas, J.; Filella, I.; Biel, C.; Serrano, L.; Save, R. The reflectance at the 950-970 Nm region as an indicator of plant water status. Int. J. Remote Sens. 1993, 14, 1887–1905. [Google Scholar] [CrossRef]
  10. Cao, Z.; Wang, Q.; Zheng, C. Best hyperspectral indices for tracing leaf water status as determined from leaf dehydration experiments. Ecol. Indic. 2015, 54, 96–107. [Google Scholar] [CrossRef]
  11. Ceccato, P.; Flasse, S.; Tarantola, S.; Jacquemoud, S.; Gregoire, J.M. Detecting vegetation leaf water content using reflectance in the optical domain. Remote Sens. Environ. 2001, 77, 22–33. [Google Scholar] [CrossRef]
  12. Knipling, E.B. Physical and physiological basis for the reflectance of visible and near-infrared radiation from vegetation. Remote Sens. Environ. 1970, 1, 155–159. [Google Scholar] [CrossRef]
  13. Thomas, J.R.; Namken, L.N.; Oerther, G.F.; Brown, R.G. Estimating leaf water content by reflectance measurements. Agron. J. 1971, 63, 845–847. [Google Scholar] [CrossRef]
  14. Tucker, C.J. Remote sensing of leaf water content in the near infrared. Remote Sens. Environ. 1979, 10, 23–32. [Google Scholar] [CrossRef]
  15. Maki, M.; Ishiahra, M.; Tamura, M. Estimation of leaf water status to monitor the risk of forest fires by using remotely sensed data. Remote Sens. Environ. 2004, 90, 441–450. [Google Scholar] [CrossRef]
  16. Jacquemoud, S.; Ustin, S.L.; Verdebout, J.; Schmuck, G.; Andreoli, G.; Hosgood, B. Estimating leaf biochemistry using the PROSPECT leaf optical properties model. Remote Sens. Environ. 1996, 56, 194–202. [Google Scholar] [CrossRef]
  17. Riano, D.; Vaughan, P.; Chuvieco, E.; Zarco-Tejada, P.J.; Ustin, S.L. Estimation of fuel moisture content by inversion of radiative transfer models to simulate equivalent water thickness and dry matter content: Analysis at leaf and canopy level. IEEE Trans. Geosci. Remote 2005, 43, 819–826. [Google Scholar] [CrossRef]
  18. Colombo, R.; Merom, M.; Marchesi, A.; Busetto, L.; Rossini, M.; Giardino, C.; Panigada, C. Estimation of leaf and canopy water content in poplar plantations by means of hyperspectral indices and inverse modeling. Remote Sens. Environ. 2008, 112, 1820–1834. [Google Scholar] [CrossRef]
  19. Combal, B.; Baret, F.; Weiss, M.; Trubuil, A.; Mace, D.; Pragnere, A.; Myneni, R.; Knyazikhin, Y.; Wang, L. Retrieval of canopy biophysical variables from bidirectional reflectance—Using prior information to solve the ill-posed inverse problem. Remote Sens. Environ. 2003, 84, 1–15. [Google Scholar] [CrossRef]
  20. Jacquemoud, S. Inversion of the PROSPECT + SAIL canopy reflectance model from AVIRIS equivalent spectra: Theoretical-Study. Remote Sens. Environ. 1993, 44, 281–292. [Google Scholar] [CrossRef]
  21. Allen, W.A.; Gausman, H.W.; Richardson, A.J.; Thomas, J.R. Interaction of isotropic light with a compact plant leaf. JOSA 1969, 59, 1376–1379. [Google Scholar] [CrossRef]
  22. Jacquemoud, S.; Baret, F. Prospect: A model of leaf optical-properties spectra. Remote Sens. Environ. 1990, 34, 75–91. [Google Scholar] [CrossRef]
  23. Feret, J.-B.; François, C.; Asner, G.P.; Gitelson, A.A.; Martin, R.E.; Bidel, L.P.R.; Ustin, S.L.; le Maire, G.; Jacquemoud, S. PROSPECT-4 and 5: Advances in the leaf optical properties model separating photosynthetic pigments. Remote Sens. Environ. 2008, 112, 3030–3043. [Google Scholar] [CrossRef]
  24. Feret, J.B.; Gitelson, A.A.; Noble, S.D.; Jacquemoud, S. PROSPECT-D: Towards modeling leaf optical properties through a complete lifecycle. Remote Sens. Environ. 2017, 193, 204–215. [Google Scholar] [CrossRef] [Green Version]
  25. Jiang, J.; Comar, A.; Burger, P.; Bancal, P.; Weiss, M.; Baret, F. Estimation of leaf traits from reflectance measurements: Comparison between methods based on vegetation indices and several versions of the PROSPECT model. Plant Methods 2018, 14, 23. [Google Scholar] [CrossRef] [PubMed] [Green Version]
  26. Li, D.; Cheng, T.; Jia, M.; Zhou, K.; Lu, N.; Yao, X.; Tian, Y.C.; Zhu, Y.; Cao, W.X. PROCWT: Coupling PROSPECT with continuous wavelet transform to improve the retrieval of foliar chemistry from leaf bidirectional reflectance spectra. Remote Sens. Environ. 2018, 206, 1–14. [Google Scholar] [CrossRef]
  27. Yang, J.; Yang, S.X.; Zhang, Y.Y.; Shi, S.; Du, L. Improving characteristic band selection in leaf biochemical property estimation considering interrelations among biochemical parameters based on the PROSPECT-D model. Opt. Express 2021, 29, 400–414. [Google Scholar] [CrossRef]
  28. Yilmaz, M.T.; Hunt, E.R.; Jackson, T.J. Remote sensing of vegetation water content from equivalent water thickness using satellite imagery. Remote Sens. Environ. 2008, 112, 2514–2522. [Google Scholar] [CrossRef]
  29. Datt, B. Remote sensing of water content in Eucalyptus leaves. Aust. J. Bot. 1999, 47, 909–923. [Google Scholar] [CrossRef]
  30. Eitel, J.U.H.; Gessler, P.E.; Smith, A.M.S.; Robberecht, R. Suitability of existing and novel spectral indices to remotely detect water stress in Populus spp. Forest Ecol. Manag. 2006, 229, 170–182. [Google Scholar] [CrossRef]
  31. Le Maire, G.; Francois, C.; Dufrene, E. Towards universal broad leaf chlorophyll indices using PROSPECT simulated database and hyperspectral reflectance measurements. Remote Sens. Environ. 2004, 89, 1–28. [Google Scholar] [CrossRef]
  32. Féret, J.-B.; François, C.; Gitelson, A.; Asner, G.P.; Barry, K.M.; Panigada, C.; Richardson, A.D.; Jacquemoud, S. Optimizing spectral indices and chemometric analysis of leaf chemical properties using radiative transfer modeling. Remote Sens. Environ. 2011, 115, 2742–2750. [Google Scholar] [CrossRef] [Green Version]
  33. Behmann, J.; Mahlein, A.K.; Rumpf, T.; Romer, C.; Plumer, L. A review of advanced machine learning methods for the detection of biotic stress in precision crop protection. Precis. Agric. 2015, 16, 239–260. [Google Scholar] [CrossRef]
  34. Cipollini, P.; Corsini, G.; Diani, M.; Grasso, R. Retrieval of sea water optically active parameters from hyperspectral data by means of generalized radial basis function neural networks. IEEE Trans. Geosci. Remote Sens. Lett. 2001, 39, 1508–1524. [Google Scholar] [CrossRef]
  35. Verrelst, J.; Munoz, J.; Alonso, L.; Delegido, J.; Rivera, J.P.; Camps-Valls, G.; Moreno, J. Machine learning regression algorithms for biophysical parameter retrieval: Opportunities for Sentinel-2 and -3. Remote Sens. Environ. 2012, 118, 127–139. [Google Scholar] [CrossRef]
  36. Camps-Valls, G.; Bruzzone, L.; Rojo-Alvarez, J.L.; Melgani, F. Robust support vector regression for biophysical variable estimation from remotely sensed images. IEEE Geosci. Remote Sens. Lett. 2006, 3, 339–343. [Google Scholar] [CrossRef]
  37. Verrelst, J.; Alonso, L.; Caicedo, J.P.R.; Moreno, J.; Camps-Valls, G. Gaussian process retrieval of chlorophyll content from imaging spectroscopy data. IEEE J. Sel. Top. Appl. Earth Obs. Remote Sens. 2013, 6, 867–874. [Google Scholar] [CrossRef]
  38. Demarez, V.; Mougin, E.; Marty, G.; Proisy, C.; Dufrene, E.; Le, D.V.; Gastellu-Etchegorry, J.P. Seasonal variation of leaf chlorophyll content of a temperate forest. Inversion of the PROSPECT model. Int. J. Remote Sens. 1999, 20, 879–894. [Google Scholar] [CrossRef]
  39. Sun, J.; Shi, S.; Yang, J.; Gong, W.; Qiu, F.; Wang, L.; Du, L.; Chen, B. Wavelength selection of the multispectral lidar system for estimating leaf chlorophyll and water contents through the PROSPECT model. Agric. Forest Meteorol. 2019, 266-267, 43–52. [Google Scholar] [CrossRef]
  40. Hosgood, B.; Jacquemoud, S.; Andreoli, G. Leaf Optical Properties EXperiment 93 (LOPEX93); Ispra Italy’European Commission, Joint Research Centre Institute of Remote Sensing Applications: Luxembourg, 1994. [Google Scholar]
  41. Martin, J.D.A.A.M.E. Leaf Chemistry, 1992–1993 (ACCP); Oak Ridge National Laboratory: Oak Ridge, TN, USA, 1999. [Google Scholar]
  42. Grossman, Y.L.; Ustin, S.L.; Jacquemoud, S.; Sanderson, E.W.; Schmuck, G.; Verdebout, J. Critique of stepwise multiple linear regression for the extraction of leaf biochemistry information from leaf reflectance data. Remote Sens. Environ. 1996, 56, 182–193. [Google Scholar] [CrossRef]
  43. Bowyer, P.; Danson, F.M. Sensitivity of spectral reflectance to variation in live fuel moisture content at leaf and canopy level. Remote Sens. Environ. 2004, 92, 297–308. [Google Scholar] [CrossRef]
  44. Cannavó, F. Sensitivity analysis for volcanic source modeling quality assessment and model selection. Comput. Geosci. 2012, 44, 52–59. [Google Scholar] [CrossRef]
  45. Hunt, E.R., Jr.; Rock, B.N. Detection of changes in leaf water content using Near- and Middle-Infrared reflectance. Remote Sens. Environ. 1989, 30, 43–54. [Google Scholar]
  46. Seelig, H.D.; Hoehn, A.; Stodieck, L.S.; Klaus, D.M.; Adams, W.W.; Emery, W.J. The assessment of leaf water content using leaf reflectance ratios in the visible, near-, and short-wave-infrared. Int. J. Remote Sens. 2008, 29, 3701–3713. [Google Scholar] [CrossRef]
  47. Yang, J.; Du, L.; Gong, W.; Shi, S.; Sun, J.; Chen, B. Potential of vegetation indices combined with laser-induced fluorescence parameters for monitoring leaf nitrogen content in paddy rice. PLoS ONE 2018, 13, e0191068. [Google Scholar] [CrossRef] [PubMed] [Green Version]
  48. Verstraete, M.M.; Pinty, B. Designing optimal spectral indexes for remote sensing applications. IEEE Trans. Geosci. Remote Sens. 1996, 34, 1254–1265. [Google Scholar] [CrossRef]
  49. Haboudane, D.; Miller, J.R.; Tremblay, N.; Zarco-Tejada, P.J.; Dextraze, L. Integrated narrow-band vegetation indices for prediction of crop chlorophyll content for application to precision agriculture. Remote Sens. Environ. 2002, 81, 416–426. [Google Scholar] [CrossRef]
  50. Verrelst, J.; Alonso, L.; Camps-Valls, G.; Delegido, J.; Moreno, J. Retrieval of vegetation biophysical parameters using gaussian process techniques. IEEE Trans. Geosci. Remote Sens. 2011, 50, 1832–1843. [Google Scholar] [CrossRef]
  51. Karimi, S.; Sadraddini, A.A.; Nazemi, A.H.; Xu, T.; Fard, A.F. Generalizability of gene expression programming and random forest methodologies in estimating cropland and grassland leaf area index. Comput. Electron. Agric. 2018, 144, 232–240. [Google Scholar] [CrossRef]
  52. Durbha, S.S.; King, R.L.; Younan, N.H. Support vector machines regression for retrieval of leaf area index from multiangle imaging spectroradiometer. Remote Sens. Environ. 2007, 107, 348–361. [Google Scholar] [CrossRef]
  53. Bacour, C.; Baret, F.; Béal, D.; Weiss, M.; Pavageau, K. Neural network estimation of LAI, fAPAR, fCover and LAI × C ab, from top of canopy MERIS reflectance data: Principles and validation. Remote Sens. Environ. 2006, 105, 313–325. [Google Scholar] [CrossRef]
  54. Verrelst, J.; Rivera, J.P.; Gitelson, A.; Delegido, J.; Moreno, J.; Camps-Valls, G. Spectral band selection for vegetation properties retrieval using Gaussian processes regression. Int. J. Appl. Earth Obs. Geoinf. 2016, 52, 554–567. [Google Scholar] [CrossRef]
  55. Lazaro-Gredilla, M.; Titsias, M.K.; Verrelst, J.; Camps-Valls, G. Retrieval of biophysical parameters with heteroscedastic gaussian processes. IEEE Geosci. Remote Sens. 2014, 11, 838–842. [Google Scholar] [CrossRef]
  56. Camps-Valls, G.; Gomez-Chova, L.; Muoz-Mari, J.; Vila-Frances, J.; Amoros, J.; Valle-Tascon, S.D.; Calpe-Maravilla, J. Biophysical parameter estimation with adaptive Gaussian Processes. In Proceedings of the Geoscience & Remote Sensing Symposium, Cape Town, South Africa, 12–17 July 2009. [Google Scholar]
  57. Verrelst, J.; Rivera, J.P.; Moreno, J.; Camps-Valls, G. Gaussian processes uncertainty estimates in experimental Sentinel-2 LAI and leaf chlorophyll content retrieval. ISPRS J. Photogramm. Remote Sens. 2013, 86, 157–167. [Google Scholar] [CrossRef]
  58. Huang, X.; Xu, Q.S.; Liang, Y.Z. PLS regression based on sure independence screening for multivariate calibration. Anal. Methods 2012, 4, 2815–2821. [Google Scholar] [CrossRef]
  59. Zarco-Tejada, P.J.; Miller, J.R.; Noland, T.L.; Mohammed, G.H.; Sampson, P.H. Scaling-up and model inversion methods with narrowband optical indices for chlorophyll content estimation in closed forest canopies with hyperspectral data. IEEE Trans. Geosci. Remote Sens. 2001, 39, 1491–1507. [Google Scholar] [CrossRef] [Green Version]
  60. Song, S.L.; Gong, W.; Zhu, B.; Huang, X. Wavelength selection and spectral discrimination for paddy rice, with laboratory measurements of hyperspectral leaf reflectance. ISPRS J. Photogramm. Remote Sens. 2011, 66, 672–682. [Google Scholar] [CrossRef]
  61. He, L.; Song, X.; Feng, W.; Guo, B.B.; Zhang, Y.S.; Wang, Y.H.; Wang, C.Y.; Guo, T.C. Improved remote sensing of leaf nitrogen concentration in winter wheat using multi-angular hyperspectral data. Remote Sens. Environ. 2016, 174, 122–133. [Google Scholar] [CrossRef]
  62. Hardisky, M.A.; Klemas, V.; Smart, R.M. The influence of soil-salinity, growth form, and leaf moisture on the spectral radiance of spartina-alterniflora canopies. Photogramm. Eng. Remote Sensing 1983, 49, 77–83. [Google Scholar]
  63. Asner, G.P.; Martin, R.E. Spectral and chemical analysis of tropical forests: Scaling from leaf to canopy levels. Remote Sens. Environ. 2008, 112, 3958–3970. [Google Scholar] [CrossRef]
  64. Zhang, Y.Q.; Chen, J.M.; Miller, J.R.; Noland, T.L. Leaf chlorophyll content retrieval from airborne hyperspectral remote sensing imagery. Remote Sens. Environ. 2008, 112, 3234–3247. [Google Scholar] [CrossRef]
  65. Simic, A.; Chen, J.M.; Leblanc, S.G.; Dyk, A.; Croft, H.; Han, T. Testing the top-down model inversion method of estimating leaf reflectance used to retrieve vegetation biochemical content within empirical approaches. IEEE J. Sel. Top. Appl. Earth Obs. Remote Sens. 2014, 7, 92–104. [Google Scholar] [CrossRef]
Figure 1. The workflow chart of the characteristic wavelengths selection algorithm.
Remotesensing 13 00821 g001
Figure 2. Position of selected wavelengths of N and EWT in the sensitivity analysis for PROSPECT model for reflectance (N: structure index, Cab: chlorophyll, Car: carotenoid, EWT: equivalent water thickness, LMA: dry matter per area, Interactions: joint global sensitivity for different combinations of parameters).
Remotesensing 13 00821 g002
Figure 3. Correlation between the spectral information of the characteristic wavelengths of N + EWT and EWT parameter by using the synthetic dataset without noise.
Remotesensing 13 00821 g003
Figure 4. Correlations between EWT and selected published vegetation indices (VIs) for different datasets: (a) synthetic spectrum without noise, (b) synthetic spectrum with 2% random Gaussian noise, (c) ANGERS, (d) LOPEX, and (e) JR.
Remotesensing 13 00821 g004
Figure 5. Correlations between EWT and nRVI for the different datasets: (a) synthetic spectrum without noise, (b) synthetic spectrum with 2% random Gaussian noise, (c) ANGERS, (d) LOPEX, and (e) JR.
Remotesensing 13 00821 g005
Figure 6. Robustness of nRVI, WBI, MSI, SR, and NDII to variations in N across various EWT values.
Remotesensing 13 00821 g006
Figure 7. Accuracy of nRVI, WBI, MSI, SR, and NDII for EWT estimation across various N values based on the synthetic dataset with 2% Gaussian noise.
Remotesensing 13 00821 g007
Figure 8. Robustness of nRVI, WBI, MSI, SR, and NDII to variations in LMA across various EWT values.
Remotesensing 13 00821 g008
Figure 9. Accuracy of nRVI, WBI, MSI, SR, and NDII for EWT estimation across various LMA contents based on the synthetic dataset with 2% Gaussian noise.
Remotesensing 13 00821 g009
Figure 10. Accuracy of nRVI, WBI, MSI, SR, and NDII for EWT estimation across various spectral noise based on synthetic datasets with various random Gaussian noise.
Remotesensing 13 00821 g010
Table 1. Distribution characteristics of the leaf parameters for synthetic datasets.
NChlorophyll (Cab) (μg/cm2)Carotenoid (Car) (μg/cm2)Equivalent Water Thickness (EWT) (cm)Dry Matter Content (LMA) (g/cm2)
Mean value1.632.818.510.01290.0077
Standard deviation0.318.873.920.00730.0035
Minimum10.300.040.000050.002
Maximum3.5110300.070.04
Table 2. Selected four published Vegetation Indices (VIs) (WBI, MSI, SR, and NDII) with the highest R2 for the different datasets.
DatasetsSynthetic
Spectrum
without Noise
Synthetic
Spectrum with 2% Random Gaussian Noise
ANGERSLOPEXJR
Vegetation indicesWBIMSISRNDIISR
Formula(R900/R970)(R1600/R820)(R1300/R1450)(R820-R1600)/(R820 + R1600)(R1300/R1450)
R20.9520.6810.9090.8280.701
References[9][40][41][42][41]
Table 3. Selected characteristic wavelengths of leaf biochemical parameters.
NCabCarEWTLMA
Characteristic wavelengths1089 nm,
746 nm
675 nm,
595 nm
520 nm,
400 nm
1906 nm,
1398 nm
2286 nm,
2311 nm
Table 4. Performance of combined different characteristic wavelengths for EWT estimation by using Gaussian process regression (GPR).
Characteristic
Wavelengths-EWT
Characteristic
Wavelengths-EWT + N
Characteristic
Wavelengths- EWT + Cab
Characteristic
Wavelengths- EWT + Car
Characteristic
Wavelengths-EWT + LMA
Synthetic spectrum
without noise
R20.96860.99890.97190.97290.9629
Root mean square error (RMSE)0.00120.00020.00110.00110.0011
Normalized RMSE (NRMSE)8.22701.41157.86547.72307.8063
Synthetic spectrum with 2% random Gaussian noiseR20.67280.85670.68420.69100.6766
RMSE0.00380.00250.00370.00370.0038
NRMSE26.885417.859526.344926.183226.9376
ANGERSR20.75360.92430.78210.71660.7892
RMSE0.00240.00130.00230.00260.0022
NRMSE20.751411.491819.498422.411419.1916
LOPEXR20.69750.91990.69120.69070.7090
RMSE0.00380.00190.00390.00380.0037
NRMSE32.973716.874233.666333.507732.2661
JRR20.35430.78710.48850.58290.3312
RMSE0.00520.00300.00480.00420.0053
NRMSE32.388318.535030.115726.513533.1941
Table 5. Performance of different numbers of wavelengths for EWT estimation by using GPR.
Full-Wavelengths
(400–2500 nm)
Full-Characteristic Wavelengths (10)Characteristic Wavelengths-EWT + N (4)Characteristic Wavelengths-EWT (2)
Synthetic spectrum
without noise
R20.99790.99990.99890.9686
RMSE0.00010.00030.00020.0012
NRMSE0.97120.24071.41158.2270
Synthetic spectrum with 2% random Gaussian noiseR20.12050.89510.85670.6728
RMSE0.01560.00220.00250.0038
NRMSE110.465615.323717.859526.8854
ANGERSR20.51700.92650.92430.7536
RMSE0.00360.00130.00130.0024
NRMSE30.819011.345911.491820.7514
LOPEXR20.86820.90120.91990.6975
RMSE0.00250.00210.00190.0038
NRMSE21.742218.764516.874232.9737
JRR20.41620.76950.78710.3543
RMSE0.00650.00310.00300.0052
NRMSE40.368719.581518.535032.3883
Table 6. Evaluation of VIs for EWT estimation with different datasets by using GPR.
Datasets Vegetation Indices
nRVIWBIMSISRNDII
Synthetic spectrum
without noise
R20.95440.95180.92330.94230.9219
RMSE0.00140.00150.00190.00160.0019
NRMSE10.035910.349813.045111.295013.1296
Synthetic spectrum with 2% random Gaussian noise R20.81880.03200.69310.75540.6904
RMSE0.00280.00660.00370.00330.0037
NRMSE20.239147.044426.238123.303326.5343
ANGERSR20.92840.82800.89820.90970.8948
RMSE0.00130.00200.00150.00150.0016
NRMSE11.133717.339313.337712.570413.5613
LOPEXR20.89380.73630.90230.73040.9023
RMSE0.00220.00350.00210.00360.0021
NRMSE19.585630.748218.701531.275718.7120
JRR20.77660.53310.49500.66020.4991
RMSE0.00300.00430.00440.00360.0044
NRMSE18.478427.053627.763522.717027.6439
Publisher’s Note: MDPI stays neutral with regard to jurisdictional claims in published maps and institutional affiliations.

