
Scale-Aware Neural Network for Semantic Segmentation of Multi-Resolution Remote Sensing Images


Abstract
:1. Introduction
- (1)
- A novel scale-aware neural network is proposed for the semantic segmentation of MSR remotely sensed images. It learns scale-aware feature representation instead of current multi-scale feature representation to address the large-scale variation of geo-objects in MSR remotely sensed images.
- (2)
- We developed a simple yet effective spatial feature recalibration module with a dual-branched structure. It enhances the scale-invariant feature representation by modelling the spatial relationship within semantic features, providing a new perspective for alleviating the effects of loss in object details at coarse resolutions.
- (3)
- We propose a densely connected feature fusion module to obtain high-quality multi-scale representation. To leverage the advantage of the SPP architecture in multi-scale information capture, we designed the large-field connection to enlarge the receptive field of high-level features for further connecting with features at different levels. In addition, we employed weighted fusion operations for multi-level feature aggregation. It increases the generalization of fused features significantly by reducing the latent fitting residual.
2. Materials and Methods
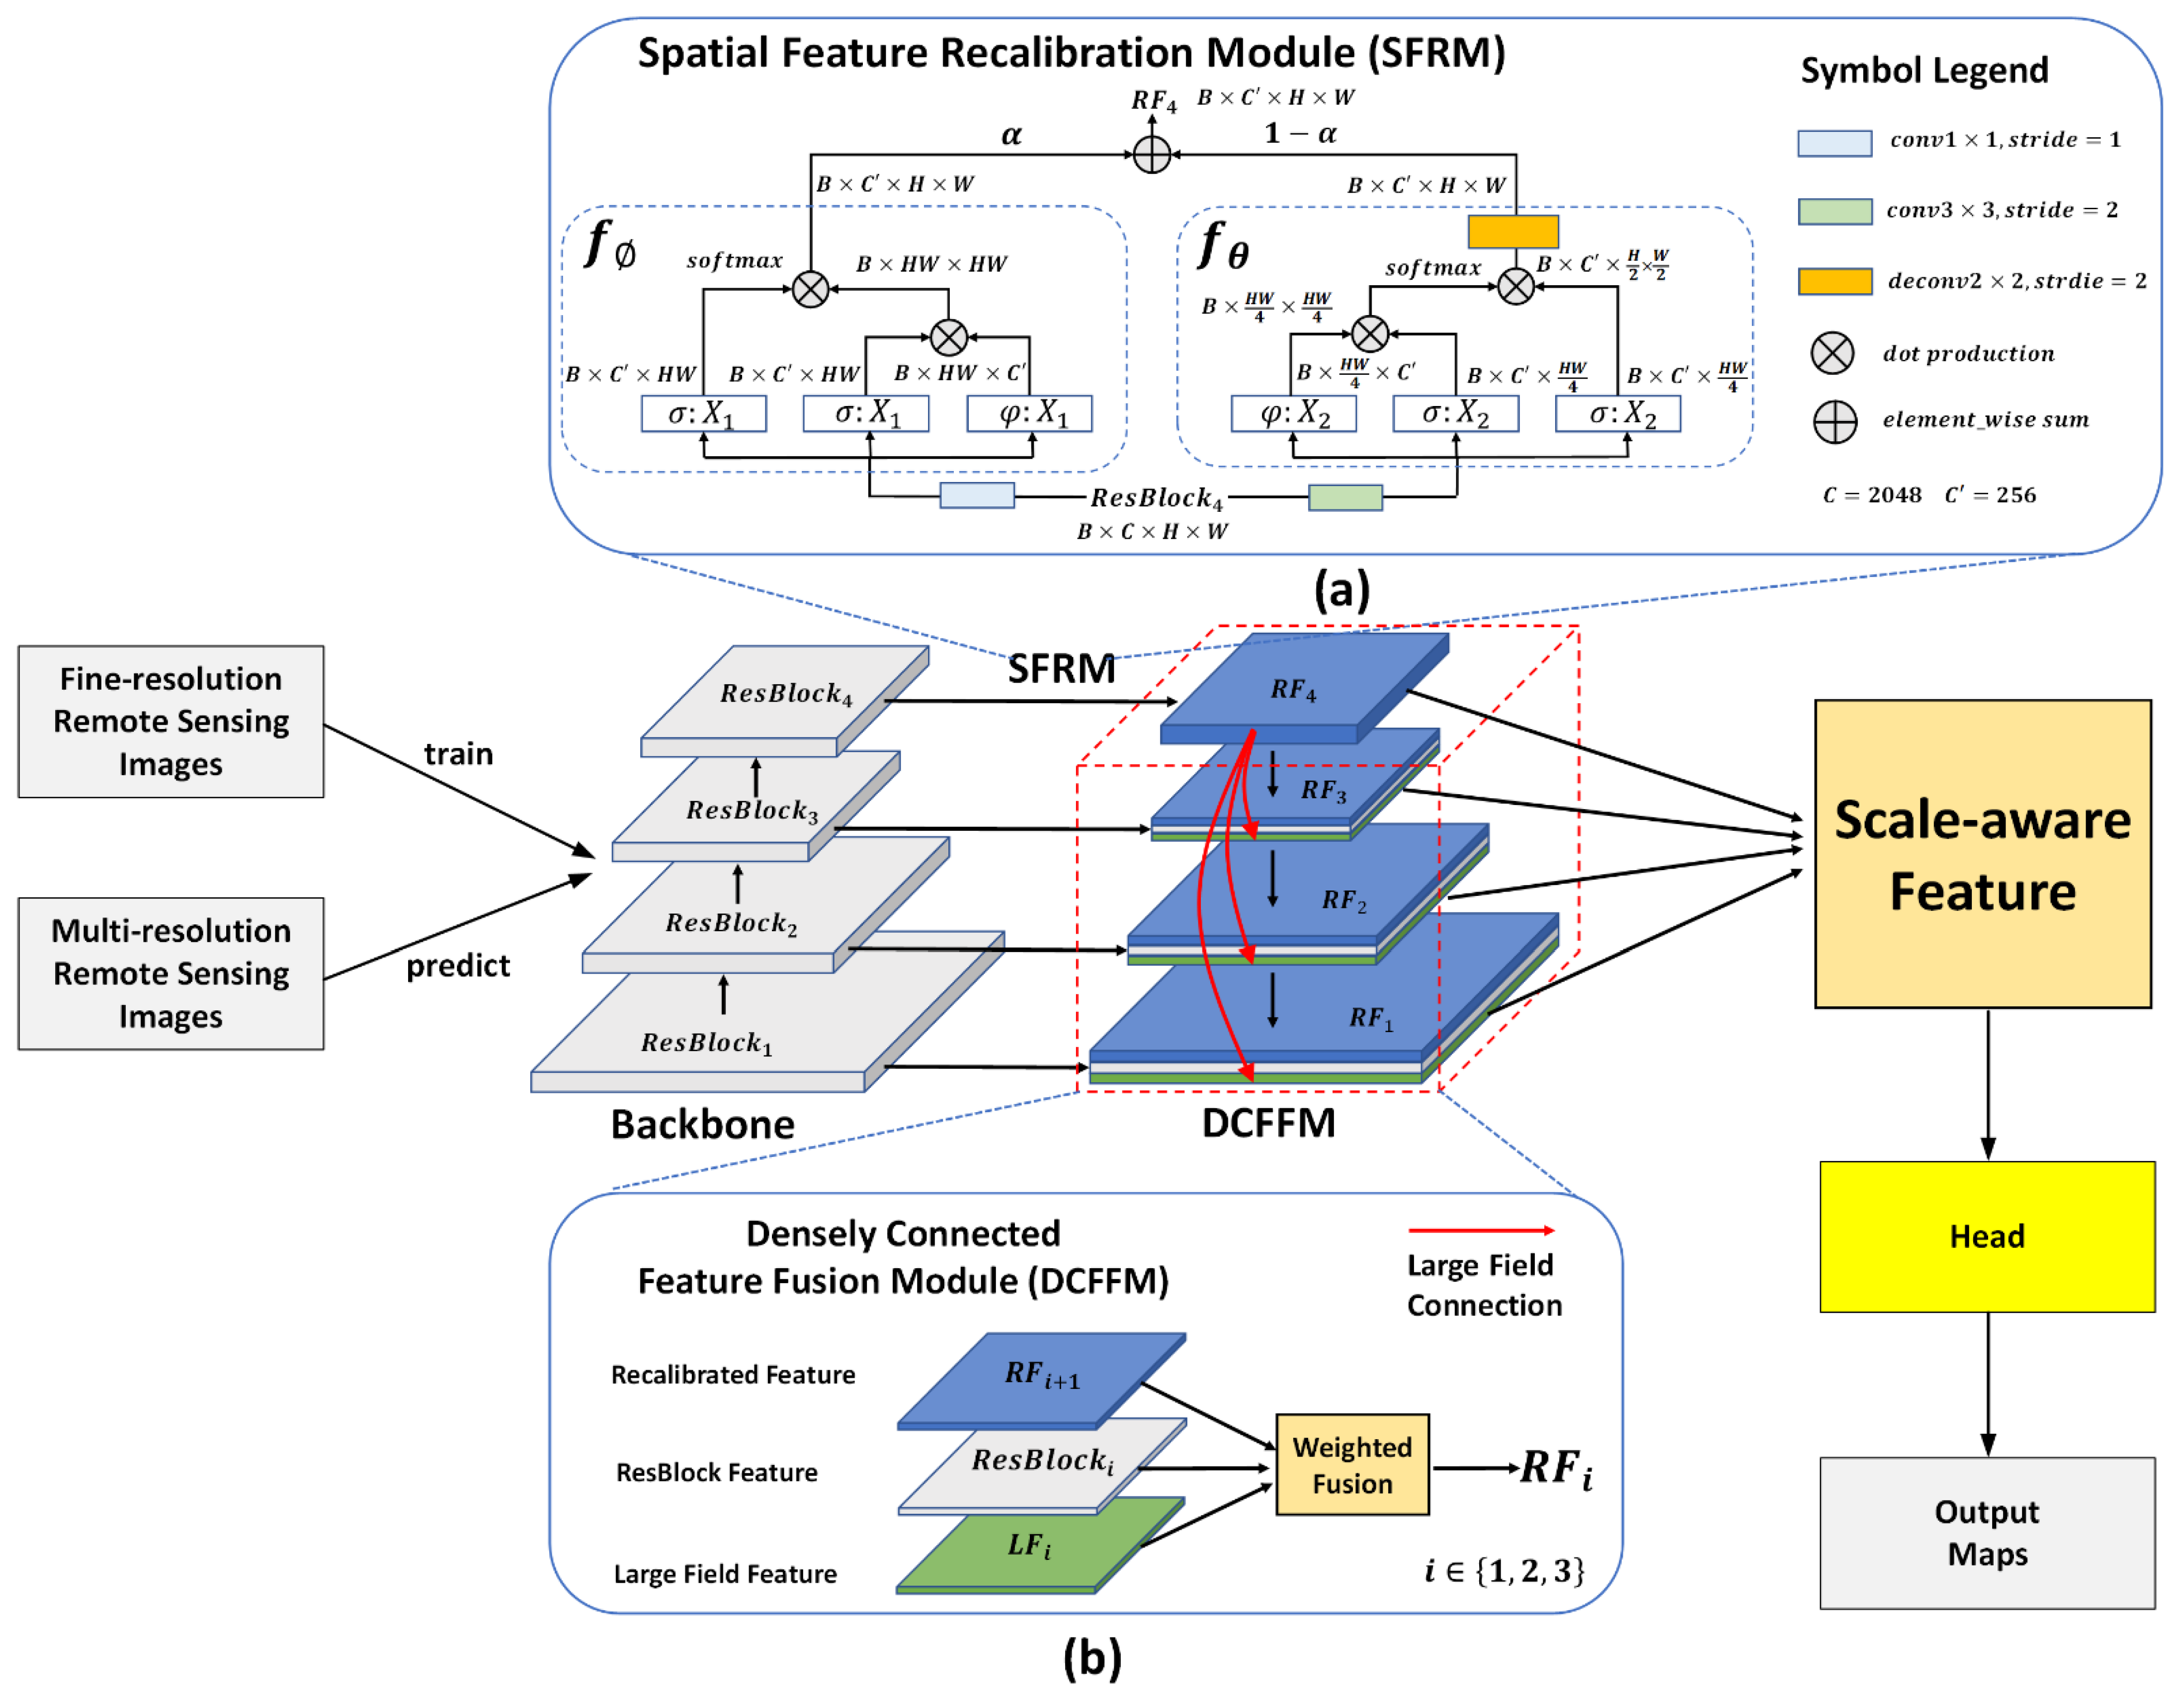
2.1. Overview
2.2. Spatial Relationship Enhancement with SFRM
- The feature map is reshaped by and into and , respectively. Similarly, the feature map is reshaped into and .
- A dot production operation is applied to and to produce the spatial relationship matrix , which is further fed into the softmax activation function to generate the probability map for feature recalibration. Meanwhile, and are processed by a similar procedure, but the shape of the corresponding probability map is .
- The probability map is multiplied by to generate the spatial recalibrated feature of . The spatial recalibrated feature of is generated in the same way. Further, the operation resizes the spatial recalibrated feature of to , while the combined operation deploys a deconvolution layer to upsample the spatial recalibrated feature of and then resize it to .
2.3. High-Quality Multi-Scale Representation with DCFFM
3. Results
3.1. Experimental Settings
3.1.1. Implementation Details
3.1.2. Models for Comparison
- (1)
- Baseline: An upsampling operation was employed on top of the backbone to construct the single-scale network Baseline. The feature maps produced by the Baseline are restored directly to the same size as the original input image.
- (2)
- Baseline + SRM and Baseline + SFRM: The spatial relationship module (SRM) [47] and our SFRM were added into the Baseline to construct two spatial relationship networks (i.e., Baseline + SRM and Baseline + SFRM).
- (3)
- Baseline + FPN and Baseline + DCFFM: The FPN module [37] and our DCFFM were embedded into the Baseline to construct two multi-scale networks (i.e., Baseline + FPN and Baseline + DCFFM).
3.1.3. Evaluation Metrics
3.2. Experiments I: Results on the LandCover.ai Dataset
3.2.1. Ablation Study on the LandCover.ai Dataset
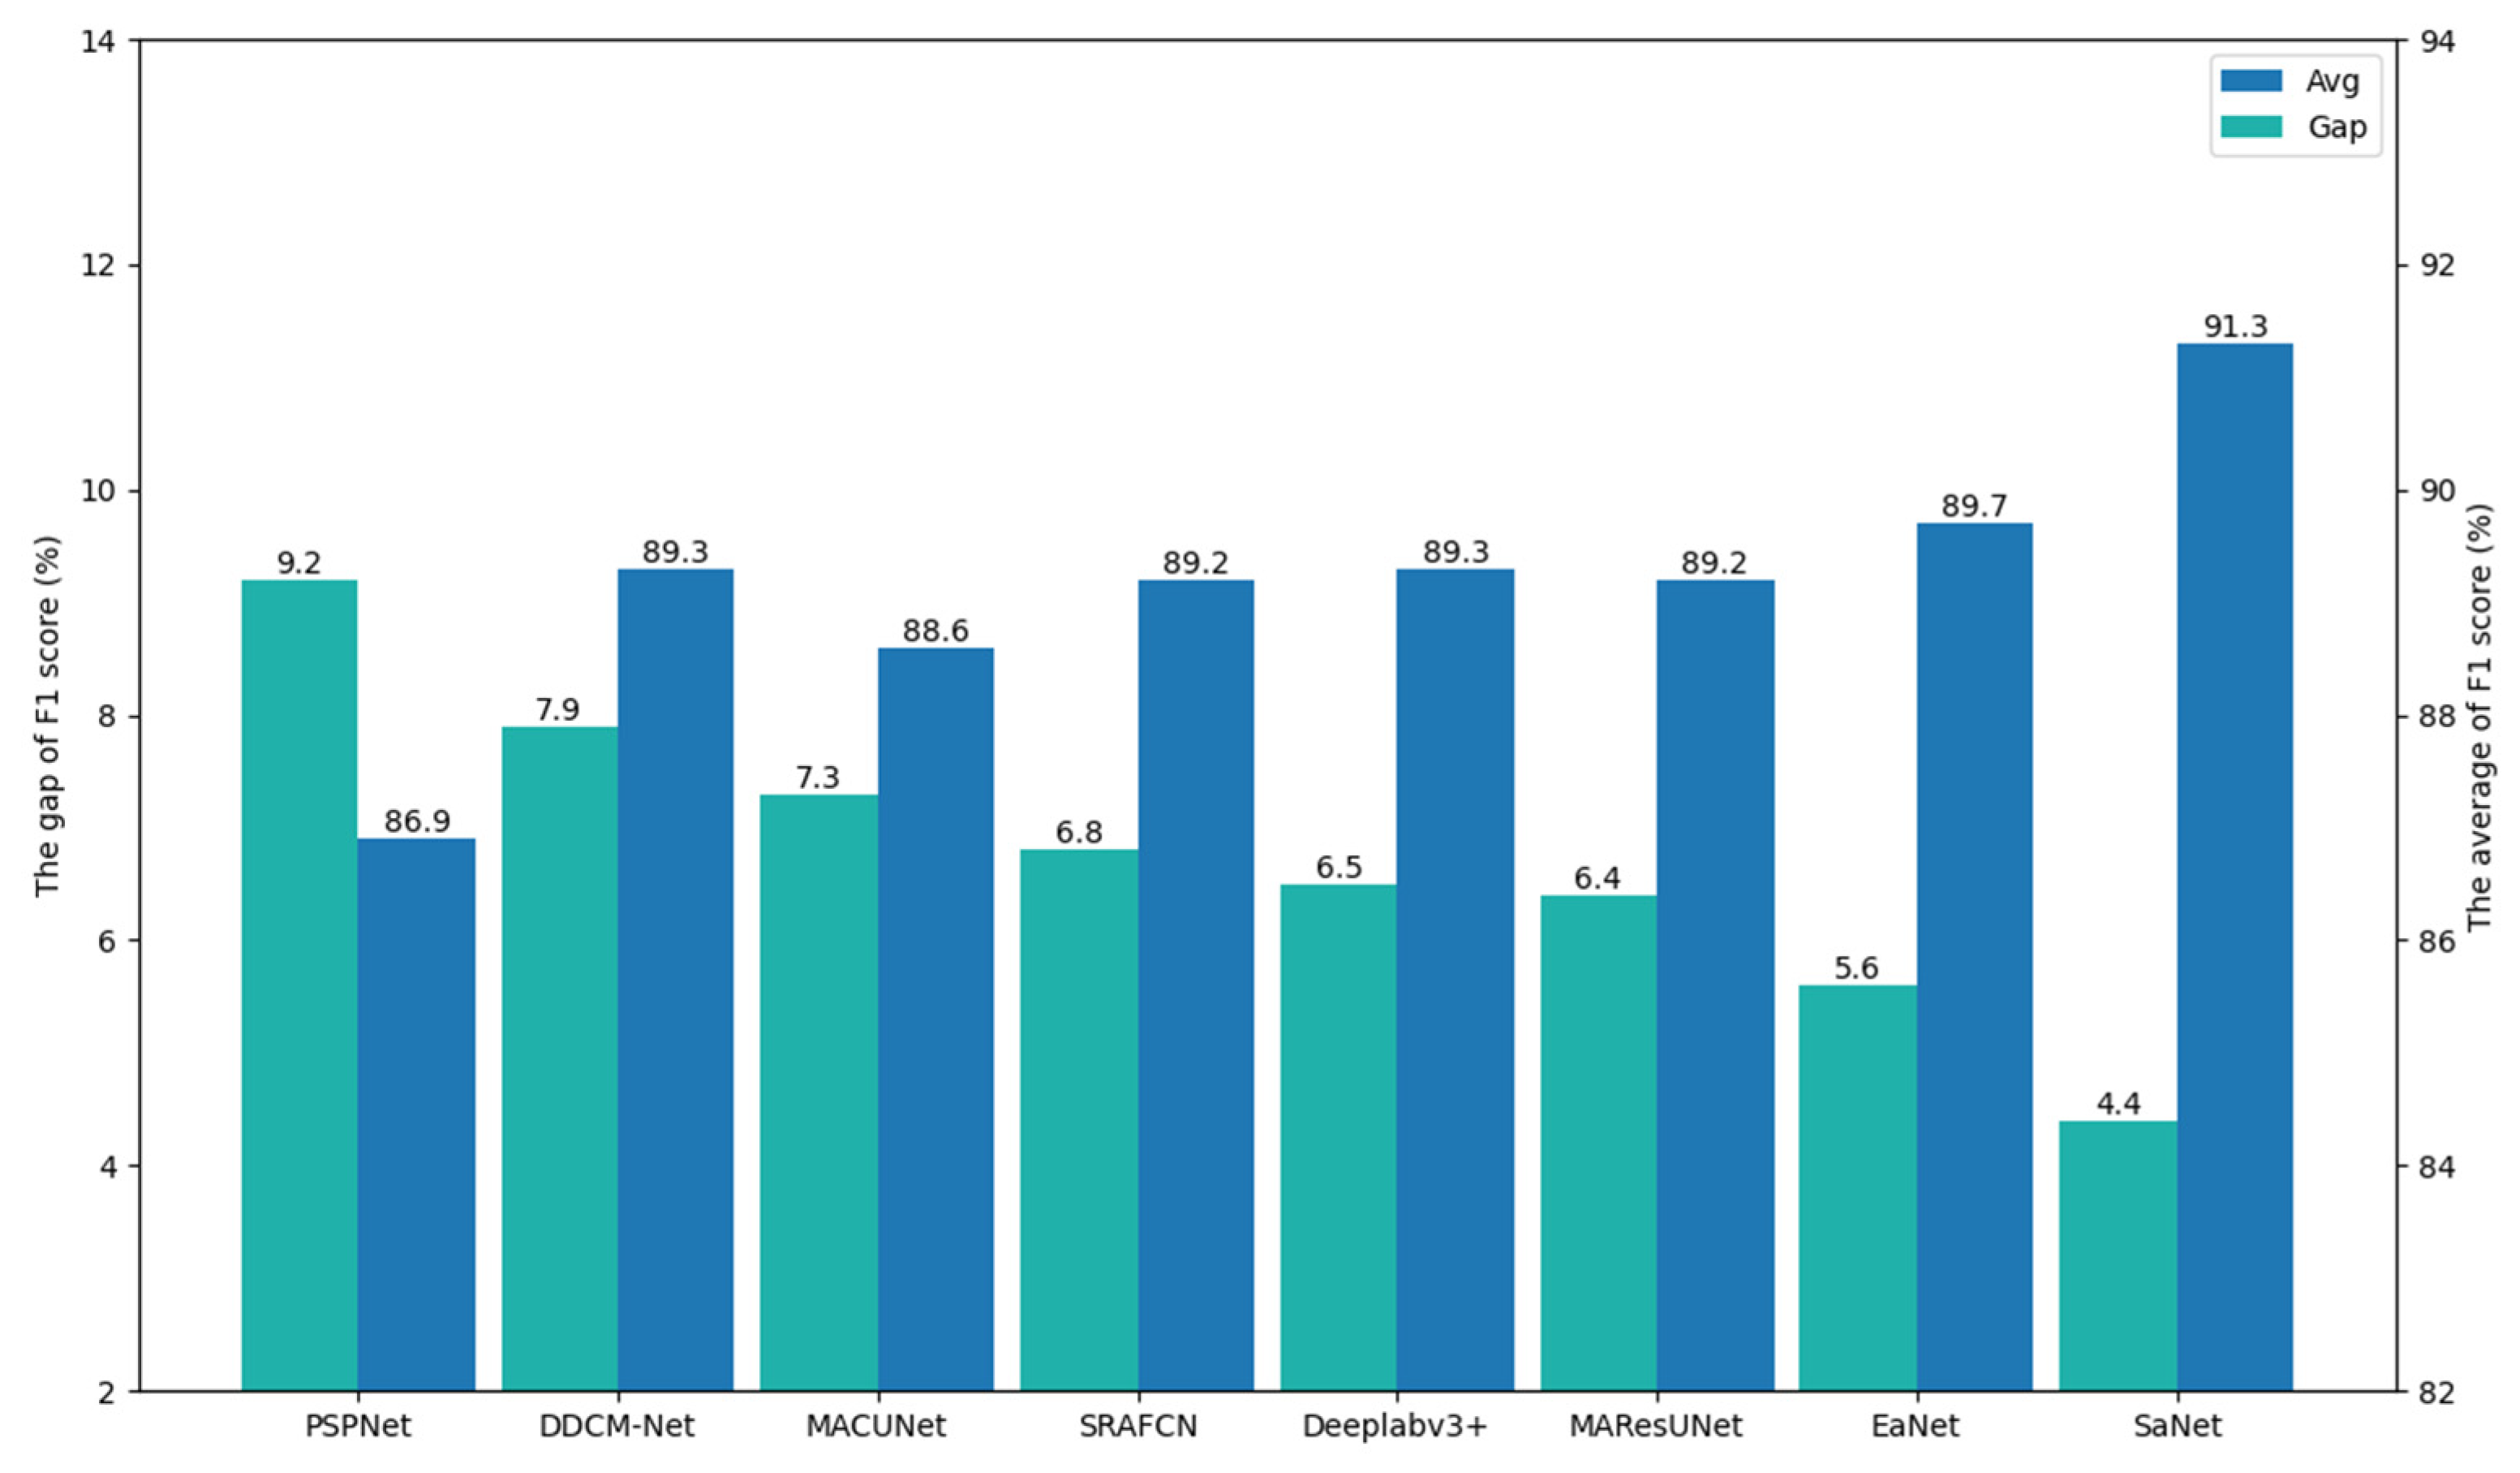
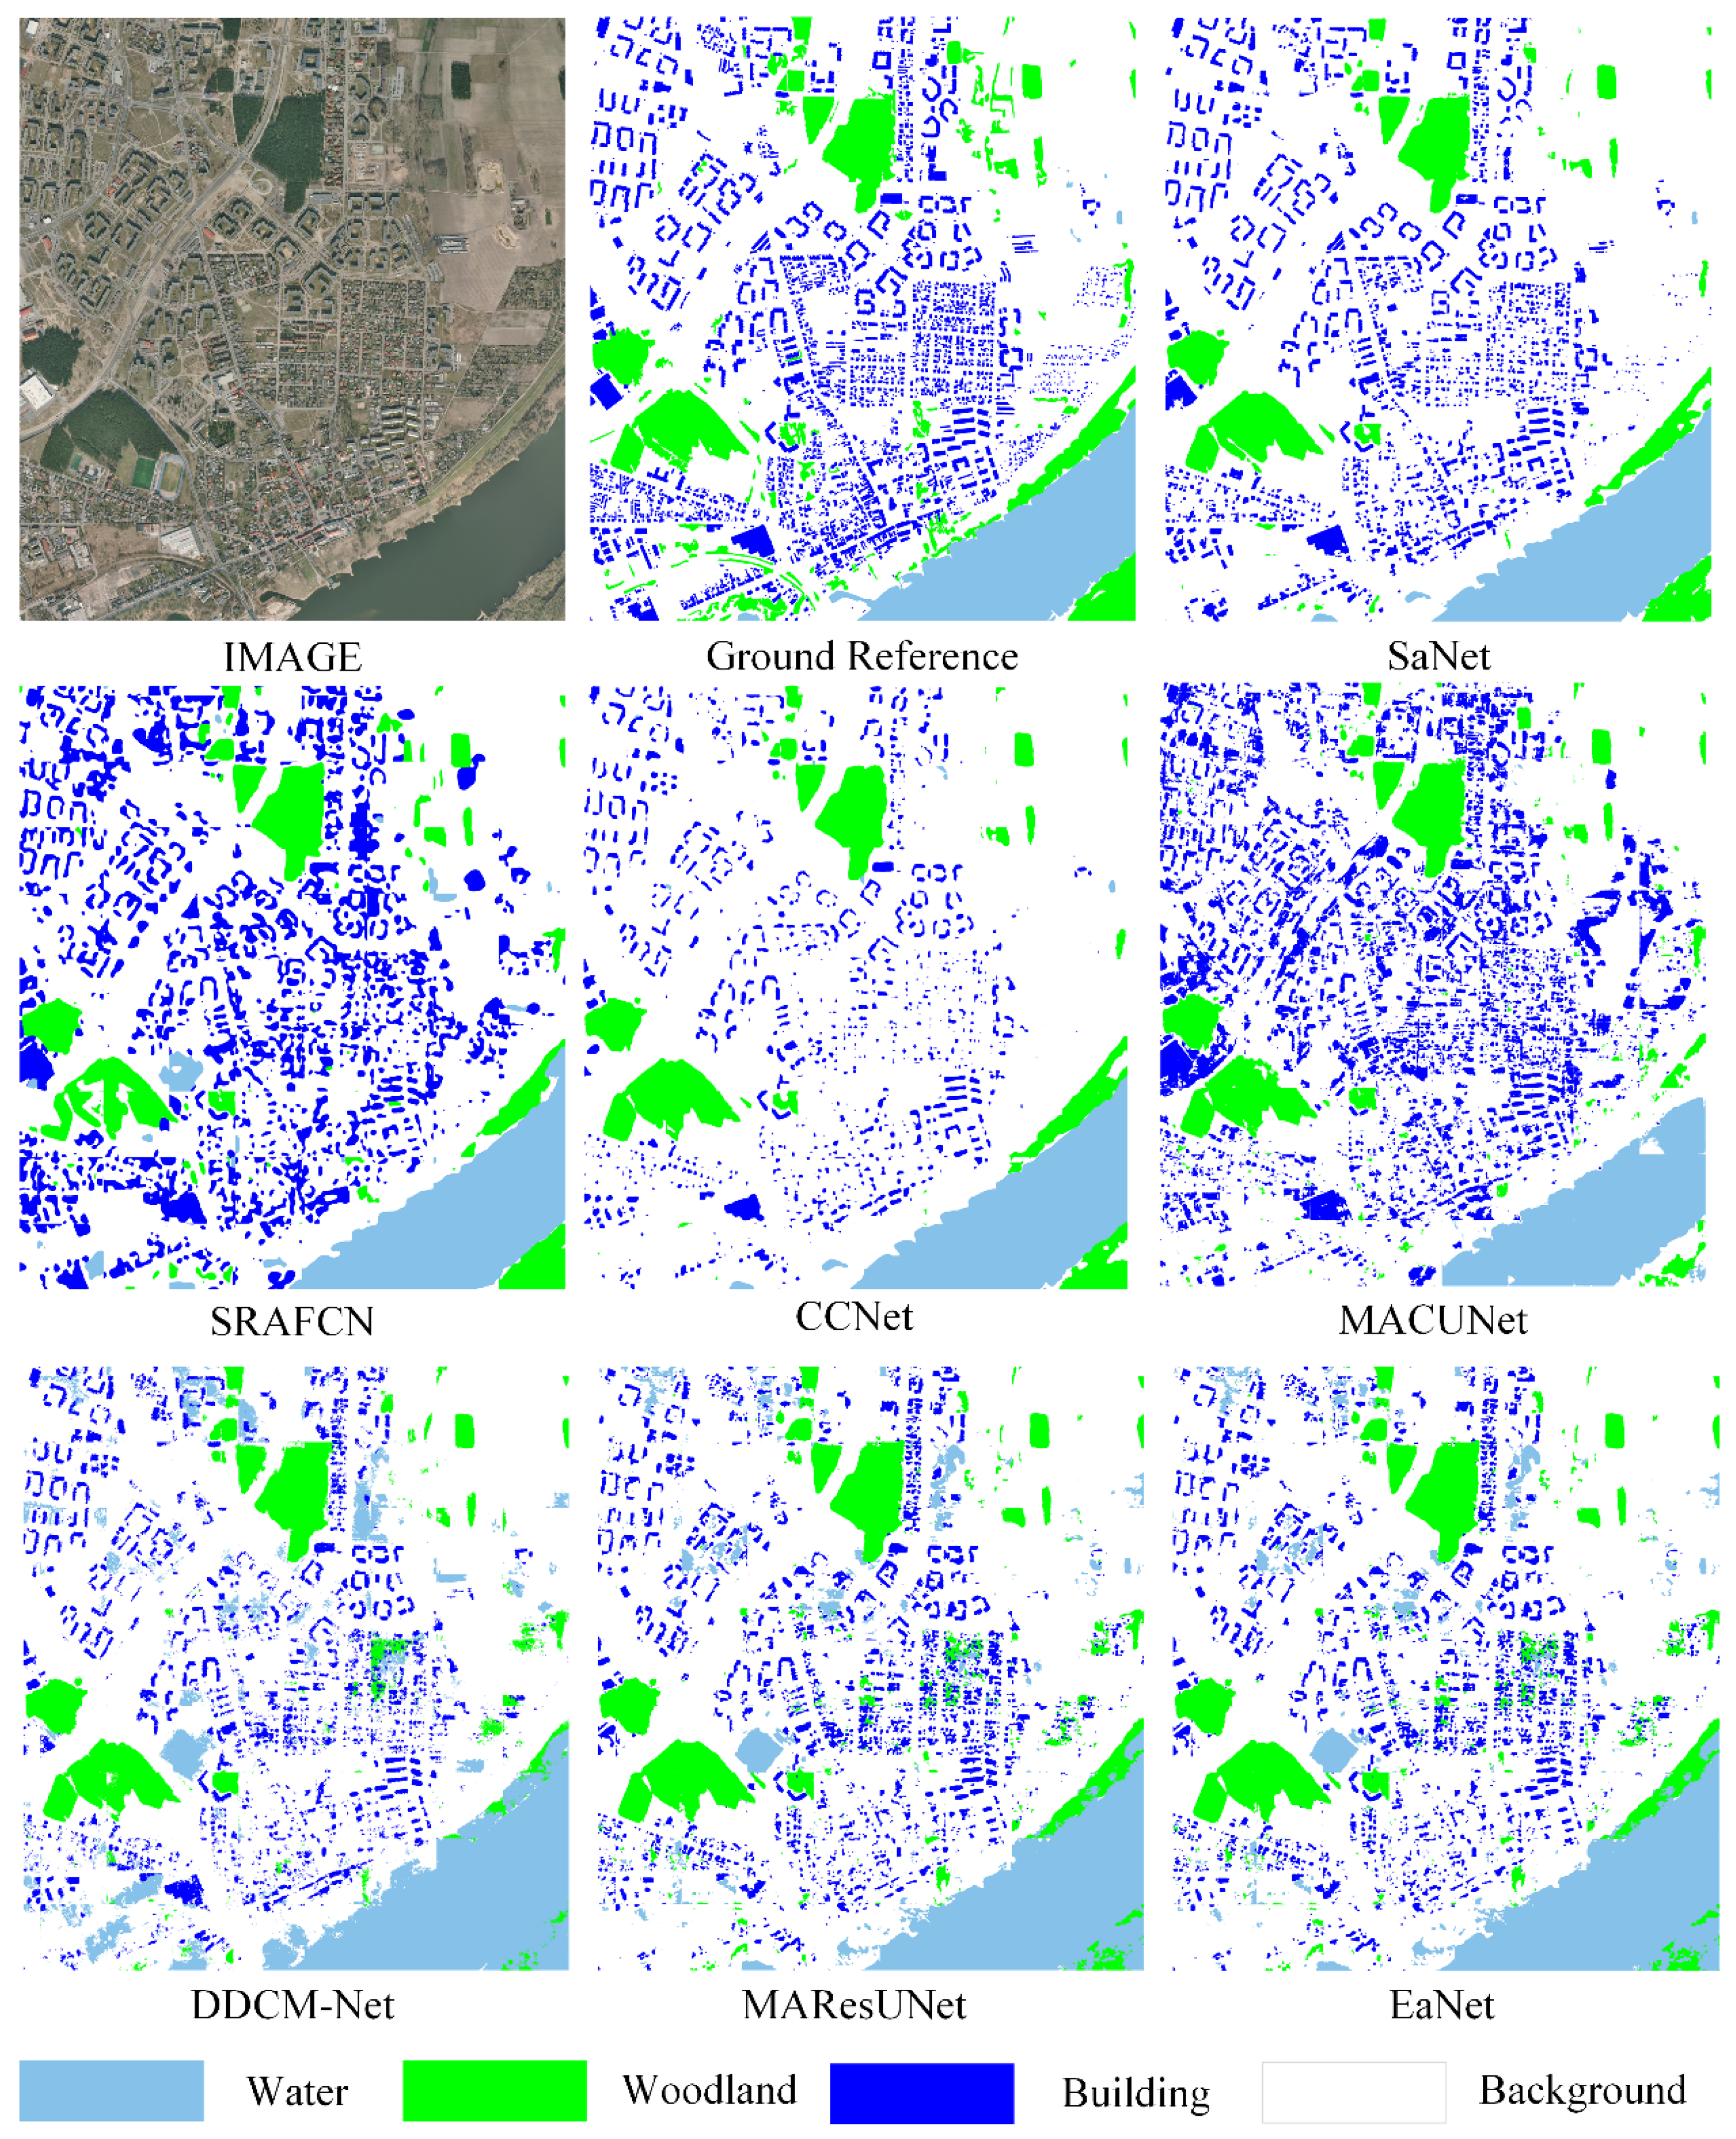
3.2.2. Comparison with State-of-the-Art Models
3.3. Experiments II: Results on the MSR Vaihingen Dataset
3.3.1. MSR Vaihingen Dataset
3.3.2. Ablation Study on the MSR Vaihingen Dataset
3.3.3. Comparison with Other Models
3.4. Experiments III: Results on the MSR Potsdam Dataset
3.4.1. MSR Potsdam Dataset
3.4.2. Comparison with Other Models
4. Discussion
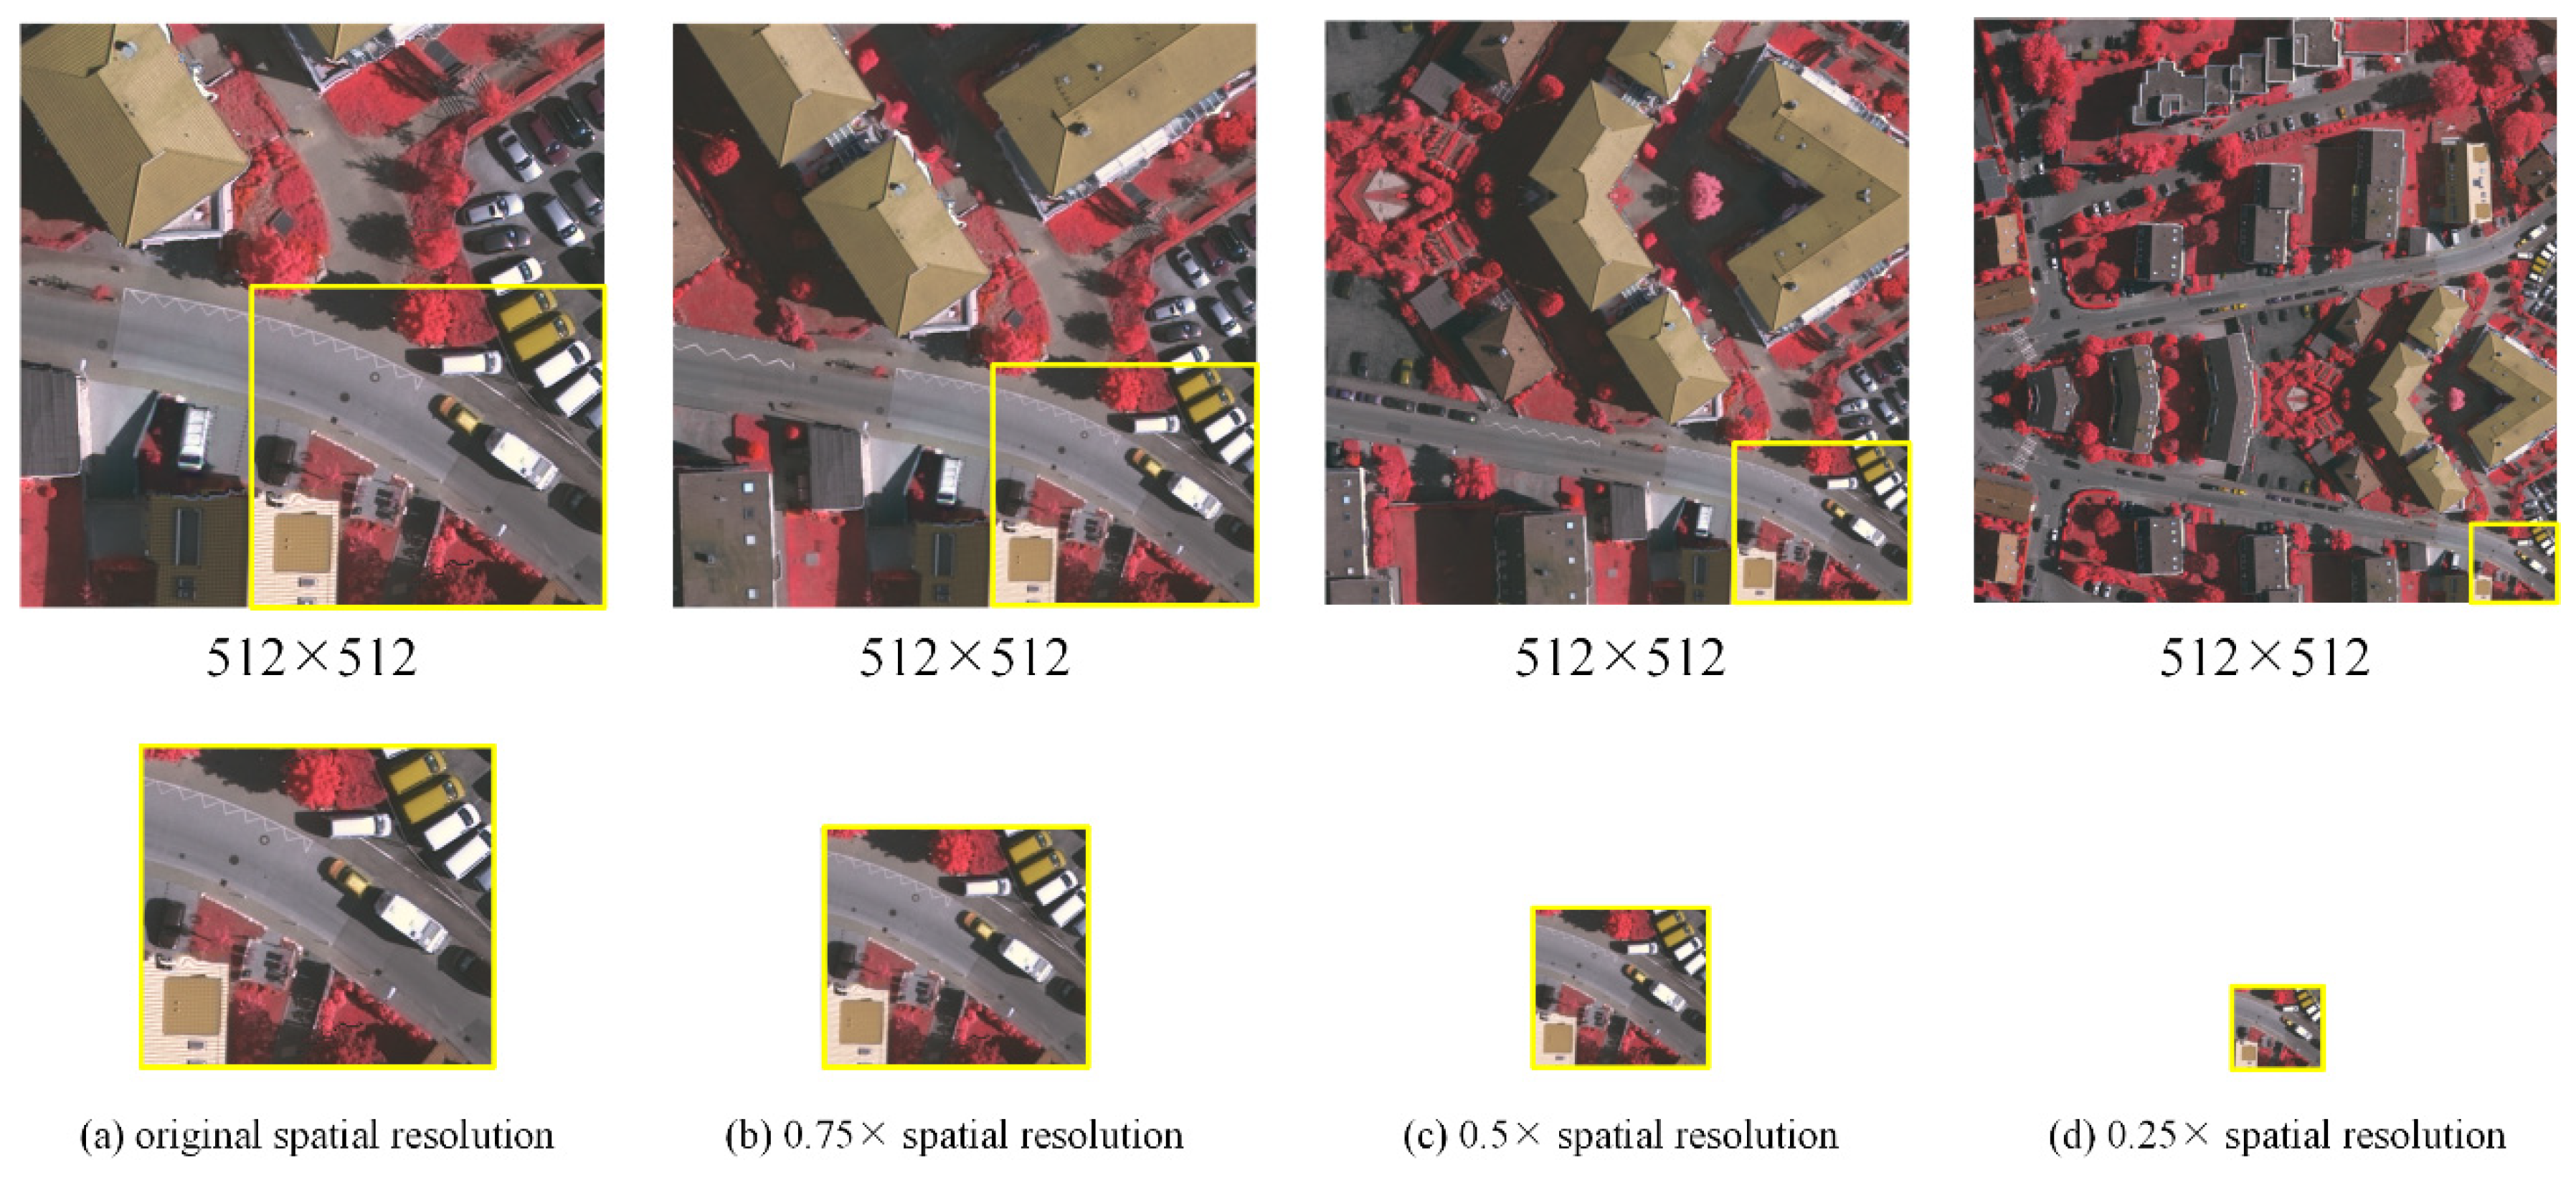
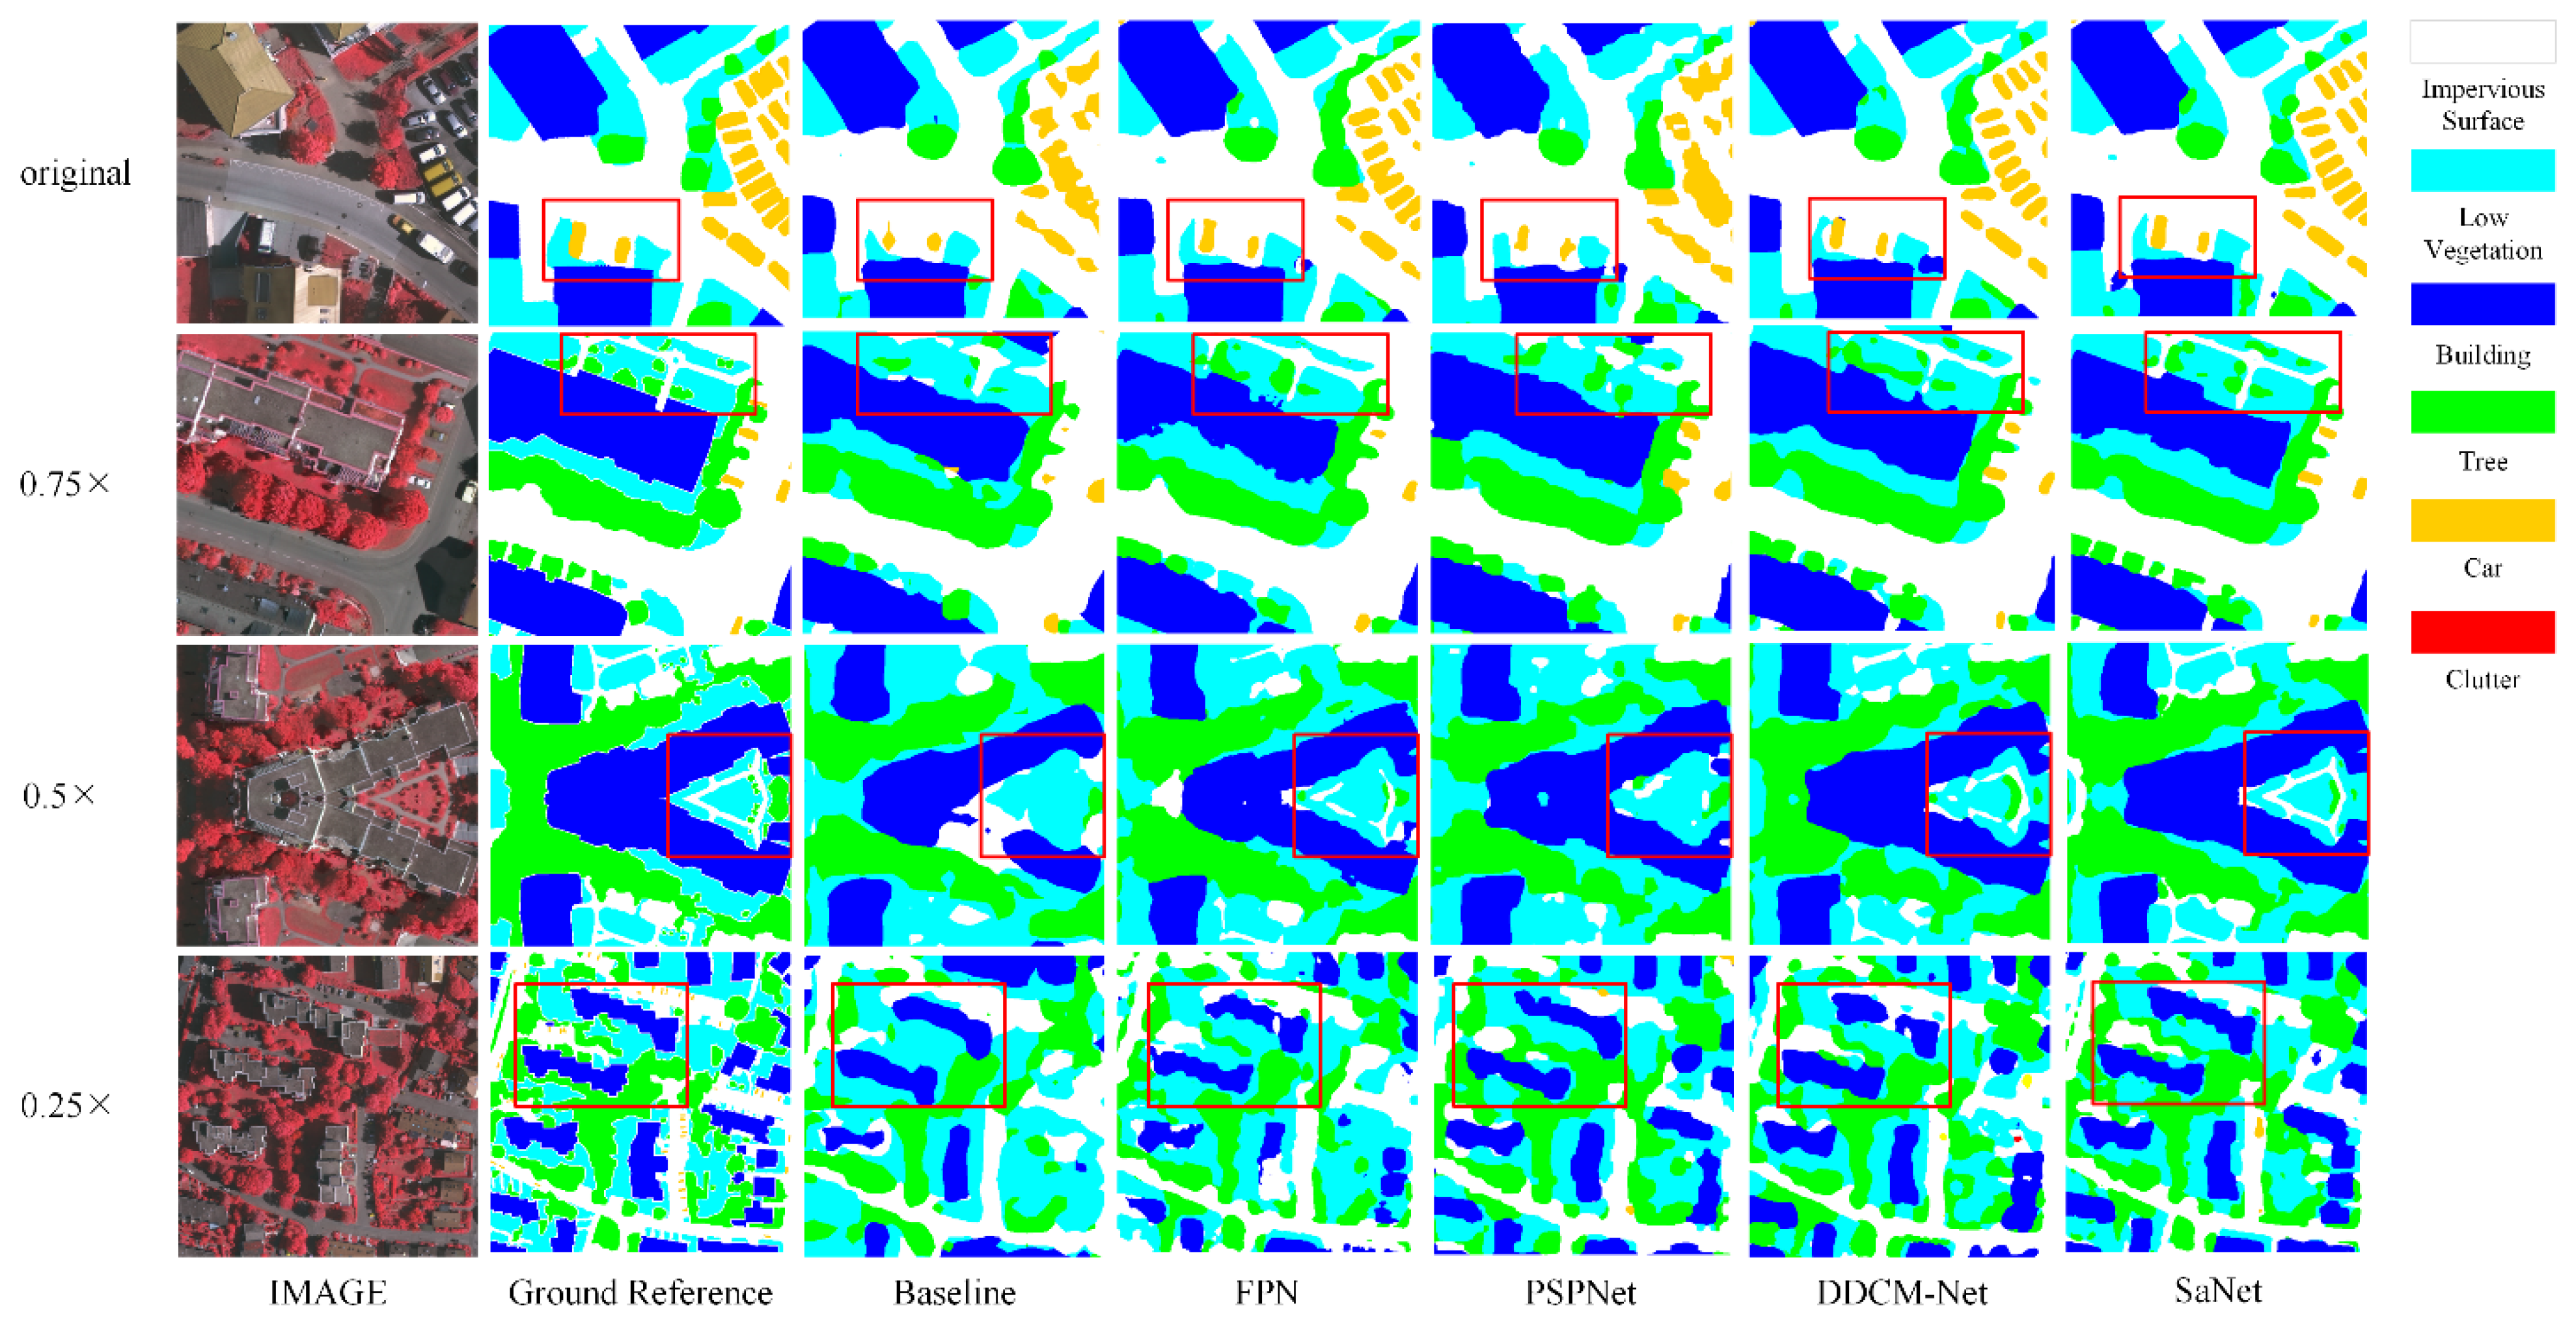
4.1. Influence of Multiple Spatial Resolutions
4.2. Discussion of Scale-Aware Feature Representation
4.3. Application Scenarios and Model Efficiency
5. Conclusions
Author Contributions
Funding
Data Availability Statement
Acknowledgments
Conflicts of Interest
Abbreviations
| FSR | Fine Spatial Resolution |
| MSR | Multiple Spatial Resolutions |
| DCNNs | Deep Convolutional Neural Networks |
| MFF | Multi-level Feature Fusion |
| SPP | Spatial Pyramid Pooling |
| FCN | Fully Convolutional Neural Network |
| SVM | Support Vector Machine |
| RF | Random Forest |
| SIFT | Scale-invariant Feature Transformer |
| CRF | Conditional Random Field |
| SFRM | Spatial Feature Recalibration Module |
| DCFFM | Densely Connected Feature Fusion Module |
| FPN | Feature Pyramid Network |
| SRM | Spatial Relationship Module |
| SaNet | Scale-aware Neural Network |
References
- Zhang, C.; Harrison, P.A.; Pan, X.; Li, H.; Sargent, I.; Atkinson, P.M. Scale Sequence Joint Deep Learning (SS-JDL) for land use and land cover classification. Remote Sens. Environ. 2020, 237, 111593. [Google Scholar] [CrossRef]
- Zhang, Q.; Seto, K.C. Mapping urbanization dynamics at regional and global scales using multi-temporal DMSP/OLS nighttime light data. Remote Sens. Environ. 2011, 115, 2320–2329. [Google Scholar] [CrossRef]
- Matikainen, L.; Karila, K. Segment-Based Land Cover Mapping of a Suburban Area—Comparison of High-Resolution Remotely Sensed Datasets Using Classification Trees and Test Field Points. Remote Sens. 2011, 3, 1777–1804. [Google Scholar] [CrossRef] [Green Version]
- Yang, K.; Xia, G.-S.; Liu, Z.; Du, B.; Yang, W.; Pelillo, M.; Zhang, L. Asymmetric Siamese Networks for Semantic Change Detection in Aerial Images. IEEE Trans. Geosci. Remote Sens. 2021, 1–18. [Google Scholar] [CrossRef]
- Wang, L.; Li, R.; Wang, D.; Duan, C.; Wang, T.; Meng, X. Transformer Meets Convolution: A Bilateral Awareness Network for Semantic Segmentation of Very Fine Resolution Urban Scene Images. Remote Sens. 2021, 13, 3065. [Google Scholar] [CrossRef]
- Li, R.; Zheng, S.; Zhang, C.; Duan, C.; Wang, L.; Atkinson, P.M. ABCNet: Attentive bilateral contextual network for efficient semantic segmentation of Fine-Resolution remotely sensed imagery. ISPRS J. Photogramm. Remote Sens. 2021, 181, 84–98. [Google Scholar] [CrossRef]
- Li, R.; Zheng, S.; Zhang, C.; Duan, C.; Su, J.; Wang, L.; Atkinson, P.M. Multiattention network for semantic segmentation of fine-resolution remote sensing images. IEEE Trans. Geosci. Remote Sens. 2021, 1–13. [Google Scholar] [CrossRef]
- Zheng, Z.; Zhong, Y.; Ma, A.; Han, X.; Zhao, J.; Liu, Y.; Zhang, L. HyNet: Hyper-scale object detection network framework for multiple spatial resolution remote sensing imagery. ISPRS J. Photogramm. Remote Sens. 2020, 166, 1–14. [Google Scholar] [CrossRef]
- Atkinson, P.M.; Tate, N.J. Spatial Scale Problems and Geostatistical Solutions: A Review. Prof. Geogr. 2000, 52, 607–623. [Google Scholar] [CrossRef]
- Ge, Y.; Jin, Y.; Stein, A.; Chen, Y.; Wang, J.; Wang, J.; Cheng, Q.; Bai, H.; Liu, M.; Atkinson, P.M. Principles and methods of scaling geospatial Earth science data. Earth-Sci. Rev. 2019, 197, 102897. [Google Scholar] [CrossRef]
- Yan, L.C.; Yoshua, B.; Geoffrey, H. Deep learning. Nature 2015, 521, 436–444. [Google Scholar]
- Baatz, M.; Schäpe, A. Multiresolution Segmentation—An Optimization Approach for High Quality Multi-Scale Image Segmentation. In Angewandte Geographische Informationsverarbeitung XII. Beiträge zum AGIT-Symposium Salzburg; Wichmann Verlag: Karlsruhe, Germany, 2000. [Google Scholar]
- Shen, Y.; Chen, J.; Xiao, L.; Pan, D. Optimizing multiscale segmentation with local spectral heterogeneity measure for high resolution remote sensing images. ISPRS J. Photogramm. Remote Sens. 2019, 157, 13–25. [Google Scholar] [CrossRef]
- Su, T. Scale-variable region-merging for high resolution remote sensing image segmentation. ISPRS J. Photogramm. Remote Sens. 2019, 147, 319–334. [Google Scholar] [CrossRef]
- Belgiu, M.; Drǎguţ, L. Comparing supervised and unsupervised multiresolution segmentation approaches for extracting buildings from very high resolution imagery. ISPRS J. Photogramm. Remote Sens. 2014, 96, 67–75. [Google Scholar] [CrossRef] [Green Version]
- Witharana, C.; Civco, D.L. Optimizing multi-resolution segmentation scale using empirical methods: Exploring the sensitivity of the supervised discrepancy measure Euclidean distance 2 (ED2). ISPRS J. Photogramm. Remote Sens. 2014, 87, 108–121. [Google Scholar] [CrossRef]
- Lowe, D.G. Distinctive Image Features from Scale-Invariant Keypoints. Int. J. Comput. Vis. 2004, 60, 91–110. [Google Scholar] [CrossRef]
- Xing, J.; Sieber, R.; Caelli, T. A scale-invariant change detection method for land use/cover change research. ISPRS J. Photogramm. Remote Sens. 2018, 141, 252–264. [Google Scholar] [CrossRef]
- Guo, Y.; Jia, X.; Paull, D. Effective Sequential Classifier Training for SVM-Based Multitemporal Remote Sensing Image Classification. IEEE Trans. Image Process. 2018, 27, 3036–3048. [Google Scholar] [CrossRef] [Green Version]
- Zhu, X.X.; Tuia, D.; Mou, L.; Xia, G.-S.; Zhang, L.; Xu, F.; Fraundorfer, F. Deep learning in remote sensing: A comprehensive review and list of resources. IEEE Geosci. Remote Sens. Mag. 2017, 5, 8–36. [Google Scholar] [CrossRef] [Green Version]
- Pal, M. Random forest classifier for remote sensing classification. Int. J. Remote Sens. 2005, 26, 217–222. [Google Scholar] [CrossRef]
- Zhong, P.; Wang, R. A Multiple Conditional Random Fields Ensemble Model for Urban Area Detection in Remote Sensing Optical Images. IEEE Trans. Geosci. Remote Sens. 2007, 45, 3978–3988. [Google Scholar] [CrossRef]
- Wang, L.; Li, R.; Duan, C.; Zhang, C.; Meng, X.; Fang, S. A Novel Transformer based Semantic Segmentation Scheme for Fine-Resolution Remote Sensing Images. arXiv 2021, arXiv:2104.12137. [Google Scholar]
- Wang, L.; Fang, S.; Zhang, C.; Li, R.; Duan, C. Efficient Hybrid Transformer: Learning Global-local Context for Urban Scene Segmentation. arXiv 2021, arXiv:2109.08937. [Google Scholar]
- Long, J.; Shelhamer, E.; Darrell, T. Fully convolutional networks for semantic segmentation. In Proceedings of the IEEE Conference on Computer Vision and Pattern Recognition, Boston, MA, USA, 7–12 June 2015; pp. 3431–3440. [Google Scholar]
- Sherrah, J. Fully convolutional networks for dense semantic labelling of high-resolution aerial imagery. arXiv 2016, arXiv:1606.02585. [Google Scholar]
- Zhang, C.; Sargent, I.; Pan, X.; Li, H.; Gardiner, A.; Hare, J.; Atkinson, P.M. Joint Deep Learning for land cover and land use classification. Remote Sens. Environ. 2019, 221, 173–187. [Google Scholar] [CrossRef] [Green Version]
- Zhao, W.; Du, S. Learning multiscale and deep representations for classifying remotely sensed imagery. ISPRS J. Photogramm. Remote Sens. 2016, 113, 155–165. [Google Scholar] [CrossRef]
- Chen, L.-C.; Yang, Y.; Wang, J.; Xu, W.; Yuille, A.L. Attention to scale: Scale-aware semantic image segmentation. In Proceedings of the IEEE/CVF Conference on Computer Vision and Pattern Recognition, Las Vegas, NV, USA, 27–30 June 2016; pp. 3640–3649. [Google Scholar]
- Yu, F.; Koltun, V. Multi-scale context aggregation by dilated convolutions. arXiv 2015, arXiv:1511.07122. [Google Scholar]
- Liu, Y.; Fan, B.; Wang, L.; Bai, J.; Xiang, S.; Pan, C. Semantic labeling in very high resolution images via a self-cascaded convolutional neural network. ISPRS J. Photogramm. Remote Sens. 2018, 145, 78–95. [Google Scholar] [CrossRef] [Green Version]
- Audebert, N.; Le Saux, B.; Lefèvre, S. Beyond RGB: Very high resolution urban remote sensing with multimodal deep networks. ISPRS J. Photogramm. Remote Sens. 2018, 140, 20–32. [Google Scholar] [CrossRef] [Green Version]
- Sun, Y.; Tian, Y.; Xu, Y. Problems of encoder-decoder frameworks for high-resolution remote sensing image segmentation: Structural stereotype and insufficient learning. Neurocomputing 2019, 330, 297–304. [Google Scholar] [CrossRef]
- Ronneberger, O.; Fischer, P.; Brox, T. U-net: Convolutional networks for biomedical image segmentation. In Proceedings of the International Conference on Medical Image Computing and Computer-Assisted Intervention, Munich, Germany, 5–9 October 2015; pp. 234–241. [Google Scholar]
- Yue, K.; Yang, L.; Li, R.; Hu, W.; Zhang, F.; Li, W. TreeUNet: Adaptive Tree convolutional neural networks for subdecimeter aerial image segmentation. ISPRS J. Photogramm. Remote Sens. 2019, 156, 1–13. [Google Scholar] [CrossRef]
- Diakogiannis, F.I.; Waldner, F.; Caccetta, P.; Wu, C. Resunet-a: A deep learning framework for semantic segmentation of remotely sensed data. ISPRS J. Photogramm. Remote Sens. 2020, 162, 94–114. [Google Scholar] [CrossRef] [Green Version]
- Lin, T.-Y.; Dollár, P.; Girshick, R.; He, K.; Hariharan, B.; Belongie, S. Feature pyramid networks for object detection. In Proceedings of the IEEE/CVF Conference on Computer Vision and Pattern Recognition, Honolulu, HI, USA, 21–26 July 2017; pp. 2117–2125. [Google Scholar]
- Seferbekov, S.; Iglovikov, V.; Buslaev, A.; Shvets, A. Feature pyramid network for multi-class land segmentation. In Proceedings of the IEEE Conference on Computer Vision and Pattern Recognition Workshops, Salt Lake City, UT, USA, 18–22 June 2018; pp. 272–275. [Google Scholar]
- Zhao, H.; Shi, J.; Qi, X.; Wang, X.; Jia, J. Pyramid scene parsing network. In Proceedings of the IEEE conference on Computer Vision and Pattern Recognition, Honolulu, HI, USA, 21–26 July 2017; pp. 2881–2890. [Google Scholar]
- Chen, L.-C.; Papandreou, G.; Schroff, F.; Adam, H. Rethinking atrous convolution for semantic image segmentation. arXiv 2017, arXiv:1706.05587. [Google Scholar]
- Chen, L.-C.; Zhu, Y.; Papandreou, G.; Schroff, F.; Adam, H. Encoder-decoder with atrous separable convolution for semantic image segmentation. In Proceedings of the European Conference on Computer Vision (ECCV), Munich, Germany, 8–14 September 2018; pp. 801–818. [Google Scholar]
- Chen, L.; Papandreou, G.; Kokkinos, I.; Murphy, K.; Yuille, A.L. DeepLab: Semantic Image Segmentation with Deep Convolutional Nets, Atrous Convolution, and Fully Connected CRFs. IEEE Trans. Pattern Anal. Mach. Intell. 2018, 40, 834–848. [Google Scholar] [CrossRef]
- Liu, Q.; Kampffmeyer, M.; Jenssen, R.; Salberg, A.-B. Dense dilated convolutions’ merging network for land cover classification. IEEE Trans. Geosci. Remote Sens. 2020, 58, 6309–6320. [Google Scholar] [CrossRef] [Green Version]
- Zheng, X.; Huan, L.; Xia, G.-S.; Gong, J. Parsing very high resolution urban scene images by learning deep ConvNets with edge-aware loss. ISPRS J. Photogramm. Remote Sens. 2020, 170, 15–28. [Google Scholar] [CrossRef]
- He, K.; Zhang, X.; Ren, S.; Sun, J. Deep residual learning for image recognition. In Proceedings of the IEEE Conference on Computer Vision and Pattern Recognition, Las Vegas, NV, USA, 27–30 June 2016; pp. 770–778. [Google Scholar]
- Huang, Z.; Wang, X.; Wei, Y.; Huang, L.; Shi, H.; Liu, W.; Huang, T.S. CCNet: Criss-Cross Attention for Semantic Segmentation. IEEE Trans. Pattern Anal. Mach. Intell. 2020. [Google Scholar] [CrossRef]
- Mou, L.; Hua, Y.; Zhu, X.X. Relation Matters: Relational Context-Aware Fully Convolutional Network for Semantic Segmentation of High-Resolution Aerial Images. IEEE Trans. Geosci. Remote Sens. 2020, 58, 7557–7569. [Google Scholar] [CrossRef]
- Li, R.; Duan, C.; Zheng, S.; Zhang, C.; Atkinson, P.M. MACU-Net for semantic segmentation of fine-resolution remotely sensed images. IEEE Geosci. Remote Sens. Lett. 2021, 1–5. [Google Scholar] [CrossRef]
- Li, R.; Zheng, S.; Duan, C.; Su, J.; Zhang, C. Multistage Attention ResU-Net for Semantic Segmentation of Fine-Resolution Remote Sensing Images. IEEE Geosci. Remote Sens. Lett. 2021, 1–5. [Google Scholar] [CrossRef]
- Boguszewski, A.; Batorski, D.; Ziemba-Jankowska, N.; Zambrzycka, A.; Dziedzic, T. LandCover. ai: Dataset for Automatic Mapping of Buildings, Woodlands and Water from Aerial Imagery. arXiv 2020, arXiv:2005.02264. [Google Scholar]


| Method | mIoU | Avg | Gap | |
|---|---|---|---|---|
| Val Set (0.25 m) | Test Set (0.5 m) | |||
| Baseline | 79.7 | 62.3 | 71.0 | 17.4 |
| Baseline + SRM | 85.3 | 73.9 | 79.6 | 11.4 |
| Baseline + SFRM | 85.8 | 77.0 | 81.4 | 8.8 |
| Baseline + FPN (FPN) | 84.7 | 72.3 | 78.5 | 12.4 |
| Baseline + DCFFM | 86.2 | 78.0 | 82.1 | 8.2 |
| Baseline + SFRM + DCFFM (SaNet) | 88.2 | 81.2 | 84.7 | 7.0 |
| Method | Backbone | F1-Score | Mean F1-Score | |||
|---|---|---|---|---|---|---|
| Water | Building | Woodland | Background | |||
| PSPNet | ResNet101 | 95.9 | 78.9 | 94.7 | 96.6 | 91.5 |
| Deeplabv3+ | ResNet101 | 96.3 | 82.8 | 94.4 | 96.5 | 92.5 |
| CCNet | ResNet101 | 95.9 | 80.8 | 94.7 | 96.5 | 92.0 |
| SRAFCN | VGG16 | 96.4 | 83.1 | 94.4 | 96.6 | 92.6 |
| DDCM-Net | ResNet101 | 96.9 | 84.4 | 94.6 | 96.6 | 93.2 |
| EaNet | ResNet101 | 96.1 | 82.5 | 94.7 | 96.6 | 92.5 |
| MACUNet | UNet | 95.7 | 82.2 | 94.3 | 96.5 | 92.2 |
| MAResUNet | UNet | 96.0 | 82.7 | 94.4 | 96.6 | 92.4 |
| SaNet | ResNet101 | 96.3 | 86.3 | 94.8 | 96.7 | 93.5 |
| Method | Backbone | F1-Score | Mean F1-Score | |||
|---|---|---|---|---|---|---|
| Water | Building | Woodland | Background | |||
| PSPNet | ResNet101 | 97.2 | 52.3 | 90.8 | 88.7 | 82.3 |
| Deeplabv3+ | ResNet101 | 96.8 | 67.8 | 90.9 | 88.6 | 86.0 |
| CCNet | ResNet101 | 97.2 | 58.2 | 91.4 | 89.1 | 84.0 |
| SRAFCN | VGG16 | 96.4 | 67.2 | 91.1 | 88.6 | 85.8 |
| DDCM-Net | ResNet101 | 97.1 | 64.1 | 91.0 | 88.9 | 85.3 |
| EaNet | ResNet101 | 96.9 | 68.9 | 92.1 | 89.8 | 86.9 |
| MACUNet | UNet | 96.5 | 67.1 | 89.2 | 86.9 | 84.9 |
| MAResUNet | UNet | 97.4 | 70.1 | 89.1 | 87.3 | 86.0 |
| SaNet | ResNet101 | 96.6 | 75.6 | 93.3 | 90.8 | 89.1 |
| Dataset | Spatial Resolution (cm) | Patch Size (pixels) | Patch Numbers |
|---|---|---|---|
| Train set | 9 | 512 × 512 | 1092 |
| Original test set | 9 | 512 × 512 | 398 |
| 0.75× test set | 12 | 512 × 512 | 230 |
| 0.5× test set | 18 | 512 × 512 | 113 |
| 0.25× test set | 36 | 512 × 512 | 38 |
| Method | OA | Mean OA | |||
|---|---|---|---|---|---|
| Original | 0.75× | 0.5× | 0.25× | ||
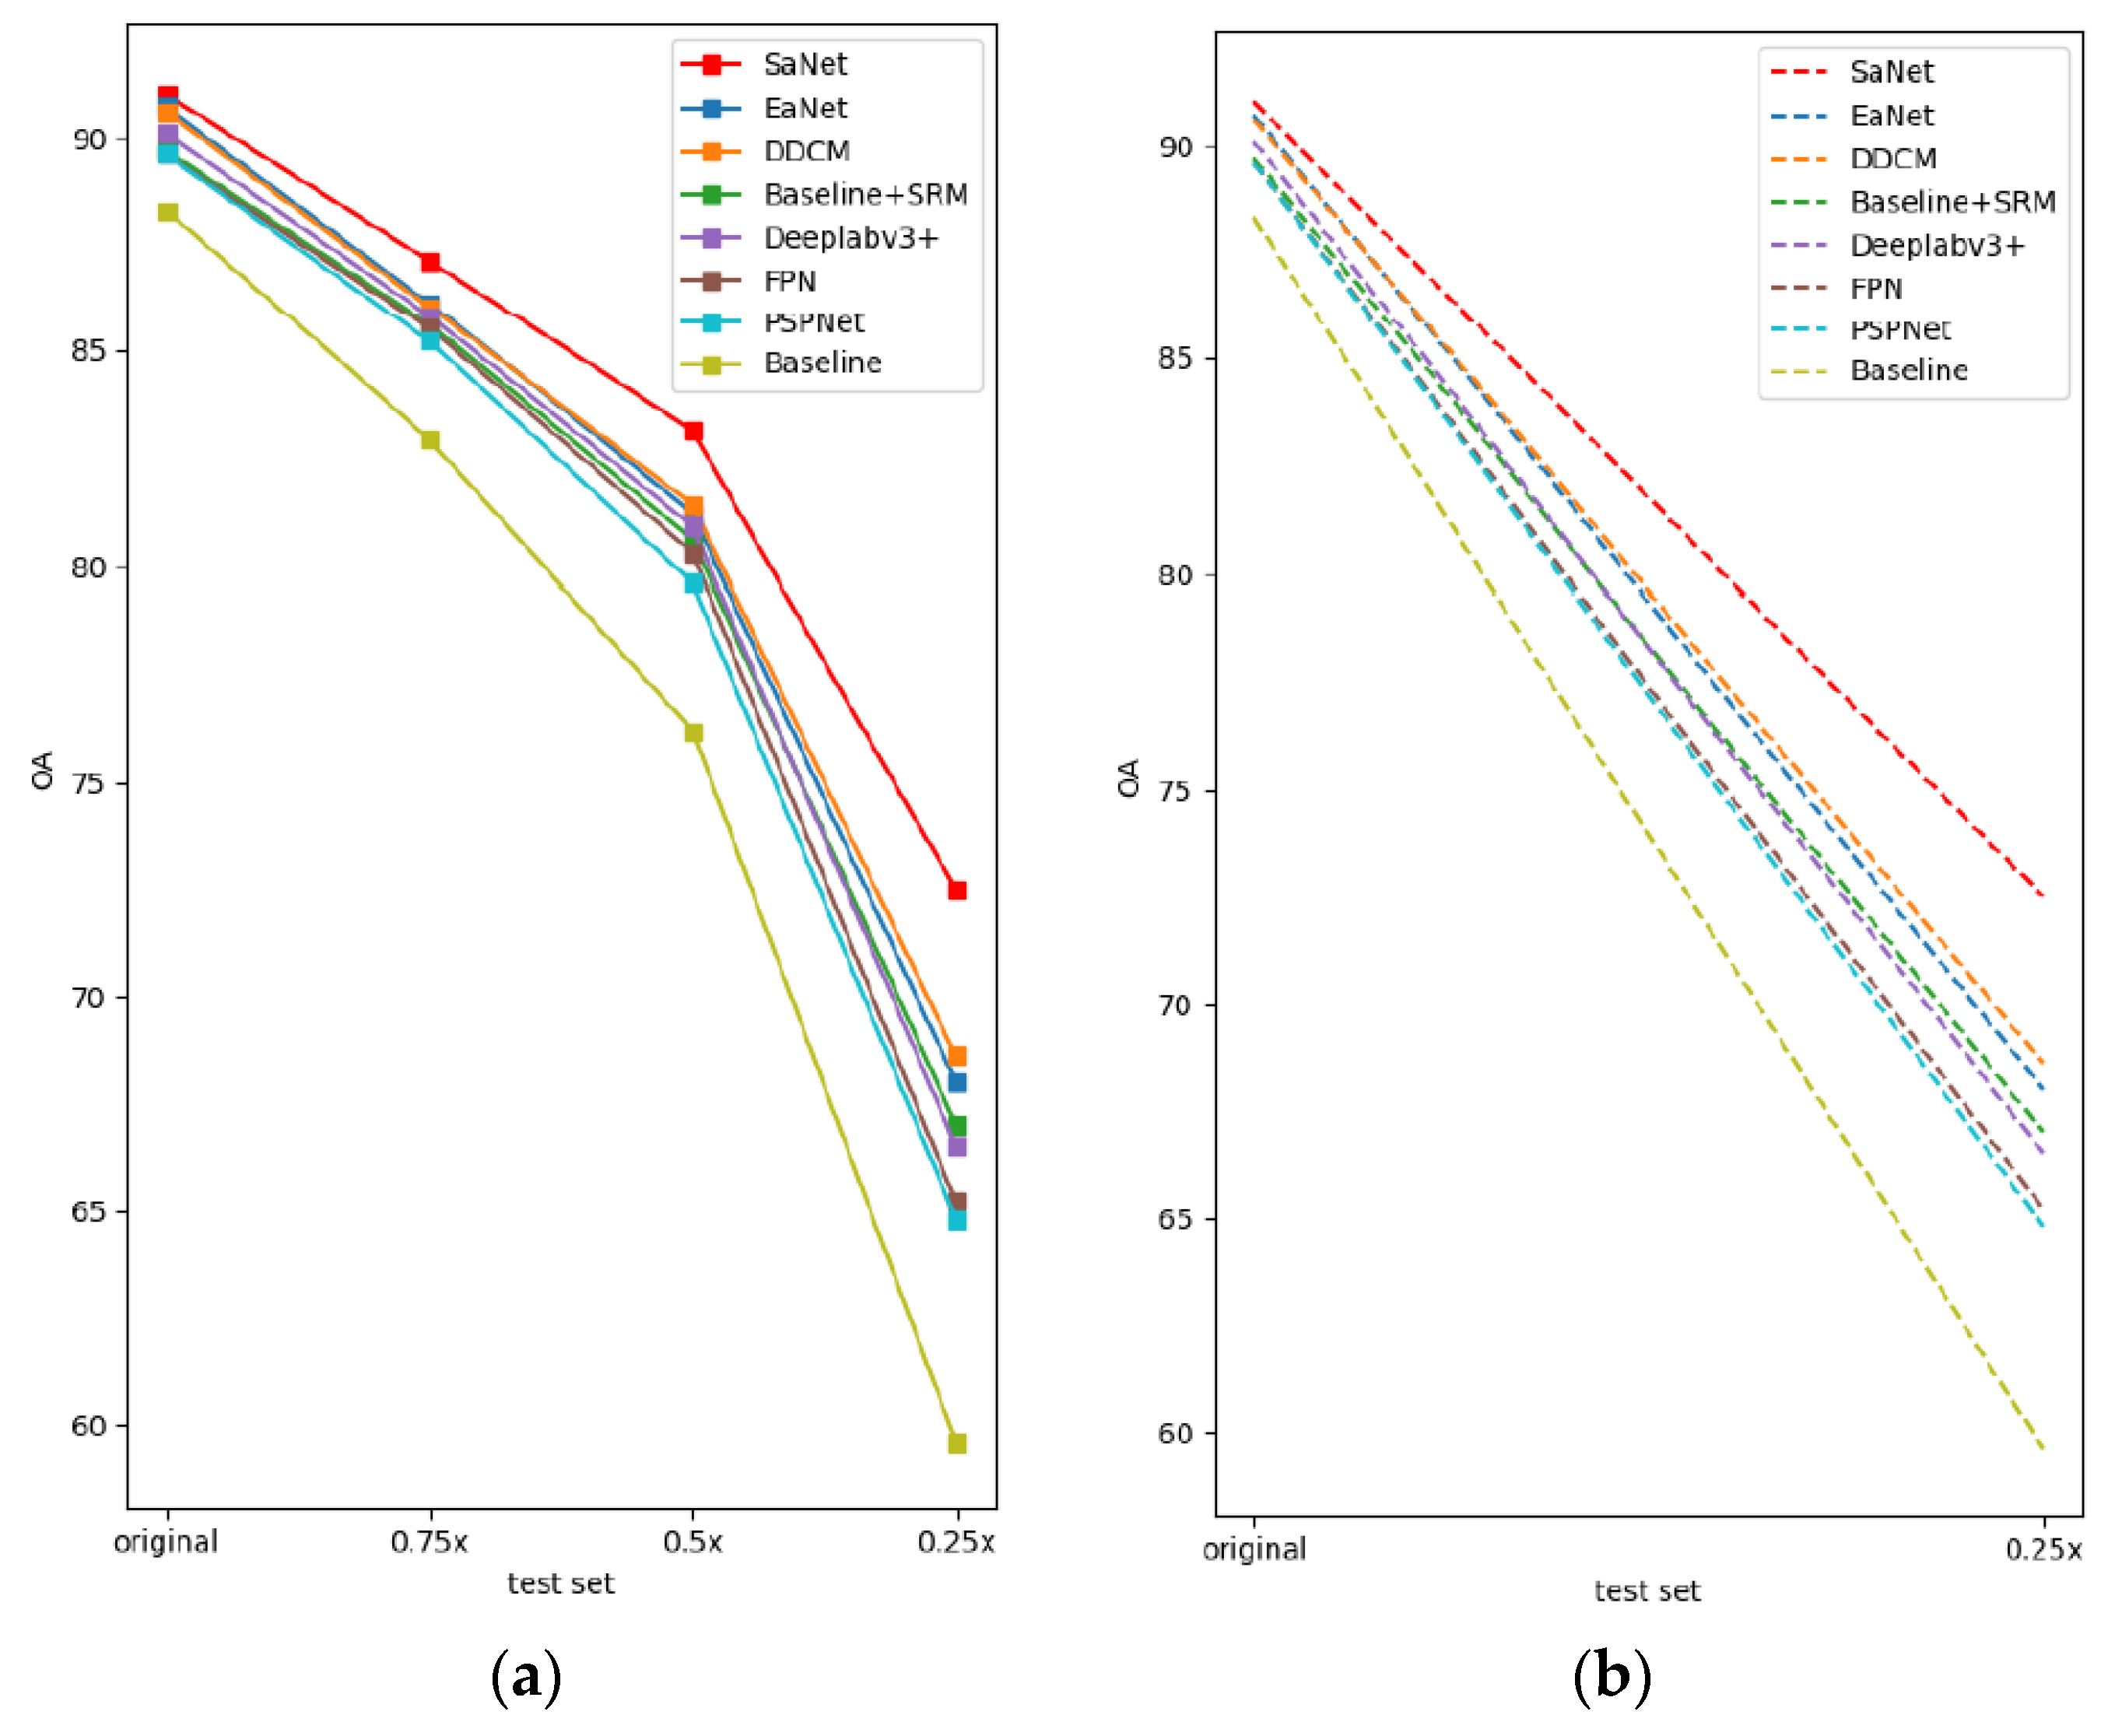
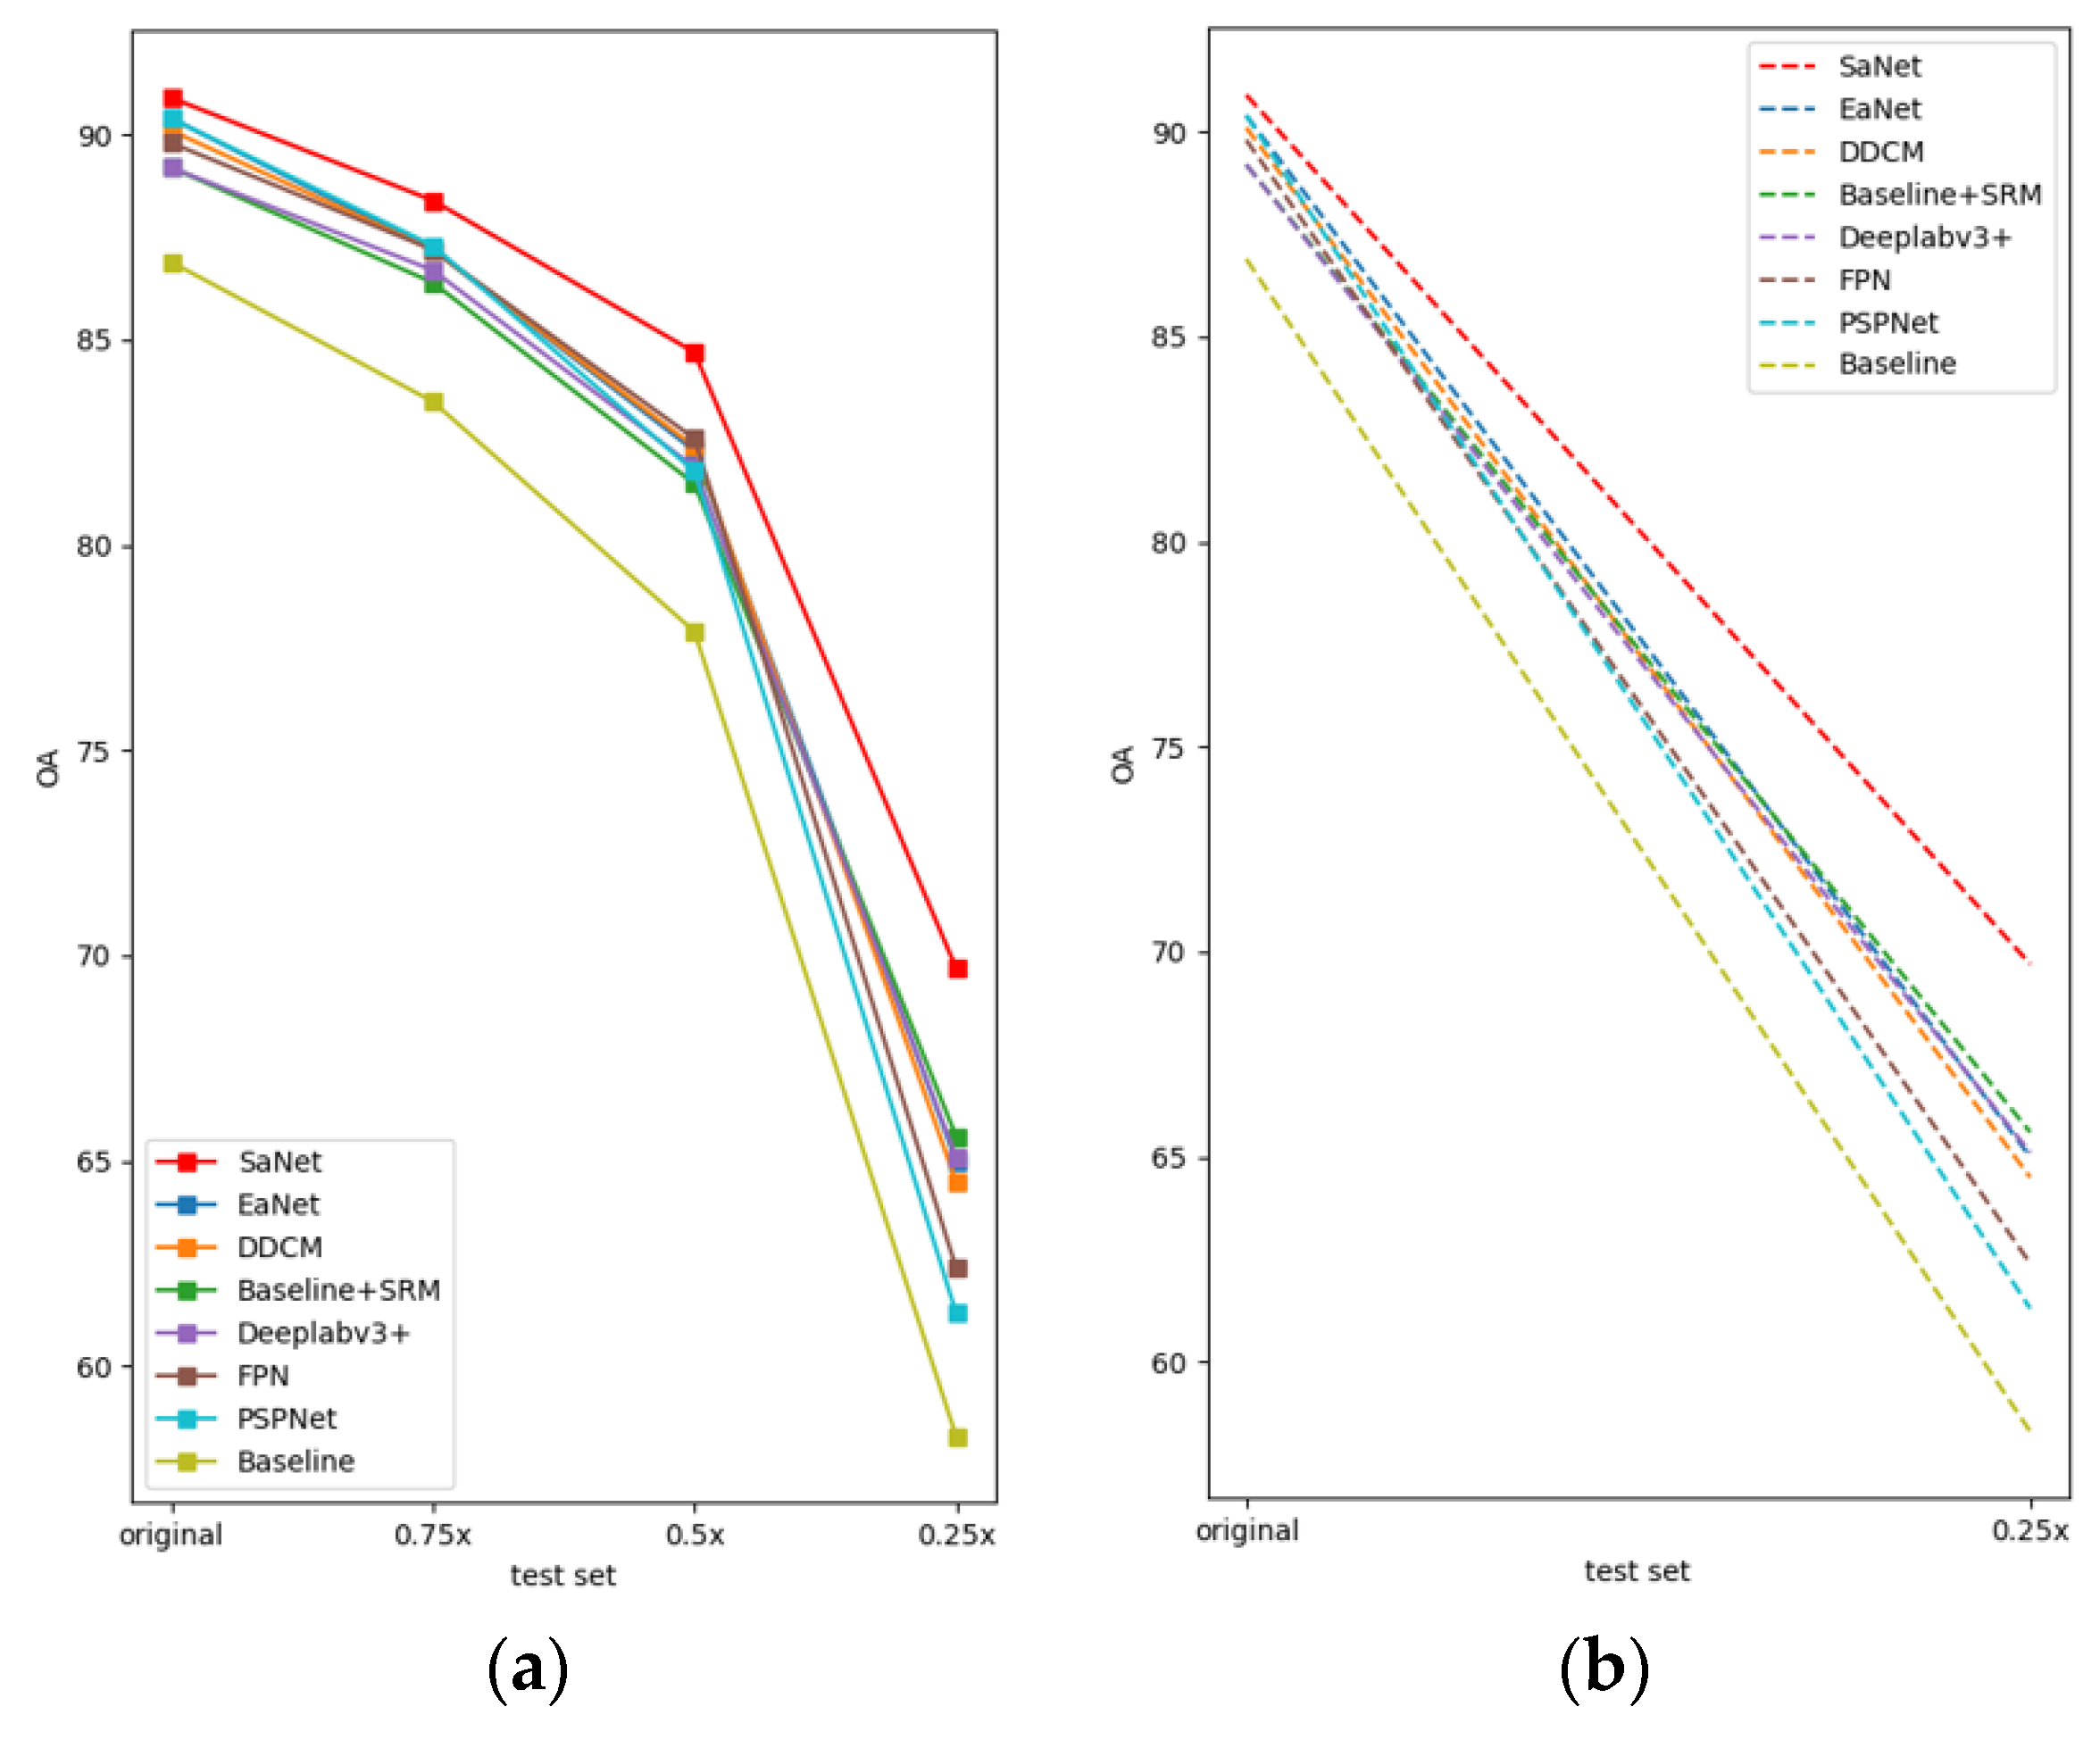
| Baseline | 88.3 | 82.9 | 76.2 | 59.6 | 76.8 |
| Baseline + FPN (FPN) | 89.6 | 85.5 | 80.3 | 65.2 | 80.2 |
| Baseline + DCFFM | 89.8 | 86.0 | 81.0 | 66.2 | 80.8 |
| Baseline + SRM | 89.7 | 85.6 | 80.6 | 67.0 | 80.7 |
| Baseline + SFRM | 90.2 | 85.9 | 81.3 | 69.8 | 81.8 |
| Baseline + SFRM + DCFFM (SaNet) | 91.0 | 87.1 | 83.1 | 72.5 | 83.4 |
| Method | F1-Score | OA | Mean F1-Score | Mean OA | ||||||
|---|---|---|---|---|---|---|---|---|---|---|
| Original | 0.75× | 0.5× | 0.25× | Original | 0.75× | 0.5× | 0.25× | |||
| Baseline | 84.9 | 76.4 | 65.9 | 48.2 | 88.3 | 82.9 | 76.2 | 59.6 | 68.9 | 76.8 |
| Baseline + SRM | 87.7 | 80.6 | 70.3 | 53.6 | 89.7 | 85.6 | 80.6 | 67.0 | 73.1 | 80.7 |
| FPN | 88.0 | 81.7 | 72.1 | 53.3 | 89.6 | 85.5 | 80.3 | 65.2 | 73.8 | 80.2 |
| PSPNet | 87.0 | 79.8 | 69.9 | 52.3 | 89.6 | 85.2 | 79.6 | 64.8 | 72.3 | 79.8 |
| Deeplabv3+ | 88.7 | 81.8 | 72.5 | 54.0 | 90.1 | 85.8 | 80.9 | 66.5 | 74.3 | 80.8 |
| DDCM-Net | 89.6 | 82.0 | 72.4 | 55.9 | 90.6 | 86.0 | 81.4 | 68.6 | 75.0 | 81.7 |
| EaNet | 89.8 | 82.6 | 73.4 | 55.9 | 90.7 | 86.1 | 81.2 | 68.0 | 75.4 | 81.5 |
| SaNet (ours) | 90.3 | 84.3 | 75.9 | 59.2 | 91.0 | 87.1 | 83.1 | 72.5 | 77.4 | 83.4 |
| Dataset | Spatial Resolution (cm) | Patch Size (Pixels) | Patch Numbers |
|---|---|---|---|
| Train set | 5 | 512 × 512 | 3456 |
| Original test set | 5 | 512 × 512 | 2016 |
| 0.75× test set | 6.67 | 512 × 512 | 1134 |
| 0.5× test set | 10 | 512 × 512 | 504 |
| 0.25× test set | 20 | 512 × 512 | 126 |
| Method | F1-Score | OA | Mean F1-Score | Mean OA | ||||||
|---|---|---|---|---|---|---|---|---|---|---|
| Original | 0.75× | 0.5× | 0.25× | Original | 0.75× | 0.5× | 0.25× | |||
| Baseline | 87.8 | 82.1 | 73.5 | 47.9 | 86.9 | 83.5 | 77.9 | 58.3 | 72.8 | 76.7 |
| Baseline + SRM | 90.4 | 85.4 | 76.8 | 55.0 | 89.2 | 86.4 | 81.5 | 65.6 | 76.9 | 80.7 |
| FPN | 90.4 | 85.9 | 78.0 | 52.1 | 88.9 | 86.2 | 81.4 | 63.9 | 76.6 | 80.1 |
| PSPNet | 90.5 | 85.2 | 76.1 | 52.8 | 89.5 | 86.3 | 80.8 | 62.0 | 76.2 | 79.7 |
| Deeplabv3+ | 90.0 | 85.4 | 77.8 | 51.3 | 88.8 | 86.1 | 81.3 | 64.0 | 76.1 | 80.1 |
| DDCM-Net | 91.7 | 87.3 | 76.4 | 55.0 | 90.1 | 87.2 | 82.4 | 64.5 | 77.6 | 81.1 |
| EaNet | 91.9 | 87.1 | 78.8 | 55.4 | 90.4 | 87.2 | 82.3 | 65.0 | 78.3 | 81.2 |
| SaNet (ours) | 92.3 | 88.3 | 82.4 | 58.4 | 90.9 | 88.4 | 84.7 | 69.7 | 80.4 | 83.4 |
Publisher’s Note: MDPI stays neutral with regard to jurisdictional claims in published maps and institutional affiliations. |
© 2021 by the authors. Licensee MDPI, Basel, Switzerland. This article is an open access article distributed under the terms and conditions of the Creative Commons Attribution (CC BY) license (https://creativecommons.org/licenses/by/4.0/).
Share and Cite
Wang, L.; Zhang, C.; Li, R.; Duan, C.; Meng, X.; Atkinson, P.M. Scale-Aware Neural Network for Semantic Segmentation of Multi-Resolution Remote Sensing Images. Remote Sens. 2021, 13, 5015. https://doi.org/10.3390/rs13245015
Wang L, Zhang C, Li R, Duan C, Meng X, Atkinson PM. Scale-Aware Neural Network for Semantic Segmentation of Multi-Resolution Remote Sensing Images. Remote Sensing. 2021; 13(24):5015. https://doi.org/10.3390/rs13245015
Chicago/Turabian StyleWang, Libo, Ce Zhang, Rui Li, Chenxi Duan, Xiaoliang Meng, and Peter M. Atkinson. 2021. "Scale-Aware Neural Network for Semantic Segmentation of Multi-Resolution Remote Sensing Images" Remote Sensing 13, no. 24: 5015. https://doi.org/10.3390/rs13245015