Article

DisasterGAN: Generative Adversarial Networks for Remote Sensing Disaster Image Generation

1
State Key Laboratory of Fire Science, University of Science and Technology of China, Hefei 230026, China
2
Department of Automation, University of Science and Technology of China, Hefei 230026, China
3
Institute of Advanced Technology, University of Science and Technology of China, Hefei 230088, China
*
Author to whom correspondence should be addressed.
Remote Sens. 2021, 13(21), 4284; https://doi.org/10.3390/rs13214284
Submission received: 13 September 2021 / Revised: 17 October 2021 / Accepted: 20 October 2021 / Published: 25 October 2021
(This article belongs to the Special Issue Deep Learning and Computer Vision in Remote Sensing)

Abstract

:
Rapid progress on disaster detection and assessment has been achieved with the development of deep-learning techniques and the wide applications of remote sensing images. However, it is still a great challenge to train an accurate and robust disaster detection network due to the class imbalance of existing data sets and the lack of training data. This paper aims at synthesizing disaster remote sensing images with multiple disaster types and different building damage with generative adversarial networks (GANs), making up for the shortcomings of the existing data sets. However, existing models are inefficient in multi-disaster image translation due to the diversity of disaster and inevitably change building-irrelevant regions caused by directly operating on the whole image. Thus, we propose two models: disaster translation GAN can generate disaster images for multiple disaster types using only a single model, which uses an attribute to represent disaster types and a reconstruction process to further ensure the effect of the generator; damaged building generation GAN is a mask-guided image generation model, which can only alter the attribute-specific region while keeping the attribute-irrelevant region unchanged. Qualitative and quantitative experiments demonstrate the validity of the proposed methods. Further experimental results on the damaged building assessment model show the effectiveness of the proposed models and the superiority compared with other data augmentation methods.

Graphical Abstract

1. Introduction

Rapid detection and assessment after the occurrence of disaster play a very important role in humanitarian assistance and disaster recovery. The applications of deep-learning models in remote sensing have attracted much attention recently. Among them, as the building damage assessment data set represented by the xBD data set [1] has been open source, researchers have proposed several building detection and damage assessment models based on deep neural networks (DNNs) [2,3,4]. DNNs such as convolutional neural networks (CNNs) need a substantial amount of training data. Compared with the large data sets of natural images, the limited labeled remote sensing data becomes an obstacle to train a DNN well, especially in building damage data sets. Moreover, there is an obvious class imbalance in the xBD data set; specifically, the sample size of the damaged buildings in the three categories (minor damage, major damage, and destroyed) is far less than that of the no-damage buildings [1]. This problem makes it difficult for the model to extract the features of buildings damaged by different types of disasters, thus affecting the accuracy of the assessment model.
The fact proves that, among the existing models of damage building assessment based on the xBD data set, the accuracy of minor damage and major-damage categories is obviously lower than that of the no-damage category, which means that minor damage and major damage classes belong to the hard classes [1,2,3,4]. To address this problem, scholars also put forward several data augmentation strategies to improve the class imbalance. To be more specific, Shen et al. [2] apply the CutMix as a data augmentation method that combines the hard-classes images with random images to reconstruct new samples, Hao et al. [3] adopt the common data augmentation method such as horizontal flipping and random cropping during training, and Boin et al. [4] mitigate class imbalance with oversampling. Although the aforementioned methods have a certain effect on improving the accuracy of hard classes, in fact, these are deformation and reorganization of the original samples; more seriously, these may degrade the quality of images, thus affecting the rationality of the features extracted by the feature extractor. Essentially, the above methods do not add new samples and rely on human decisions and manual selection of data transformations, whereas it takes much manpower and material resources to collect and process remote sensing images of damaged buildings to make new samples.
Recently, generative adversarial networks (GANs) [5] and their variants have been widely used in the field of computer vision, such as image-to-image translation [6,7,8] and image attribute editing [9,10,11,12]. GANs aim to fit the real distribution of data by a Min-Max game theory. The standard GAN contains two parts: the generator G and discriminant D, by adversarial training, making the generator generate images gradually close to the real images. In this way, GAN has become an effective framework to generate random data distribution models so that scholars naturally associate that GAN can learn the data distribution of data samples and generate samples as close as possible to the training data distribution. In fact, this trait can be used as the data augmentation method. It is not uncommon to generate images using GAN as a data augmentation strategy currently [13,14,15,16], which also has been proven effective in different computer vision tasks.
Moreover, scholars also use GAN-based models to translate or edit satellite images in remote sensing fields [17,18,19]. Specifically, Li et al. [17] designed a translation model based on GAN to translate optical images to SAR images, which reduces the gap between two types of images. Benjdira et al. [18] design an algorithm that reduces the domain shift influence using GAN, considering that the images in the target domain and source domain are usually different. Moreover, Iqbal et al. [19] propose domain adaptation models to better train built-up segmentation models, which is also motivated by GAN methods.
The remote sensing images in xBD [1] data set have unique characteristics, which are quite different from natural images or other satellite images data sets. First, the remote sensing images include seven different types of disasters, and each class of disaster has its own traits, such as the way to destroy buildings. Second, the remote sensing images are collected from different countries and different events so that the density and damage level of buildings may be various. In order to design effective image generation models, we need to consider the disaster types and the traits of damaged buildings. However, the existing GAN-based models are inefficient in the multi-attribute image translation task; specifically, it is generally necessary to build several different models for every pair of image attributes. This problem is not conducive to the rapid image generation of multiple disaster types. In addition, most existing models directly operate on the whole image, which inevitably changes the attribute-irrelevant region. Nevertheless, the data augmentation for specific damaged buildings typically needs to consider the building region. Thus, to solve both problems in existing GAN-based image generation and more adapt to remote sensing disaster image generation tasks, we try to propose two image generation models that aim at generating disaster images with multiple disaster types and concentrating on different damaged buildings, respectively.
In recent image generation studies, StarGAN [6] has proven to be effective and efficient in multi-attribute image translation tasks; moreover, SaGAN [10] can only alter the attribute-specific region with the guidance of the mask in face. Inspired by these, we propose the algorithm called DisasterGAN, including two models: disaster translation GAN and damaged building generation GAN. The main contributions of this paper are as follows:
(1)
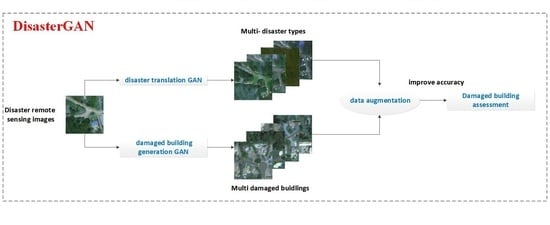
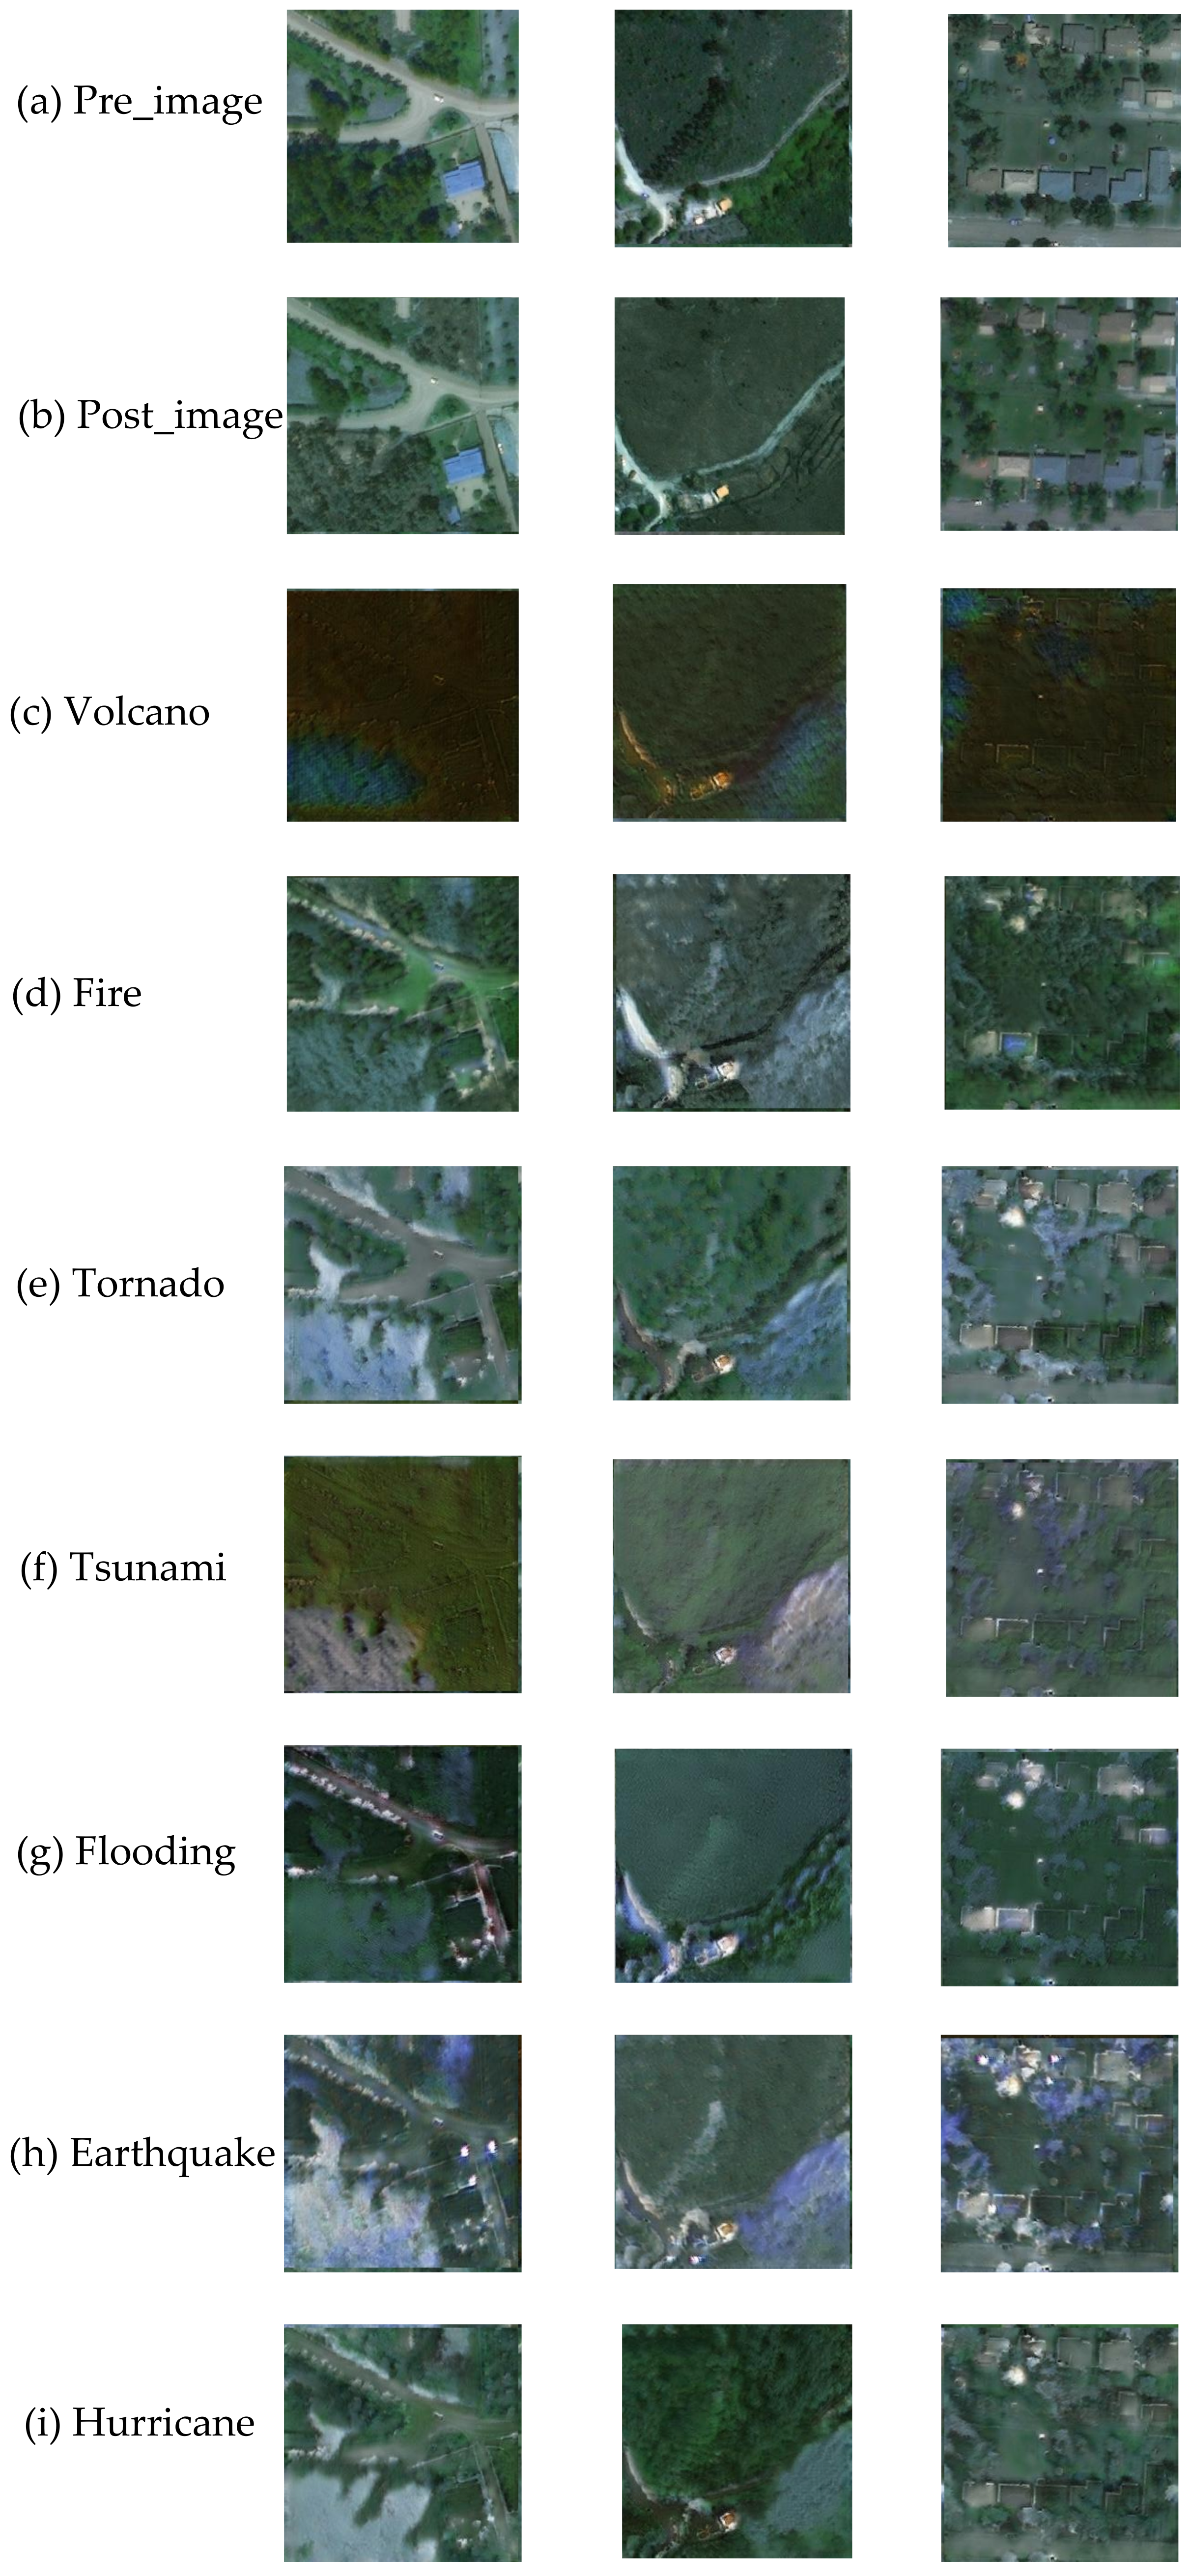
Disaster translation GAN is proposed to realize multiple disaster attributes image translation flexibly using only a single model. The core idea is to adopt an attribute label representing disaster types and then take in as inputs both images and disaster attributes, instead of only translating images between two fixed domains such as the previous models.
(2)
Damaged building generation GAN implements specified damaged building attribute editing, which only changes the specific damaged building region and keeps the rest region unchanged. Exactly, mask-guided architecture is introduced to keep the model only focused on the attribute-specific region, and the reconstruction loss further ensures the attribute-irrelevant region is unchanged.
(3)
To the best of our knowledge, DisasterGAN is the first GAN-based remote sensing disaster images generation network. It is demonstrated that the DisasterGAN method can synthesize realistic images by qualitative and quantitative evaluation. Moreover, it can be used as a data augmentation method to improve the accuracy of the building damage assessment model.
The rest of this paper is organized as follows. Section 2 shows the related research about the proposed method. Section 3 introduces the detailed architecture of the two models, respectively. Then, Section 4 describes the experiment setting and shows the results quantitatively and qualitatively, while Section 5 discusses the effectiveness of the proposed method and verifies the superiority compared with other data augmentation methods. Finally, Section 6 makes a conclusion.

2. Related Work

In this section, we will introduce the related work from four aspects, which are close to the proposed method.

2.1. Generative Adversarial Networks

Since GANs [5] has been proposed, GANs and their variants [20,21] have shown remarkable success in a variety of computer vision tasks, specifically, image-to-image translation [6], image completion [7,8,12], face attribute editing [9,10], image super-resolution [22], etc. GANs aim to fit the real distribution of data by a Min-Max game theory. The standard GAN consists of a generator and a discriminator, and the idea of GANs training is based on adversarial learning to train generator and discriminator simultaneously. The goal of the generator is to generate realistic images, whereas the discriminator is trained to distinguish the generated images and true images. For the original GAN, it has problems that the training process is unstable, and the generated data is not controllable. Therefore, scholars put forward conditional generative adversarial network (CGAN) [23] as the extension of GAN. Additional conditional information (attribute labels or other modalities) was introduced in the generator and the discriminator as the condition for better controlling the generation of GAN.

2.2. Image-to-Image Translation

GAN-based image-to-image translation task has received much attention in the research community, including paired image translation and unpaired image translation. Nowadays, image translation has been widely used in different computer vision fields (i.e., medical image analysis, style transfer) or the preprocessing of downstream tasks (i.e., change detection, face recognition, domain adaptation). There have been some typical models in recent years, such as Pix2Pix [24], CycleGAN [7], and StarGAN [6]. Pix2Pix [24] is the early image-to-image translation model, which learns the mapping from the input and the output through the paired images. It can translate the images from one domain to another domain, and it is demonstrated in synthesizing photos from label maps, reconstructing objects from edge maps tasks. However, in some practical tasks, it is difficult to obtain paired training data, so that CycleGAN [7] is proposed to solve this problem. CycleGAN can translate images without paired training samples due to the cycle consistency loss. Specifically, CycleGAN learns two mappings: G : X Y (from source domain to target domain) and the inverse mapping F : Y X (from target domain to source domain), while cycle consistency loss tries to enforce F ( G ( X ) ) X . Moreover, scholars find that the aforementioned models can only translate images between two domains. So StarGAN [5] is proposed to address the limitation, which can translate images between multiple domains using only a single model. StarGAN adopts attribute labels of the target domain and extra domain classifier in the architecture. In this way, the multiple domain image translation can be effective and efficient.

2.3. Image Attribute Editing

Compared with the image-to-image translation, we also need to focus on more detailed part translation in the image instead of the style transfer or global attribute in the whole image. For example, the above image translation models may not apply in the eyeglasses and mustache editing in the face [25]. We pay attention to face attribute editing tasks such as removing eyeglasses [9,10] and image completion tasks such as filling the missing regions of the images [12]. Zhang et al. [10] propose a spatial attention face attribute editing model that only alters the attribute-specific region and keeps the rest unchanged. The model includes an attribute manipulation network for editing face images and a spatial attention network for locating specific attribute regions. In addition, as for the image completion task, Iizuka et al. [12] propose a global and locally consistent image completion model. With the introduction of the global discriminator and local discriminator, the model can generate images indistinguishable from the real images in both overall consistency and details.

2.4. Data Augmentation

Training a suitable deep-learning model is inseparable from a large amount of labeled data, especially in supervised learning. However, it is difficult to collect large data in some tasks. Standard data augmentation is usually based on geometric transformations, such as color transformations, cropping, flipping [13]. Moreover, using GANs to generate images as a data augmentation has attracted much attention recently, which is common in person re-identification [14,15], license plate recognition [16], few-shot classifier [13]. The GAN-based data augmentation model can directly learn the data distribution, which generates samples that are enforced to be close to the training data distribution [13]. To be more exact, Zhong et al. [10] use CycleGAN [7] to transfer labeled training images to each camera. In this way, the original training data set has been augmented. The model is demonstrated effective, which can be used as a data augmentation method to eliminate camera style differences in person re-identification. Wu et al. [16] propose PixTextGAN, which can generate synthetic license plate images with reasonable text details to enrich the existing license plate data set, thus improving the license plate recognition accuracy. Similar to the above tasks, adequate remote sensing images that used for training building damage assessment model is difficult to collect. In order to model the complex traits of damage, a large amount of damaged building data is indispensable. That is the motivation of our research, proposing a reasonable GAN model as a data augmentation strategy.
In conclusion, we introduce these four aspects of related work in order to make readers better understand the motivation and background of our proposed method. Specifically, the proposed method DisterGAN includes disaster translation GAN and damaged building generation GAN, which may be regarded as image-to-image translation and image attribute editing tasks, respectively. Moreover, we also try to generate damaged building images to make up for the limitation of the existing data as a data generation method.

3. Methods

In this section, we will introduce the proposed remote sensing image generation models, including disaster translation GAN and damaged building generation GAN. The aim of disaster translation GAN is to generate the post-disaster images with disaster attributes, while the damaged building generation GAN is to generate post-disaster images with building attributes.

3.1. Disaster Translation GAN

We first describe the framework of disaster translation GAN. The architecture is shown in Figure 1. Our model is inspired by StarGAN [6], which is introduced simply in Section 2.2. Then, we discuss the objective function and architecture in detail.

3.1.1. Proposed Framework

The goal of disaster translation GAN is to learn mapping functions between disaster images among different disaster attributes. As shown in Figure 1, pre-disaster images X and post-disaster images Y are the paired images. Each image has the corresponding disaster attribute C d . C d means the disaster type of the image; thus, the C d of the X can be defined as 0 uniformly, and the C d of Y can be defined as C d = { 1 ,   2 ,   3 ,   4 ,   5 ,   6 ,   7 } according to 7 types of disasters, respectively. The detailed information of C d can be seen in Section 4.1. As for the generator, the mapping G ( X , C d ) Y translates X into Y conditioned on the target disaster attribute C d . In addition, we introduce the discriminator D s r c with an auxiliary classifier D c l s , where D s r c aims to distinguish between Y and generated images and X and D c l s aims to classify the images.
To achieve this, we train the D and the G with the following training process. (a) Train D to distinguish between true images and fake images and classify the images. (b) G takes as input both the X and the target attributes C d , then outputs fake images. (c) G tries to generate images indistinguishable from the real images and classifiable as the target attributes by D . (d) G tries to reconstruct the original images from the fake images and the original attributes.

3.1.2. Objective Function

Disaster translation GAN is trained with the objective function including three types of loss function, i.e., the adversarial loss, the attribute classification loss, and the reconstruct loss, which are introduced as follows, respectively.
Adversarial Loss. To make the generated images indistinguishable from the real images, we adopt the strategy of adversarial learning to train the generator and the discriminator simultaneously. The adversarial loss is defined as
L a d v = Ε X [ log D s r c ( X ) ] + E X , C d [ log ( 1 D s r c ( X ) ) ] ,
where the D s r c ( X ) is the probability distribution over sources given by D . The generator G and the discriminator D are adversarial to each other. The training of the G makes the adversarial loss as small as possible, while the D tries to maximize it.
Attribute Classification Loss. As mentioned above, our goal is to translate the pre-disaster images into the generated images of attributes C d . Therefore, the attributes not only need to be correctly generated but also need to be correctly classified. To achieve this, we adopt attribute classification loss when we optimize both the generator and the discriminator. Specifically, we adopt the real images and their true corresponding attributes to optimize the discriminator and use the target attributes and the generated images to optimize the generator. The specific formula is shown below.
L c l s D = E X , C d [ log D c l s ( C d Y ) ] ,
where D c l s ( c d Y ) represents a probability distribution over attribute labels computed by D . In the experiment, the X and Y are both real images, in order to simplify the experiment, only the Y are inputted as the real images, and the corresponding attributes are target attributes. By optimizing this objective function, the classifier of discriminator can learn to identify the attribute.
Similarly, we use the generated images X to optimize the generator so that it can generate images that can be identified as the corresponding attribute, as defined below
L c l s G = E X , C d [ log D c l s ( C d X ) ] .
Reconstruction Loss. With the use of adversarial loss and attribute classification loss, the generated images can be as realistic as true images and be classified to their target attribute. However, these losses cannot guarantee that the translation only takes place in the attribute-specific part of the input. Based on this, construction loss is proposed to solve this problem, which is also used in CycleGAN [15].
L r e c = E X , C d g , C d [ X G ( G ( X , C d ) , C d g ) 1 ]
Here, C d g represents the original attribute of inputs. G is adopted twice, first to translate an original image into the one with the target attribute, then to reconstruct the original image from the translated image, for the generator to learn to change only what is relevant to the attribute.
Overall, the objective function of the generator and discriminator are shown as below:
min L D = L a d v + λ c l s L c l s D
min L G = L a d v + λ c l s L c l s G + λ r e c L r e c ,
where the λ c l s , λ r e c is the hyper-parameters to balance the attribute classification loss and reconstruction loss, respectively. In this experiment, we adopt λ c l s = 1 , λ r e c = 10 .

3.1.3. Network Architecture

The specific network architecture of G and D are shown in Table 1 and Table 2. I, O, K, P, and S, respectively, represent the number of input channels, the number of output channels, kernel size, padding size, and stride size. IN represents instance normalization, and ReLU and Leaky ReLU are the activation functions. The generator takes as input an 11-channel tensor, consisting of an input RGB image and a given attribute value (8-channel), then outputs RGB generated images. Moreover, in the output layer of the generator, Tanh is adopted as an activation function, as the input image has been normalized to [−1, 1]. The classifier and the discriminator share the same network except for the last layer. For the discriminator, we use the output structure such as PatchGAN [24], and we output a probability distribution over attribute labels by the classifier.

3.2. Damaged Building Generation GAN

In the following part, we will introduce the damaged building generation GAN in detail. The whole structure is shown in Figure 2. The proposed model is motivated by SaGAN [10].

3.2.1. Proposed Framework

The training data of the model includes pre-disaster images X , post-disaster images Y , and the corresponding building attributes C b . Among them, C b means whether the image contains damaged buildings; specifically, the C b of the X can be defined as 0 uniformly while the C b of Y is expressed as C b = { 0 ,   1 } according to whether there are damaged buildings in the image. The specific information of data can refer to Section 4.1.
We train generator G to translate the X into the generated images Y with target attributes C b , formula as below:
Y = G ( X , C b )
As Figure 2 shows, we can see the attribute generation module (AGM) in G , which we define as F . F takes as input both the pre-disaster images X and the target building attributes C b , outputting the images Y F , defined as:
Y F = F ( X , C b )
As for the damaged building generation GAN, we only need to focus on the change of damaged buildings. The changes in the background and undamaged buildings are beyond our consideration. Thus, to better pay attention to this region, we adopt the damaged building mask M to guide the damaged building generation. The value of the mask M should be 0 or 1; specially, the attribute-specific regions should be 1, and the rest regions should be 0.
As the guidance of M , we only reserve the change of attribute-specific regions, while the attribute-irrelevant regions remain unchanged as the original image, formulated as follows:
Y = G ( X , C b ) = X · ( 1 M ) + Y F · M
The generated images Y should be as realistic as true images. At the same time, Y should also correspond to the target attribute C b as much as possible. In order to improve the generated images Y , we train discriminator D with two aims, one is to discriminate the images, and the other is to classify the attributes C b of images, which are defined as D s r c and D c l s respectively. Moreover, the detailed structure of G and D can be seen in Section 3.2.3.

3.2.2. Objective Function

The objective function of damaged building generation GAN includes adversarial loss, attribute classification loss, and reconstruction loss. We will cover that in this section. It should be emphasized that the definitions of these losses are basically the same as these in Section 3.1.2, so we provide a simple introduction in this section.
Adversarial Loss. To generate synthetic images indistinguishable from real images, we adopt the adversarial loss for the discriminator D
L s r c D = Ε Y log D s r c ( Y ) + Ε Y log ( 1 D s r c ( Y ) ) ,
where Y is the real images, to simplify the experiment, we only input the Y as the real images, Y is the generated images, D s r c ( Y ) is the probability that the image discriminates to the true images.
As for the generator G , the adversarial loss is defined as
L s r c G = Ε Y log D s r c ( Y ) ,
Attribute Classification Loss. The purpose of attribute classification loss is to make the generated images closer to being classified as the defined attributes. The formula of D c l s can be expressed as follows for the discriminator
L c l s D = Ε Y , C b g log D c l s ( c b g Y )
where C b g is the attributes of true images, and D c l s ( c b g Y ) represents the probability of an image being classified as the attribute C b g . The attribute classification loss of G can be defined as
L c l s G = Ε Y [ log D c l s ( c b Y ) ]
Reconstruction Loss. The goal of reconstruction loss is to keep the image of the attribute-irrelevant region mentioned above unchanged. The definition of reconstruction loss is as follows
L r e c G = λ 1 Ε X , c b g , c b [ ( X G ( G ( X , c b ) , c b g ) 1 ] + λ 2 Ε X , c b g [ ( X G ( X , c b g ) 1 ]
where c b g is the attribute of the original images, while c b is the target attribute and λ 1 , λ 2 are the hyper-parameters. We adopt λ 1 = 1 , λ 2 = 10 in this experiment. To be more specific, the first part can be understood that the input image returns to the original input after being transformed twice by the generator; that is, the first generated images Y = G ( X , c b ) input the generator again to make G ( Y , c b g ) as close as possible to X . The second part is to guarantee that input image X is not modified when edited by its own attribute c b g .
Overall, the objective function of the generator and discriminator are shown below
min L G = L s r c G + L c l s G + L r e c G
min L D = L s r c D + L c l s D

3.2.3. Network Architecture

The specific network architecture of the attribute generation module (AGM) and D are shown in Table 3 and Table 4. The definition of I, O, K, P, S, IN, ReLU, and Leaky ReLU can be seen in Section 3.1.3. The AGM takes as input a 4-channel tensor, including an input RGB image and a given attribute value, then outputs RGB generated image.

4. Experiments and Results

In this section, we first introduce the data set, then illustrate implementation details and show the visualization results of the models, respectively. Next, we perform a quantitative evaluation index (FID) to evaluate the generated images.

4.1. Data Set

Our research is based on the open-source xBD data set [1], which is the largest damaged building remote sensing data set for building damage assessment so far. The assessment of building damage is a joint evaluation standard based on the existing disaster assessment standard [26,27], which classifies the damaged buildings into four categories (no damage, minor damage, major damage, destroyed). The data source of the xBD data set comes from Maxar/DigitalGlobe open data program, consisting of remote sensing images with RGB bands, a resolution equal to or less than 0.8 m GSD. For better generalization of the model, developers choose seven different types of disaster events in various parts of the world. The complete xBD data set contains 22,068 remote sensing images with the size of 1024 × 1024, covering 19 different disaster events and 850,736 buildings, seeing more information in the work of [1].
To adapt to the model training in this study, we have performed a series of processing on the xBD data set and obtained two new data sets (disaster data set and building data set). First, we crop each original remote sensing image (size of 1024 × 1024) to 16 remote sensing images (size of 256 × 256), getting 146,688 pairs of pre-disaster and post-disaster images. Then, labeling each image with the disaster attribute according to the types of disasters, specifically, the disaster attribute of the pre-disaster image is 0 ( C d = 0), and the attribute of the post-disaster image can be seen in Table 5 in detail. In the disaster translation GAN, we do not need to consider the damaged building, so the location and damage level of buildings will not be given in the disaster data set. The specific information of the disaster data set is shown in Table 5, and the samples of the disaster data set are shown in Figure 3.
Based on the disaster data set, in order to train damaged building generation GAN, we further screen out the images containing buildings, then obtain 41,782 pairs of images. In fact, the damaged buildings in the same damage level may look different based on the disaster type and the location; moreover, the data of different damage levels in the xBD data set are insufficient, so we only classify the building into two categories for our tentative research. We simply label buildings as damaged or undamaged; that is, we label the building attributes of post-disaster images ( C b ) as 1 only when there are damaged buildings in the post-disaster image. Moreover, we label the other post-disaster images and the pre-disaster image as 0. Then, comparing the buildings of pre-disaster and post-disaster images in the position and damage level of buildings to obtain the pixel-level mask, the position of damaged buildings is marked as 1 while the undamaged buildings and the background are marked as 0. Through the above processing, we obtain the building data set. The statistical information is shown in Table 6, and the samples are shown in Figure 4.

4.2. Disaster Translation GAN

4.2.1. Implementation Details

To stabilize the training process and generate higher quality images, gradient penalty is proposed and has proven to be effective in the training of GAN [28,29]. Thus, we introduce this item in the adversarial loss, replacing the original adversarial loss. The formula is as follows. For more details, please refer to the work of [22,23].
L a d v = Ε X [ D s r c ( X ) ] E X , C d [ D s r c ( G ( X , C d ) ) ] λ g p E x ^ [ ( x ^ D s r c ( x ^ ) 2 1 ) 2 ]
Here, x ^ is sampled uniformly along a straight line between a pair of real and generated images. Moreover, we set λ g p = 10 in this experiment.
We train disaster translation GAN on the disaster data set, which includes 146,688 pairs of pre-disaster and post-disaster images. We randomly divide the data set into training set (80%, 117,350) and test set (20%, 29,338). Moreover, we use Adam [30] as an optimization algorithm, setting β 1 = 0.5 ,   β 2 = 0.999 . The batch size is set to 16 for all experiments, and the maximum epoch is 200. Moreover, we train models with a learning rate of 0.0001 for the first 100 epochs and linearly decay the learning rate to 0 over the next 100 epochs. Training takes about one day on a Quadro GV100 GPU.

4.2.2. Visualization Results

Single Attributes-Generated Image. To evaluate the effectiveness of the disaster translation GAN, we compare the generated images with real images. The synthetic images generated by disaster translation GAN and real images are shown in Figure 5. As shown in this, the first and second rows display the pre-disaster image (Pre_image) and post-disaster image (Post_image) in the disaster data set, while the third row is the generated images (Gen_image). We can see that the generated images are very similar to real post-disaster images. At the same time, the generated images can not only retain the background of pre-disaster images in different remote sensing scenarios but also introduce disaster-relevant features.
Multiple Attributes-Generated Images Simultaneously. In addition, we visualize the multiple attribute synthetic images simultaneously. The disaster attributes in the disaster data set correspond to seven disaster types, respectively (volcano, fire, tornado, tsunami, flooding, earthquake, and hurricane). As shown in Figure 6, we get a series of generated images under seven disaster attributes, which are represented by disaster names, respectively. Moreover, the first two rows are the corresponding pre-disaster images and the post-disaster images from the data set. As can be seen from the figure, there are a variety of disaster characteristics in the synthetic images, which means that model can flexibly translate images on the basis of different disaster attributes simultaneously. More importantly, the generated images only change the features related to the attributes without changing the basic objects in the images. That means our model can learn reliable features universally applicable to images with different disaster attributes. Moreover, the synthetic images are indistinguishable from the real images. Therefore, we guess that the synthetic disaster images can also be regarded as the style transfer under different disaster backgrounds, which can simulate the scenes after the occurrence of disasters.

4.3. Damaged Building Generation GAN

4.3.1. Implementation Details

Same to the gradient penalty introduced in Section 4.2.1, we have made corresponding modifications in the adversarial loss of damaged building generation GAN, which will not be specifically introduced.
We train damaged building generation GAN on building data set, which includes 41,782 pairs of pre-disaster and post-disaster images. We randomly divided building data set into a training set (90%, 37,604) and test set (20%, 4178). We use Adam [24] to train our model, setting β 1 = 0.5 ,   β 2 = 0.999 . The batch size is set to 32, and the maximum epoch is 200. Moreover, to train the model stably, we train the generator with a learning rate of 0.0002 while training the discriminator with 0.0001. Training takes about one day on a Quadro GV100 GPU.

4.3.2. Visualization Results

In order to verify the effectiveness of damaged building generation GAN, we visualize the generated results. As shown in Figure 7, the first three rows are the pre-disaster images (Pre_image), the post-disaster images (Post_image), and the damaged building labels (Mask), respectively. The fourth row is the generated images (Gen_image). It can be seen that the changed regions of the generated images are obvious, meanwhile preserving attribute-irrelevant regions unchanged such as the undamaged buildings and the background. Furthermore, the damaged buildings generate by combining the original features of the building and the surrounding, which are also as realistic as true images. However, we also need to point out clearly that the synthetic damaged buildings are lacking in textural detail, which is the key point of model optimization in the future.

4.4. Quantitative Results

To better evaluate the images generated by the proposed models, we choose the common evaluation metric Fréchet inception distance (FID) [31]. FID measures the discrepancy between two sets of images. Exactly, the calculation of FID is based on the features from the last average pooling layer of the ImageNet-pretrained Inception-V3 [32]. For each test image from the original attribute, we first translate it into a target attribute using 10 latent vectors, which are randomly sampled from the standard Gaussian distribution. Then, calculate FID between the generated images and real images in the target attribute. The specific formula is as follows
d 2 = μ 1 μ 2 2 + T r ( C 1 + C 2 2 ( C 1 C 2 ) 1 / 2 ) ,
where ( μ 1 , C 1 ) and ( μ 2 , C 2 ) represent the mean and covariance matrix of the two distributions, respectively.
As mentioned above, it should be emphasized that the model calculating FID bases on the pretrained ImageNet, while there are certain differences between the remote sensing images and the natural images in ImageNet. Therefore, the FID is only for reference, which can be used as a comparison value for other subsequent models of the same task.
For the models proposed in this paper, we calculate the FID value between the generated images and the real images based on the disaster data set and building data set, respectively. We carried out five tests and averaged the results to obtain the FID value of disaster translation GAN and damaged building generation GAN, as shown in Table 7.

5. Discussion

In this part, we investigate the contribution of data augmentation methods, considering whether the proposed data augmentation method is beneficial for improving the accuracy of building damage assessment. To this end, we adopt the classical building damage assessment Siamese-UNet [33] as the evaluation model, which is widely used in building damage assessment based on the xBD data set [3,34,35]. The code of the assessment model (Siamese-UNet) has been released at https://github.com/TungBui-wolf/xView2-Building-Damage-Assessment-using-satellite-imagery-of-natural-disasters, last accessed date: 21 October 2021).
In the experiments, we use DisasterGAN, including disaster translation GAN and damaged building generation GAN, to generate images, respectively. We compare the accuracy of Siamese-UNet, which trains on the augmented data set and the original data set, to explore the performance of the synthetic images. First, we select the images with damaged buildings as augmented samples. Then, we augment these samples into two samples, that is, expanding the data set with the corresponding generated images that take in as input both the pre-disaster images and the target attributes. The damaged building label of the generated images is consistent with the corresponding post-disaster images. The building damage assessment model is trained by the augmented data set, and the original data set is then tested on the same original test set.
In addition, we try to compare the proposed method with other data augmentation methods to verify the superiority. Different data augmentation methods have been proposed to solve the limited data problem [36]. Among them, geometric transformation (i.e., flipping, cropping, rotation) is the most common method in computer vision tasks. Cutout [37], Mixup [38], CutMix [39] and GridMask [40] are also widely adopted. In our experiment, considering the trait of the building damage assessment task, we choose geometric transformation and CutMix as the comparative methods. Specifically, we follow the strategy of CutMix in the work of [2], which verifies that CutMix on hard classes (minor damage and major damage) gets the best result. As for geometric transformation, we use horizontal/vertical flipping, random cropping, and rotation in the experiment.
The results are shown in Table 8, where the evaluation metric F1 is an index to evaluate the accuracy of the model. F1 takes into account both precision and recall. It is used in the xBD data set [1], which is suitable for the evaluation of samples with class imbalance. As shown in Table 8, we can observe that further improvement for all damage levels in the data augmentation data set. To be more specific, the data augmentation strategy on hard classes (minor damage, major damage, and destroyed) boosts the performance (F1) better. In particular, major damage is the most difficult class based on the result in Table 8, while the F1 of major damage level is improved by 46.90% (0.5582 vs. 0.8200) with the data augmentation. Moreover, the geometric transformation only improves slightly, while the results of CutMix are also worse than the proposed method. The results show that the data augmentation strategy is clearly improving the accuracy of the building damage assessment model, especially in the hard classes, which demonstrates that the augmented strategy promotes the model to learn better representations for those classes.
As for the building data set, the data is enhanced in the same way as above by the damaged building generation GAN. Then, we obtain the augmented data set and the original data set. It needs to be noted that we only classify the damage level of the building into damaged and undamaged. The minor damage, major damage, and destroyed class in the original data are classified as damaged uniformly. The building damage assessment model is trained in the original data set, and the augmented data set is then tested on the same original test set. The results are shown in Table 9. We can clearly observe that there is an obvious improvement in damaged classes compared with the undamaged class. Compared with the geometric transformation and CutMix, the proposed method has proven effectiveness and superiority.

6. Conclusions

In this paper, we propose a GAN-based remote sensing disaster images generation method DisasterGAN, including the disaster translation GAN and damaged building generation GAN. These two models can translate disaster images with different disaster attributes and building attributes, which have proven to be effective by quantitative and qualitative evaluations. Moreover, to further validate the effectiveness of the proposed models, we employ these models to synthesize images as a data augmentation strategy. Specifically, the accuracy of hard classes (minor damage, major damage, and destroyed) are improved by 4.77%, 46.90%, and 9.37%, respectively, by disaster translation GAN. damaged building generation GAN further improves the accuracy of damaged class (11.11%). Moreover, this GAN-based data augmentation method is better than the comparative method. Future research can be devoted to combined disaster types and subdivided damage levels, trying to optimize the existing disaster image generation model.

Author Contributions

X.R., W.S., Y.K. and Y.C. conceived and designed the experiments; X.R. performed the experiments; X.R., X.Y. and Y.C. analyzed the data; X.R. proposed the method and wrote the paper. All authors have read and agreed to the published version of the manuscript.

Funding

This research was funded by The National Key Research and Development Program of China,” Study on all-weather multi-mode forest fire danger monitoring, prediction and early-stage accurate fire detection ”.

Acknowledgments

The authors are grateful for the producers of the xBD data set and the Maxar/DigitalGlobe open data program (https://www.digitalglobe.com/ecosystem/open-data, last accessed date: 21 October 2021).

Conflicts of Interest

The authors declare no conflict of interest.

Abbreviations

The following abbreviations are used in this manuscript:
GANgenerative adversarial network
DNNdeep neural network
CNNconvolutional neural network
Ggenerator
Ddiscriminator
SARsynthetic aperture radar
FIDFréchet inception distance
F1F1 measure

References

  1. Gupta, R.; Hosfelt, R.; Sajeev, S.; Patel, N.; Goodman, B.; Doshi, J.; Heim, E.; ChoseT, H.; Gaston, M. Creating xBD: A dataset for assessing building damage from satellite imagery. In Proceedings of the Computer Vision and Pattern Recognition Conference Workshops, Long Beach, CA, USA, 16–20 June 2019; pp. 10–17. [Google Scholar]
  2. Shen, Y.; Zhu, S.; Yang, T.; Chen, C. Cross-Directional Feature Fusion Network for Building Damage Assessment from Satellite Imagery. In Proceedings of the Neural Information Processing Systems Workshops, Vancouver, BC, Canada, 6–12 December 2020. [Google Scholar]
  3. Hao, H.; Baireddy, S.; Bartusiak, E.R.; Konz, L.; Delp, E.J. An Attention-Based System for Damage Assessment Using Satellite Imagery. arXiv 2020, arXiv:2004.06643. [Google Scholar]
  4. Boin, J.B.; Roth, N.; Doshi, J.; Llueca, P.; Borensztein, N. Multi-class segmentation under severe class imbalance: A case study in roof damage assessment. In Proceedings of the Neural Information Processing Systems Workshops, Vancouver, BC, Canada, 6–12 December 2020. [Google Scholar]
  5. Goodfellow, I.; Pouget-Abadie, J.; Mirza, M.; Xu, B.; Warde-Farley, D.; Ozair, S.; Courville, A.; Bengio, Y. Generative adversarial nets. In Proceedings of the Advances in Neural Information Processing Systems (NIPS), Montreal, QC, Canada, 13 December 2014; pp. 2672–2680. [Google Scholar]
  6. Choi, Y.; Choi, M.; Kim, M.; Ha, J.-W.; Kim, S.; Choo, J. StarGAN: Unified Generative Adversarial Networks for Multi-domain Image-to-Image Translation. In Proceedings of the Computer Vision and Pattern Recognition Conference (CVPR), Salt Lake City, UT, USA, 18–22 June 2018; pp. 8789–8797. [Google Scholar] [CrossRef] [Green Version]
  7. Zhu, J.-Y.; Park, T.; Isola, P.; Efros, A.A. Unpaired Image-to-Image Translation Using Cycle-Consistent Adversarial Networks. In Proceedings of the IEEE International Conference on Computer Vision (ICCV), Venice, Italy, 22–29 October 2017; pp. 2242–2251. [Google Scholar] [CrossRef] [Green Version]
  8. Jiang, Y.; Gong, X.; Liu, D.; Cheng, Y.; Fang, C.; Shen, X.; Yang, J.; Zhou, P.; Wang, Z. EnlightenGAN: Deep Light Enhancement Without Paired Supervision. IEEE Trans. Image Process. 2021, 30, 2340–2349. [Google Scholar] [CrossRef] [PubMed]
  9. Lee, Y.-H.; Lai, S.-H. ByeGlassesGAN: Identity Preserving Eyeglasses Removal for Face Images. In Proceedings of the European Conference on Computer Vision (ECCV), Glasgow, UK, 23–28 August 2020; pp. 243–258. [Google Scholar] [CrossRef]
  10. Zhang, G.; Kan, M.; Shan, S.; Chen, X. Generative Adversarial Network with Spatial Attention for Face Attribute Editing. In Proceedings of the European Conference on Computer Vision (ECCV), Munich, Germany, 8–14 September 2018; pp. 422–437. [Google Scholar] [CrossRef]
  11. Choi, Y.; Uh, Y.; Yoo, J.; Jung, W.H. StarGAN v2: Diverse Image Synthesis for Multiple Domains. In Proceedings of the Computer Vision and Pattern Recognition Conference (CVPR), Seattle, WA, USA, 16–20 June 2020; pp. 8185–8194. [Google Scholar]
  12. Iizuka, S.; Simo-Serra, E.; Ishikawa, H. Globally and locally consistent image completion. ACM Trans. Graph. (TOG) 2017, 36, 1–14. [Google Scholar] [CrossRef]
  13. Mounsaveng, S.; Vazquez, D.; Ayed, I.B.; Pedersoli, M. Adversarial Learning of General Transformations for Data Augmentation. arXiv 2019, arXiv:1909.09801. [Google Scholar]
  14. Zhong, Z.; Liang, Z.; Zheng, Z.; Li, S.; Yang, Y. Camera Style Adaptation for Person Re-identification. In Proceedings of the Computer Vision and Pattern Recognition Conference (CVPR), Salt Lake City, UT, USA, 18–22 June 2018; pp. 5157–5166. [Google Scholar]
  15. Huang, S.W.; Lin, C.T.; Chen, S.P. AugGAN: Cross Domain Adaptation with GAN-based Data Augmentation. In Proceedings of the European Conference on Computer Vision (ECCV), Munich, Germany, 8–14 September 2018; pp. 731–744. [Google Scholar]
  16. Wu, S.; Zhai, W.; Cao, Y. PixTextGAN: Structure aware text image synthesis for license plate recognition. IET Image Process. 2019, 13, 2744–2752. [Google Scholar] [CrossRef]
  17. Li, X.; Du, Z.; Huang, Y.; Tan, Z. A deep translation (GAN) based change detection network for optical and SAR remote sensing images. ISPRS J. Photogramm. Remote Sens. 2021, 179, 14–34. [Google Scholar] [CrossRef]
  18. Benjdira, B.; Bazi, Y.; Koubaa, A.; Ouni, K. Unsupervised Domain Adaptation using Generative Adversarial Networks for Semantic Segmentation of Aerial Images. Remote Sens. 2019, 11, 1369. [Google Scholar] [CrossRef] [Green Version]
  19. Iqbal, J.; Ali, M. Weakly-supervised domain adaptation for built-up region segmentation in aerial and satellite imagery. ISPRS J. Photogramm. Remote Sens. 2020, 167, 263–275. [Google Scholar] [CrossRef]
  20. Li, Z.; Wu, X.; Usman, M.; Tao, R.; Xia, P.; Chen, H.; Li, B. A Systematic Survey of Regularization and Normalization in GANs. arXiv 2020, arXiv:2008.08930. [Google Scholar]
  21. Li, Z.; Xia, P.; Tao, R.; Niu, H.; Li, B. Direct Adversarial Training: An Adaptive Method to Penalize Lipschitz Continuity of the Discriminator. arXiv 2020, arXiv:2008.09041. [Google Scholar]
  22. Ledig, C.; Theis, L.; Huszar, F.; Caballero, J.; Cunningham, A.; Acosta, A.; Aitken, A.; Tejani, A.; Totz, J.; Wang, Z.; et al. Photo-realistic single image super-resolution using a generative adversarial network. In Proceedings of the IEEE Conference on Computer Vision and Pattern Recognition (CVPR), Honolulu, HI, USA, 21–26 July 2017; pp. 105–114. [Google Scholar]
  23. Mirza, M.; Osindero, S. Conditional Generative Adversarial Nets. arXiv 2014, arXiv:1411.1784. [Google Scholar]
  24. Isola, P.; Zhu, J.Y.; Zhou, T. Image-to-Image Translation with Conditional Adversarial Networks. In Proceedings of the IEEE Conference on Computer Vision and Pattern Recognition (CVPR), Honolulu, HI, USA, 21–26 July 2017; pp. 5967–5976. [Google Scholar]
  25. Tao, R.; Li, Z.; Tao, R.; Li, B. ResAttr-GAN: Unpaired deep residual attributes learning for multi-domain face image translation. IEEE Access 2019, 7, 132594–132608. [Google Scholar] [CrossRef]
  26. Federal Emergency Management Agency. Damage assessment operations manual: A guide to assessing damage and impact. Technical report, Federal Emergency Management Agency, Apr. 2016. Available online: https://www.fema.gov/sites/default/files/2020-07/Damage_Assessment_Manual_April62016.pdf (accessed on 21 October 2021).
  27. Federal Emergency Management Agency. Hazus Hurricane Model Uer Guidance. Technical Report, Federal Emergency Management Agency, Apr. 2018. Available online: https://www.fema.gov/sites/default/files/2020-09/fema_hazus_hurricane_user-guidance_4.2.pdf (accessed on 21 October 2021).
  28. Arjovsky, M.; Chintala, S.; Bottou, L. Wasserstein generative adversarial networks. In Proceedings of the 34th International Conference on Machine Learning (ICML), Sydney, Australia, 6–11 August 2017; pp. 214–223. [Google Scholar]
  29. Gulrajani, I.; Ahmed, F.; Arjovsky, M.; Dumoulin, V.; Courville, A. Improved training of wasserstein gans. In Proceedings of the Neural Information Processing Systems, Long Beach, CA, USA, 4–10 December 2017; pp. 5767–5777. [Google Scholar]
  30. Kingma, D.; Ba, J. Adam: A method for stochastic optimization. arXiv 2014, arXiv:1412.6980. [Google Scholar]
  31. Heusel, M.; Ramsauer, H.; Unterthiner, T.; Nessler, B.; Hochreiter, S. Gans trained by a two time-scale update rule converge to a local nash equilibrium. In Proceedings of the Neural Information Processing Systems, Long Beach, CA, USA, 4–10 December 2017; pp. 6629–6640. [Google Scholar]
  32. Szegedy, C.; Vanhoucke, V.; Ioffe, S.; Shlens, J.; Wojna, Z. Rethinking the inception architecture for computer vision. In Proceedings of the IEEE Conference on Computer Vision and Pattern Recognition (CVPR), Las Vegas, NV, USA, 26 June–1 July 2016; pp. 2818–2826. [Google Scholar]
  33. Daudt, R.C.; Le, S.B.; Boulch, A. Fully convolutional siamese networks for change detection. In Proceedings of the IEEE International Conference on Image Processing (ICIP), Athens, Greece, 7–10 October 2018; pp. 4063–4067. [Google Scholar]
  34. Bosch, M.; Conroy, C.; Ortiz, B.; Bogden, P. Improving emergency response during hurricane season using computer vision. In Proceedings of the SPIE Remote Sensing, Online, 21–25 September 2020; Volume 11534, p. 115340H. [Google Scholar] [CrossRef]
  35. Benson, V.; Ecker, A. Assessing out-of-domain generalization for robust building damage detection. arXiv 2020, arXiv:2011.10328. [Google Scholar]
  36. Shorten, C.; Khoshgoftaar, T.M. A survey on Image Data Augmentation for Deep Learning. J. Big Data 2019, 6, 1–48. [Google Scholar] [CrossRef]
  37. Devries, T.; Taylor, G.W. Improved Regularization of Convolutional Neural Networks with Cutout. arXiv 2017, arXiv:1708.04552. [Google Scholar]
  38. Zhang, H.; Cisse, M.; Dauphin, Y.N.; Lopez-Paz, D. Mixup: Beyond Empirical Risk Minimization. arXiv 2018, arXiv:1710.09412. [Google Scholar]
  39. Yun, S.; Han, D.; Oh, S.J.; Chun, S.; Choe, J.; Yoo, Y. CutMix: Regularization Strategy to Train Strong Classifiers with Localizable Features. arXiv 2019, arXiv:1905.04899. [Google Scholar]
  40. Chen, P.; Liu, S.; Zhao, H.; Jia, J. GridMask Data Augmentation. arXiv 2020, arXiv:2001.040862020. [Google Scholar]
Figure 1. The architecture of disaster translation GAN, including generator G and discriminator D . D has two objectives, distinguishing the generated images from the real images and classifying the disaster attributes. G takes in as input both the images and target disaster attributes and generates fake images, with the inverse process that reconstructing original images with fake images given the original disaster attributes.
Remotesensing 13 04284 g001
Figure 2. The architecture of damaged building generation GAN, consisting of a generator G and a discriminator D . D has two objectives, distinguishing the generated images from the real images and classifying the building attributes. G consists of an attribute generation module (AGM) to edit the images with the given building attribute, and the mask-guided structure aims to localize the attribute-specific region, which restricts the alternation of AGM within this region.
Remotesensing 13 04284 g002
Figure 3. The samples of disaster data set, (a,b) represent the pre-disaster and post-disaster images according to the seven types of disaster, respectively, each column is a pair of images.
Remotesensing 13 04284 g003
Figure 4. The samples of building data set. (ac) represent the pre-disaster, post-disaster images, and mask, respectively, each row is a pair of images, while two rows in the figure represent two different cases.
Remotesensing 13 04284 g004
Figure 5. Single attributes-generated images results. (ac) represent the pre-disaster, post-disaster images, and generated images, respectively, each column is a pair of images, and here are four pairs of samples.
Remotesensing 13 04284 g005
Figure 6. Multiple attributes-generated images results. (a,b) represent the real pre-disaster images and post-disaster images. The images (ci) belong to generated images according to disaster types volcano, fire, tornado, tsunami, flooding, earthquake, and hurricane, respectively.
Remotesensing 13 04284 g006
Figure 7. Damaged building generation results. (ad) represent the pre-disaster, post-disaster images, mask, and generated images, respectively. Each column is a pair of images, and here are four pairs of samples.
Remotesensing 13 04284 g007
Table 1. Architecture of the generator.
Layer Generator, G
L1Conv(I11, O64, K7, P3, S1), I N, ReLU
L2Conv(I64, O128, K4, P1, S2), IN, ReLU
L3Conv(I128, O256, K4, P1, S2), IN, ReLU
L4Residual Block(I256, O256, K3, P1, S1)
L5Residual Block(I256, O256, K3, P1, S1)
L6Residual Block(I256, O256, K3, P1, S1)
L7Residual Block(I256, O256, K3, P1, S1)
L8Residual Block(I256, O256, K3, P1, S1)
L9Residual Block(I256, O256, K3, P1, S1)
L10Deconv(I256, O128, K4, P1, S2), IN, ReLU
L11Deconv(I128, O64, K4, P1, S2), IN, ReLU
L12Conv(I64, O3, K7, P3, S1), Tanh
Table 2. Architecture of the discriminator.
Layer Discriminator, D
L1Conv(I3, O64, K4, P1, S2), Leaky ReLU
L2Conv(I64, O128, K4, P1, S2), Leaky ReLU
L3Conv(I128, O256, K4, P1, S2), Leaky ReLU
L4Conv(I256, O512, K4, P1, S2), Leaky ReLU
L5Conv(I512, O1024, K4, P1, S2), Leaky ReLU
L6Conv(I1024, O2048, K4, P1, S2), Leaky ReLU
L7src: Conv(I2048, O1, K3, P1, S1);
cls: Conv(I2048, O8, K4, P0, S1) 1;
1 src and cls represent the discriminator and classifier, respectively. These are different in L7 while sharing the same first six layers.
Table 3. Architecture of attribute generation module (AGM).
Layer Attribute Generation Module, AGM
L1Conv(I4, O32, K7, P3, S1), I N, ReLU
L2Conv(I32, O64, K7, P3, S1), I N, ReLU
L3Conv(I64, O128, K4, P1, S2), IN, ReLU
L4Conv(I128, O256, K4, P1, S2), IN, ReLU
L5Residual Block(I256, O256, K3, P1, S1)
L6Residual Block(I256, O256, K3, P1, S1)
L7Residual Block(I256, O256, K3, P1, S1)
L8Residual Block(I256, O256, K3, P1, S1)
L9Deconv(I256, O128, K4, P1, S2), IN, ReLU
L10Deconv(I128, O64, K4, P1, S2), IN, ReLU
L11Deconv(I64, O32, K4, P1, S2), IN, ReLU
L12Conv(I32, O3, K7, P3, S1), Tanh
Table 4. Architecture of the discriminator.
Layer Discriminator, D
L1Conv(I3, O16, K4, P1, S2), Leaky ReLU
L2Conv(I16, O32, K4, P1, S2), Leaky ReLU
L3Conv(I32, O64, K4, P1, S2), Leaky ReLU
L4Conv(I64, O128, K4, P1, S2), Leaky ReLU
L5Conv(I128, O256, K4, P1, S2), Leaky ReLU
L6Conv(I256, O512, K4, P1, S2), Leaky ReLU
L7Conv(I512, O1024, K4, P1, S2), Leaky ReLU
L8src: Conv(I1024, O1, K3, P1, S1);
cls: Conv(I1024, O1, K2, P0, S1) 1;
1 src and cls represent the discriminator and classifier, respectively. These are different in L8 while sharing the same first seven layers.
Table 5. The statistics of disaster data set.
Disaster
Types
VolcanoFireTornadoTsunamiFloodingEarthquakeHurricane
C d 1234567
Number/
Pair
494490,25611,504417614,368193619,504
Table 6. The statistics of building data set.
Damage LevelIncluding Damaged BuildingsUndamaged Buildings
C b 10
Number/Pair24,84316,948
Table 7. FID distances of the models.
Evaluation MetricDisaster Translation GANDamaged Building Generation GAN
FID31.168421.7873
Table 8. Effect of data augmentation by disaster translation GAN.
Evaluation MetricOriginal Data Set
(Baseline)
Geometric Transformation CutMixDisaster Translation GANImprovement
F1_no-damage0.94800.94800.94900.94930.0013
(0.14%)
F1_minor-
damage
0.72730.72740.75020.76200.0347
(4.77%)
F1_major-
damage
0.55820.55900.62360.82000.2618
(46.90%)
F1_destoryed0.67320.68340.72890.73630.0631
(9.37%)
Table 9. Effect of data augmentation by damaged building generation GAN.
Evaluation MetricOriginal Data Set
(Baseline)
Geometric Transformation CutMixDamaged Building Generation GANImprovment
F1_undamaged0.94330.94440.95110.95190.0086
(0.91%)
F1_damaged0.70320.74320.75530.78130.0781
(11.11%)
Publisher’s Note: MDPI stays neutral with regard to jurisdictional claims in published maps and institutional affiliations.

