1. Introduction
Today, earth observation also known as remote sensing, and the information derived by it supports and influences decisions in modern societies on all levels from governmental to individual, public to private. As useful as this information is to society, few people know about its background. To address this issue early on, activities funded by national and internal space agencies, such as the DLR or ESA attempt to implement topics connected to earth observation in schools [
1]. The methods and materials used in these efforts range from hands-on experiments (
http://columbuseye.rub.de/english/, accessed on 4 October 2021) to fully interactive units (
https://fis.rub.de/en/teaching-materials, accessed on 4 October 2021) (
Appendix A) [
2].
Thus far, learning videos have not been used, as the main focus has been on interactive teaching materials. While those interactive materials remain of high importance, developments in recent years shifted the focus towards videos as a means to convey background knowledge of remote sensing. This raises the question of whether videos are a suitable way of communicating these topics and if so, how effective they can be compared to other approaches. This paper aims to present a workflow for learning video production that is in accordance with general guidelines for the creation of multimedia learning content. A selection of those videos is integrated into an experimental pre-test/post-test study to test them for efficiency and compare them to other material based on text and illustration. The special circumstances of the testing environment made an in-depth exploration of the data necessary to ensure any bias that was possibly introduced by the test setup would be accounted for and the correct methods of statistical analysis were chosen.
Videos are already a prevalent source of information and are becoming increasingly important. They are, for example, the main source of information in Massive Open Online Courses (MOOCs) [
3], which are increasing in numbers every year [
4]. Large public video platforms have emerged, of which YouTube can be considered the most important. A recent study of online use in Germany shows that educational content in the form of short explainer videos is one of the main content types consumed by frequent users of the platform [
5].
When looking at the use of digital education materials, another study in Germany found that videos are very often used by educators, as well as students, pupils, and the general public [
6]. In this regard, it is also important to notice that, while the main target audience for the videos produced and evaluated for this study are students and pupils, anyone entering the field of remote sensing relies on well-structured information and, therefore, is a potential consumer of the videos. Thus, such videos contribute to the geo-spatial data literacy of these consumers [
7] while demonstrating the potential and limitations of earth observation.
Furthermore, the implications of the COVID-19 pandemic forced educational institutions to establish practices for a variety of remote teaching methods. While students do not necessarily approve of distant learning techniques in general, online teaching will likely become more prevalent in different teaching institutions, and the demand for effective digital materials will rise [
8]. Educational videos will play an important role because they are an effective learning resource when used and created properly and have the advantage of easy online dissemination [
9,
10].
1.1. Educational Videos in Natural Sciences
For conveying the natural sciences, videos and particularly animations are an important resource. They have the potential to show abstract topics by either simplifying them or use a distorted perception of time or size to visualize phenomena that would be otherwise imperceptible to human senses [
11]. Showing real-life images may lack the generalization needed to focus the learner on the important aspects needed to understand the phenomenon. In the natural sciences, there is an abundance of such topics, for instance the electromagnetic spectrum and cell biology.
Planetary movements or the formation of continents are best demonstrated in an appropriate time and size relationship. This is seen in education whenever scientific results are communicated to a broader audience. Animation and science have a strong relationship starting at the very beginning of cinematography as the first animation ever produced served to settle a debate on animal kinematics [
12].
While educational videos in STEM (Science, Technology, Engineering, Math) subjects are common, there are a few examples of them being used to convey remote sensing topics. Comparable approaches are presented by the US-based NEON organisation (
https://www.youtube.com/watch?v=3iaFzafWJQE, accessed on 4 October 2021) or in on other online lessons (
https://study.com/academy/lesson/what-is-remote-sensing.html, accessed on 4 October 2021) where aspects of remote sensing are conveyed to the general public or pupils using explainer videos. Both videos address a broad range of topics while pairing the applications of remote sensing with technical information.
The materials in this study split these aspects in different videos, to make them more dynamically applicable. Most video resources on remote sensing found online is content from Massive Open Online Courses like EO College [
13] that come in the form of hands-on tutorials and talking head videos of experts (
https://www.youtube.com/watch?v=LQiOA7euaYA, accessed on 4 October 2021). The target audience for those are participants of advanced and introductory training on various aspects of remote sensing.
As for the non-experts and the general public, there are several examples of videos from space agencies, such as the ESA or NASA, which often have a more informative character and sometimes tend to advertise the potential of satellite systems and capabilities of the respective space agency in general rather than conveying the basics of the technology itself (
https://www.youtube.com/watch?v=N0G_3FWOOPA, accessed on 4 October 2021,
https://www.youtube.com/user/NASAEarthObservatory, accessed on 4 October 2021). Thus, there is a gap to be filled by video material to support unbiased data literacy of the target groups. On the one hand, such videos inform pupils and students about the fields of application of remote sensing and on the other hand teach the fundamentals of naturals sciences connected to earth observation.
Educational videos come in many formats, each having its characteristics when it comes to production as well as application. Therefore, before creating educational videos and testing them for efficiency, it is important to decide what kind of video learning resource is appropriate for the task and subsequently subject of the study. Köster, in his book, “Video in the age of digital learning” [
14], defined six primary types of instructional videos (cf.
Table 1)
While this gives a comprehensive theoretical overview, one should be aware that the characterizations are generalized, and often the types cannot easily be separated from one another. There is no reason why, e.g., a lecture video should not include animations.
Of those primary types, the videos that are subject to this study fall in the category of “Explainer Videos”. A study committed by Krämer and Böhrs [
15] also indicated that this type of video is especially suited to educate a target group without previous knowledge and has already been proven to be effective in other fields of application.
High school pupils and first-semester university students of geography are the main target group for the content addressed in this paper, and thus the characteristics of this category were the most fitting.
1.2. Effectiveness of Videos
Learning with videos is not guaranteed to be effective. Studies show, for example, that pupils tend to skip whole sections of learning videos [
16], and sometimes the material is of little help when it comes to enhancing the learner’s performance [
17]. Therefore, one should keep in mind that, before trying to prove whether learning through video is more efficient in comparison to other methods, it is important to make sure that it is working at all. Generally, studies tend to show mixed results when comparing video materials to other teaching materials, such as plain text or traditional lectures [
9,
17].
A study comparing how effective math topics could be taught to fourth graders using either cartoons or plain text showed significant advantages of the video material [
18], while other studies, including a study by Lang [
19], that replicated the same content on learning computer skills in both text and video format found no significant difference between experimental and control groups. In general, given how frequently videos are used for educational purposes today and how diverse they can be regarding the target audience as well as the different techniques used to communicate knowledge, there is a demand for experimental studies exploring how well certain content is conveyed to a learner using video.
The fluctuations in the results do not indicate that videos are a superior way of self-teaching compared to traditional methods, such as text and illustration. This phenomenon is not restricted to video alone and can be observed in many studies in the field of educational multimedia content [
20]. Learning videos are an amalgamation of different agents that convey knowledge. Animations, graphics, narration, or production quality may each, on their own and in combination, have an influence on the outcome. Highly differentiated content types meeting different target groups make it hard to discern if the outcome of a certain study is relevant for the planned content or not, and what seems to work better in one situation does not necessarily yield better learning results in another.
This paper takes into consideration this strong dependence on content and presentation by explaining the content as well the methods used in production in more detail in the methodology part. In this way, the outcomes of the study can be better interpreted in the light of the content that was used for the study. The general aim of the study is to answer the question of whether educational videos in the form of explainer videos are a viable resource for the teaching of remote sensing basics and how they compare to traditional text and illustration material.
Section 2 explains in sufficient detail what means were used for the creation of the videos as well as for the setup of the study. The statistical methods are discussed here before the outcomes are presented in
Section 3 and evaluated in
Section 4.
2. Materials and Methods
The foundation upon which the production of the two explainer videos for Earth Observation “Introduction to Earth Observation” and “The Basics of the Electromagnetic Spectrum” was planned and executed was laid out by Mayer and Clark’s [
20,
21] extensive work on compiling findings of studies in the field of multimedia learning and shaping them into applicable guidelines. It will be explained how the recommendations of those guidelines are met. Furthermore, the experimental setup of the pre-test/post-test study is presented as well the statistical means used in the data analysis.
2.1. Guidelines and Production
Given the variety of different video types and visualization techniques involved in learning video production, it is important to avoid pitfalls that would prevent the material from being effective. Those guidelines have been established by cognitive and educational psychologists and present a helpful starting point [
20,
21]. As these guidelines are for educational multimedia content in general, we interpreted and selected them into measures that suited the production of the videos (cf.
Table 2).
We also did not include the whole set of principles and left out, e.g., the “Multimedia Principle” because it implies the use of words alongside illustrations [
22], which is self-evident in video content. The principle of “Pre-Training”, stating that people learn better if exposed to the concepts of the topic before was not considered because of the expected lack of previous knowledge in the target group.
Another important contribution for making learning content effective is the cognitive load theory by Sweller [
23] stating that the complexity of a topic can be described as the cognitive load and is the sum of intrinsic load, inherited by the topic itself, and the extrinsic load that is created by the means of teaching. While the intrinsic cognitive load cannot be influenced, keeping the extrinsic load as low as possible is the goal of any teaching material. Both of these research-based approaches influence each step of the production process that will be described here alongside the tools used in each of the steps.
2.1.1. Conception
In the Conception phase, the topic, as well as the learning goals for the video, are specified. The main target audience is schools, and thus the curriculum was also taken into close consideration. Since earth observation itself is not a part of the curriculum in Germany, and satellite images, in general, are barely addressed [
24], we were looking for topics that occur and can be demonstrated or illustrated with remote sensing. The video titled “Introduction to the Electromagnetic Spectrum” is a fitting example for this strategy since this topic is taught in physics classes, and earth observation is a good example of its application. At this point, we also decided the amount of content, as this influences the length of the video, which has a major influence on student engagement. Lecture videos should not be longer than 9–12 min according to a study by Guo, Kim et al. [
16]. As the potential target audience ranges from pupils to adults, we decided that the maximum length should not exceed 7 min.
2.1.2. Storyboarding
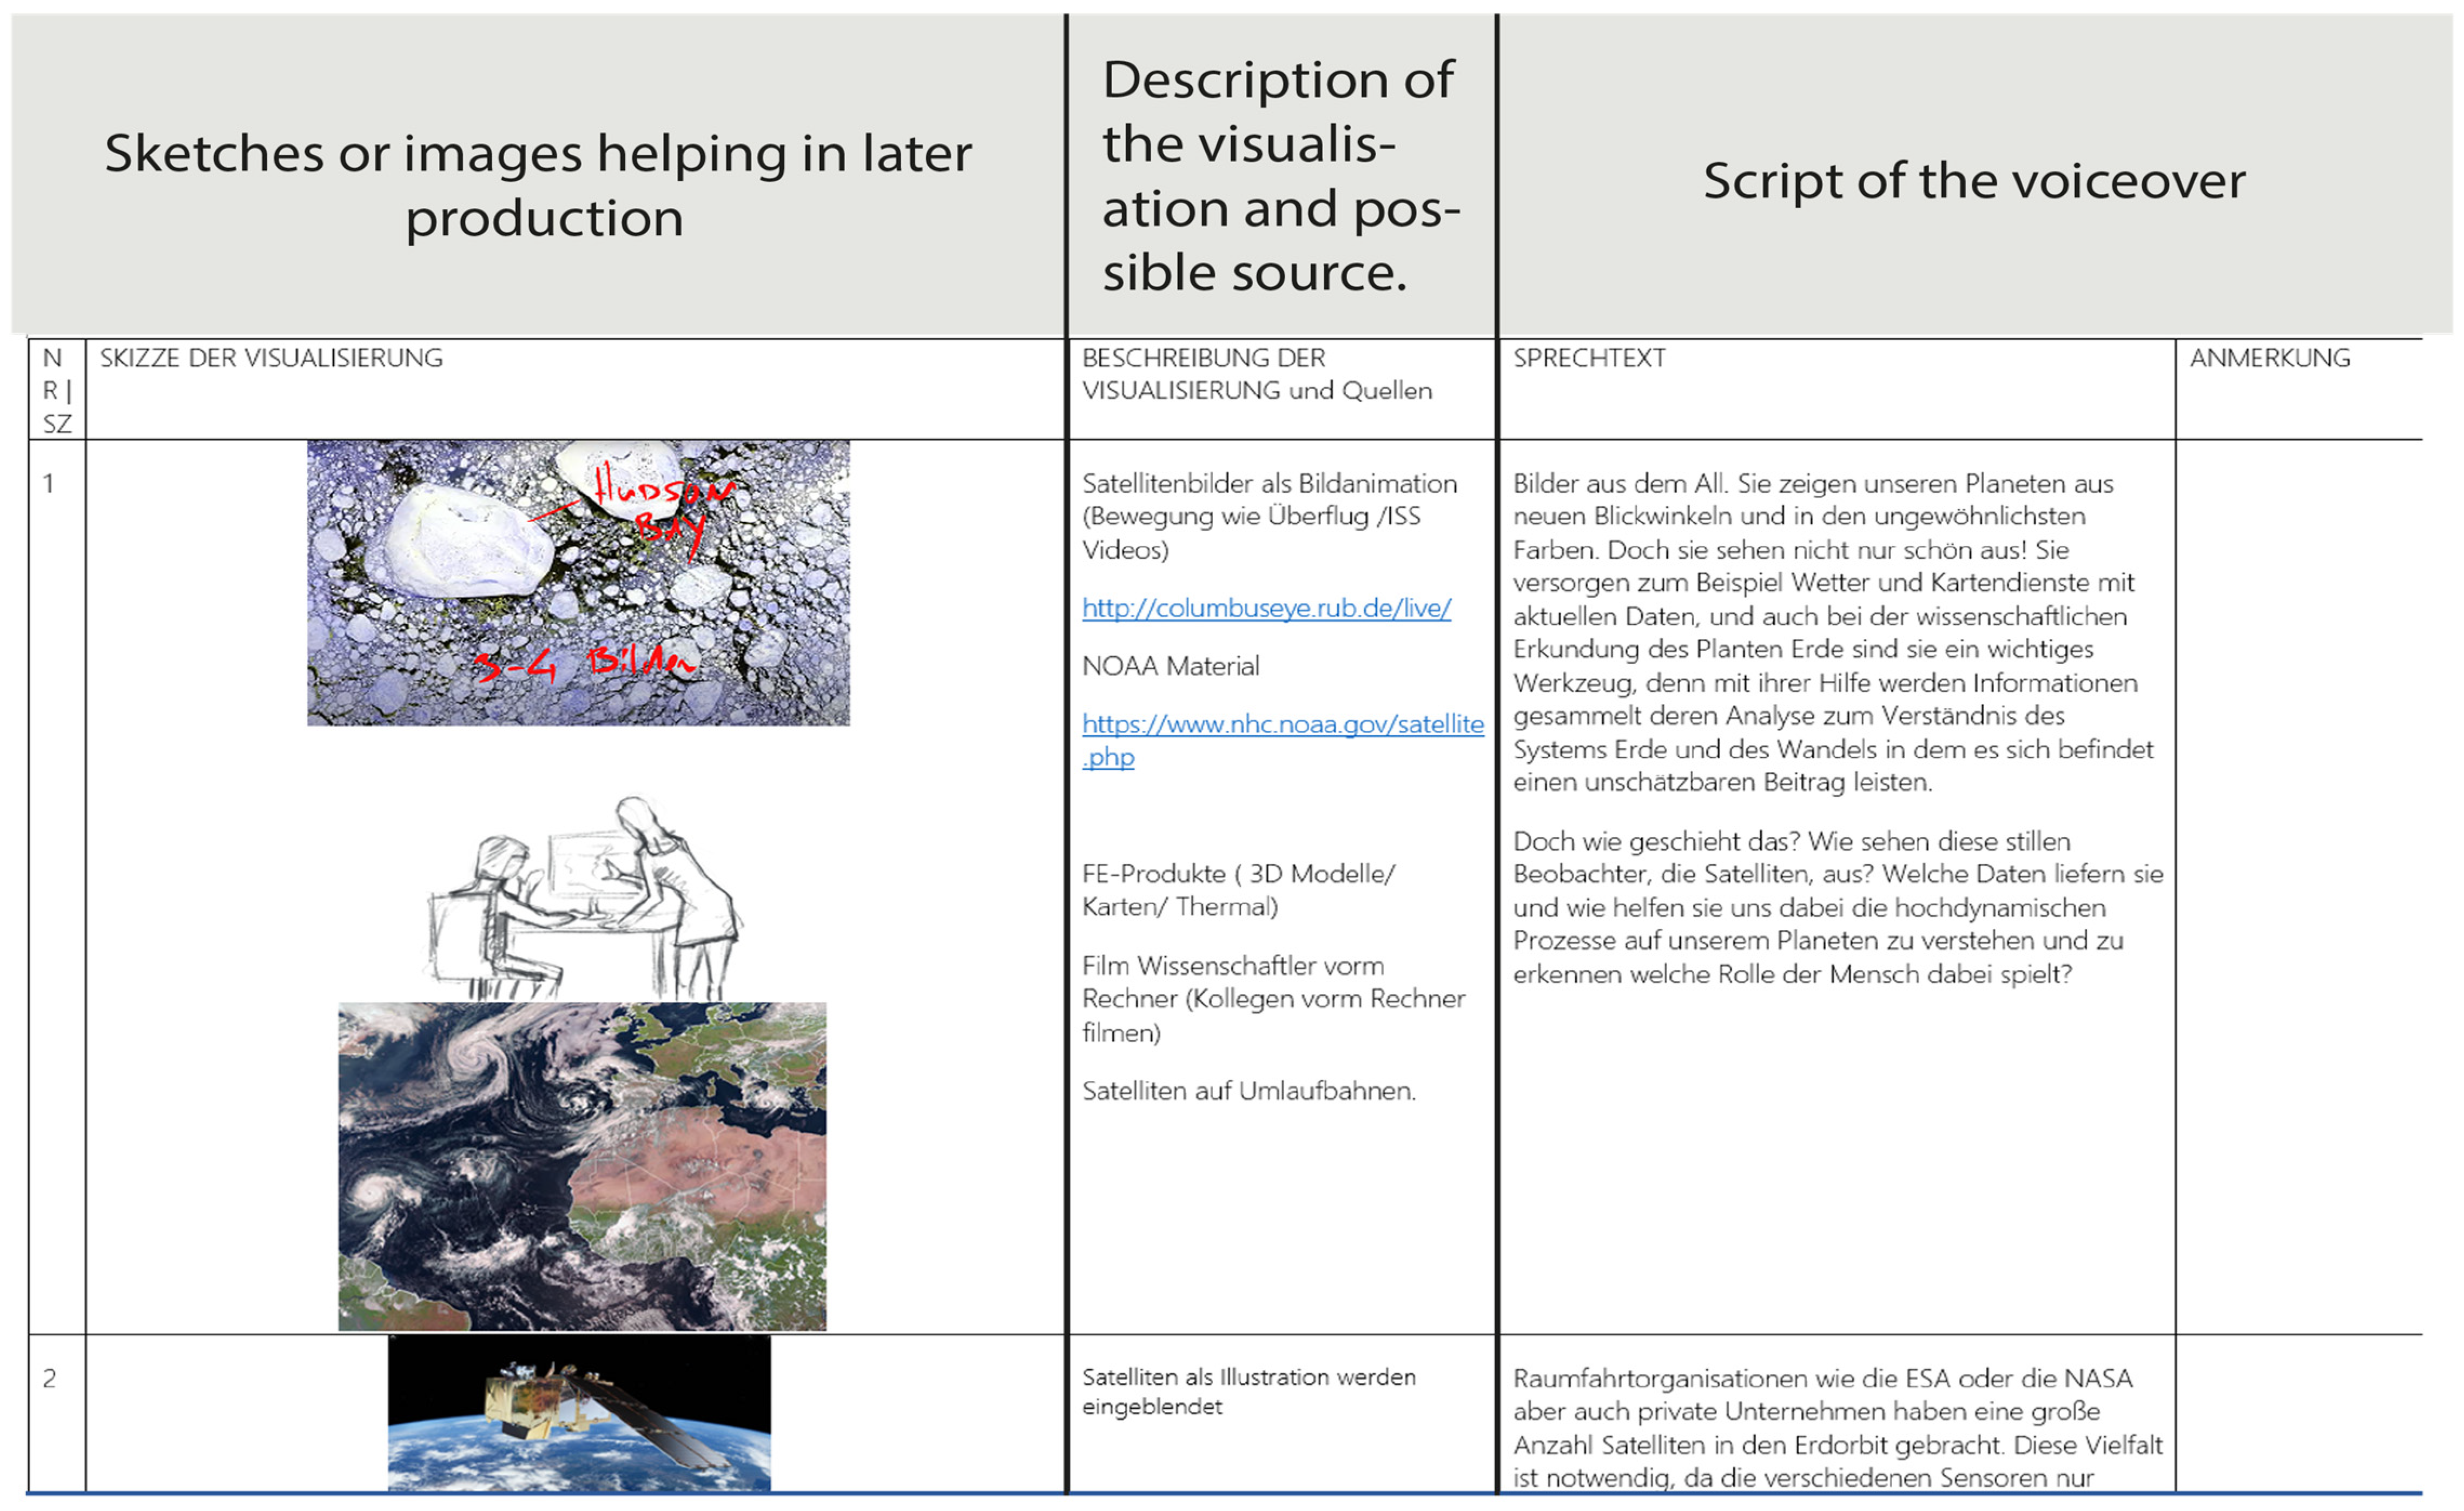
The Storyboard is a crucial part of the production process. It is the foundation upon which the whole process afterward is built and where the video content is decided, and it should only be subject to small changes thereafter. The text for the voiceover is the core of the storyboard. It dictates the visualization that is planned accordingly and is split into purposeful sequences.
The length of the video was set here by aiming for a maximum word count of 800–900 for the script resulting in 5–7 min of video. We also decided what kind of content was included or not. This is where the coherence principle is applied in a planning stage before even the first visualization is produced. Carefully reiterating over the storyboard helps to focus on relevant content and “weed out” any distracting information. The way the storyboard was created is shown in
Figure 1.
The planning of the visualization is also an important part of this phase. Deciding what kind of animations, images, or videos work together with the voice to transport the information as best as possible can have a great influence on the efficiency of the final product. It also has to be decided where the visual material comes from. Most of the visual materials used in the videos fall into one of the categories shown in
Table 3. Those categories offered the most freedom in terms of visualization. Self-produced animations are by far the most time-consuming part of the whole production process but can be tailored to the exact needs of the script and must also not be subject to copyright issues. Combining already produced animations or even self-produced videos helps to tailor them more accurately to the topics that were established in the storyboard.
2.1.3. Audio
As indicated by the modality principle, spoken text is beneficial for educational multimedia material [
21]. Reasonably good equipment (Rhode NT-USB, Sydney, Australia) was used, and the speakers underwent some basic training on how to record and post-produce audio. The audio was recorded before the visuals were produced so that the pacing of the animations would be temporally matched according to the principle of temporal contiguity [
25].
2.1.4. Animation
The sequences that were defined in the storyboard were visualized using the software Adobe after Effects CC 2020. In some cases, 3D animations were also used, which were created in Blender modelling and animation software. While many of the decisions on how the work in this phase is carried out were already made in the storyboard stage, the different principles as well as the efforts to reduce the extrinsic cognitive load are of the highest relevance and are addressed here.
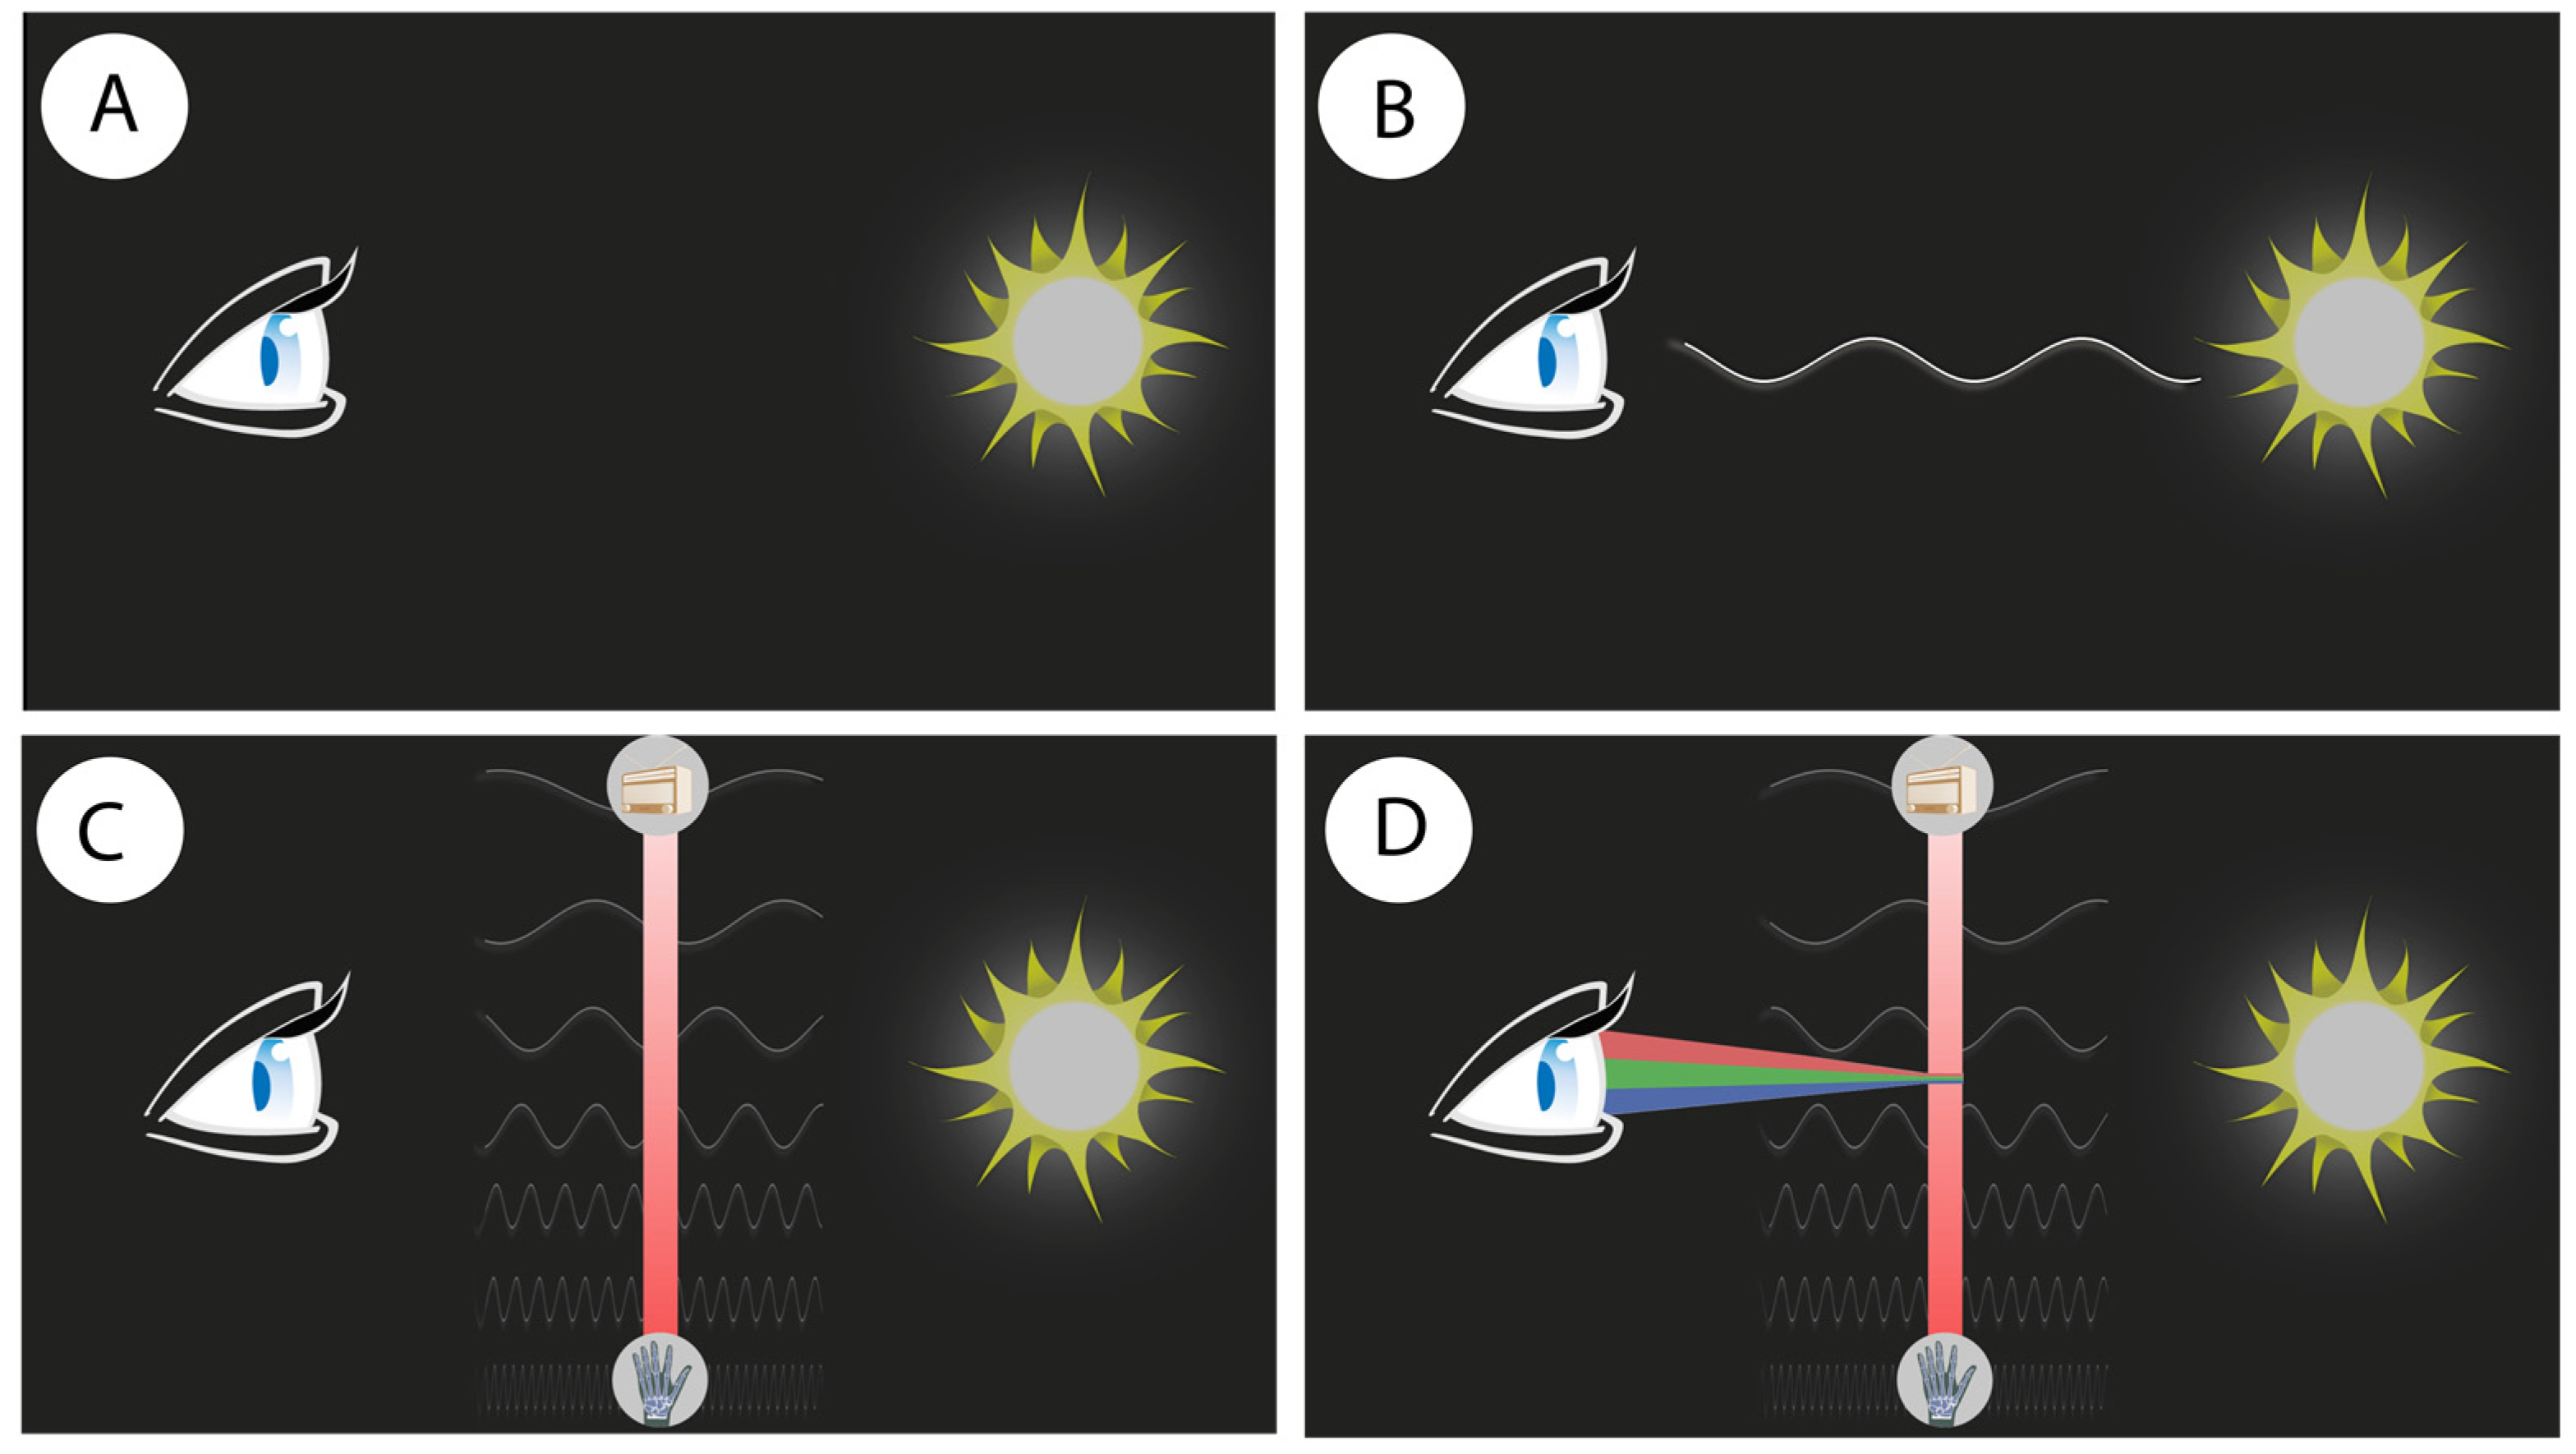
Coherence is the main principle that permeates every step of the production process. In visual terms, it is implemented by showing only necessary graphics that are addressed in the voiceover. This works in strong conjunction with sequencing and temporal contiguity, by letting new graphics and information appear when needed and in synchronization with the voiceover, which is illustrated in
Figure 2.
2.2. Experimental Setup
While it is interesting to test whether a learning material is effective at all, it is important to compare different forms of teaching materials to elaborate if a learning effect can be attributed to a specific agent or not. The experimental setup was carried out online due to COVID-19 governmental restrictions. The target groups were pupils of grade 12–13 in German high schools as well as first semester university students of geography that had not yet participated in GIS or remote sensing lessons. The videos used can be accessed via the links in the
Supplementary Materials section of this paper.
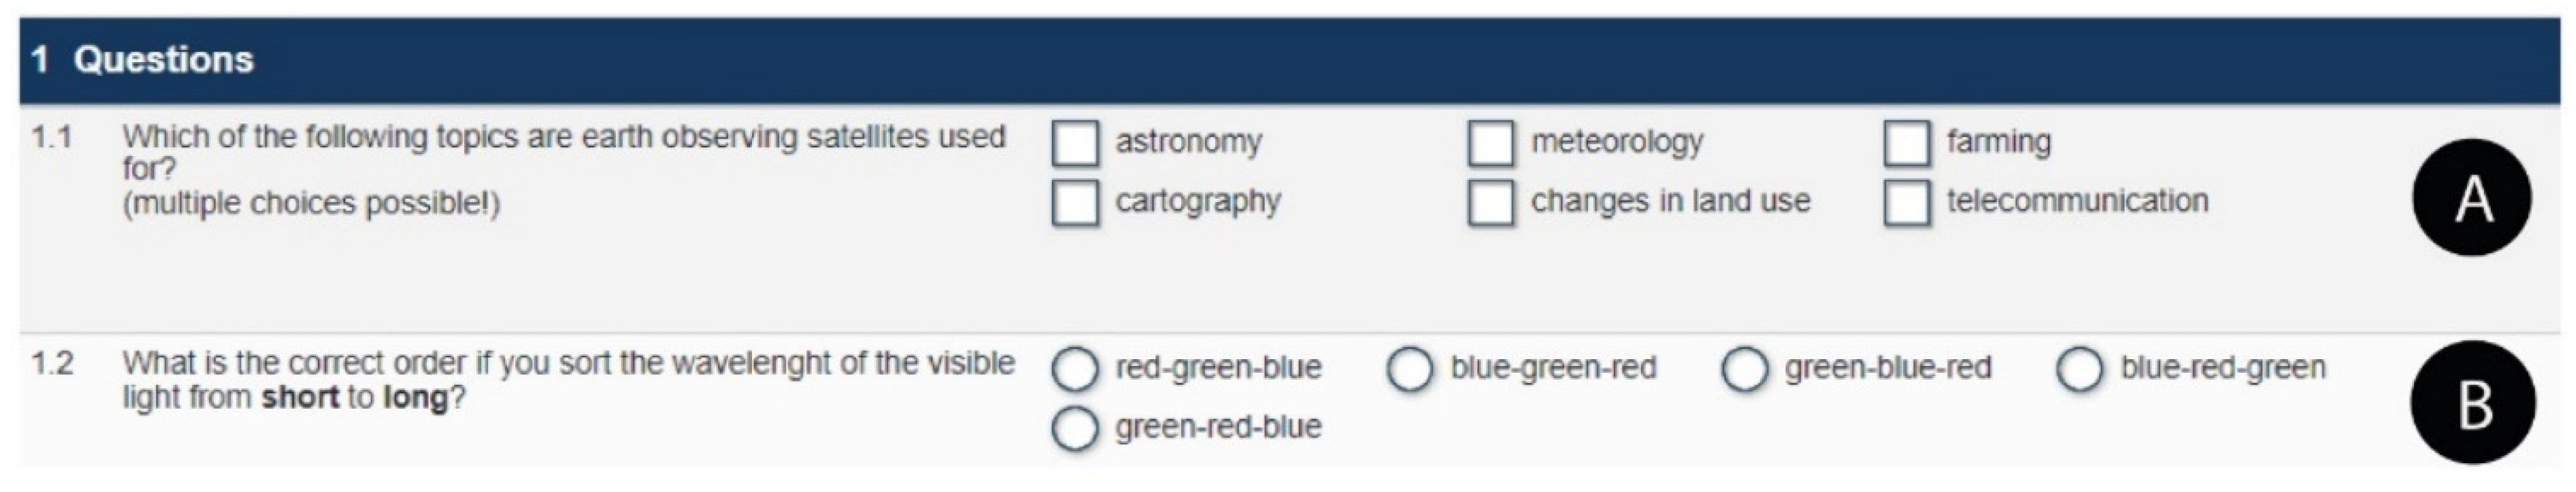
The online survey platform EvaSys was used to administer a pre-test of 12 questions regarding basic remote sensing knowledge in the form of multiple or single-choice questions. Participants were also asked to assess their pre-knowledge of earth observation. All questions were evaluated and tested by a selected group of students as well experts involved in teaching remote sensing to ensure reliability. The difficulty of the questions was reflected in a weighted score where more basic questions scored lower than questions that required a more in depth understanding of the content presented in the videos (cf.
Figure 3).
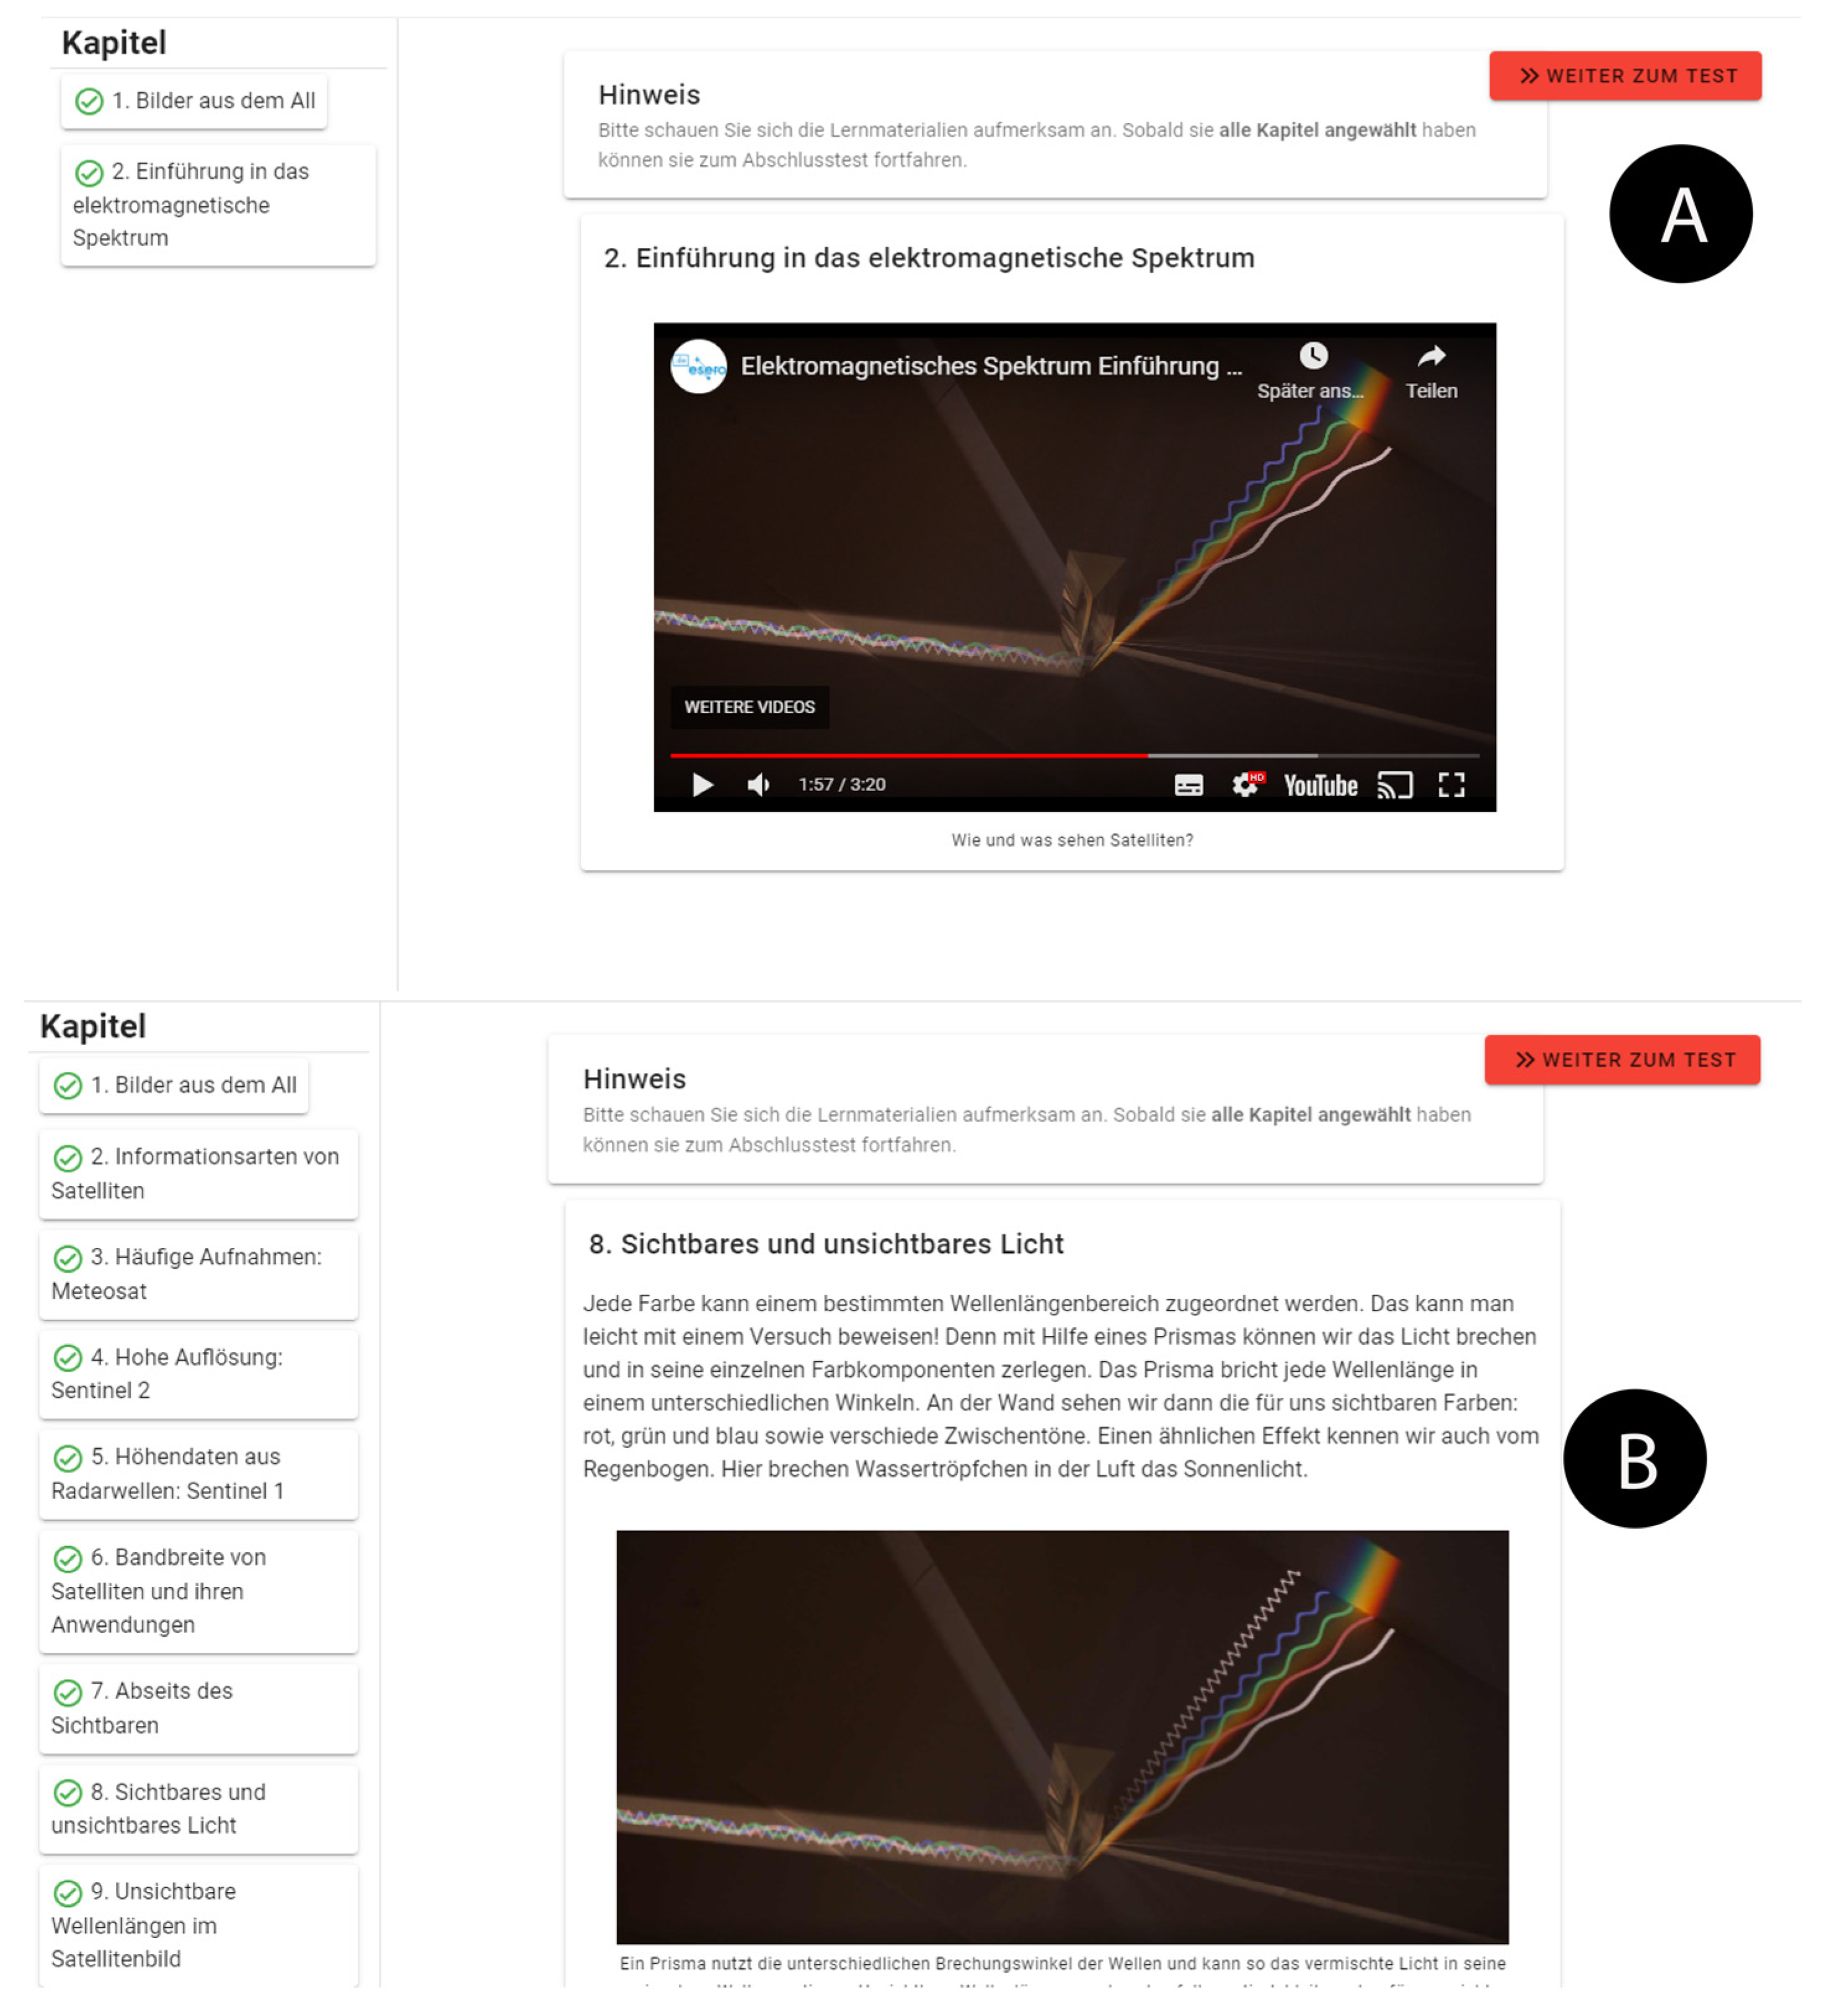
After completing the pre-test, the participants were redirected to a website that was specifically created to randomly present two videos or a text and illustration version of the content separated into chapters.
According to Clarke [
26], in test setups for multimedia learning, a comparison group should be treated to a “low tech” alternative method. For an adequate test, this group should be offered the same benefits and content as the test group except for the agent—which, in our case, is the video itself. For that reason, the text and illustration version was presented in the same style and environment as the videos. The text was a slightly modified version of the storyboard script of the videos, and the illustrations were created out of screenshots from the videos. In this way, both materials were the same in terms of content as well as the environment that the content was presented in as can be seen in
Figure 4.
The website detected whether the participants interacted with all chapters, and a display button would appear allowing them to continue to the post-test. All the questions from the pre-test were asked again as well as questions to determine what material they were exposed to. According to Ary et al. [
27], the experimental setup could be characterized as a “Randomized Subjects, pre-test-Post-test Control Group Design” with either text and illustration or video as treatment.
2.3. Statistical Methods Applied
Before both materials can be compared, it is necessary to ensure that they function at all. To test this, a t-test was run on the pre-test and the post-test scores of both groups to indicate the significance of the result. After confirming that both types of instruction had an effect on the respective group, methods for comparing those groups were applied.
For analysing pre and post-test data in educational studies, there are different methods suggested by the literature. A common method used is the gain score analysis. Here, the difference between the pre-test and post-test for each participant is calculated and averaged for both the test and control group. This average gain can then be compared by subtracting the post-test mean gain value of the comparison group from that of the test group. A
t-test run on the post-test scores of both groups then can be used to control for the statistical significance of this result [
27,
28].
Alternatively, a one-way Analysis of Covariance (ANOVA) can be used to determine whether the means of the gain scores of the groups have significant differences in the outcomes of both groups. The average gain scores of the groups can then be compared to determine which group scored higher. A third approach is to use an analysis of covariance (ANCOVA) where the post-test results are used as the dependent variable and the pre-test results are used as a covariate to correct for initial group differences.
In practice, the gain score analysis as well as ANCOVA are widely used [
29] in educational research but are subject to a decades-long and ongoing discussion amongst scientists as, in certain situations, the methods can yield contradicting results, a phenomenon that is referred to as the “Lord’s Paradox” [
30] stating that, if one method points to a significant difference between the test group and comparison group and the other does not, only one of them can be right.
While gain scores offer a more readable result by showing an effect size for each student, e.g., grades improved over time of a whole treatment, ANCOVA offers the statistical significance of treatment. Generally, the literature favours ANCOVA but also indicates that the research questions are slightly different for each. The gain score analysis answers the question of whether the change group mean of individual gains from pre to post-test differs significantly, while the ANCOVA “addresses the question of whether an individual belonging to one group is expected to change more (or less) than an individual belonging to the other group, given that they have the same baseline response” [
31] (p. 124).
Adapted for this research, this means: If all individual pre-test results would be on the same level, does the method of instruction make a difference? While being slightly different, both answer the question of whether the learning material is effective or not. Köhler et al. argue that, when it comes to answering the question if a certain type of instruction is more effective than the other, the difference is artificial, and “the question is identical” [
32] (p. 8).
If the group assignment is randomized, as in this study, there should not be any differences and gain scores, and ANCOVA should report comparable outcomes [
30]. However, if two methods could potentially give a contradicting answer to the same question, we argue that it is necessary to apply both methods to see whether the “Lords Paradox” applies and, if so, make a sound decision based on the data regarding which method gives the more reliable answer. For this reason, gain score analysis in conjunction with a one-way ANOVA as well as an ANCOVA with the pre-test results as a covariate were used for data analysis.
3. Results
3.1. Treatment Efficiency
A t-test run on the pre-test and post-test results of the video group showed a significant difference (F = (1.25), p = 0.00). A t-test was admitted on pre-test and post-test results of the text/illustration group and indicated a significant difference (F = (1.29), p = 0.00).
3.2. Assumptions for ANOVA and ANCOVA
Before methods can be applied the data has to fulfil several conditions that are tested hereafter. The assumptions of normality for the applicability of both ANOVA and ANCOVA were met according to the Shapiro–Wilk as well as Kolmogorov–Smirnov test with the results being not significant (cf.
Table 4).
The gain scores violate the assumption homogeneity of variances for ANOVA according to Levene’s test reporting a significant result (F = 4.045, p = 0.049) making a robust Welsh test on gain scores necessary. The homogeneity of regression slopes as a prerequisite for ANCOVA was tested by calculating the variable interaction of the covariate, i.e., the pre-test and the dependent variable, i.e., the video or text group was found to be not significant (group * pre-test: p = 0.206); therefore, homogeneity can be assumed.
3.3. Gain Score and ANCOVA Results
Table 5 shows a difference in the mean gain scores for the video and the text/illustration group indicating that the video group benefited more from the instruction than the text group.
To test if the gain scores differ significantly for each of the groups, a one-way ANOVA was conducted using the group membership as the independent variable and gain scores as the dependent variable. If, as stated in
Section 3.1, the homogeneity of variances is violated, suggesting the application of a Welsh
t-test that is robust against inequality of variances [
33]
The one-way ANOVA showed a significant difference between the group gain score means (F (1.54) = 5.65, p = 0.021). The additional Welsh t-test supported this result (p = 0.024). To evaluate whether the groups differ under the assumption of baseline equality an ANCOVA was applied. The results showed no significant difference in the video and text/illustration group (F (1.53) = 3.342, p = 0.073).
4. Discussion
The results showed a discrepancy in the outcomes of the gain score analysis using ANOVA and the ANCOVA making it necessary to decide which one is right.
The strength of ANCOVA is to correct for group differences on baseline by removing the variance from the post-test that can be explained by the pre-test. The residual variation then reflects the change from the pre-test [
34]. The danger lies in overcorrecting natural occurring group differences, like “male” and “female” or non-randomized or self-selected groups that would introduce a new bias and distort the outcome [
30]. The randomized selection of groups in this study averts this effect. However, the different outcomes may point to some unknown bias that might have been introduced by coincidence or test design that might be contributed to the online setup where some factors could not be controlled as rigorously as in a traditional experimental setting. While it remains unclear how this bias was introduced, the data shows how it is expressed.
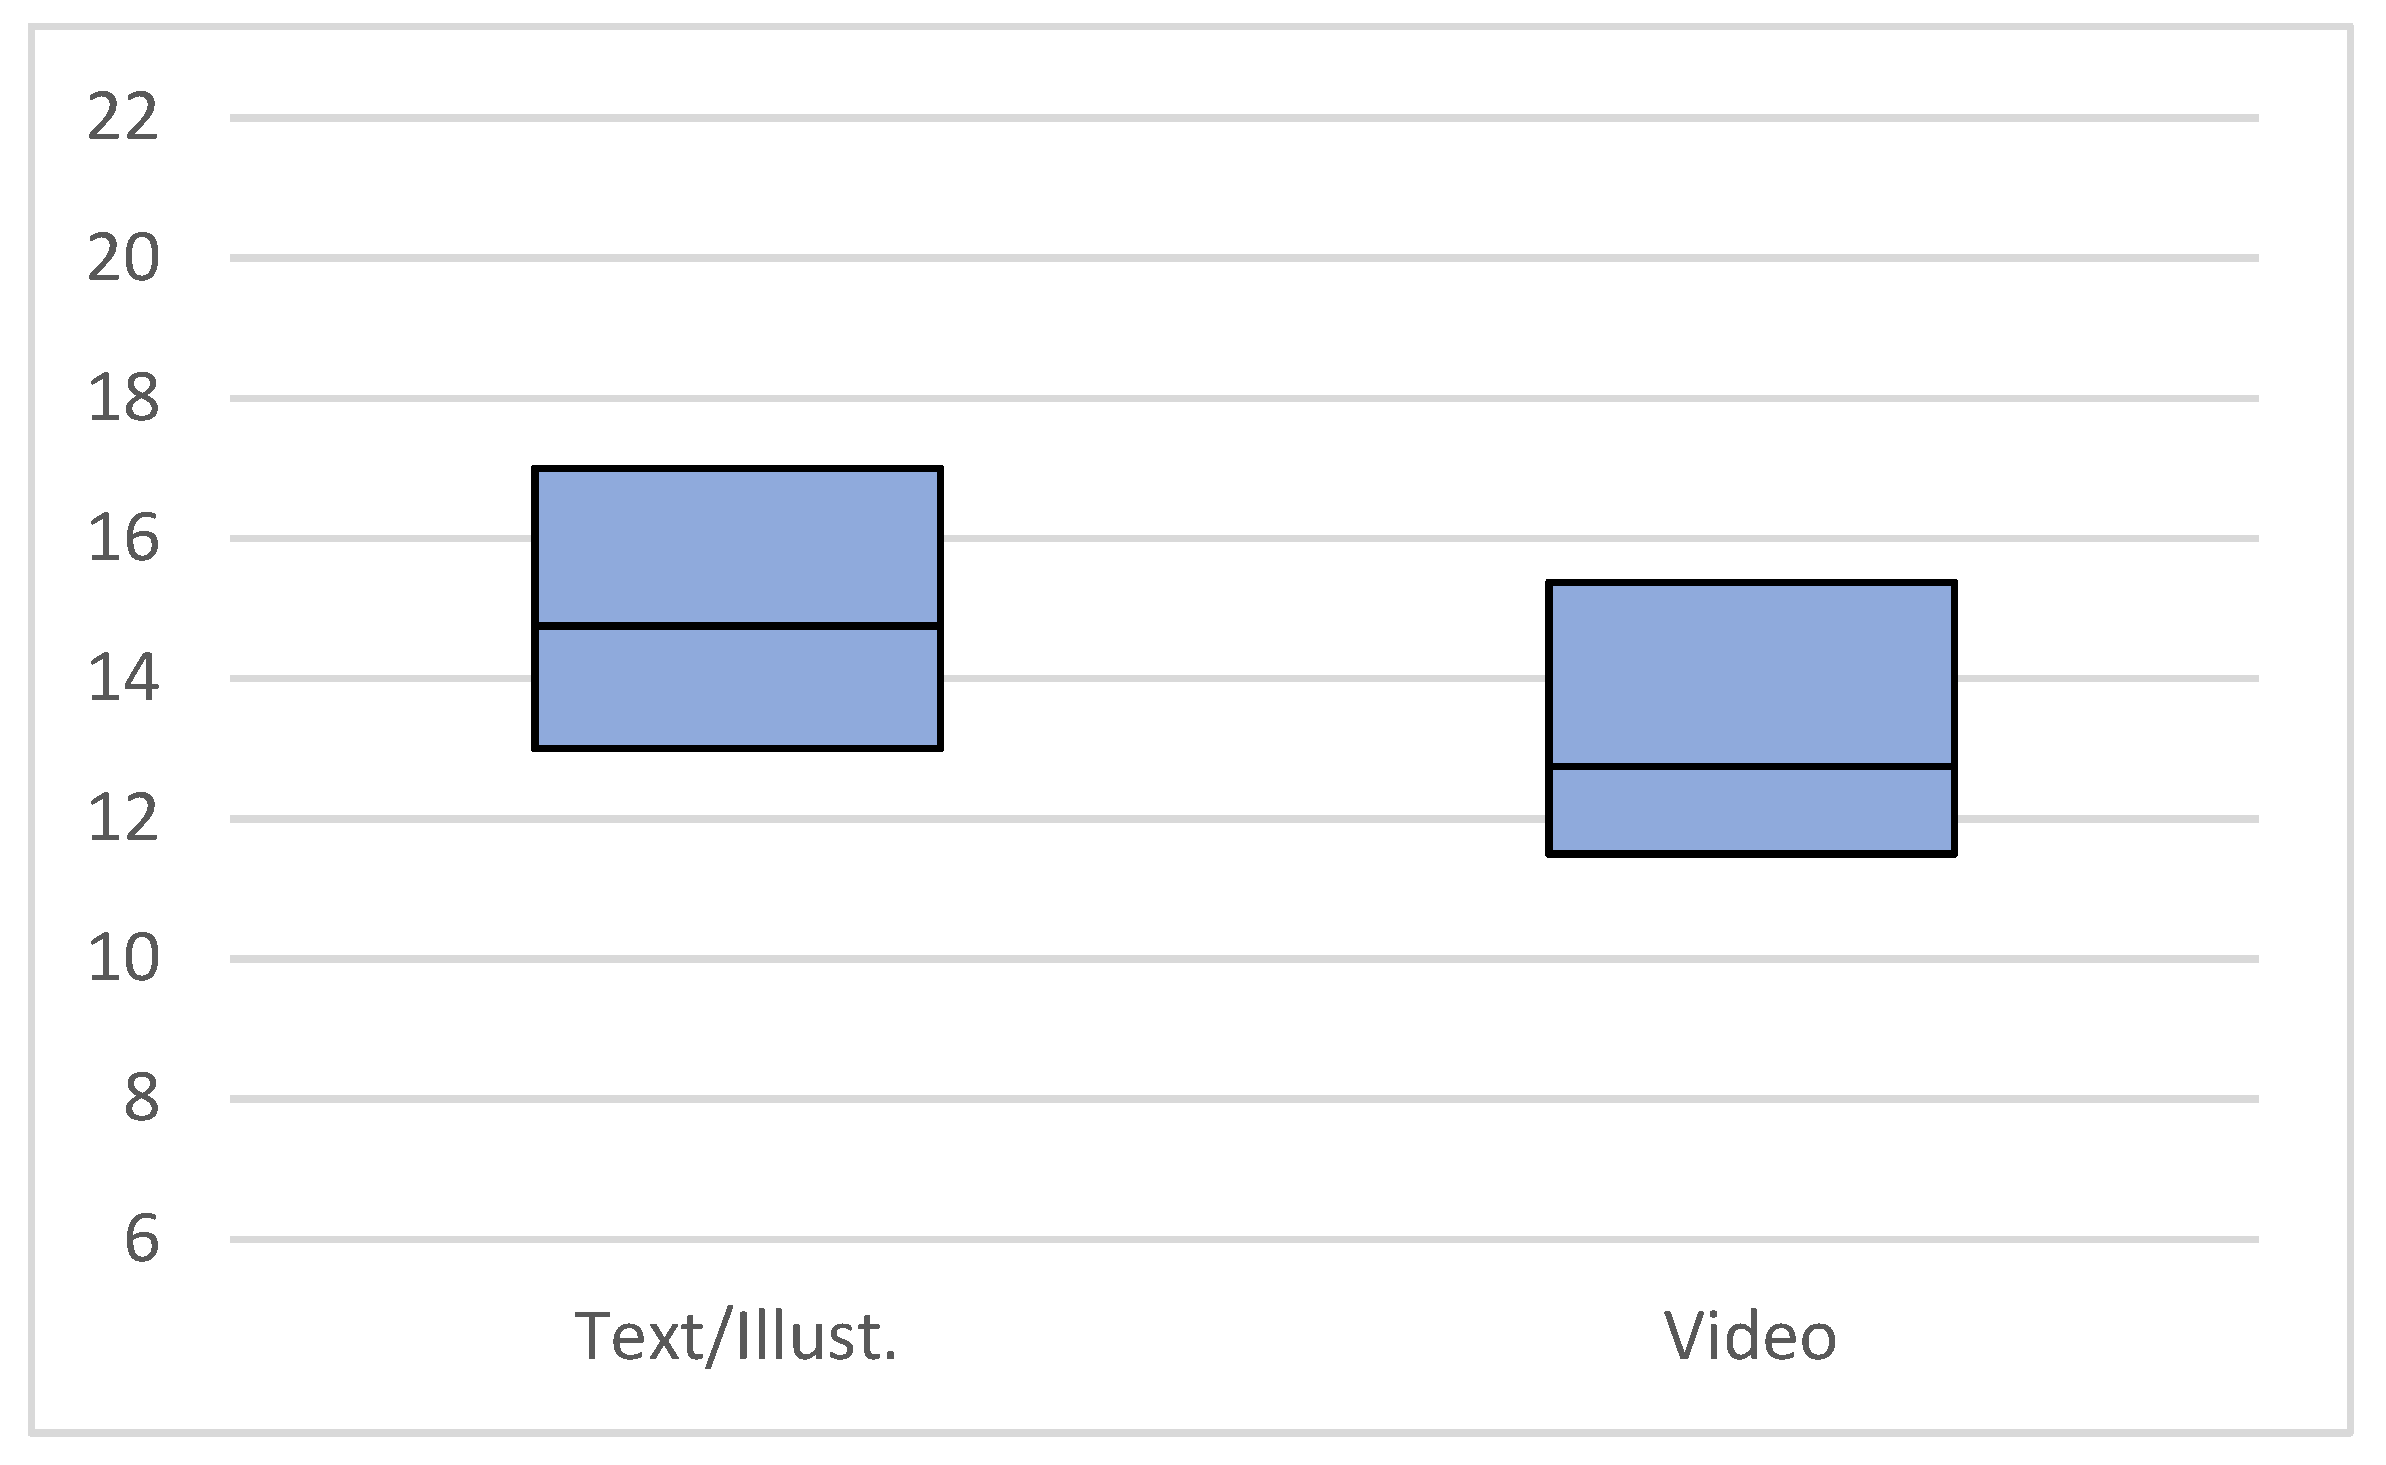
In looking at the pre-test scores of both groups, the mean score for the comparison group at 14.03 was higher than the score of the test group at 13.08. The boxplot (cf.
Figure 5) of the pre-test data also clearly shows the higher median (video = 12.25; text/illustration = 14.75) and higher positioning of the interquartile range of the text/illustration group.
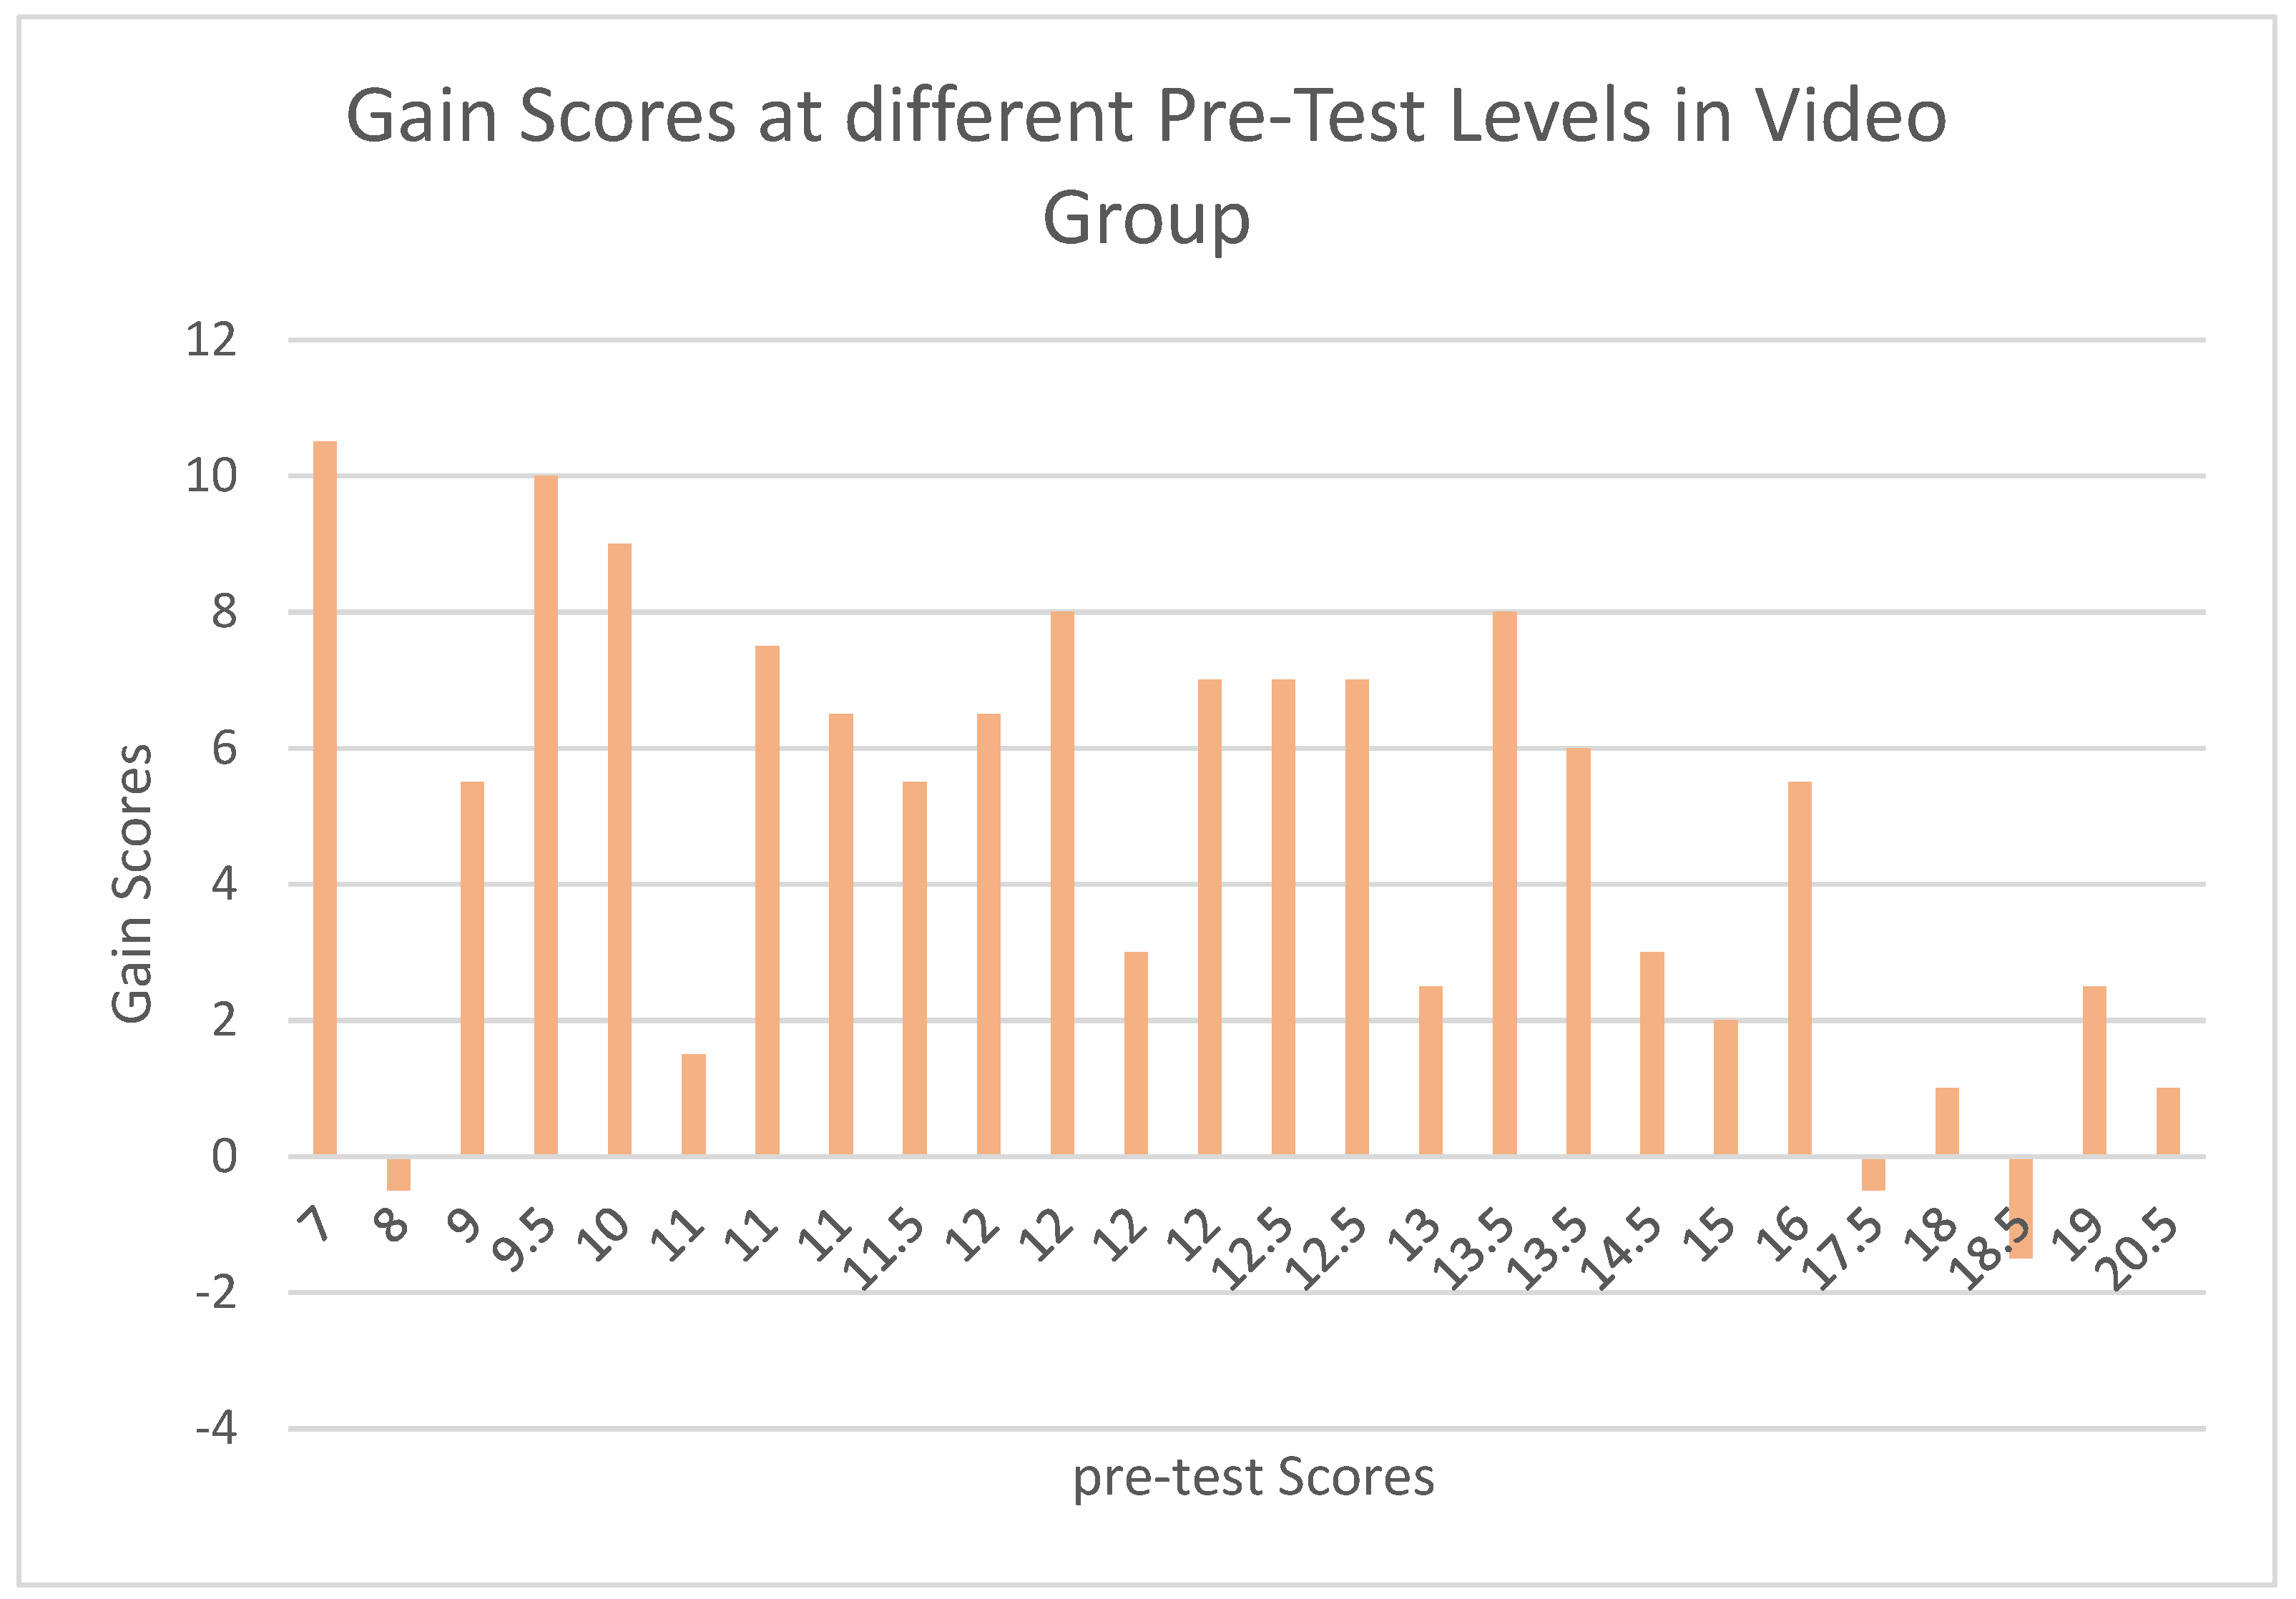
The potential gain that could occur was higher for the group that scored lower on the pre-test—in this case, the video group. A ceiling effect occurs that limits the gain for the group that scored higher on the pre-test.
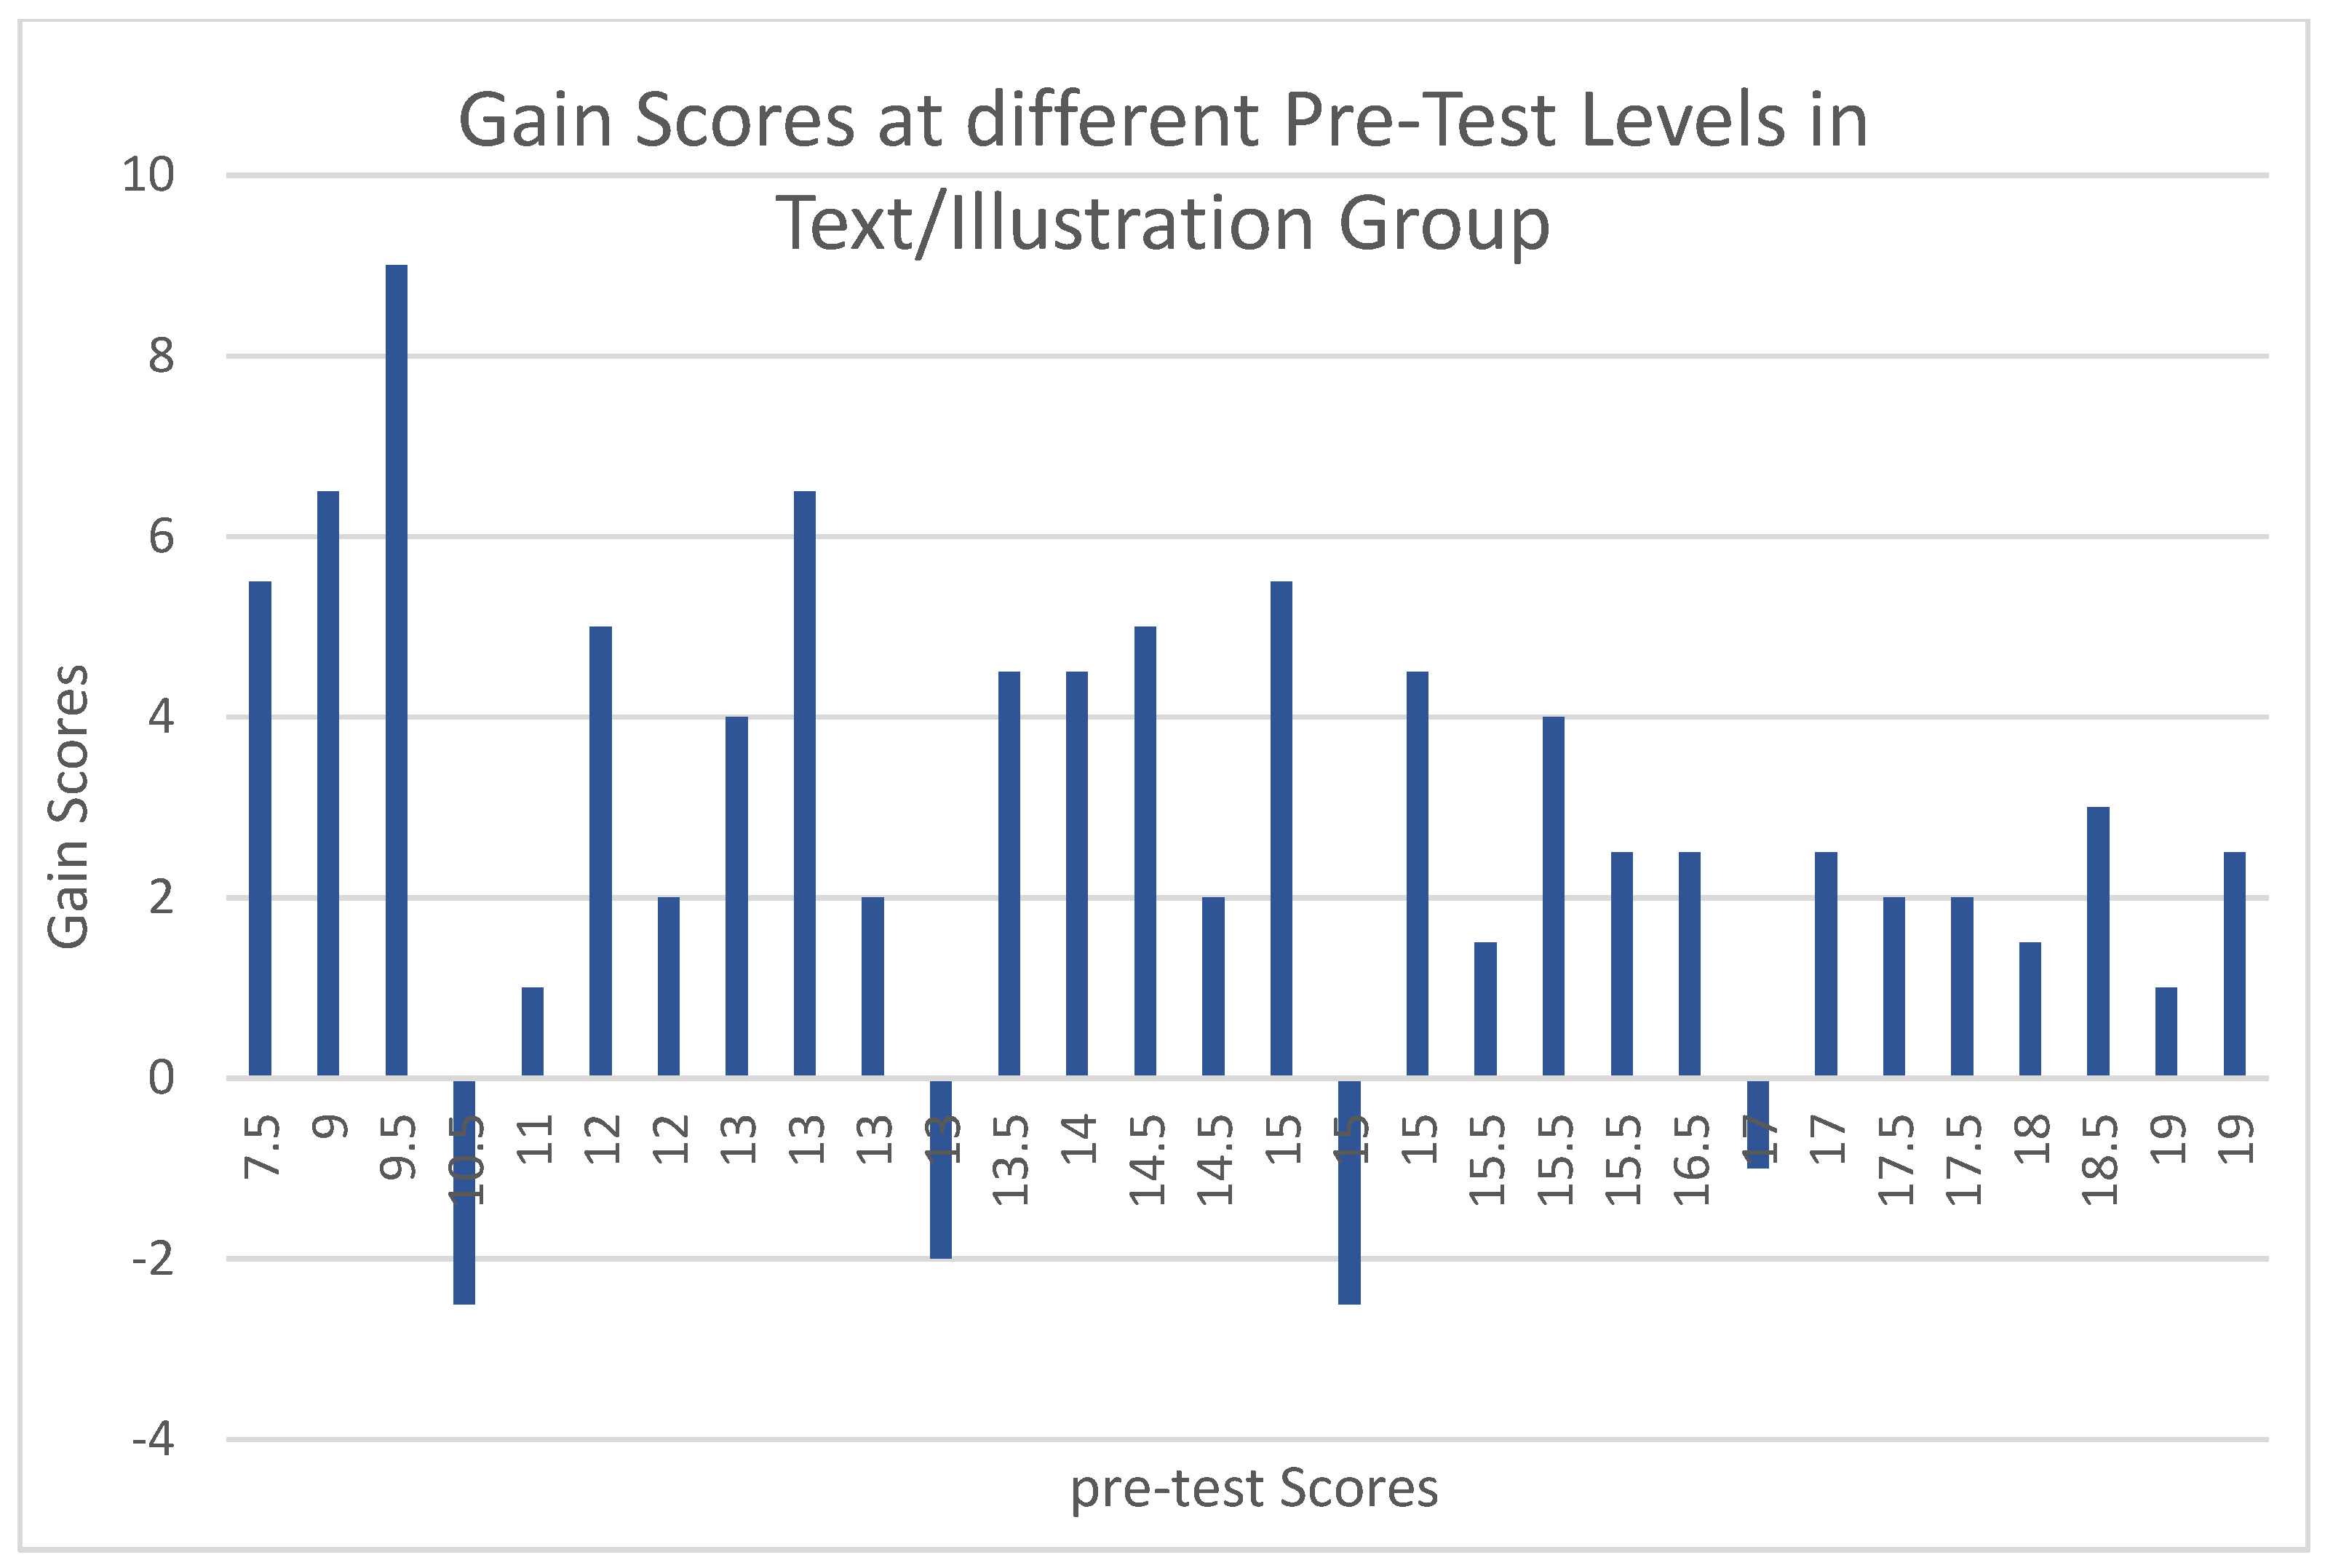
Figure 6 illustrates this by plotting the gain scores of the participants against their respective pre-test scores showing that participants who achieved a low-test score in the pre-test indeed contributed more to the general gain than those who achieved a high pre-test score.
This inequality of groups in the pre-test has a high possibility of influencing the outcome if gain scores for the analysis are used. By introducing the pre-test scores as a covariate in an analysis of covariance, this potential bias was levelled, and the results of the analysis of the ANCOVA are considered relevant for this study. Thus, the H0 for this study: “Participants, when sharing the same pre-test score, improve at the same rate when learning with video or text and illustration-based material”, was not rejected.
The videos produced for this study followed scientifically established guidelines for learning media production and adapted them to remote sensing where necessary as presented in
Section 3. Yet, the outcome of the experiment does not support the idea of videos being a more effective learning material than a more traditional combination of text and illustration. As mentioned in the introduction, this might not be a surprise, as other studies also presented similar results. Before coming to the harsh conclusion that the production effort for learning videos is wasted, several factors should be considered.
4.1. Similarity of the Material
As mentioned in
Section 2, this study went to great lengths to make the content equally appealing for both groups. Thus, the effort that went into, e.g., creating concise language, was the same for both materials. The illustrations were directly derived from the video content; therefore, they visually supported the learning content in the same way the videos did except for the animation, which was intentional as explained in
Section 2 and enabled us to single out the video as an agent that could be tested for efficiency. This is a necessary step to ensure the validity of the test instrument, but when comparing two similar effective methods, it would be surprising if one group had performed better to a high degree.
4.2. Topics and Ceiling Effects
As shown in the results, both materials succeeded at covering the topics, raising the mean of the outcome score from 14.38 to 17.20 out of 21.5 in the case of the text and illustration group and 13.07 to 17.82 out of 21.5 for the video group. Even though both groups changed significantly in the end, there was little room for more improvement, and the statistical ceiling effect when approaching the maximum of the possible scores might be in play.
Here, the selection of topics, which were merely introductory, might be a factor. We considered remote sensing to be a relatively new topic to the participants. This is reflected in a question in the pre-test where the students were asked to rate their previous knowledge of remote sensing on a scale from “1: I know a lot” to “6: I know little”. The mean of this rating was 4 for both groups; thus, they rated themselves quite low on average. The pre-test results on the other side while improving significantly in the post-test were quite high from the beginning.
Earth observation knowledge at this level consists of some topics that are taught in other contexts in schools, such as the electromagnetic spectrum. Other questions might be answered correctly by common sense and general knowledge. In particular, the first of the two videos conveyed more basic topics. Therefore, there is the possibility that the advantages of animation and video did not have the chance to fully play out, and a more advanced choice of topics could have yielded different results.
4.3. Motivation
Looking at the gain scores in
Figure 6 for the text/illustration group, a few cases are visible where the gain was negative, meaning that the post-test score was lower than the pre-test score. This is also visible in the video group, but mainly at the upper end of the scale where this can be expected since the margin of error here is lower. In the text/illustration group, this loss of gain was more severe and spread more evenly. A possible explanation could be a form of subject attrition that, in long-term or demanding studies, would cause participants to leave the study [
27].
In this case, it might be that some subjects became more careless regarding their answers because of the nature of the material. The few observed cases are not sufficient to verify this hypothesis; however, it might be worthwhile investigating in the future. During the online test, it was observed that 22 participants that took the pre-test never continued to the post-test. Unfortunately, there is no way of determining whether those dropouts came from the video or text/illustration group.
5. Conclusions
We showed that the production process described in
Section 2 led to successful learning material. While there might be other situations where video would be more effective, it is also worth discussing why this should be the case and if this is the most important point. The format in itself offers a great deal of advantages over just plain text and illustrations. Most importantly, there are multiple methods of dissemination and implementation. As already mentioned, aside from numerous video-hosting platforms, they can be integrated into MOOC’s or other learning environments.
From July 2020, the videos have been available on YouTube (
https://www.youtube.com/channel/UCD2r8sDqvEs23YQKfrOYJxw, accessed on 4 October 2021) where they have gathered several thousand views. They are primarily in German, but some, including the videos used for this study, are also available in English or with English subtitles. They have also been used in seminars, lessons, and presentations either as a way of preparing for a lecture or in the lecture itself. Parts of the videos are being integrated into MOOC’S on earth observation. It is difficult to imagine another teaching material that offers this kind of versatility.
The versatility and the range of possibilities of integrating content in learning videos come at the price of high complexity regarding the tools as well as the workflow used in the creation process. Planning, writing, and, in particular, animating this kind of video is a time-consuming and costly process that also involves specialized software that often has a steep learning curve. Making instructional animations reasonably appealing is a craft that has to be trained before good results can be achieved.
On the other hand, studies found that the production value is not always connected to successful learning with video [
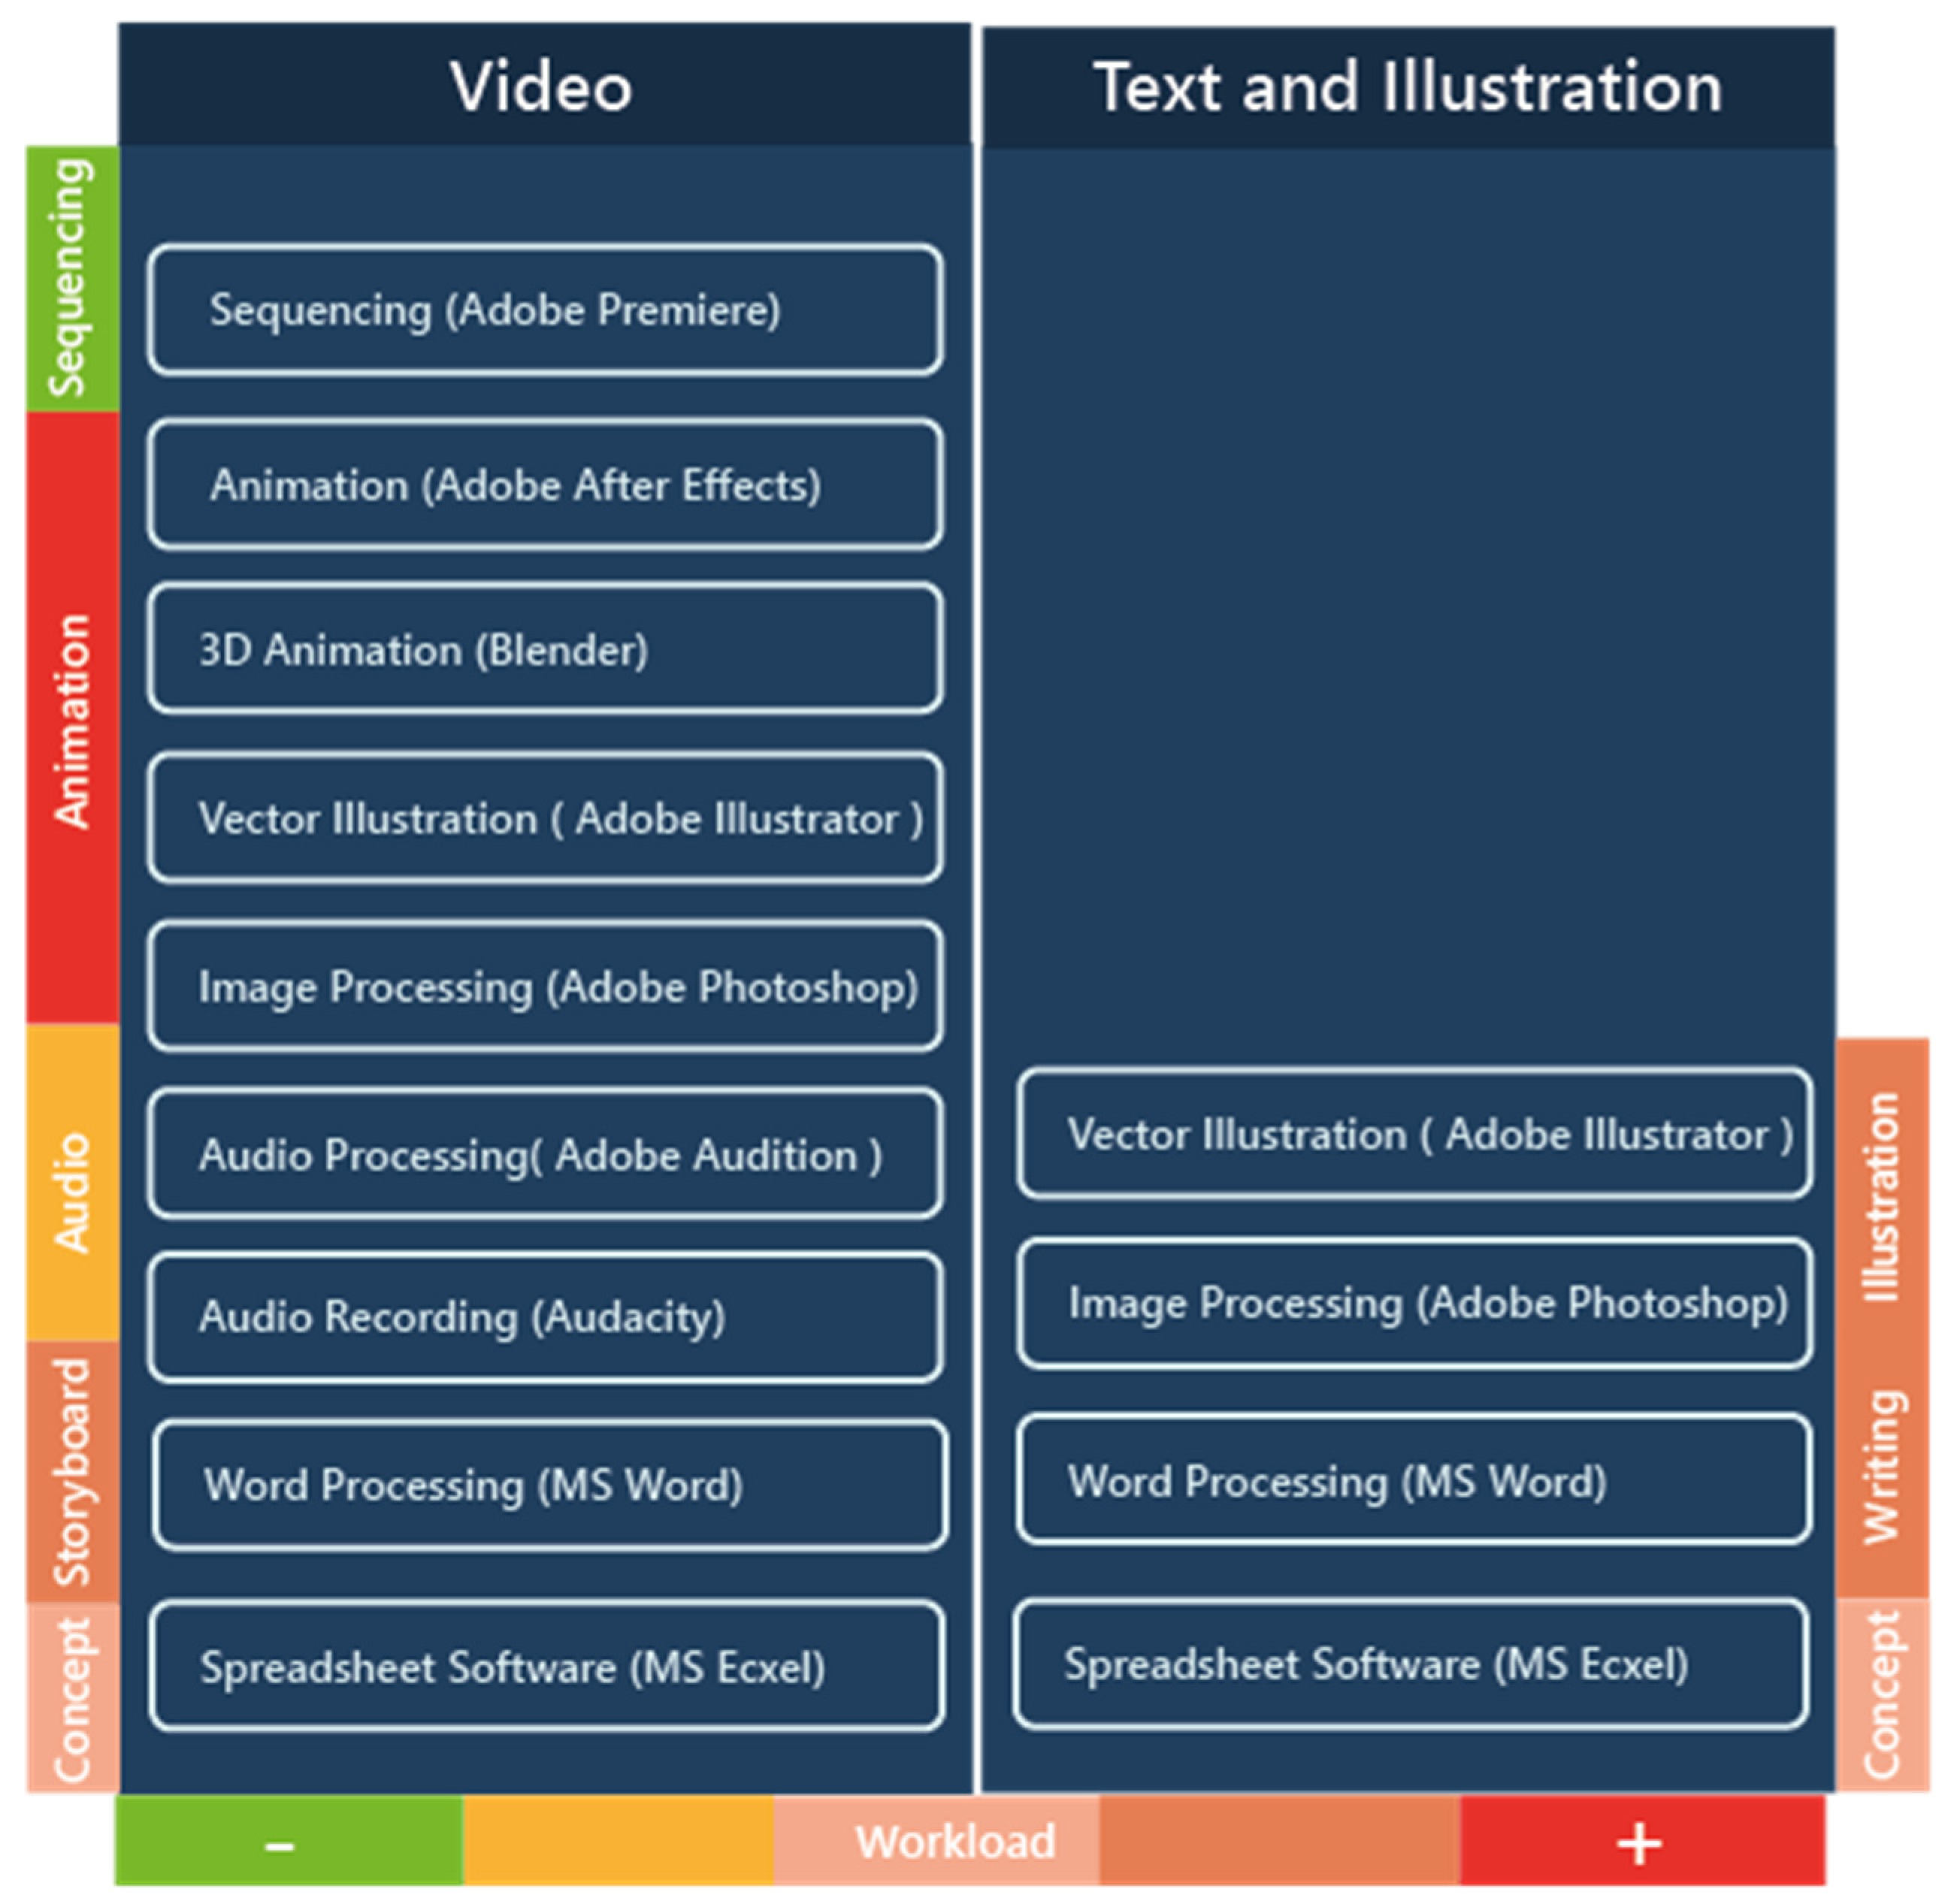
16]. Thus, it might be worth considering if time and costs are always well invested. The time invested in producing the videos was not tracked nor can it be compared to the text and illustration since the material was not produced on its own but is based on the videos.
To illustrate the significant difference in production effort,
Figure 7 shows the software stack that was used to produce the materials as well as an estimation of the workload involved in each step of the process.
Connected with these possibilities are a range of mistakes that can be made that may lead to less effective teaching materials. The established workflow along the lines of research in media-based instruction presented in this paper proved to be applicable and yielded videos that can be efficiently used in a variety of e-learning and teaching situations. In the light of the results of this research that showed no significant difference between the video and the text/illustration group, it is also important to point out that, before the substantial effort of creating videos of a high production value is made it is necessary to consider the future field of application for the learning resource.
If, for example, a topic contains information that is prone to updates, one should consider that it is far more time consuming to change content of a video than to change information in text or figure. On the other hand, if the topic is quite fundamental and may be part of a curriculum that is taught over and over again, it is maybe worth considering investing the extra effort. Including animation is, from our point of view, a great advantage of learning videos because this offers possibilities of showing processes that cannot be well described or visualised in another way (see
Section 1.1). This may also be achieved by integrating short, animated clips in text alongside illustrations as shown in
Figure 8. In this case, the effort of creating an animation remains, but the overhead of the whole video production is avoided.
Assessing what kind of learning video meets the requirements of the intended application is crucial since the amount of production effort may quickly become disproportional to the intended outcome. If the versatility of a video is not necessary, it is good to know that well-written and illustrated teaching material has enabled learning over centuries already and will continue to be effective in the future. However, learning with video resources in remote sensing will become more important, and finding ways of making both methods effective in consumption and efficient in production remains a challenge in which the workflow presented in this study proved to be an asset for our efforts.


