Next Issue
Volume 13, November-1
Previous Issue
Volume 13, October-1
 
 
remotesensing-logo

Journal Browser

Journal Browser

Remote Sens., Volume 13, Issue 20 (October-2 2021) – 170 articles

Cover Story (view full-size image): 
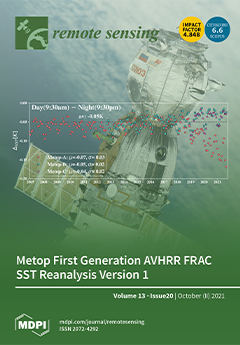
The full-mission SST dataset from 1 km AVHRR FRAC onboard three Metop First Generation (FG) satellites, Metop-A (2006-on), -B (2012-on) and -C (2018-on), is consistent across all three platforms, stable in time, and closely agrees with independent in situ data and global Level 4 analyses. Figure shows time series of global mean day minus night SST differences. From ~9:30 p.m. to ~9:30 a.m. local time, global SST cools off by ~0.05K, on average. The diurnal signal has been stable in time and consistent across all three satellites, but increased for Metop-A in recent years, after its orbit stopped being controlled in 2016 and drifted to 8 a.m./p.m. local time by 2021. This result provides a stringent quality check for the data, as day and night SSTs are derived fully independently using different bands and algorithms.View this paper
  • Issues are regarded as officially published after their release is announced to the table of contents alert mailing list.
  • You may sign up for e-mail alerts to receive table of contents of newly released issues.
  • PDF is the official format for papers published in both, html and pdf forms. To view the papers in pdf format, click on the "PDF Full-text" link, and use the free Adobe Reader to open them.
Order results
Result details
Section
Select all
Export citation of selected articles as:
14 pages, 3063 KiB  
Article
Impacts of Dam Operation on Vegetation Dynamics of Mid-Channel Bars in the Mid-Lower Yangtze River, China
by Xu Zhou, Zhaofei Wen, Yuanyang Huang, Xuemei Yi, Maohua Ma, Tao Liao and Shengjun Wu
Remote Sens. 2021, 13(20), 4190; https://doi.org/10.3390/rs13204190 - 19 Oct 2021
Cited by 3 | Viewed by 1797
Abstract
Vegetation dynamics on mid-channel bars (MCBs) is essential for supporting ecosystem functions and associated services in river systems, especially in dammed large rivers. Generally, there are two possible changing patterns that vegetation of MCBs downstream a dam would experience. On one hand, the [...] Read more.
Vegetation dynamics on mid-channel bars (MCBs) is essential for supporting ecosystem functions and associated services in river systems, especially in dammed large rivers. Generally, there are two possible changing patterns that vegetation of MCBs downstream a dam would experience. On one hand, the vegetation area may shrink because of a decrease in the MCB area in the post-dam period, which has been observed in many rivers around the world. On the other hand, the MCB vegetation area may expand because flood disturbances would be weakened by dam operation. However, little evidence has been reported to clarify such confusion. Therefore, vegetation dynamics of MCBs in the mid-lower Yangtze River downstream the Three Gorges Dam (TGD; the world’s largest dam) is selected as a case study to address the issue. Using long-term (1987–2017) Landsat archive images, this study reveals the spatiotemporal variations of vegetation area change intensities (VACIs; indicated by dynamic trends) on MCBs in the mid-lower Yangtze River. Results show that an overall VACI in the post-dam period (2003–2017) is about three times faster than that in the pre-dam period (1987–2002). In other words, the rate of vegetation colonization accelerated after the TGD operation began in 2003. Moreover, the VACIs in the post-dam period are size dependent, where large size MCBs are likely to gain higher VACIs: Small-sized MCBs (0.33 km2/yr), medium-sized MCBs (1.23 km2/yr), large-sized MCBs (1.49 km2/yr). In addition, VACIs of individual MCBs in the post-dam period are distance dependent, where the further a MCB was from the TGD, the higher the VACI. It is also suggested that the weakened flood disturbances in the post-dam could explain the rapid vegetation growth and colonization. This work is not only beneficial for managing and protecting MCBs downstream the TGD after its operation, but is also helpful in understanding vegetation dynamics of MCBs in other dammed river systems around the world. Full article
(This article belongs to the Special Issue Remote Sensing of Floodplain Rivers and Freshwater Ecosystems)
Show Figures

Figure 1

21 pages, 9406 KiB  
Article
A Method of Infrared Small Target Detection in Strong Wind Wave Backlight Conditions
by Dongdong Ma, Lili Dong and Wenhai Xu
Remote Sens. 2021, 13(20), 4189; https://doi.org/10.3390/rs13204189 - 19 Oct 2021
Cited by 2 | Viewed by 1810
Abstract
How to accurately detect small targets from the complex maritime environment has been a bottleneck problem. The strong wind-wave backlight conditions (SWWBC) is the most common situation in the process of distress target detection. In order to solve this problem, the main contribution [...] Read more.
How to accurately detect small targets from the complex maritime environment has been a bottleneck problem. The strong wind-wave backlight conditions (SWWBC) is the most common situation in the process of distress target detection. In order to solve this problem, the main contribution of this paper is to propose a small target detection method suitable for SWWBC. First of all, for the purpose of suppressing the gray value of the background, it is analyzed that some minimum points with the lowest gray value tend to gather in the interior of the small target. As the distance from the extreme point increases, the gray value of the pixel in all directions also increases by the same extent. Therefore, an inverse Gaussian difference (IGD) preprocessing method similar to the distribution of the target pixel value is proposed to suppress the uniform sea wave and intensity of the sky background. So as to achieve the purpose of background suppression. Secondly, according to the feature that the small target tends to “ellipse shape” in both horizontal and vertical directions, a multi-scale and multi-directional Gabor filter is applied to filter out interference without “ellipse shape”. Combined with the inter-scale difference (IsD) operation and iterative normalization operator to process the results of the same direction under different scales, it can further suppress the noise interference, highlight the significance of the target, and fuse the processing results to enrich the target information. Then, according to different texture feature distributions of the target and noise in the multi-scale feature fusion results, a cross-correlation (CC) algorithm is proposed to eliminate noise. Finally, according to the dispersion of the number of extreme points and the significance of the intensity of the small target compared with the sea wave and sky noise, a new peak significance remeasurement method is proposed to highlight the intensity of the target and combined with a binary method to achieve accurate target segmentation. In order to better evaluate the performance index of the proposed method, compared with current state-of-art maritime target detection technologies. The experimental results of multiple image sequence sets confirm that the proposed method has higher accuracy, lower false alarm rate, lower complexity, and higher stability. Full article
Show Figures

Graphical abstract

17 pages, 3712 KiB  
Article
Important Airborne Lidar Metrics of Canopy Structure for Estimating Snow Interception
by Micah Russell, Jan U. H. Eitel, Timothy E. Link and Carlos A. Silva
Remote Sens. 2021, 13(20), 4188; https://doi.org/10.3390/rs13204188 - 19 Oct 2021
Cited by 3 | Viewed by 2706
Abstract
Forest canopies exert significant controls over the spatial distribution of snow cover. Canopy snow interception efficiency is controlled by intrinsic processes (e.g., canopy structure), extrinsic processes (e.g., meteorological conditions), and the interaction of intrinsic-extrinsic factors (i.e., air temperature and branch stiffness). In hydrological [...] Read more.
Forest canopies exert significant controls over the spatial distribution of snow cover. Canopy snow interception efficiency is controlled by intrinsic processes (e.g., canopy structure), extrinsic processes (e.g., meteorological conditions), and the interaction of intrinsic-extrinsic factors (i.e., air temperature and branch stiffness). In hydrological models, intrinsic processes governing snow interception are typically represented by two-dimensional metrics like the leaf area index (LAI). To improve snow interception estimates and their scalability, new approaches are needed for better characterizing the three-dimensional distribution of canopy elements. Airborne laser scanning (ALS) provides a potential means of achieving this, with recent research focused on using ALS-derived metrics that describe forest spacing to predict interception storage. A wide range of canopy structural metrics that describe individual trees can also be extracted from ALS, although relatively little is known about which of them, and in what combination, best describes intrinsic canopy properties known to affect snow interception. The overarching goal of this study was to identify important ALS-derived canopy structural metrics that could help to further improve our ability to characterize intrinsic factors affecting snow interception. Specifically, we sought to determine how much variance in canopy intercepted snow volume can be explained by ALS-derived crown metrics, and what suite of existing and novel crown metrics most strongly affects canopy intercepted snow volume. To achieve this, we first used terrestrial laser scanning (TLS) to quantify snow interception on 14 trees. We then used these snow interception measurements to fit a random forest model with ALS-derived crown metrics as predictors. Next, we bootstrapped 1000 calculations of variable importance (percent increase in mean squared error when a given explanatory variable is removed), keeping nine canopy metrics for the final model that exceeded a variable importance threshold of 0.2. ALS-derived canopy metrics describing intrinsic tree structure explained approximately two-thirds of the snow interception variability (R2 ≥ 0.65, RMSE ≤ 0.52 m3, relative RMSE ≤ 48%) in our study when extrinsic factors were kept as constant as possible. For comparison, a generalized linear mixed-effects model predicting snow interception volume from LAI alone had a marginal R2 = 0.01. The three most important predictor variables were canopy length, whole-tree volume, and unobstructed returns (a novel metric). These results suggest that a suite of intrinsic variables may be used to map interception potential across larger areas and provide an improvement to interception estimates based on LAI. Full article
Show Figures

Figure 1

16 pages, 6208 KiB  
Article
Mapping Global Urban Impervious Surface and Green Space Fractions Using Google Earth Engine
by Wenhui Kuang, Yali Hou, Yinyin Dou, Dengsheng Lu and Shiqi Yang
Remote Sens. 2021, 13(20), 4187; https://doi.org/10.3390/rs13204187 - 19 Oct 2021
Cited by 15 | Viewed by 4378
Abstract
Urban impervious surfaces area (ISA) and green space (GS), two primary components of urban environment, are pivotal in detecting urban environmental quality and addressing global environmental change issues. However, the current global mapping of ISA and GS is not effective enough to accurately [...] Read more.
Urban impervious surfaces area (ISA) and green space (GS), two primary components of urban environment, are pivotal in detecting urban environmental quality and addressing global environmental change issues. However, the current global mapping of ISA and GS is not effective enough to accurately delineate in urban areas due to the mosaicked and complex structure. To address the issue, the hierarchical architecture principle and subpixel metric method were applied to map 30 m global urban ISA and GS fractions for the years 2015 and circa 2020. We use random forest algorithms for retrieval of the Normalized Settlement Density Index and Normalized Green Space Index from Landsat images using Google Earth Engine. The correlation coefficients of global urban ISA and GS fractions were all higher than 0.9 for 2015 and circa 2020. Our results show global urban ISA and GS areas in circa 2020 were 31.19 × 10⁴ km2 and 17.16 × 10⁴ km2, respectively. The novel ISA and GS fractions product can show potential applications in assessing the effects of urbanization on climate, ecology, and urban sustainability. Full article
Show Figures

Graphical abstract

19 pages, 9904 KiB  
Article
Improved GNSS-R Altimetry Methods: Theory and Experimental Demonstration Using Airborne Dual Frequency Data from the Microwave Interferometric Reflectometer (MIR)
by Oriol Cervelló i Nogués, Joan Francesc Munoz-Martin, Hyuk Park, Adriano Camps, Raul Onrubia, Daniel Pascual, Christoph Rüdiger, Jeffrey P. Walker and Alessandra Monerris
Remote Sens. 2021, 13(20), 4186; https://doi.org/10.3390/rs13204186 - 19 Oct 2021
Cited by 3 | Viewed by 3012
Abstract
Altimetric performance of Global Navigation Satellite System - Reflectometry (GNSS-R) instruments depends on receiver’s bandwidth and signal-to-noise ratio (SNR). The altimetric delay is usually computed from the time difference between the peak of the direct signal waveform and the maximum of the derivative [...] Read more.
Altimetric performance of Global Navigation Satellite System - Reflectometry (GNSS-R) instruments depends on receiver’s bandwidth and signal-to-noise ratio (SNR). The altimetric delay is usually computed from the time difference between the peak of the direct signal waveform and the maximum of the derivative of the reflected signal waveform. Dual-frequency data gathered by the airborne Microwave Interferometric Reflectometer (MIR) in the Bass Strait, between Australia and Tasmania, suggest that this approach is only valid for flat surfaces and large bandwidth receivers. This work analyses different methods to compute the altimetric observables using GNSS-R. A proposed novel method, the Peak-to-Minimum of the 3rd Derivative (P-Min3D) for narrow-band codes (e.g., L1 C/A), and the Peak-to-Half Power (P-HP) for large bandwidth codes (e.g., L5 or E5a codes) show improved performance when using real data. Both methods are also compared to the Peak-to-Peak (P-P) and Peak-to-Maximum of the 1st Derivative (P-Max1D) methods. The key difference between these methods is the determination of the delay position in the reflected signal waveform in order to compute the altimetric observable. Airborne experimental results comparing the different methods, bands and GNSS-R processing techniques show that centimeter level accuracy can be achieved. Full article
(This article belongs to the Special Issue Applications of GNSS Reflectometry for Earth Observation II)
Show Figures

Figure 1

44 pages, 7500 KiB  
Article
Broadcast Ephemeris with Centimetric Accuracy: Test Results for GPS, Galileo, Beidou and Glonass
by Alessandro Caporali and Joaquin Zurutuza
Remote Sens. 2021, 13(20), 4185; https://doi.org/10.3390/rs13204185 - 19 Oct 2021
Cited by 3 | Viewed by 2894
Abstract
Here we test the capability of the Broadcast Ephemeris Message, in both its GPS-like (Keplerian ellipse with secular and periodic perturbations) and Glonass-like (numerical integration of a 9D state vector) formats, to reproduce a corresponding precise ephemeris. We start from a daily Rinex [...] Read more.
Here we test the capability of the Broadcast Ephemeris Message, in both its GPS-like (Keplerian ellipse with secular and periodic perturbations) and Glonass-like (numerical integration of a 9D state vector) formats, to reproduce a corresponding precise ephemeris. We start from a daily Rinex 3.04 navigation file for multiple GNSS and the corresponding SP3 precise orbits computed by CNES (Centre National d’Etudes Spatiales) for GPS, Glonass, Galileo and CODE (Center for Orbit Determination in Europe) for Beidou, and compute broadcast ECEF coordinates and clocks. The pre-fit discrepancies are converted by least squares to corrections to the broadcast ephemeris parameters in two-hour consecutive arcs (for GPS, Galileo and Beidou) and to a set of seven Helmert parameters for the entire day, to align in origin, orientation and scale to the common GNSS IGS14 Reference Frame. The test cases suggest that the Broadcast Ephemeris Message, complemented with Reference Frame information, can reproduce the precise ephemeris and clocks with centimetric accuracy for intervals at least equal to the respective validity times, typically 2 h. The broadcast ephemeris of Glonass consists of three initial positions and velocities at epoch, three constant Lunisolar accelerations for the satellite position, and of three polynomial coefficients for the satellite clock. The 9D vector of state is numerically integrated to generate position and velocity data within the validity time (0.5 h) of the message. To test the capability of this model to reproduce the corresponding values of a precise ephemeris, the 9D vector of state and clock polynomials are adjusted until the rms (root mean squared spread) of the post-fit residuals relative to a precise orbit (CNES’s in our case) is minimum. We show in one example (one satellite for one day) that the Glonass type of message can reproduce a precise ephemeris and clock with a rms spread of 0.025 m over one-hour arcs. Volume computations on one month of data with all available satellites confirm the test results. For GPS, Glonass, Galileo and Beidou, the best fitting clock values predicted by our second order polynomials, based on a 15 min sampling, are shown to fit the corresponding high rate clocks (30 s sampling) of MGEX with zero bias and a rms spread of 0.062 ns (GPS G01), 0.023 ns (Galileo E01), 0.43 ns (Glonass R01), 0.086 ns (Beidou C07) and 0.086 ns (Beidou C12). Modifications to the GPS-like message structure and Glonass algorithm are proposed to increase the validity time by including the effect of the 3rd zonal harmonic of the Earth’s gravity field. The potential of the RTCM messages for broadcasting the improved navigation message is reviewed. Full article
Show Figures

Figure 1

15 pages, 83382 KiB  
Technical Note
Performance of Multi-GNSS Real-Time UTC(NTSC) Time and Frequency Transfer Service Using Carrier Phase Observations
by Pengfei Zhang, Rui Tu, Xiaochun Lu, Lihong Fan and Rui Zhang
Remote Sens. 2021, 13(20), 4184; https://doi.org/10.3390/rs13204184 - 19 Oct 2021
Viewed by 1687
Abstract
The technique of carrier phase (CP), based on the global navigation satellite system (GNSS), has proven to be a highly effective spatial tool in the field of time and frequency transfer with sub-nanosecond accuracy. The rapid development of real-time GNSS satellite orbit and [...] Read more.
The technique of carrier phase (CP), based on the global navigation satellite system (GNSS), has proven to be a highly effective spatial tool in the field of time and frequency transfer with sub-nanosecond accuracy. The rapid development of real-time GNSS satellite orbit and clock determinations has enabled GNSS time and frequency transfer using the CP technique to be performed in real-time mode, without any issues associated with latency. In this contribution, we preliminarily built the prototype system of real-time multi-GNSS time and frequency transfer service in National Time Service Center (NTSC) of the Chinese Academy of Sciences (CAS), which undertakes the task to generate, maintains and transmits the national standard of time and frequency UTC(NTSC). The comprehensive assessment of the availability and quality of the service system were provided. First, we assessed the multi-GNSS state space representation (SSR) correction generated in real-time multi-GNSS prototype system by combining broadcast ephemeris through a comparison with the GeoForschungsZentrum (GFZ) final products. The statistical results showed that the orbit precision in three directions was smaller than 6 cm for global positioning system (GPS) and smaller than approximately 10 cm for BeiDou satellite system (BDS). The root mean square (RMS) values of clock differences for GPS were approximately 2.74 and 6.74 ns for the GEO constellation of BDS, 3.24 ns for IGSO, and 1.39 ns for MEO. The addition, the GLObal NAvigation Satellite System (GLONASS) and Galileo satellite navigation system (Galileo) were 4.34 and 1.32 ns, respectively. In order to assess the performance of real-time multi-GNSS time and frequency transfer in a prototype system, the four real-time time transfer links, which used UTC(NTSC) as the reference, were employed to evaluate the performance by comparing with the solution determined using the GFZ final products. The RMS could reach sub-nanosecond accuracy in the two solutions, either in the SSR or GFZ solution, or in GPS, BDS, GLONASS, and Galileo. The frequency stability within 10,000 s was 3.52 × 10⁻¹² for SSR and 3.47 × 10⁻¹² for GFZ and GPS, 3.63 × 10⁻¹² for SSR and 3.53 × 10⁻¹² for GFZ for BDS, 3.57 × 10⁻¹² for SSR and 3.52 × 10⁻¹² for GFZ for GLONASS, and 3.56 × 10⁻¹² for SSR and 3.48 × 10⁻¹² for GFZ for Galileo. Full article
Show Figures

Figure 1

18 pages, 8248 KiB  
Article
STC-Det: A Slender Target Detector Combining Shadow and Target Information in Optical Satellite Images
by Zhaoyang Huang, Feng Wang, Hongjian You and Yuxin Hu
Remote Sens. 2021, 13(20), 4183; https://doi.org/10.3390/rs13204183 - 19 Oct 2021
Cited by 4 | Viewed by 1585
Abstract
Object detection has made great progress. However, due to the unique imaging method of optical satellite remote sensing, the detection of slender targets is still insufficient. Specifically, the perspective of optical satellites is small, and the characteristics of slender targets are severely lost [...] Read more.
Object detection has made great progress. However, due to the unique imaging method of optical satellite remote sensing, the detection of slender targets is still insufficient. Specifically, the perspective of optical satellites is small, and the characteristics of slender targets are severely lost during imaging, resulting in insufficient detection task information; at the same time, the appearance of slender targets in the image is greatly affected by the satellite perspective, which is likely to cause insufficient generalization capabilities of conventional detection models. In response to these two points, we have made some improvements. First, in this paper, we introduce the shadow as auxiliary information to complement the trunk features of the target lost in imaging. Second, to reduce the impact of satellite perspective on imaging, in this paper, we use the characteristic that shadow information is not affected by satellite perspective to design STC-Det. STC-Det treats the shadow and the target as two different types of targets and uses the shadow information to assist the detection, reducing the impact of the satellite perspective on detection. Among them, in order to improve the performance of STC-Det, we propose an automatic matching method (AMM) of shadow and target and a feature fusion method (FFM). Finally, this paper proposes a new method to calculate the heatmaps of detectors, which verifies the effectiveness of the proposed network in a visual way. Experiments show that when the satellite perspective is variable, the precision of STC-Det is increased by 1.7%, and when the satellite perspective is small, the precision of STC-Det is increased by 5.2%. Full article
Show Figures

Graphical abstract

3 pages, 188 KiB  
Editorial
An Overview of the Special Issue on Plant Phenotyping for Disease Detection
by Mónica Pineda
Remote Sens. 2021, 13(20), 4182; https://doi.org/10.3390/rs13204182 - 19 Oct 2021
Cited by 1 | Viewed by 1537
Abstract
According to the latest United Nations estimates in September 2021, the world’s population is now 7 [...] Full article
(This article belongs to the Special Issue Plant Phenotyping for Disease Detection)
18 pages, 6144 KiB  
Article
Hybrid MSRM-Based Deep Learning and Multitemporal Sentinel 2-Based Machine Learning Algorithm Detects Near 10k Archaeological Tumuli in North-Western Iberia
by Iban Berganzo-Besga, Hector A. Orengo, Felipe Lumbreras, Miguel Carrero-Pazos, João Fonte and Benito Vilas-Estévez
Remote Sens. 2021, 13(20), 4181; https://doi.org/10.3390/rs13204181 - 19 Oct 2021
Cited by 25 | Viewed by 5419
Abstract
This paper presents an algorithm for large-scale automatic detection of burial mounds, one of the most common types of archaeological sites globally, using LiDAR and multispectral satellite data. Although previous attempts were able to detect a good proportion of the known mounds in [...] Read more.
This paper presents an algorithm for large-scale automatic detection of burial mounds, one of the most common types of archaeological sites globally, using LiDAR and multispectral satellite data. Although previous attempts were able to detect a good proportion of the known mounds in a given area, they still presented high numbers of false positives and low precision values. Our proposed approach combines random forest for soil classification using multitemporal multispectral Sentinel-2 data and a deep learning model using YOLOv3 on LiDAR data previously pre-processed using a multi–scale relief model. The resulting algorithm significantly improves previous attempts with a detection rate of 89.5%, an average precision of 66.75%, a recall value of 0.64 and a precision of 0.97, which allowed, with a small set of training data, the detection of 10,527 burial mounds over an area of near 30,000 km2, the largest in which such an approach has ever been applied. The open code and platforms employed to develop the algorithm allow this method to be applied anywhere LiDAR data or high-resolution digital terrain models are available. Full article
Show Figures

Graphical abstract

19 pages, 2881 KiB  
Article
Multi-Scale Feature Mapping Network for Hyperspectral Image Super-Resolution
by Jing Zhang, Minhao Shao, Zekang Wan and Yunsong Li
Remote Sens. 2021, 13(20), 4180; https://doi.org/10.3390/rs13204180 - 19 Oct 2021
Cited by 9 | Viewed by 1934
Abstract
Hyperspectral Image (HSI) can continuously cover tens or even hundreds of spectral segments for each spatial pixel. Limited by the cost and commercialization requirements of remote sensing satellites, HSIs often lose a lot of information due to insufficient image spatial resolution. For the [...] Read more.
Hyperspectral Image (HSI) can continuously cover tens or even hundreds of spectral segments for each spatial pixel. Limited by the cost and commercialization requirements of remote sensing satellites, HSIs often lose a lot of information due to insufficient image spatial resolution. For the high-dimensional nature of HSIs and the correlation between the spectra, the existing Super-Resolution (SR) methods for HSIs have the problems of excessive parameter amount and insufficient information complementarity between the spectra. This paper proposes a Multi-Scale Feature Mapping Network (MSFMNet) based on the cascaded residual learning to adaptively learn the prior information of HSIs. MSFMNet simplifies each part of the network into a few simple yet effective network modules. To learn the spatial-spectral characteristics among different spectral segments, a multi-scale feature generation and fusion Multi-Scale Feature Mapping Block (MSFMB) based on wavelet transform and spatial attention mechanism is designed in MSFMNet to learn the spectral features between different spectral segments. To effectively improve the multiplexing rate of multi-level spectral features, a Multi-Level Feature Fusion Block (MLFFB) is designed to fuse the multi-level spectral features. In the image reconstruction stage, an optimized sub-pixel convolution module is used for the up-sampling of different spectral segments. Through a large number of verifications on the three general hyperspectral datasets, the superiority of this method compared with the existing hyperspectral SR methods is proved. In subjective and objective experiments, its experimental performance is better than its competitors. Full article
Show Figures

Figure 1

15 pages, 7738 KiB  
Article
SNPP VIIRS Day Night Band: Ten Years of On-Orbit Calibration and Performance
by Hongda Chen, Chengbo Sun, Xiaoxiong Xiong, Gal Sarid and Junqiang Sun
Remote Sens. 2021, 13(20), 4179; https://doi.org/10.3390/rs13204179 - 19 Oct 2021
Cited by 8 | Viewed by 1896
Abstract
Aboard the polar-orbiting SNPP satellite, the VIIRS instrument has been in operation since launch in October 2011. It is a visible and infrared radiometer with a unique panchromatic channel capability designated as a day-night band (DNB). This channel covers wavelengths from 0.5 to [...] Read more.
Aboard the polar-orbiting SNPP satellite, the VIIRS instrument has been in operation since launch in October 2011. It is a visible and infrared radiometer with a unique panchromatic channel capability designated as a day-night band (DNB). This channel covers wavelengths from 0.5 to 0.9 µm and is designed with a near-constant spatial resolution for Earth observations 24 h a day. The DNB operates at 3 gain stages (low, middle, and high) to cover a large dynamic range. An onboard solar diffuser (SD) is used for calibration in the low gain stage, and to enable the derivation of gain ratios between the different stages. In this paper, we present the SNPP VIIRS DNB calibration performed by the NASA VIIRS characterization support team (VCST). The DNB calibration algorithms are described to generate the calibration coefficient look up tables (LUTs) for the latest NASA Level 1B Collection 2 products. We provide an evaluation of DNB on-orbit calibration performance. This activity supports the NASA Earth science community by delivering consistent VIIRS sensor data products via the Land Science Investigator-led Processing Systems, including the SD degradation applied for DNB calibrations in detector gain and gain ratio trending. The DNB stray light contamination and its correction are highlighted. Performance validations are presented using comparisons to the calibration methods employed by NOAA’s operational Interface Data Processing Segment. Further work on stray light corrections is also discussed. Full article
Show Figures

Figure 1

18 pages, 4563 KiB  
Article
Creating and Testing Explainer Videos for Earth Observation
by Henryk Hodam, Andreas Rienow and Carsten Juergens
Remote Sens. 2021, 13(20), 4178; https://doi.org/10.3390/rs13204178 - 19 Oct 2021
Cited by 2 | Viewed by 2073
Abstract
Learning videos can be concise learning packages that offer a wide range of possibilities when it comes to present topics in an up-to-date way and disseminating them in a variety of learning environments. Videos are already a primary source of information in our [...] Read more.
Learning videos can be concise learning packages that offer a wide range of possibilities when it comes to present topics in an up-to-date way and disseminating them in a variety of learning environments. Videos are already a primary source of information in our society; however, few examples convey earth observation topics. Over recent decades, numerous studies established guidelines on how educational videos can be successful. This paper presents a workflow to use these guidelines in the creation of learning videos covering the basic concepts of earth observation. The target groups for these videos are secondary students as well as anyone interested in learning about earth observation. Two of those videos, one on earth observation in general and one on the basics of the electromagnetic spectrum, were used in this research. To test whether or not the workflow leads to effective learning videos and to compare them to traditional text and illustration material derived from those videos, a pre-test/post-test study was undertaken focusing on German pupils in their final year at secondary school as well as first semester university students. Due to the special circumstances faced during the COVID-19 crisis, this experimental setup used a combination of online questionnaire tools and a web environment. The results show that both methods were effective resources that led to a significant increase in knowledge—raising the test results by 21% for the video and 13% for the text and illustration group. Full article
(This article belongs to the Collection Teaching and Learning in Remote Sensing)
Show Figures

Figure 1

18 pages, 13943 KiB  
Article
Spatiotemporal Analysis of Sea Ice Leads in the Arctic Ocean Retrieved from IceBridge Laxon Line Data 2012–2018
by Dexuan Sha, Younghyun Koo, Xin Miao, Anusha Srirenganathan, Hai Lan, Shorojit Biswas, Qian Liu, Alberto M. Mestas-Nuñez, Hongjie Xie and Chaowei Yang
Remote Sens. 2021, 13(20), 4177; https://doi.org/10.3390/rs13204177 - 19 Oct 2021
Viewed by 2782
Abstract
The ocean and atmosphere exert stresses on sea ice that create elongated cracks and leads which dominate the vertical exchange of energy, especially in cold seasons, despite covering only a small fraction of the surface. Motivated by the need of a spatiotemporal analysis [...] Read more.
The ocean and atmosphere exert stresses on sea ice that create elongated cracks and leads which dominate the vertical exchange of energy, especially in cold seasons, despite covering only a small fraction of the surface. Motivated by the need of a spatiotemporal analysis of sea ice lead distribution, a practical workflow was developed to classify the high spatial resolution aerial images DMS (Digital Mapping System) along the Laxon Line in the NASA IceBridge Mission. Four sea ice types (thick ice, thin ice, open water, and shadow) were identified, and relevant sea ice lead parameters were derived for the period of 2012–2018. The spatiotemporal variations of lead fraction along the Laxon Line were verified by ATM (Airborne Topographic Mapper) surface height data and correlated with coarse spatial resolution sea ice motion, air temperature, and wind data through multiple regression models. We found that the freeboard data derived from sea ice leads were compatible with other products. The temperature and ice motion vorticity were the leading factors of the formation of sea ice leads, followed by wind vorticity and kinetic moments of ice motion. Full article
(This article belongs to the Topic Climate Change and Environmental Sustainability)
Show Figures

Figure 1

19 pages, 3865 KiB  
Article
Monitoring Forest Resilience Dynamics from Very High-Resolution Satellite Images in Case of Multi-Hazard Disaster
by Reza Rezaei and Saman Ghaffarian
Remote Sens. 2021, 13(20), 4176; https://doi.org/10.3390/rs13204176 - 19 Oct 2021
Cited by 4 | Viewed by 2475
Abstract
Typhoons strongly impact the structure and functioning of the forests, especially in the coastal areas in which typhoon-induced flooding imposes additional stress on the ecosystem via physical destruction and rising soil salinity. The impact of typhoons on forest ecosystems is becoming even more [...] Read more.
Typhoons strongly impact the structure and functioning of the forests, especially in the coastal areas in which typhoon-induced flooding imposes additional stress on the ecosystem via physical destruction and rising soil salinity. The impact of typhoons on forest ecosystems is becoming even more significant in the changing climate, which triggers atmospheric mechanisms that increase their frequency and intensity. This study investigates the resiliency of the Philippines’ forest areas (i.e., two selected forestry areas in Tacloban and Guiuan) in the aftermath of Super Typhoon Haiyan, which was followed by coastal flooding, as well as changes in ecosystem and biomass content using remote sensing. For this, we first evaluated the sensitivity of the normalized difference vegetation index (NDVI), green normalized difference vegetation index (GNDVI), and enhanced vegetation index (EVI) in detecting temporal changes in biomass content using very high-resolution satellite images. Then, employing three resilience concepts: amplitude, malleability, and elasticity, the most sensitive biomass index (i.e., NDVI) and digital elevation model (DEM) data were used to measure the resiliency of the Guiuan and Tacloban sites. We also applied a mean-variance analysis to extract and illustrate the shifts in the ecosystem status. The results show that despite a considerable biomass loss (57% in Guiuan and 46% in Tacloban), the Guiuan and Tacloban sites regained 80% and 70% of their initial biomass content within a year after the typhoon, respectively. However, the presence of canopy gaps in the Tacloban site makes it vulnerable to external stressors. Furthermore, the findings demonstrate that the study areas return to their initial states within two years. This indicates the high resiliency of those areas according to elasticity results. Moreover, the evaluation of typhoon impacts according to the elevation demonstrates that the elevation had a substantial impact on both damage severity and biomass recovery. Full article
(This article belongs to the Special Issue Forest Resilience to Extreme Events)
Show Figures

Graphical abstract

24 pages, 5245 KiB  
Article
Quantification of Natural and Anthropogenic Driving Forces of Vegetation Changes in the Three-River Headwater Region during 1982–2015 Based on Geographical Detector Model
by Siqi Gao, Guotao Dong, Xiaohui Jiang, Tong Nie, Huijuan Yin and Xinwei Guo
Remote Sens. 2021, 13(20), 4175; https://doi.org/10.3390/rs13204175 - 19 Oct 2021
Cited by 30 | Viewed by 2394
Abstract
The three-river headwater region (TRHR) supplies the Yangtze, Yellow, and Lantsang rivers, and its ecological environment is fragile, hence it is important to study the surface vegetation cover status of the TRHR to facilitate its ecological conservation. The normalized difference vegetation index (NDVI) [...] Read more.
The three-river headwater region (TRHR) supplies the Yangtze, Yellow, and Lantsang rivers, and its ecological environment is fragile, hence it is important to study the surface vegetation cover status of the TRHR to facilitate its ecological conservation. The normalized difference vegetation index (NDVI) can reflect the cover status of surface vegetation. The aims of this study are to quantify the spatial heterogeneity of the NDVI, identify the main driving factors influencing the NDVI, and explore the interaction between these factors. To this end, we used the global inventory modeling and mapping studies (GIMMS)-NDVI data from the TRHR from 1982 to 2015 and included eight natural factors (namely slope, aspect, elevation, soil type, vegetation type, landform type, annual mean temperature, and annual precipitation) and three anthropogenic factors (gross domestic product (GDP), population density, and land use type), which we subjected to linear regression analysis, the Mann-Kendall statistical test, and moving t-test to analyze the spatial and temporal variability of the NDVI in the TRHR over 34 years, using a geographical detector model. Our results showed that the NDVI distribution of the TRHR was high in the southeast and low in the northwest. The change pattern exhibited an increasing trend in the west and north and a decreasing trend in the center and south; overall, the mean NDVI value from 1982 to 2015 has increased. Annual precipitation was the most important factor influencing the NDVI changes in the TRHR, and factors, such as annual mean temperature, vegetation type, and elevation, also explained the vegetation coverage status well. The influence of natural factors was generally stronger than that of anthropogenic factors. The NDVI factors had a synergistic effect, exhibiting mutual enhancement and nonlinear enhancement relationships. The results of this study provide insights into the ecological conservation of the TRHR and the ecological security and development of the middle and lower reaches. Full article
(This article belongs to the Topic Climate Change and Environmental Sustainability)
Show Figures

Graphical abstract

24 pages, 3955 KiB  
Article
Self-Organizing Maps for Clustering Hyperspectral Images On-Board a CubeSat
by Aksel S. Danielsen, Tor Arne Johansen and Joseph L. Garrett
Remote Sens. 2021, 13(20), 4174; https://doi.org/10.3390/rs13204174 - 18 Oct 2021
Cited by 8 | Viewed by 2852
Abstract
Hyperspectral remote sensing reveals detailed information about the optical response of a scene. Self-Organizing Maps (SOMs) can partition a hyperspectral dataset into clusters, both to enable more analysis on-board the imaging platform and to reduce downlink time. Here, the expected on-board performance of [...] Read more.
Hyperspectral remote sensing reveals detailed information about the optical response of a scene. Self-Organizing Maps (SOMs) can partition a hyperspectral dataset into clusters, both to enable more analysis on-board the imaging platform and to reduce downlink time. Here, the expected on-board performance of the SOM algorithm is calculated within two different satellite operational procedures: one in which the SOM is trained prior to imaging, and another in which the training is part of the operations. The two procedures are found to have advantages that are suitable to quite different situations. The computational requirements for SOMs of different sizes are benchmarked on the target hardware for the HYPSO-1 mission, and dimensionality reduction (DR) is tested as a way of reducing the SOM network size. We find that SOMs can run on the target on-board processing hardware, can be trained reasonably well using less than 0.1% of the total pixels in a scene, are accelerated by DR, and can achieve a relative quantization error of about 1% on scenes acquired by a previous hyperspectral imaging satellite, HICO. Moreover, if class labels are assigned to the nodes of the SOM, these networks can classify with a comparable accuracy to support vector machines, a common benchmark, on a few simple scenes. Full article
Show Figures

Figure 1

11 pages, 6940 KiB  
Technical Note
Underwater Communication Using UAVs to Realize High-Speed AUV Deployment
by Yusuke Yokota and Takumi Matsuda
Remote Sens. 2021, 13(20), 4173; https://doi.org/10.3390/rs13204173 - 18 Oct 2021
Cited by 10 | Viewed by 4753
Abstract
To monitor ocean and seafloor properties in detail, sensors are generally installed on autonomous underwater vehicles (AUVs). An AUV cannot accurately determine its absolute position and needs to communicate with a sea-surface vehicle. However, sea-surface vehicles cannot perform high-speed observations with high efficiency [...] Read more.
To monitor ocean and seafloor properties in detail, sensors are generally installed on autonomous underwater vehicles (AUVs). An AUV cannot accurately determine its absolute position and needs to communicate with a sea-surface vehicle. However, sea-surface vehicles cannot perform high-speed observations with high efficiency due to their low mobility and high labor and equipment costs, e.g., vessel charter charges, operator restraint time on the sea surface during observations, etc. From this perspective, unmanned aerial vehicles (UAVs) have potential as the next-generation communication platform. In this study, we conducted a demonstration experiment to use UAV as a sea-surface base for underwater communication with an AUV. We investigated the capability of a UAV to land on the sea surface, drift like a buoy to receive underwater data, and finally lift off to return to its base. The experimental results suggest that UAVs provide suitable communication performance for research near the shore in terms of robust hovering control, stability against sway, and operation speed. To carry out more complicated work (such as transportation) of UAVs, further research in areas such as weight reduction is required. Full article
(This article belongs to the Special Issue Remote Sensing Technology for New Ocean and Seafloor Monitoring)
Show Figures

Figure 1

19 pages, 8926 KiB  
Article
Evaluation of Riparian Tree Cover and Shading in the Chauga River Watershed Using LiDAR and Deep Learning Land Cover Classification
by Madeleine M. Bolick, Christopher J. Post, Elena A. Mikhailova, Hamdi A. Zurqani, Andrew P. Grunwald and Elizabeth A. Saldo
Remote Sens. 2021, 13(20), 4172; https://doi.org/10.3390/rs13204172 - 18 Oct 2021
Cited by 7 | Viewed by 2314
Abstract
River systems face negative impacts from development and removal of riparian vegetation that provide critical shading in the face of climate change. This study used supervised deep learning to accurately classify the land cover, including shading, of the Chauga River watershed, located in [...] Read more.
River systems face negative impacts from development and removal of riparian vegetation that provide critical shading in the face of climate change. This study used supervised deep learning to accurately classify the land cover, including shading, of the Chauga River watershed, located in Oconee County, South Carolina, for 2011 and 2019. The study examined the land cover differences along the Chauga River and its tributaries, inside and outside the Sumter National Forest. LiDAR data were incorporated in solar radiation calculations for the Chauga River inside and outside the National Forest. The deep learning classifications produced land cover maps with high overall accuracy (97.09% for 2011; 97.58% for 2019). The most significant difference in land cover was in tree cover in the 50 m buffer of the tributaries inside the National Forest compared to the tributaries outside the National Forest (2011: 95.39% vs. 81.84%, 2019: 92.86% vs. 82.06%). The solar radiation calculations also confirmed a difference between the area inside and outside the National Forest, with the mean temperature being greater outside the protected area (outside: 455.845 WH/m2; inside: 416,770 WH/m2). This study suggests that anthropogenic influence in the Chauga River watershed is greater in the areas outside the Sumter National Forest, which could cause damage to the river ecosystem if left unchecked in the future as development pressures increase. This study demonstrates the accurate application of deep learning for high-resolution classification of river shading combined with the use of LiDAR data to estimate solar radiation reaching the Chauga River. Techniques to monitor riparian zones and shading at high spatial resolutions are critical for the mitigation of the negative impacts of warming climates on aquatic ecosystems. Full article
Show Figures

Figure 1

16 pages, 10262 KiB  
Article
Multi-Feature Enhanced Building Change Detection Based on Semantic Information Guidance
by Junkang Xue, Hao Xu, Hui Yang, Biao Wang, Penghai Wu, Jaewan Choi, Lixiao Cai and Yanlan Wu
Remote Sens. 2021, 13(20), 4171; https://doi.org/10.3390/rs13204171 - 18 Oct 2021
Cited by 12 | Viewed by 2072
Abstract
Building change detection has always been an important research focus in production and urbanization. In recent years, deep learning methods have demonstrated a powerful ability in the field of detecting remote sensing changes. However, due to the heterogeneity of remote sensing and the [...] Read more.
Building change detection has always been an important research focus in production and urbanization. In recent years, deep learning methods have demonstrated a powerful ability in the field of detecting remote sensing changes. However, due to the heterogeneity of remote sensing and the characteristics of buildings, the current methods do not present an effective means to perceive building changes or the ability to fuse multi-temporal remote sensing features, which leads to fragmented and incomplete results. In this article, we propose a multi-branched network structure to fuse the semantic information of the building changes at different levels. In this model, two accessory branches were used to guide the buildings’ semantic information under different time sequences, and the main branches can merge the change information. In addition, we also designed a feature enhancement layer to further strengthen the integration of the main and accessory branch information. For ablation experiments, we designed experiments on the above optimization process. For MDEFNET, we designed experiments which compare with typical deep learning model and recent deep learning change detection methods. Experimentation with the WHU Building Change Detection Dataset showed that the method in this paper obtained accuracies of 0.8526, 0.9418, and 0.9204 in Intersection over Union (IoU), Recall, and F1 Score, respectively, which could assess building change areas with complete boundaries and accurate results. Full article
(This article belongs to the Special Issue Applications of Remote Sensing Imagery for Urban Areas)
Show Figures

Figure 1

22 pages, 36262 KiB  
Article
A New Empirical Estimation Scheme for Daily Net Radiation at the Ocean Surface
by Jianghai Peng, Bo Jiang, Hongkai Chen, Shunlin Liang, Hui Liang, Shaopeng Li, Jiakun Han, Qiang Liu, Jie Cheng, Yunjun Yao, Kun Jia and Xiaotong Zhang
Remote Sens. 2021, 13(20), 4170; https://doi.org/10.3390/rs13204170 - 18 Oct 2021
Cited by 3 | Viewed by 1587
Abstract
Ocean surface net radiation (Rn) is significant in research on the Earth’s heat balance systems, air–sea interactions, and other applications. However, there have been few studies on Rn until now. Based on radiative and meteorological measurements collected from 66 globally [...] Read more.
Ocean surface net radiation (Rn) is significant in research on the Earth’s heat balance systems, air–sea interactions, and other applications. However, there have been few studies on Rn until now. Based on radiative and meteorological measurements collected from 66 globally distributed moored buoys, it was found that Rn was dominated by downward shortwave radiation (Rg) when the length ratio of daytime (LRD) was greater than 0.4 but dominated by downward longwave radiation (Rl) for the other cases (LRD ≤ 0.4). Therefore, an empirical scheme that includes two conditional models named Case 1 (LRD > 0.4) utilizing Rg as a major input and Case 2 (LRD ≤ 0.4) utilizing Rl as a major input for Rn estimation was successfully developed. After validation against in situ Rn, the performance of the empirical scheme was satisfactory with an overall R2 value of 0.972, an RMSE of 9.768 Wm−2, and a bias of −0.092 Wm−2. Specifically, the accuracies of the two conditional models were also very good, with RMSEs of 9.805 and 2.824 Wm−2 and biases of −0.095 and 0.346 Wm−2 for the Case 1 and Case 2 models, respectively. However, due to the limited number of available samples, the performances of these new models were poor in coastal and high-latitude areas, and the models did not work when the LRD was too small (i.e., LRD < 0.3). Overall, the newly developed empirical scheme for Rn estimation has strong potential to be widely used in practical use because of its simple format and high accuracy. Full article
(This article belongs to the Special Issue Advances on Land–Ocean Heat Fluxes Using Remote Sensing)
Show Figures

Graphical abstract

33 pages, 18851 KiB  
Article
A Training Sample Migration Method for Wetland Mapping and Monitoring Using Sentinel Data in Google Earth Engine
by Erfan Fekri, Hooman Latifi, Meisam Amani and Abdolkarim Zobeidinezhad
Remote Sens. 2021, 13(20), 4169; https://doi.org/10.3390/rs13204169 - 18 Oct 2021
Cited by 27 | Viewed by 3831
Abstract
Wetlands are one of the most important ecosystems due to their critical services to both humans and the environment. Therefore, wetland mapping and monitoring are essential for their conservation. In this regard, remote sensing offers efficient solutions due to the availability of cost-efficient [...] Read more.
Wetlands are one of the most important ecosystems due to their critical services to both humans and the environment. Therefore, wetland mapping and monitoring are essential for their conservation. In this regard, remote sensing offers efficient solutions due to the availability of cost-efficient archived images over different spatial scales. However, a lack of sufficient consistent training samples at different times is a significant limitation of multi-temporal wetland monitoring. In this study, a new training sample migration method was developed to identify unchanged training samples to be used in wetland classification and change analyses over the International Shadegan Wetland (ISW) areas of southwestern Iran. To this end, we first produced the wetland map of a reference year (2020), for which we had training samples, by combining Sentinel-1 and Sentinel-2 images and the Random Forest (RF) classifier in Google Earth Engine (GEE). The Overall Accuracy (OA) and Kappa coefficient (KC) of this reference map were 97.93% and 0.97, respectively. Then, an automatic change detection method was developed to migrate unchanged training samples from the reference year to the target years of 2018, 2019, and 2021. Within the proposed method, three indices of the Normalized Difference Vegetation Index (NDVI), Normalized Difference Water Index (NDWI), and the mean Standard Deviation (SD) of the spectral bands, along with two similarity measures of the Euclidean Distance (ED) and Spectral Angle Distance (SAD), were computed for each pair of reference–target years. The optimum threshold for unchanged samples was also derived using a histogram thresholding approach, which led to selecting the samples that were most likely unchanged based on the highest OA and KC for classifying the test dataset. The proposed migration sample method resulted in high OAs of 95.89%, 96.83%, and 97.06% and KCs of 0.95, 0.96, and 0.96 for the target years of 2018, 2019, and 2021, respectively. Finally, the migrated samples were used to generate the wetland map for the target years. Overall, our proposed method showed high potential for wetland mapping and monitoring when no training samples existed for a target year. Full article
(This article belongs to the Special Issue Remote Sensing for Wetland Inventory, Mapping and Change Analysis)
Show Figures

Graphical abstract

22 pages, 4106 KiB  
Article
Estimation of Plot-Level Burn Severity Using Terrestrial Laser Scanning
by Michael R. Gallagher, Aaron E. Maxwell, Luis Andrés Guillén, Alexis Everland, E. Louise Loudermilk and Nicholas S. Skowronski
Remote Sens. 2021, 13(20), 4168; https://doi.org/10.3390/rs13204168 - 18 Oct 2021
Cited by 7 | Viewed by 2620
Abstract
Monitoring wildland fire burn severity is important for assessing ecological outcomes of fire and their spatial patterning as well as guiding efforts to mitigate or restore areas where ecological outcomes are negative. Burn severity mapping products are typically created using satellite reflectance data [...] Read more.
Monitoring wildland fire burn severity is important for assessing ecological outcomes of fire and their spatial patterning as well as guiding efforts to mitigate or restore areas where ecological outcomes are negative. Burn severity mapping products are typically created using satellite reflectance data but must be calibrated to field data to derive meaning. The composite burn index (CBI) is the most widely used field-based method used to calibrate satellite-based burn severity data but important limitations of this approach have yet to be resolved. The objective of this study was focused on predicting CBI from point cloud and visible-spectrum camera (RGB) metrics derived from single-scan terrestrial laser scanning (TLS) datasets to determine the viability of TLS data as an alternative approach to estimating burn severity in the field. In our approach, we considered the predictive potential of post-scan-only metrics, differenced pre- and post-scan metrics, RGB metrics, and all three together to predict CBI and evaluated these with candidate algorithms (i.e., linear model, random forest (RF), and support vector machines (SVM) and two evaluation criteria (R-squared and root mean square error (RMSE)). In congruence with the strata-based observations used to calculate CBI, we evaluated the potential approaches at the strata level and at the plot level using 70 TLS and 10 RGB independent variables that we generated from the field data. Machine learning algorithms successfully predicted total plot CBI and strata-specific CBI; however, the accuracy of predictions varied among strata by algorithm. RGB variables improved predictions when used in conjunction with TLS variables, but alone proved a poor predictor of burn severity below the canopy. Although our study was to predict CBI, our results highlight that TLS-based methods for quantifying burn severity can be an improvement over CBI in many ways because TLS is repeatable, quantitative, faster, requires less field-expertise, and is more flexible to phenological variation and biomass change in the understory where prescribed fire effects are most pronounced. We also point out that TLS data can also be leveraged to inform other monitoring needs beyond those specific to wildland fire, representing additional efficiency in using this approach. Full article
(This article belongs to the Special Issue Advances in LiDAR Remote Sensing for Forestry and Ecology)
Show Figures

Graphical abstract

23 pages, 1473 KiB  
Article
A Robust Adaptive Unscented Kalman Filter for Floating Doppler Wind-LiDAR Motion Correction
by Andreu Salcedo-Bosch, Francesc Rocadenbosch and Joaquim Sospedra
Remote Sens. 2021, 13(20), 4167; https://doi.org/10.3390/rs13204167 - 18 Oct 2021
Cited by 10 | Viewed by 2044
Abstract
This study presents a new method for correcting the six degrees of freedom motion-induced error in ZephIR 300 floating Doppler Wind-LiDAR-derived data, based on a Robust Adaptive Unscented Kalman Filter. The filter takes advantage of the known floating Doppler Wind-LiDAR (FDWL) dynamics, a [...] Read more.
This study presents a new method for correcting the six degrees of freedom motion-induced error in ZephIR 300 floating Doppler Wind-LiDAR-derived data, based on a Robust Adaptive Unscented Kalman Filter. The filter takes advantage of the known floating Doppler Wind-LiDAR (FDWL) dynamics, a velocity–azimuth display algorithm, and a wind model describing the LiDAR-retrieved wind vector without motion influence. The filter estimates the corrected wind vector by adapting itself to different atmospheric and motion scenarios, and by estimating the covariance matrices of related noise processes. The measured turbulence intensity by the FDWL (with and without correction) was compared against a reference fixed LiDAR over a 25-day period at “El Pont del Petroli”, Barcelona. After correction, the apparent motion-induced turbulence was greatly reduced, and the statistical indicators showed overall improvement. Thus, the Mean Difference improved from −1.70% (uncorrected) to 0.36% (corrected), the Root Mean Square Error (RMSE) improved from 2.01% to 0.86%, and coefficient of determination improved from 0.85 to 0.93. Full article
Show Figures

Figure 1

19 pages, 8043 KiB  
Article
CryoSat-2 Significant Wave Height in Polar Oceans Derived Using a Semi-Analytical Model of Synthetic Aperture Radar 2011–2019
by Harold Heorton, Michel Tsamados, Thomas Armitage, Andy Ridout and Jack Landy
Remote Sens. 2021, 13(20), 4166; https://doi.org/10.3390/rs13204166 - 18 Oct 2021
Cited by 3 | Viewed by 2286
Abstract
This paper documents the retrieval of significant ocean surface wave heights in the Arctic Ocean from CryoSat-2 data. We use a semi-analytical model for an idealised synthetic aperture satellite radar or pulse-limited radar altimeter echo power. We develop a processing methodology that specifically [...] Read more.
This paper documents the retrieval of significant ocean surface wave heights in the Arctic Ocean from CryoSat-2 data. We use a semi-analytical model for an idealised synthetic aperture satellite radar or pulse-limited radar altimeter echo power. We develop a processing methodology that specifically considers both the Synthetic Aperture and Pulse Limited modes of the radar that change close to the sea ice edge within the Arctic Ocean. All CryoSat-2 echoes to date were matched by our idealised echo revealing wave heights over the period 2011–2019. Our retrieved data were contrasted to existing processing of CryoSat-2 data and wave model data, showing the improved fidelity and accuracy of the semi-analytical echo power model and the newly developed processing methods. We contrasted our data to in situ wave buoy measurements, showing improved data retrievals in seasonal sea ice covered seas. We have shown the importance of directly considering the correct satellite mode of operation in the Arctic Ocean where SAR is the dominant operating mode. Our new data are of specific use for wave model validation close to the sea ice edge and is available at the link in the data availability statement. Full article
(This article belongs to the Special Issue Remote Sensing of Changing Arctic Sea Ice)
Show Figures

Figure 1

19 pages, 3142 KiB  
Article
Improving Estimates of Soil Salt Content by Using Two-Date Image Spectral Changes in Yinbei, China
by Xibo Xu, Yunhao Chen, Mingguo Wang, Sijia Wang, Kangning Li and Yongguang Li
Remote Sens. 2021, 13(20), 4165; https://doi.org/10.3390/rs13204165 - 18 Oct 2021
Cited by 10 | Viewed by 1799
Abstract
Soil salt content (SSC) is normally featured with obvious spatiotemporal variations in arid and semi-arid regions. Space factors such as elevation, temperature, and spatial locations are usually used as input variables for a model to estimate the SSC. However, whether temporal patterns of [...] Read more.
Soil salt content (SSC) is normally featured with obvious spatiotemporal variations in arid and semi-arid regions. Space factors such as elevation, temperature, and spatial locations are usually used as input variables for a model to estimate the SSC. However, whether temporal patterns of salt-affected soils (identified as temporal spectral patterns) can indicate the SSC level and be applied as a covariate in a model to estimate the SSC remains unclear. Hence, temporal changes in soil spectral patterns need to be characterized and explored as to their use as an input variable to improve SSC estimates. In this study, a total of 54 field samples and a time-series of Sentinel-2 multispectral images taken at monthly intervals (from October 2017 to April 2018) were collected in the Yinbei area of western China. Then, two-date satellite images were used to quantify significant spectral changes over time using spectral change vector analysis, and four two-date-based index methods were used to characterize soil spectral changes. Lastly, the optimal two-date-based spectral indices and multispectral bands were used as input variables to build the estimation models using a random forest algorithm. Results showed that the two-date-based spectral index could be applied as an input variable to improve the accuracy of SSC estimation at a regional scale. Temporal changes in salt-induced spectral patterns can be indicated by the band difference in the wavelength range from 400 nm to 900 nm. Three two-date-based indices designated as D28a (i.e., the band difference between band 2 from an image acquired in April 2018 and band 8a from an image acquired in December 2017), D22, and D28 were the optimal parameters for characterizing salt-induced spectral changes, which were dominated by the total brightness, chloride, and sulfate accumulation of the soils. The model did not yield satisfactory estimation results (RPD = 1.49) when multispectral bands were used as the input variables. Multispectral bands coupled with two two-date-based indices (D22 and D28a) used as the input variables produced the best estimation result (R2 = 0.92, RPD = 3.27). Incorporating multispectral bands and two-date-based indices into the random forest model provides a remotely-sensed strategy that effectively supports the monitoring of soil salt content. Full article
(This article belongs to the Section Biogeosciences Remote Sensing)
Show Figures

Graphical abstract

21 pages, 4009 KiB  
Article
Improved Calibration of Wind Estimates from Advanced Scatterometer MetOp-B in Korean Seas Using Deep Neural Network
by Sung-Hwan Park, Jeseon Yoo, Donghwi Son, Jinah Kim and Hyung-Sup Jung
Remote Sens. 2021, 13(20), 4164; https://doi.org/10.3390/rs13204164 - 18 Oct 2021
Cited by 5 | Viewed by 1834
Abstract
Satellite-based observations of sea wind are useful for forecasting marine weather and performing marine disaster management. Meteorological Operational Satellite-B (MetOp-B) is one of the satellites that provide wind products through a scatterometer named the Advanced Scatterometer (ASCAT). Since the linear regression method has [...] Read more.
Satellite-based observations of sea wind are useful for forecasting marine weather and performing marine disaster management. Meteorological Operational Satellite-B (MetOp-B) is one of the satellites that provide wind products through a scatterometer named the Advanced Scatterometer (ASCAT). Since the linear regression method has been conventionally employed for calibrating remotely-sensed wind data, deviations and biases remain un-resolved to some degree. For coastal applications, these remotely-sensed wind data need to be calibrated again using local in-situ measurements in order to provide more accurate and realistic information. Thus, this study proposed a new method to calibrate ASCAT-based wind speed estimates using artificial neural networks. Herein, a deep neural network (DNN) model was applied. Wind databases collected during a period from 2012 to 2019 by the MetOp-B ASCAT and ten buoy stations in Korean seas were considered for deep learning-based calibration. ASCAT-based wind data and in-situ measurements were collocated in space and time. They were then separated into training and validation sets. A DNN model was designed and trained using multiple input variables such as observation location, sensing date and time, wind speed, and wind direction of the training set. The DNN-based best fit calibration model was evaluated using the validation set. The mean of biases between ASCAT-based and in-situ wind speeds was found to be decreased from 0.41 to 0.05 m/s on average for all buoy locations. The root mean squared error (RMSE) of wind speed was reduced from 1.38 m/s to 0.93 m/s. Moreover, the DNN-based calibration considerably improved the quality of wind speeds of less than 4 m/s, and of high wind speeds of 11–25 m/s. These results suggest that ASCAT-based observations can accurately represent real wind fields if a DNN-based calibration approach is applied. Full article
Show Figures

Figure 1

31 pages, 12180 KiB  
Article
Exploring Fuzzy Local Spatial Information Algorithms for Remote Sensing Image Classification
by Anjali Madhu, Anil Kumar and Peng Jia
Remote Sens. 2021, 13(20), 4163; https://doi.org/10.3390/rs13204163 - 18 Oct 2021
Cited by 5 | Viewed by 2423
Abstract
Fuzzy c-means (FCM) and possibilistic c-means (PCM) are two commonly used fuzzy clustering algorithms for extracting land use land cover (LULC) information from satellite images. However, these algorithms use only spectral or grey-level information of pixels for clustering and ignore their spatial correlation. [...] Read more.
Fuzzy c-means (FCM) and possibilistic c-means (PCM) are two commonly used fuzzy clustering algorithms for extracting land use land cover (LULC) information from satellite images. However, these algorithms use only spectral or grey-level information of pixels for clustering and ignore their spatial correlation. Different variants of the FCM algorithm have emerged recently that utilize local spatial information in addition to spectral information for clustering. Such algorithms are seen to generate clustering outputs that are more enhanced than the classical spectral-based FCM algorithm. Nonetheless, the scope of integrating spatial contextual information with the conventional PCM algorithm, which has several advantages over the FCM algorithm for supervised classification, has not been explored much. This study proposed integrating local spatial information with the PCM algorithm using simpler but proven approaches from available FCM-based local spatial information algorithms. The three new PCM-based local spatial information algorithms: Possibilistic c-means with spatial constraints (PCM-S), possibilistic local information c-means (PLICM), and adaptive possibilistic local information c-means (ADPLICM) algorithms, were developed corresponding to the available fuzzy c-means with spatial constraints (FCM-S), fuzzy local information c-means (FLICM), and adaptive fuzzy local information c-means (ADFLICM) algorithms. Experiments were conducted to analyze and compare the FCM and PCM classifier variants for supervised LULC classifications in soft (fuzzy) mode. The quantitative assessment of the soft classification results from fuzzy error matrix (FERM) and root mean square error (RMSE) suggested that the new PCM-based local spatial information classifiers produced higher accuracies than the PCM, FCM, or its local spatial variants, in the presence of untrained classes and noise. The promising results from PCM-based local spatial information classifiers suggest that the PCM algorithm, which is known to be naturally robust to noise, when integrated with local spatial information, has the potential to result in more efficient classifiers capable of better handling ambiguities caused by spectral confusions in landscapes. Full article
(This article belongs to the Special Issue Advances in Optical Remote Sensing Image Processing and Applications)
Show Figures

Graphical abstract

35 pages, 2681 KiB  
Review
Surface Water Storage in Rivers and Wetlands Derived from Satellite Observations: A Review of Current Advances and Future Opportunities for Hydrological Sciences
by Fabrice Papa and Frédéric Frappart
Remote Sens. 2021, 13(20), 4162; https://doi.org/10.3390/rs13204162 - 18 Oct 2021
Cited by 26 | Viewed by 5676
Abstract
Surface water storage (SWS), the amount of freshwater stored in rivers/wetlands/floodplains/lakes, and its variations are key components of the water cycle and land surface hydrology, with strong feedback and linkages with climate variability. They are also very important for water resources management. However, [...] Read more.
Surface water storage (SWS), the amount of freshwater stored in rivers/wetlands/floodplains/lakes, and its variations are key components of the water cycle and land surface hydrology, with strong feedback and linkages with climate variability. They are also very important for water resources management. However, it is still very challenging to measure and to obtain accurate estimates of SWS variations for large river basins at adequate time/space sampling. Satellite observations offer great opportunities to measure SWS changes, and several methods have been developed combining multisource observations for different environments worldwide. With the upcoming launch in 2022 of the Surface Water and Ocean Topography (SWOT) satellite mission, which will provide, for the first time, direct estimates of SWS variations with an unprecedented spatial resolution (~100 m), it is timely to summarize the recent advances in the estimates of SWS from satellite observations and how they contribute to a better understanding of large-scale hydrological processes. Here, we review the scientific literature and present major results regarding the dynamic of surface freshwater in large rivers, floodplains, and wetlands. We show how recent efforts have helped to characterize the variations in SWS change across large river basins, including during extreme climatic events, leading to an overall better understanding of the continental water cycle. In the context of SWOT and forthcoming SWS estimates at the global scale, we further discuss new opportunities for hydrological and multidisciplinary sciences. We recommend that, in the near future, SWS should be considered as an essential water variable to ensure its long-term monitoring. Full article
(This article belongs to the Special Issue Applications of Remote Sensing for Resources Conservation)
Show Figures

Graphical abstract

10 pages, 1985 KiB  
Article
Ionization in the Earth’s Atmosphere Due to Isotropic Energetic Electron Precipitation: Ion Production and Primary Electron Spectra
by Irina Mironova, Gennadiy Kovaltsov, Alexander Mishev and Anton Artamonov
Remote Sens. 2021, 13(20), 4161; https://doi.org/10.3390/rs13204161 - 18 Oct 2021
Cited by 9 | Viewed by 2007
Abstract
Energetic electron precipitation (EEP) via atmospheric ion production rates is a natural force acting on the atmosphere and climate systems. The correct estimation of EEP ion production and spectra for the computation of ionization rates is an important issue for estimating climate forces. [...] Read more.
Energetic electron precipitation (EEP) via atmospheric ion production rates is a natural force acting on the atmosphere and climate systems. The correct estimation of EEP ion production and spectra for the computation of ionization rates is an important issue for estimating climate forces. In the present paper, we propose a favorable method for the computation of ionization rates forced by EEP using the new parameterization of ion production and a new spectrum shape, which allow one to take into account the range of precipitating particles from tens of keV to several MeV. A new function of spectral fit will also be helpful in obtaining information about EEP from satellite and balloon observations. Presented here, the parameterization of atmospheric ionization in the Earth’s atmosphere includes a new yield function of isotropically precipitating monoenergetic electrons and ionization via Bremsstrahlung radiation. Look-up tables with ion production/yield function for isotropically precipitating monoenergetic electrons (30 keV–5 MeV) can be easily used for the computation of ionization rates and can further be used by atmospheric and chemistry-climate models for accurate quantification of atmospheric parameters during energetic electron precipitation. Full article
Show Figures

Figure 1

Previous Issue
Back to TopTop