Article

Identification of Amaranthus Species Using Visible-Near-Infrared (Vis-NIR) Spectroscopy and Machine Learning Methods

1
Department of Agricultural Biotechnology, National Institute of Agricultural Sciences, Rural Development Administration, Jeonju 54874, Korea
2
Institute for Future Environmental Ecology Co., Ltd., Jeonju 54883, Korea
3
Institute of Ecological Phytochemistry, Hankyong National University, Anseong 17579, Korea
4
OJeong Resilience Institute, Korea University, Seoul 02841, Korea
5
Department of Food Science and Technology, Kwame Nkrumah University of Science and Technology (KNUST), Kumasi 0233, Ghana
*
Author to whom correspondence should be addressed.
Remote Sens. 2021, 13(20), 4149; https://doi.org/10.3390/rs13204149
Submission received: 16 September 2021 / Revised: 15 October 2021 / Accepted: 15 October 2021 / Published: 16 October 2021
(This article belongs to the Special Issue Remote Sensing of Ecosystems)

Abstract

:
The feasibility of rapid and non-destructive classification of six different Amaranthus species was investigated using visible-near-infrared (Vis-NIR) spectra coupled with chemometric approaches. The focus of this research would be to use a handheld spectrometer in the field to classify six Amaranthus sp. in different geographical regions of South Korea. Spectra were obtained from the adaxial side of the leaves at 1.5 nm intervals in the Vis-NIR spectral range between 400 and 1075 nm. The obtained spectra were assessed with four different preprocessing methods in order to detect the optimum preprocessing method with high classification accuracy. Preprocessed spectra of six Amaranthus sp. were used as input for the machine learning-based chemometric analysis. All the classification results were validated using cross-validation to produce robust estimates of classification accuracies. The different combinations of preprocessing and modeling were shown to have a classification accuracy of between 71% and 99.7% after the cross-validation. The combination of Savitzky-Golay preprocessing and Support vector machine showed a maximum mean classification accuracy of 99.7% for the discrimination of Amaranthus sp. Considering the high number of spectra involved in this study, the growth stage of the plants, varying measurement locations, and the scanning position of leaves on the plant are all important. We conclude that Vis-NIR spectroscopy, in combination with appropriate preprocessing and machine learning methods, may be used in the field to effectively classify Amaranthus sp. for the effective management of the weedy species and/or for monitoring their food applications.

1. Introduction

Amaranthus is a cosmopolitan genus of herbs with about 70 species of plants worldwide, and about nine species have been introduced into Korea [1]. It is widely distributed from temperate regions to tropical regions worldwide, and it is very difficult to distinguish morphologically due to a lot of intra-species hybridization [2]. The genus Amaranthus, introduced into Korea, is mainly distributed in areas with relatively large ecosystem disturbances, such as agricultural land, roadside, bare land, and riverside. Some important species are slender amaranth (Amaranthus viridis L.), livid pigweed (A. lividus L.), spiny amaranth (A. spinosus L.), red-root amaranth (A. retroflexus L.), speen amaranth (A. patulus Bertoloni.), Powell’s amaranth or green amaranth (A. powellii S. Watson), slim amaranth (A. hybridus L.), tumbleweed (A. albus L.), sand amaranth (A. arenicola Johnst.), Palmer amaranth (A. palmeri S. Watson) [3]. Though Amaranthus sp. are widespread in agriculture and are observable throughout life, a new classification technique is needed because they are difficult to distinguish and manage, particularly for quality control purposes [4]. Furthermore, plant databases are becoming increasingly important in order to conserve endemic plants and classify the floral diversity of various species [5]. Species identification of plants by leaf analysis is an important aspect of botany that is gaining more interest in study for a variety of reasons, from industrial benefits to endangered species protection [6]. In addition, nearly all Amaranthus sp. are edible, but varieties sold for eating have been selected for their good seed production and tasty leaves which are believed to be rich in Vitamin C and iron with a taste rather like spinach [7].
Generally, the large number of plant species worldwide necessitates the adaption and development of rapid and competent classification techniques which have become an active area of research [8]. The basic chemical methods based on isoenzymes or DNA analysis are also used for classification [9]. However, these methods are labor-intensive, time-consuming and cannot be performed under field conditions [9]. Furthermore, sample preparation procedures pose additional cost, time and technical accuracy issues, indicating the need for a non-invasive alternative approach with better advantages [10,11]. Rapid non-invasive approaches with remote analysis are constantly sorted to pace-up with the huge volumes of available plant species for nutritional, economical and historical value [8,9].
Visible and Near-Infrared (Vis-NIR) spectroscopy is one such method that has recently been employed in multiple studies for component detection and authentication purposes [8]. Vis-NIR spectroscopy is a non-destructive analytical method with the advantages of simple preprocessing and fast data acquisition methods that may be applied in the agricultural industry for monitoring and quality control [9,12]. It is a quantitative method based on Lambert Beer’s law, which states that when specific functional groups in a sample are exposed to Vis-NIR rays, they cause molecular vibrations and absorb light of a specific wavelength [13]. The degree of absorption is proportional to the concentration of functional groups in the sample. Recently, Vis-NIR spectroscopy has been used to accurately identify important chemical components in the pharmaceutical, food and agricultural industries [9]. Their potential for precise and reliable detection of plants is also being investigated [14,15,16]. According to the literature, Vis-NIR spectroscopy is frequently used in combination with various chemometric and multivariate analyses which are selected based on the objectives of the study [9,12,17]. Among these techniques, supervised and non-supervised classification techniques are the most commonly used techniques and they are based on the fact that samples with similar spectral responses are similar in physical, chemical, and biochemical properties [18]. NIR/Vis-NIR spectroscopy techniques have been used to identify chemical properties in recent studies. The near-infrared spectrum has been used to identify a variety of substances, including water physicochemical content, cellulose, lignin, cutin, and xylan [19,20,21], protein powder [22] and even in genetically modified foods. These were all achieved through the so-called “fingerprint” method, where a unique spectrum/spectra can be used to define a particular component in the analytes [23].
Changes in Vis-NIR spectra are often too small to notice with the human eye that is why the actual usefulness of Vis-NIR spectroscopy as an analytical tool is based on statistical and mathematical manipulation of the spectral data [9]. It is also important to state that the physical and the environment of experimental conditions can also influence spectra quality during the Vis-NIR spectroscopy analysis [24]. Therefore, preprocessing techniques have been proposed as one of the initial steps in the analysis of Vis-NIR spectroscopy data for optimized results [25,26]. The combination of appropriate preprocessing, chemometric tools and machine learning approaches with Vis-NIR spectroscopy has been used in various aspects of the agricultural sciences [9]. This tool has demonstrated excellent results in identifying plant species by measuring the near-infrared spectra of plant tissues (leaves, timber, bark) in tropical rain forests. Sandak et al., [27] developed models for the automated in-field determination of quality indices for log grading in mountain forests by means of a portable spectrometer. Durgante et al., [14] showed a high-level classification of closely related species between the Eschweilera and Corythophora (Lecythidaceae) of the central Amazon in the NIR spectral data from dry leaves.
Despite all this, there is no information on the development of a classification model based on Vis-NIR spectroscopy and machine learning for Amaranthus sp. Hence, the present study aims to analyze the potential of Vis-NIR spectroscopy to discriminate the six Amaranthus sp. from different geographical locations in South Korea with different preprocessing and machine learning approaches.

2. Materials and Methods

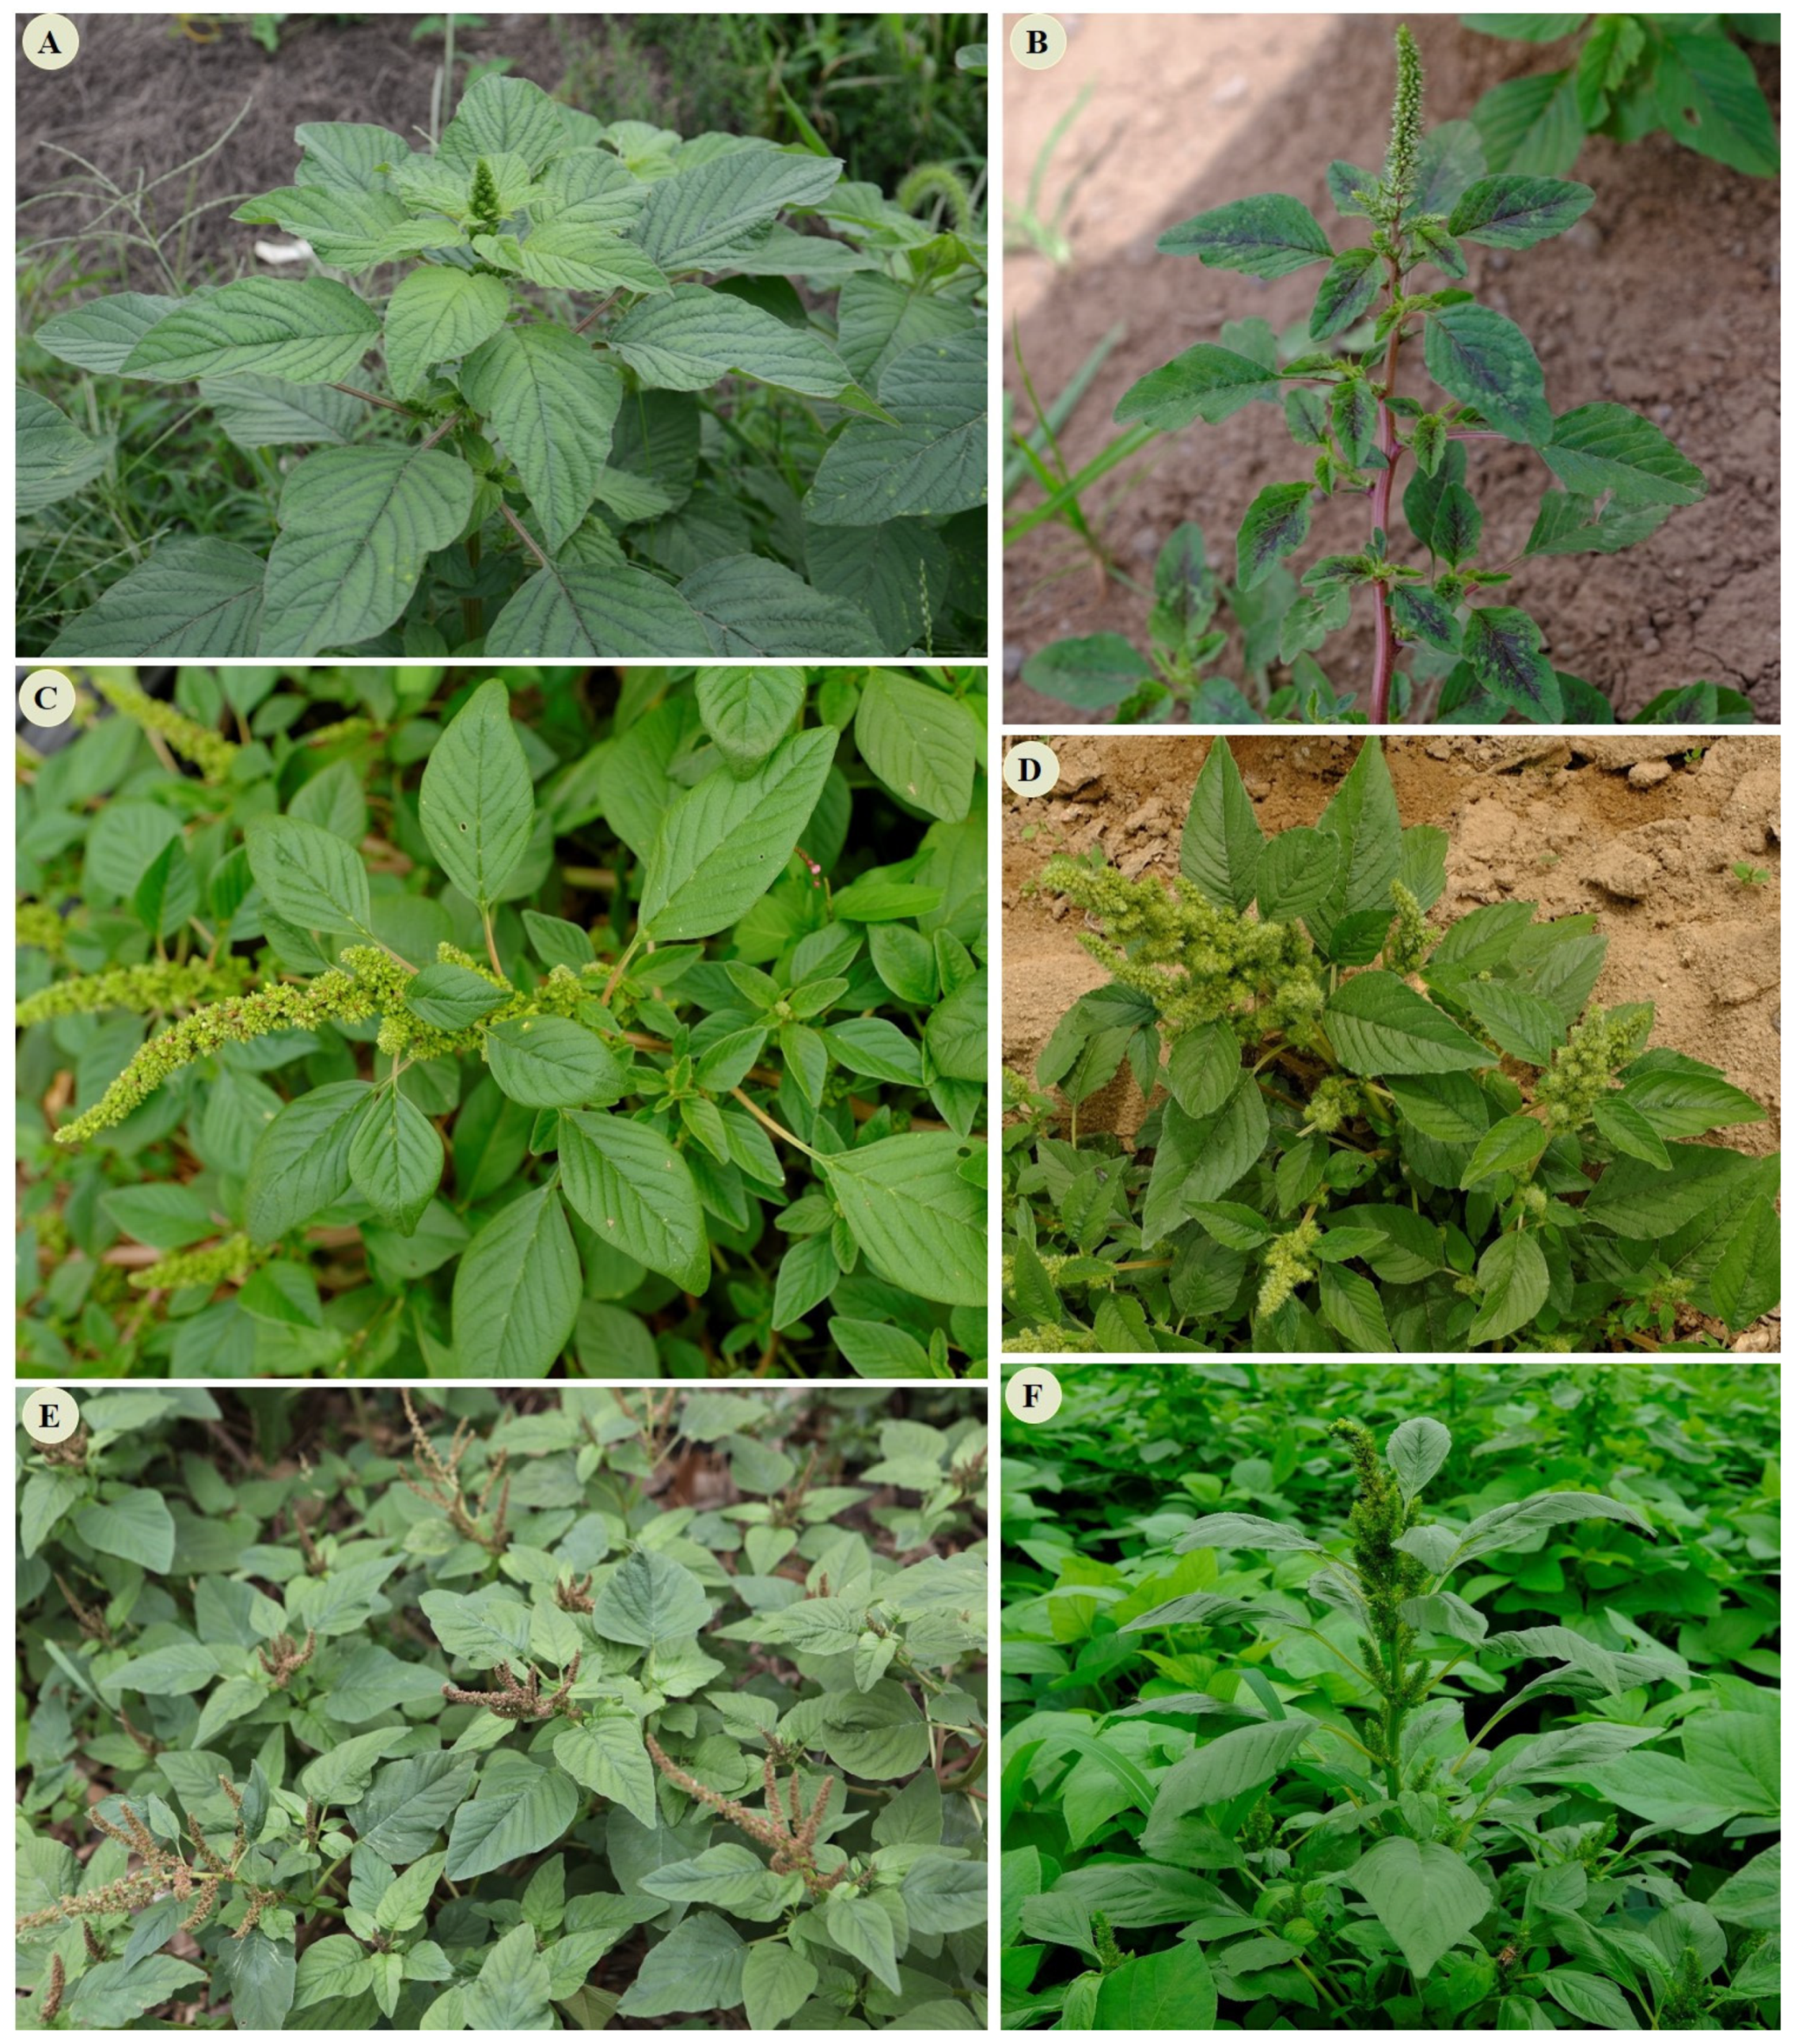
2.1. Plant Materials

Six Amaranthus sp. were identified and selected for species discrimination from six different geographical locations in Korea (Table 1). Details of Amaranthus sp., distribution, spectra collection sites, and number of measured spectra for each species were provided in Table 1. Different geographical locations have different environmental conditions. The typical images of the different Amaranthus sp. identified in the fields are shown in Figure 1. The study was performed from May to July 2019 in six different geographical regions of South Korea.

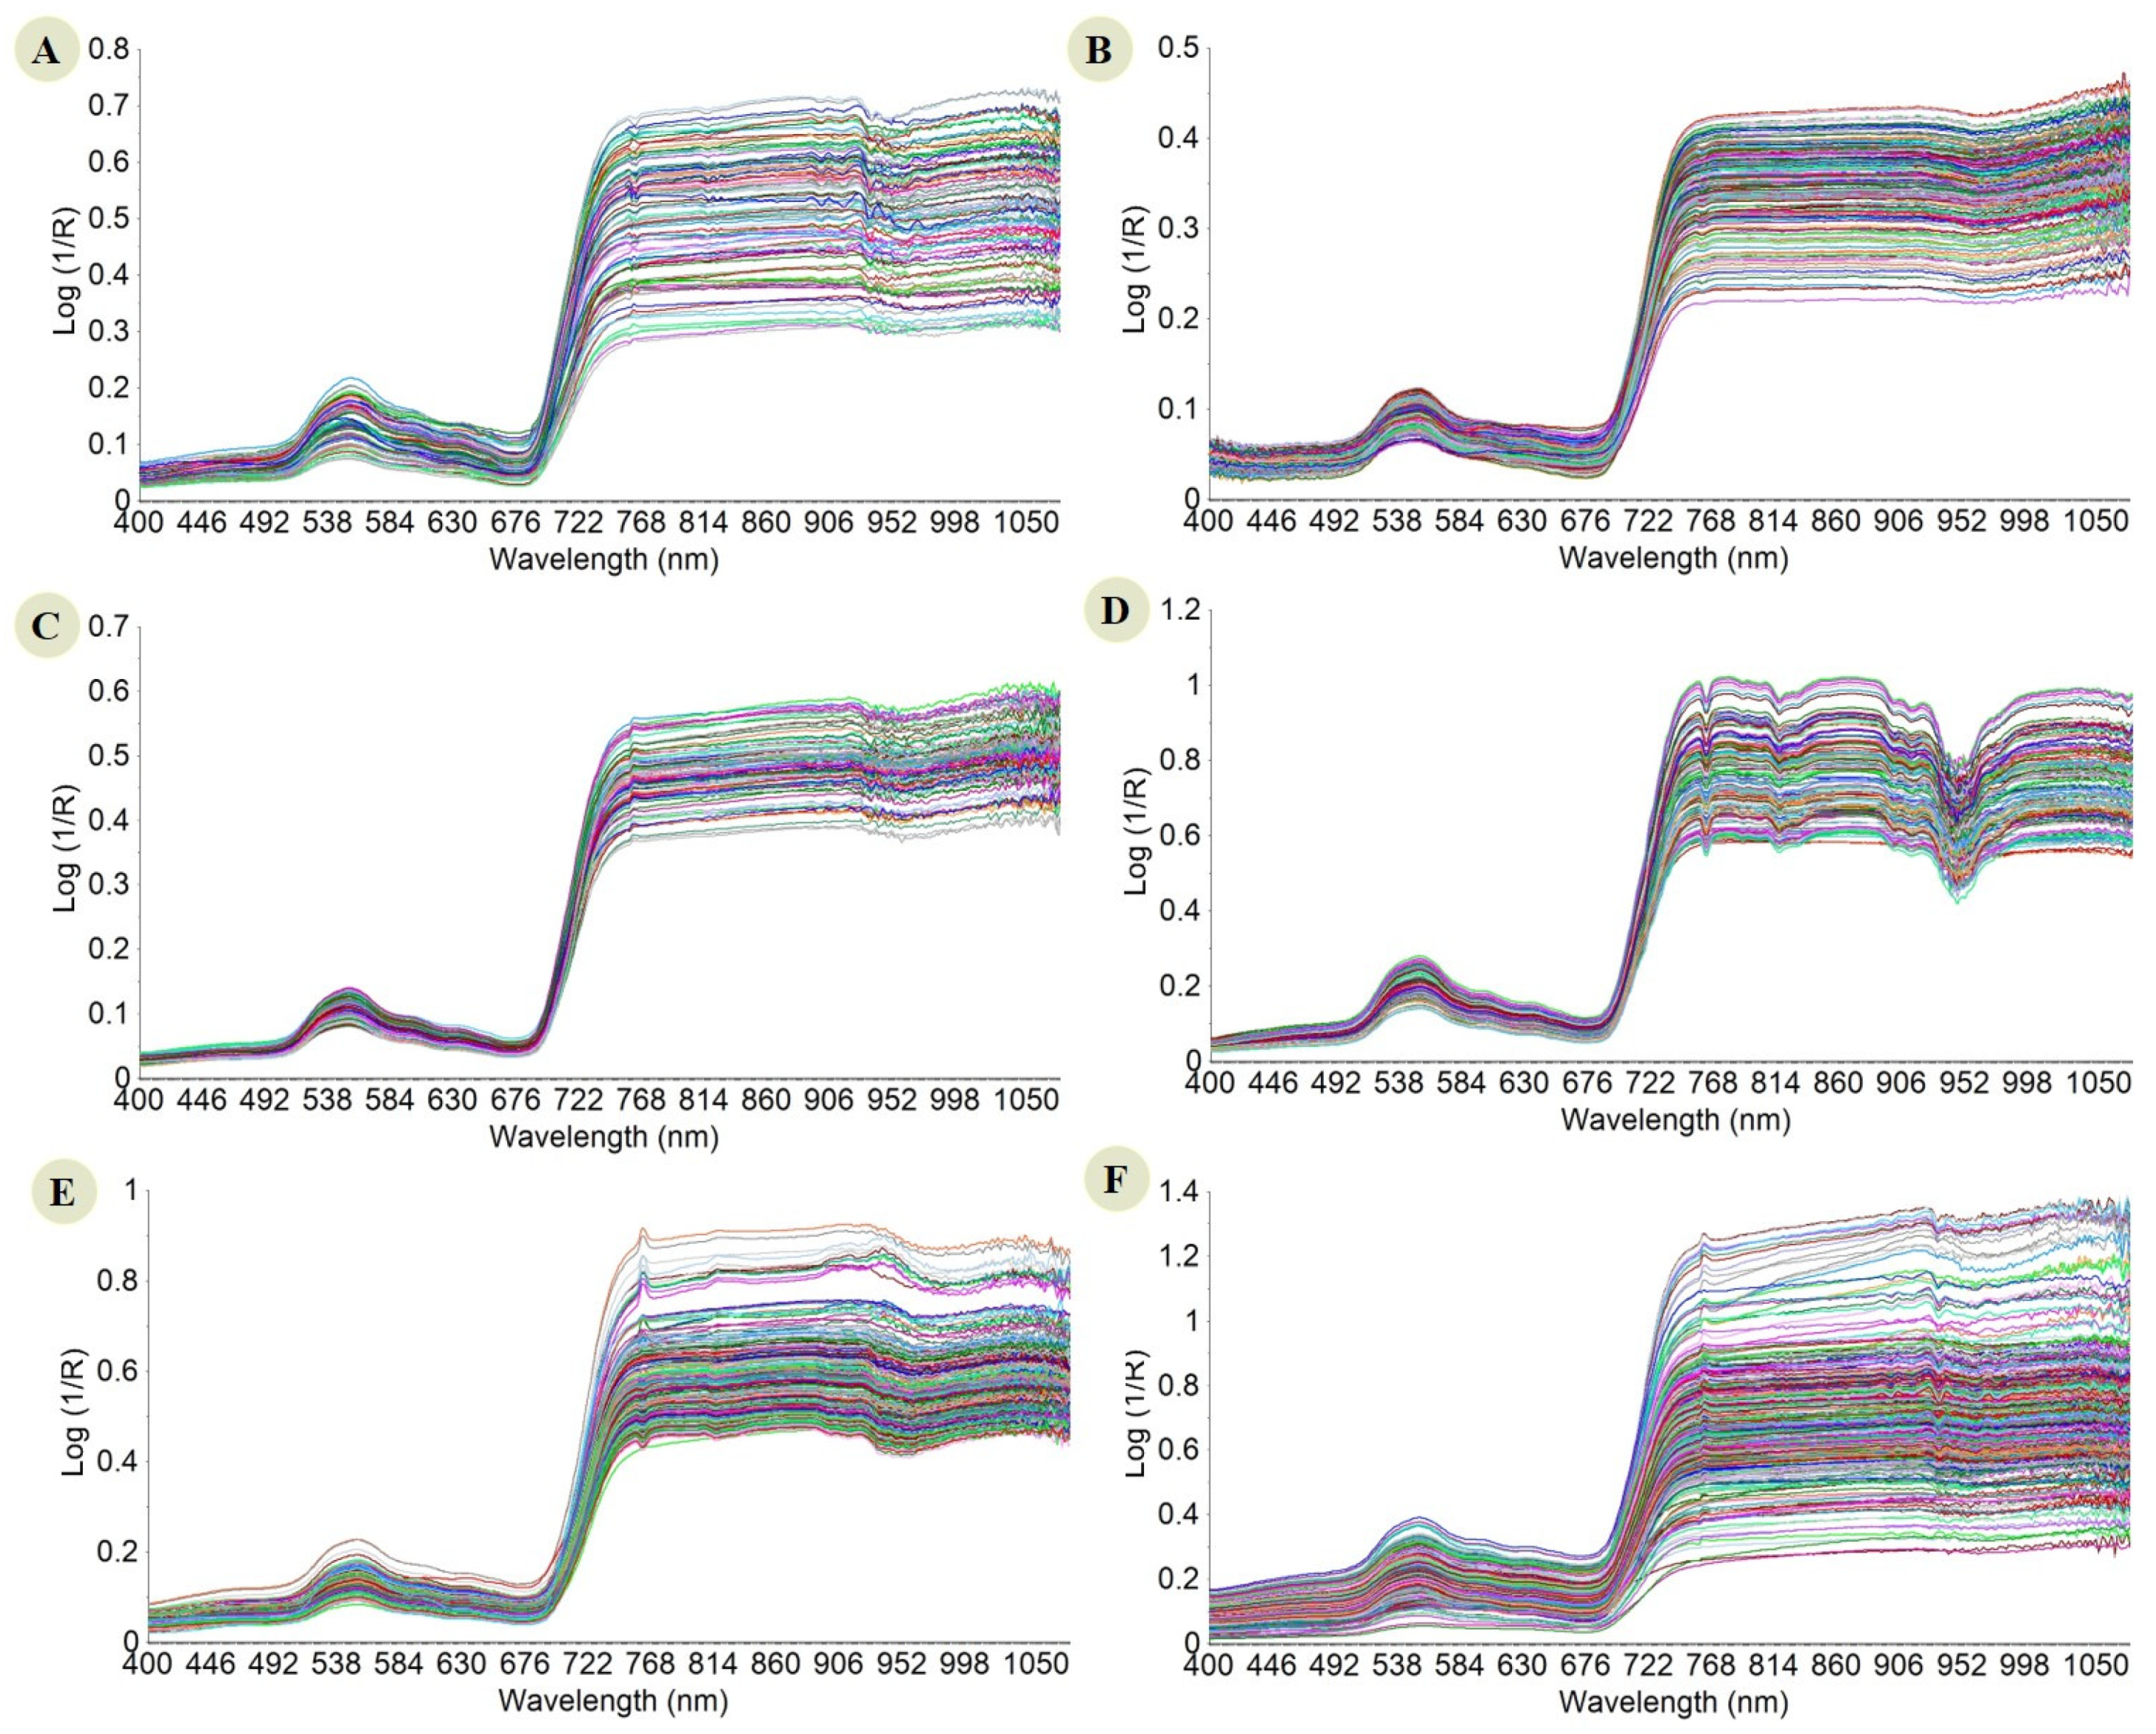
2.2. Spectral Measurement in the Field

For the visible and near-infrared (Vis-NIR) spectral acquisition, fully expanded leaves with no signs of disease or insect damage were selected and an integrated portable spectral analyzer (FieldSpec®® HandHeld 2, ASD Inc., Longmont, CO, USA), working in reflectance mode (log/R) in the range of 400–1075 nm with a stepping of 1.5 nm was used. Spectral measurement was performed directly on the adaxial surfaces of the leaves, which are most noted for light capturing. For each leaf, three spectra were taken from different spots of the leaf blade. During each acquisition, the optical window of the Vis-NIR device was placed in direct contact with the surface of the leaf, making sure that the sensor window was completely covered. To avoid the contamination of the adaxial surfaces with external pollutants, vinyl gloves were used at all times when handling the leaves.

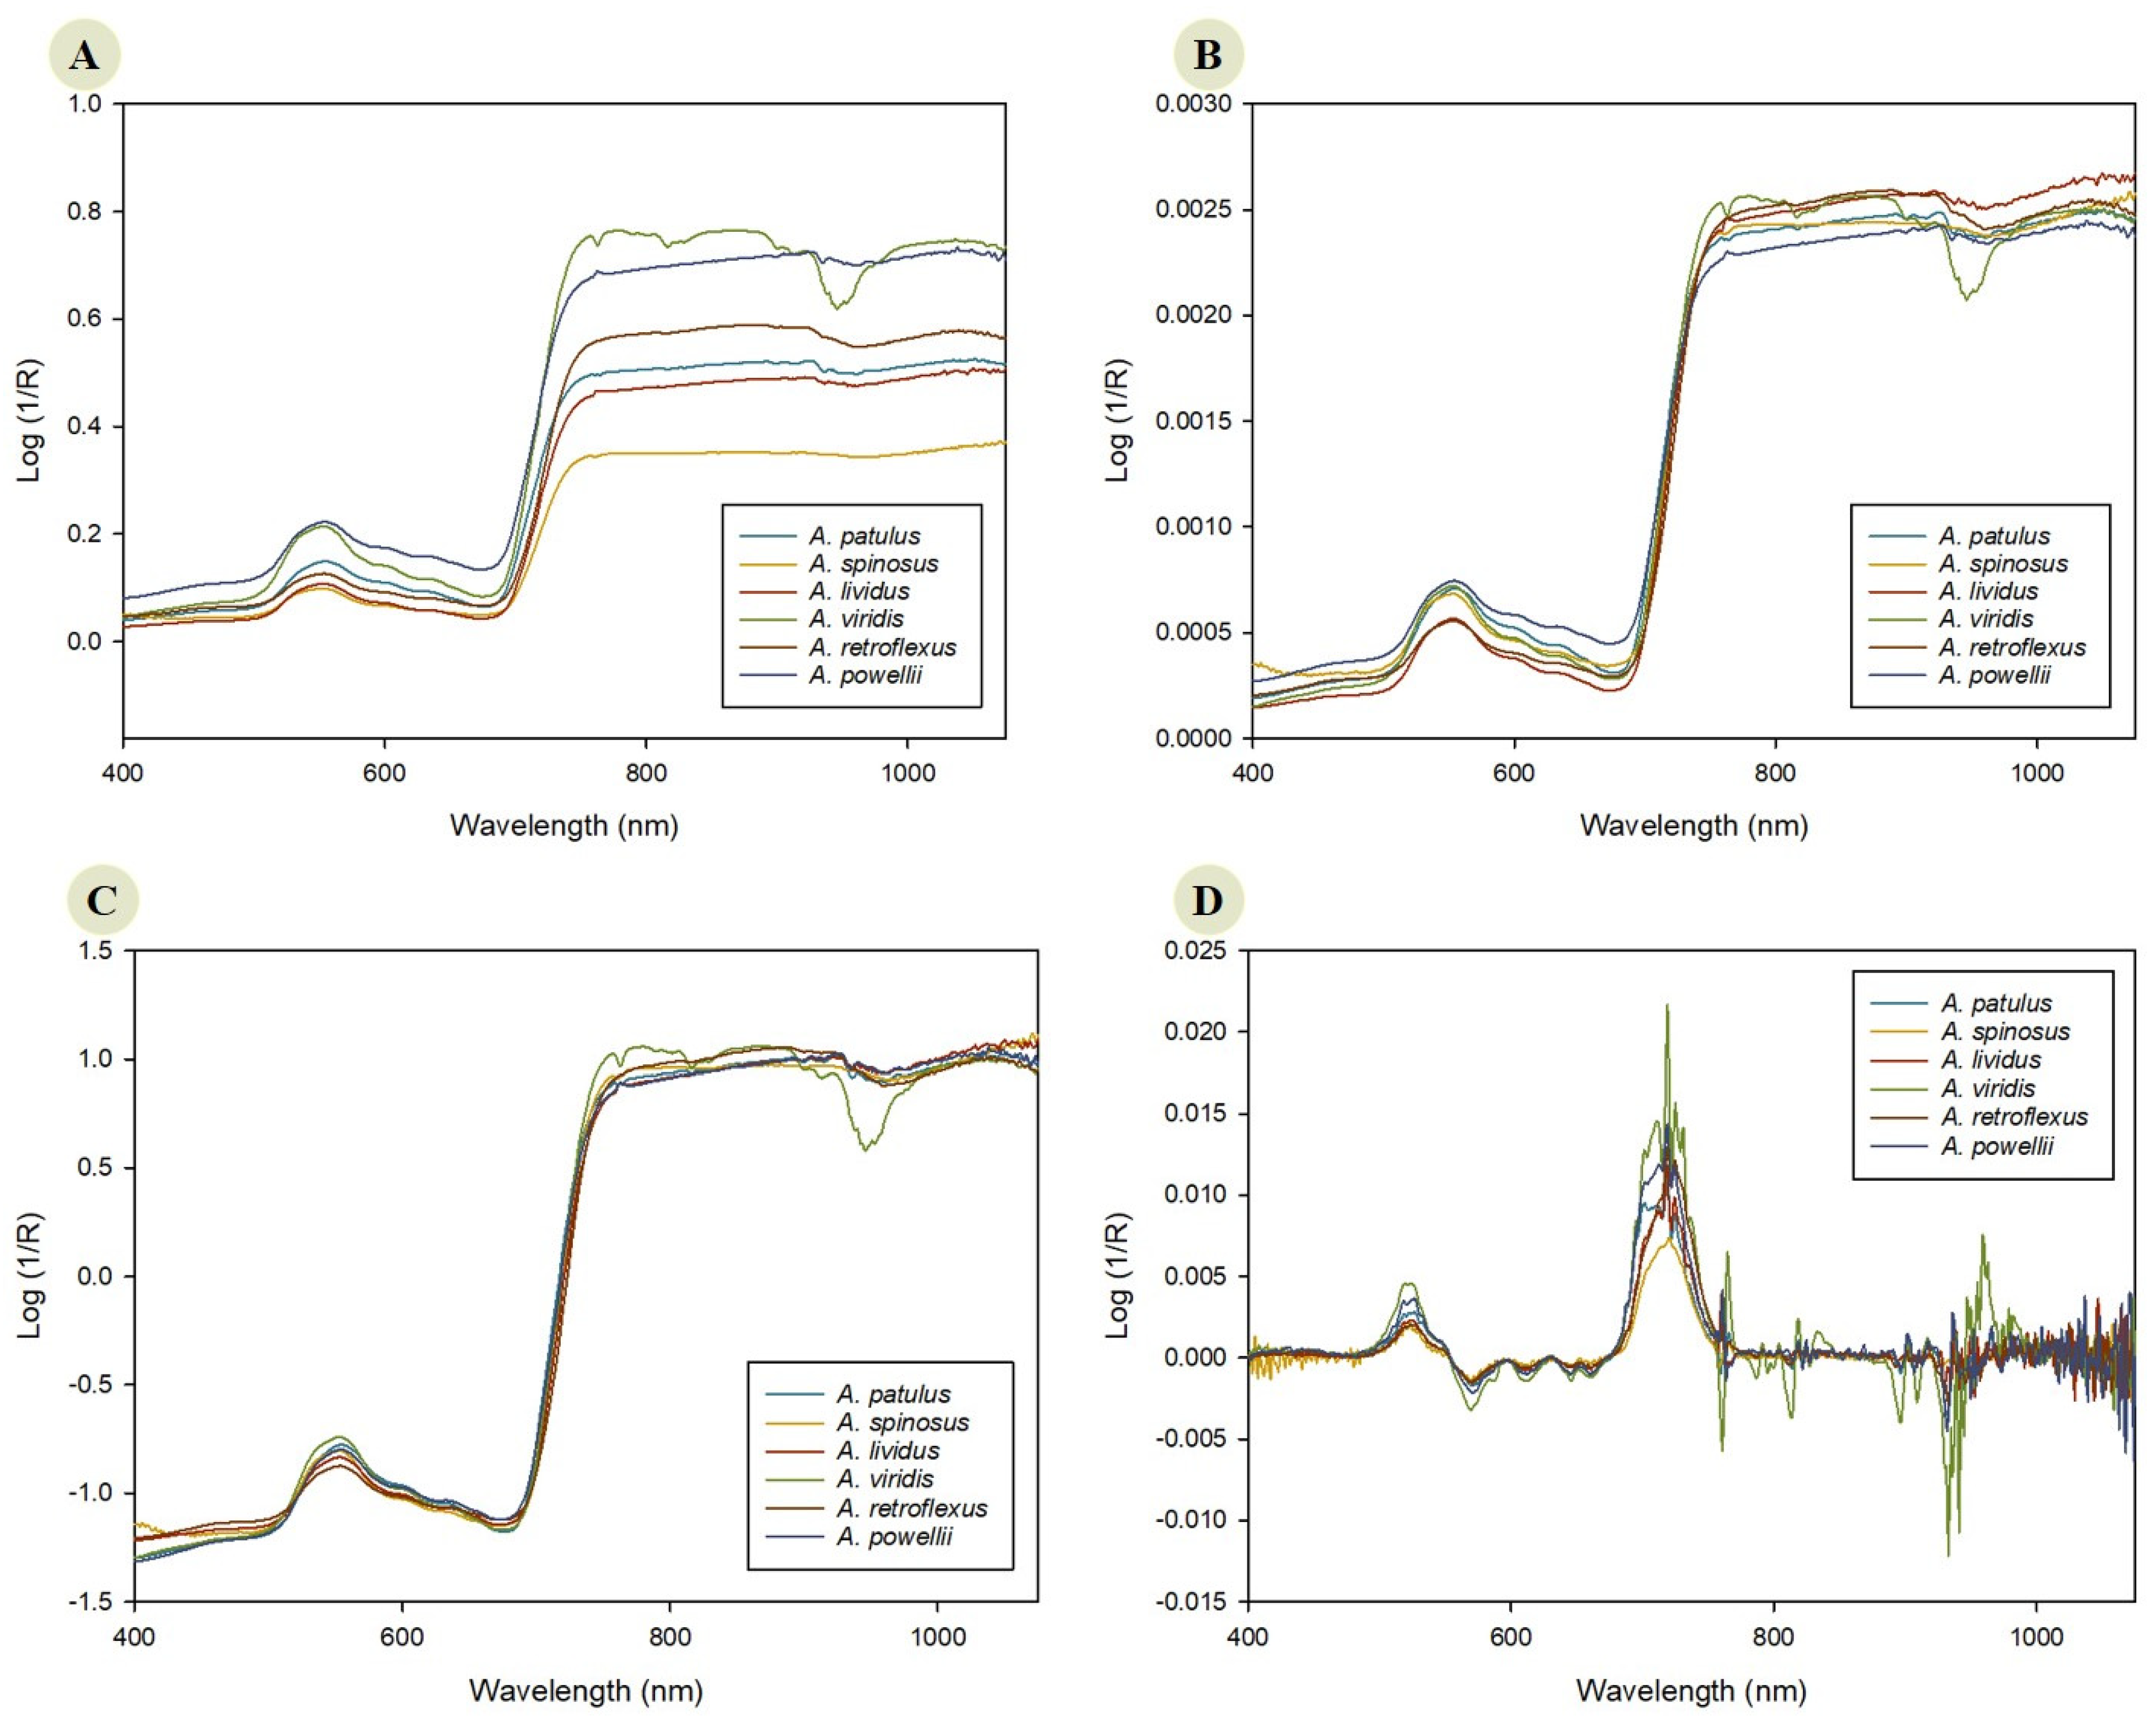
2.3. Preprocessing of Spectral Data

The initial spectrum comprised not only sample-related information, but also noise signal generated by different variables, which not only interfered with spectral information, but also hampered the model’s creation and prediction of unknown sample composition or characteristics. To obtain the best discrimination model, four different types of spectral preprocessing techniques were used. These included no treatment (raw data), normalization, Savitzky-Golay [28], and standard normal variate [29] to find an optimal preprocessing method that removes noise from the spectral data and improves predictability of the classification models. All the computations were carried out on Unscrambler®® X software, version 10.5.1 (CAMO ASA, Oslo, Norway).

2.4. Modeling and Statistical Analysis

To analyze the data extracted from the Vis-NIR spectroscopy, a data mining model was developed. Model construction was performed with RapidMiner studios Version 9.0.002 (Rapidminer, Inc., Boston, MA, USA). Rapid miner is a software used for data mining and machine learning. It was used to apply different algorithms on the dataset, and the performance of each algorithm could be easily evaluated using the performance operator. Four classification algorithms, namely the Support Vector Machine [30], Generalized Linear Model [31], Decision Tree, and Naïve Bayes were used to find the best modeling approach with higher classification accuracy. For each algorithm, the inputs were provided as the data points of the spectra (absorbance values of wavelengths 400 nm to 1075 nm, with a stepping of 1.5 nm) and the classes were the identification labels of each Amaranthus sp. All the classification results were validated using cross-validation to obtain robust estimates of classification accuracies of the experiments [32]. One-way analysis of variance (ANOVA) was performed when comparing means for testing the influence of:
(i)
The application of a scatter correction method;
(ii)
The four classification algorithms and,
(iii)
The interaction of the two precious factors.
Tukey’s range test was used as mean comparison method at a significance level of p ≤ 0.05.

3. Results

3.1. VNIR Spectra and Data Preprocessing

Raw spectra (without preprocessing) collected from the leaves of six Amarnathus sp. are shown in Figure 2a–f. The X-axis represented the wavelength and the Y-axis indicated the spectral absorbance (Figure 2). With the exception of A. viridis, no clear differences could be visualized in the spectral patterns of the analyzed species (Figure 2a–f), but the average spectral curves of Amaranthus sp. were somewhat different, suggesting the need for more detailed mathematical analysis. The differences among the six Amaranthus sp. were further visualized in PCA analysis, which showed 89.35% of the variance being expressed in the PC1. The different species could be slightly visually separated in the plot, with the exception of A. patulus, which overlapped with all the other species in the plot (Figure 3). Therefore, chemometric methods were introduced to build more reliable qualitative models for classification after outlier detection in PCA. Based on the visual inspection of the spectra prior to preprocessing and outlier detection in PCA, some of the spectra that could be affected by measurement errors were removed, and the final spectral library had a total of 6242 leaf spectra.

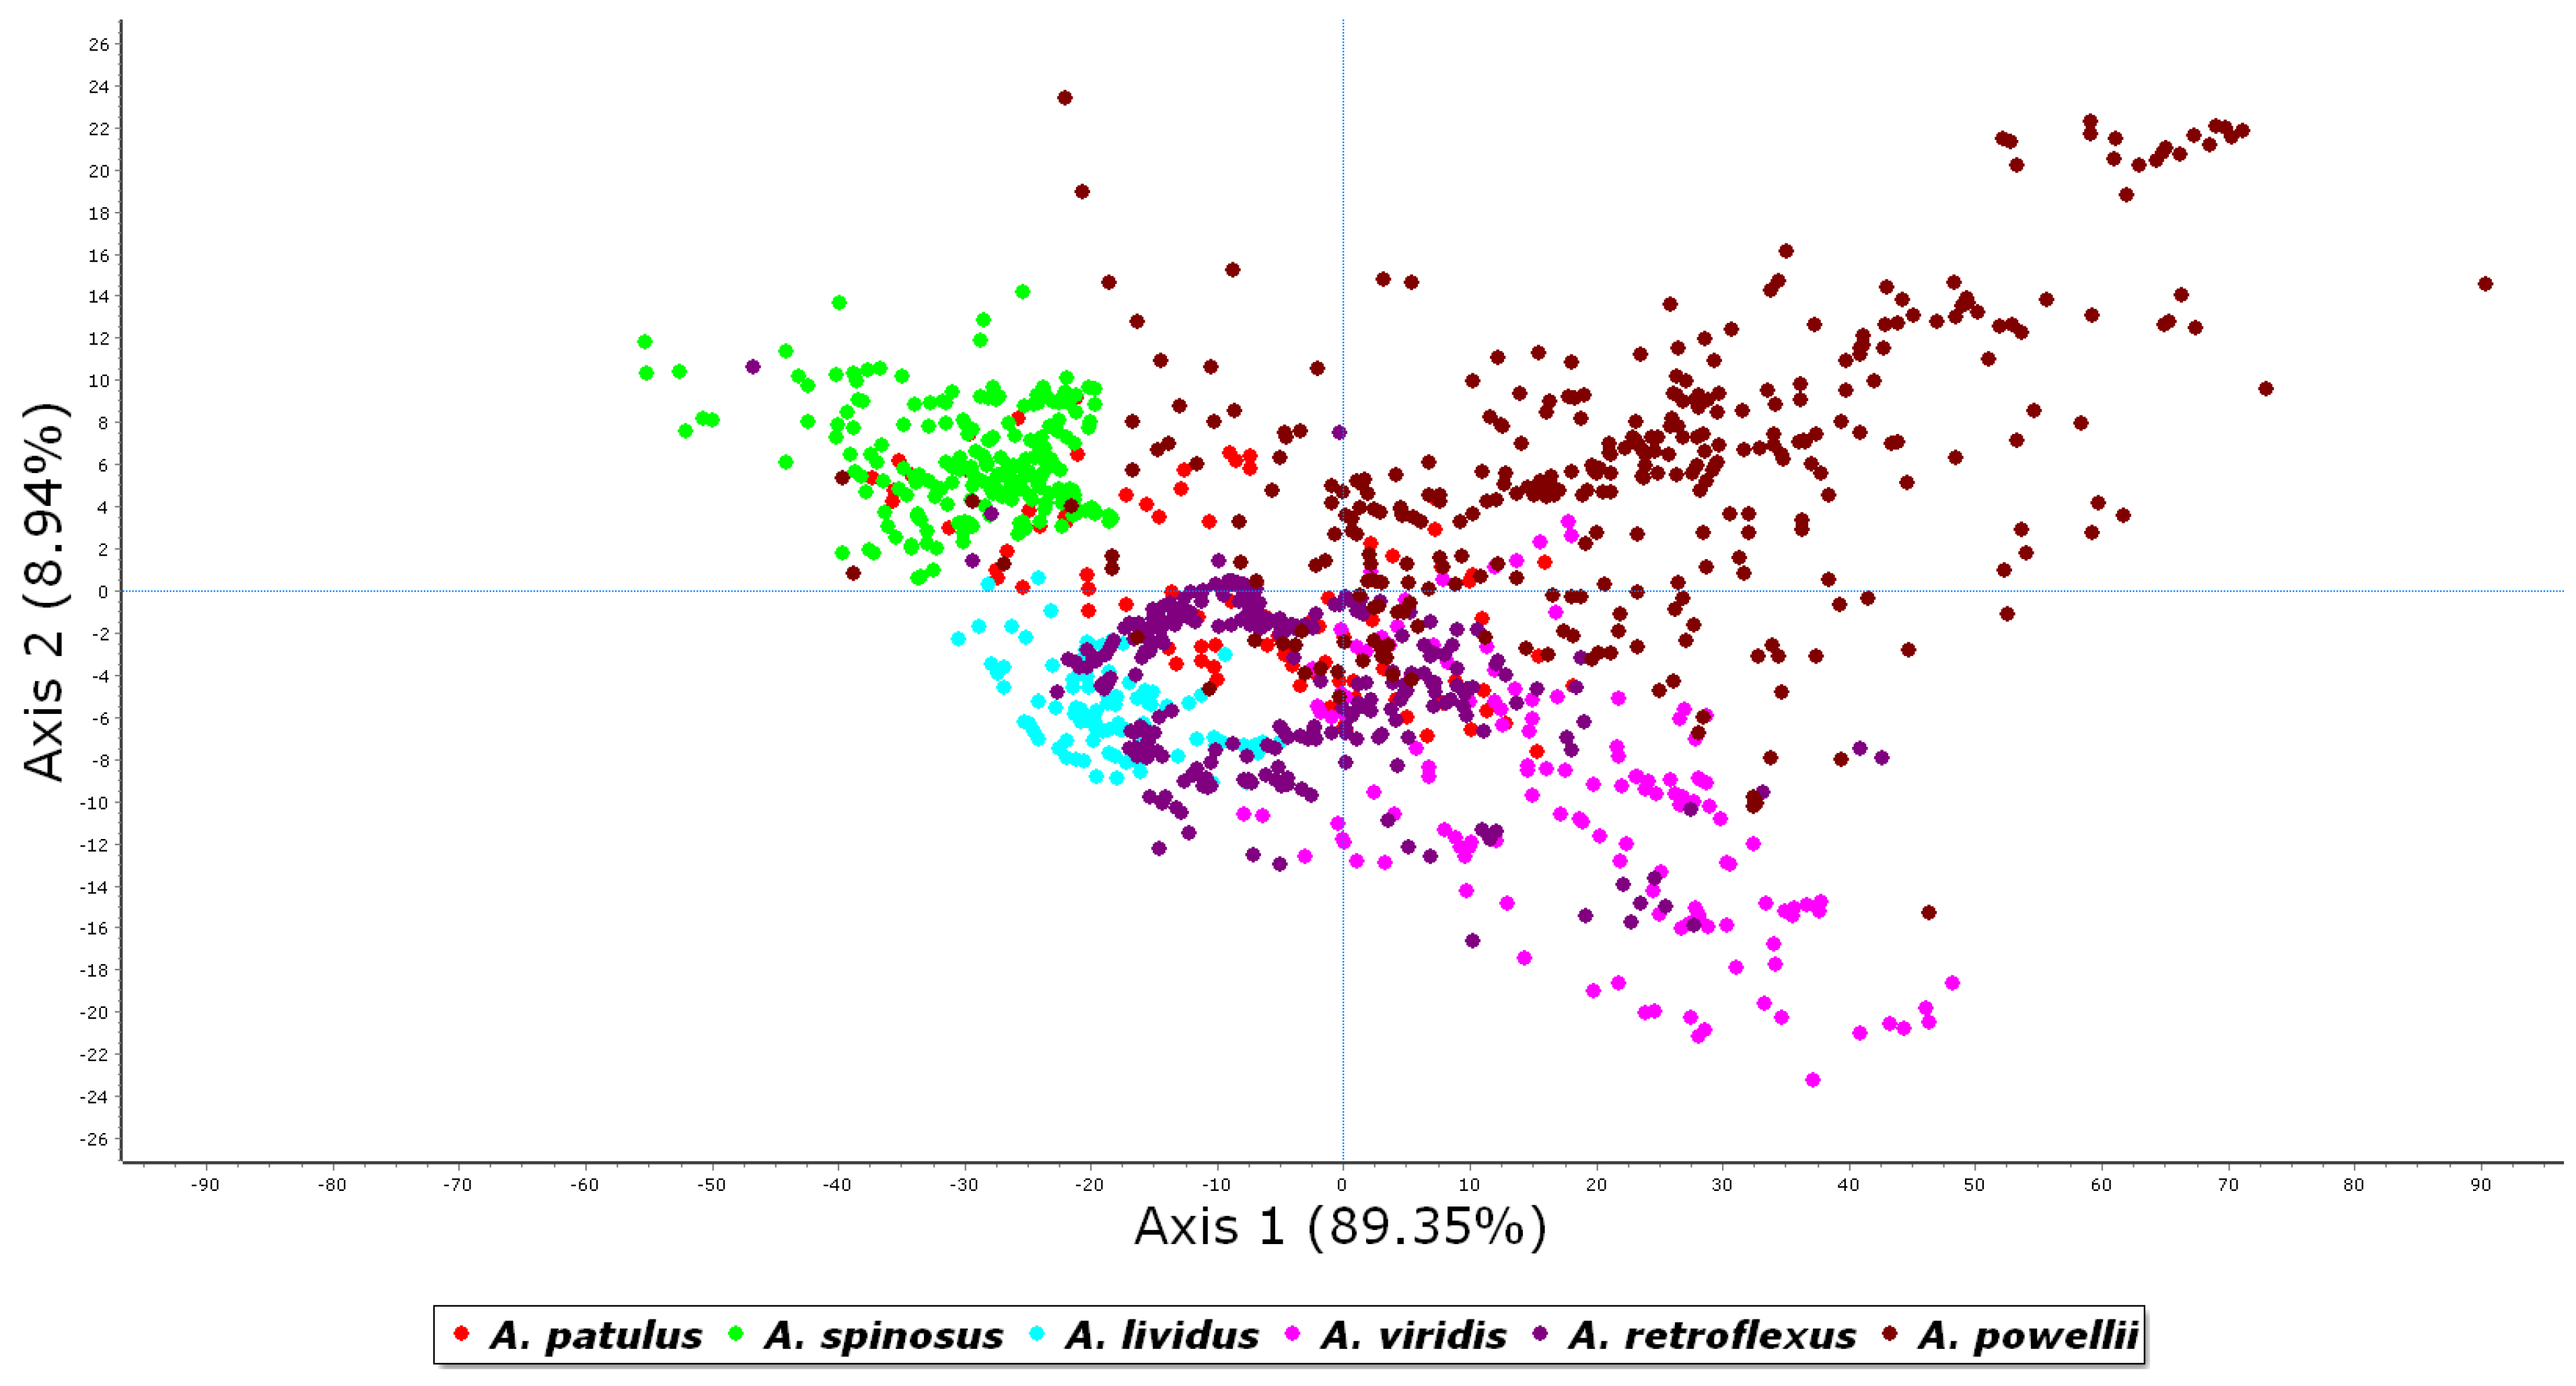
3.2. Chemometric Analysis-Based Species Discrimination

The classification accuracy of various machine learning approaches combined with different preprocessing methods was calculated to identify the precise method for the discrimination of Amaranthus sp. After the cross-validation, the classification accuracy ranges from 71% to 99.7% for the different classification models, according to the combination of preprocessing and models applied to the spectra (Table 2). For Support Vector Machine, preprocessing with Derivative (Savitzky-Golay) yielded the best classification accuracy of 99.7%. The best classification accuracy of 98% was also achieved using the Derivative (Savitzky-Golay) preprocessing for the Generalized Linear Model. For the Decision Tree and Naive Bayes classification models, the best classification accuracy of 89.6% and 89% respectively, was achieved using the Standard Normal Variate preprocessing technique. Overall, the Support Vector Machine yielded the highest classification accuracy among all the tested classification models when only raw spectra were used (98% with Savitzky-Golay Derivative).
In this study, normalization yielded the least performance accuracies method among the tested preprocessing methods (Table 2). Generalized Linear Model and Support Vector Machine accuracies were 93% and 91.3%, respectively, for normalization, whereas Naive Bayes and Decision Tree accuracies were 78.3% and 72.8%, respectively. With Savitzky-Golay preprocessing, the accuracies of Support Vector Machine and Generalized Linear Model were 99.7% and 98%, respectively, while Naive Bayes and Decision Tree were 87.5% and 89%, respectively. In the case of Standard Normal Variate preprocessing, Support Vector Machine showed 98.8% accuracy, Generalized Linear Model 92.5%, Naive Bayes 89%, and Decision Tree 89.6%. It is not certain whether Vis-NIR spectroscopy can be applied to varietal discrimination or classification of other plants, as there are numerous factors such as light conditions and the state of the spectrum acquisition device that can affect the results of applying spectral preprocessing methods.

3.3. Significance of Preprocessing and Selection of Optimal Classification Model

The effects of preprocessing and various modeling algorithms on spectral datasets obtained from six Amaranthus sp. were statistically analyzed (Table 3). The mean percentage of classification accuracy of each modeling method in combination with different preprocessing methods shows the significant modeling for the discrimination of Amaranthus sp. after the cross-validation (Table 3). Among them, the combination of the Generalized Linear Model and the preprocessing Savitzky-Golay was found to be significant. It was proven that using Savitzky-Golay preprocessing together with Support Vector Machine yielded the highest mean percentage of classification of 99.7%. ANOVA statistical analysis in Table 4 represents the effects of preprocessing and modeling approaches on species classification accuracy. The effects of preprocessing in the discrimination of Amaranthus sp. found to be very significant at p ≤ 0.05 (p-value of 0.0045) and the effects of modeling approaches were also analyzed to be very significant at p ≤ 0.05 (p-value of 0.0039). However, the combination of preprocessing and different models used together, there was no significance with p ≥ 0.05 (p-value of 0.0549). Table 5 shows the confusion matrix that confirms through the degree of error in the discrimination of different Amaranthus sp., also suggests that using Savitzky-Golay smoothing combined with Support Vector Machine was the most effective method for the classification. Among the six Amaranthus sp. except A. lividus, all five species (A. patulus, A. spinosus, A. viridis, A. retroflexus, and A. powellii) showed perfect scores (percentage of correct classification: 100%). In the case of A. lividus, when the accuracy of the spectrum was verified with this combination, there was only one misclassified instance with A. retroflexus.

4. Discussion

Field spectroscopy has been widely used for the effective discrimination of plant species in fields and forests. The main issue in this is distinguishing the derivation of spectral response among the different species [33,34]. Presently, NIR spectroscopy with the combination of machine learning approaches has solved the issues. Generally, the Vis-NIR spectra might have substantial noise from the instrument and the environment. To reduce noise and to obtain proper results, preprocessing methods are highly useful [35]. Fernández-Cabanás et al., [36] noted that the selection of a suitable spectral preprocessing is not easy because several different mathematical transformations are likely to be used. Different preprocessing methods lead to different prediction results. As shown in Figure 4, the preprocessed spectra with three preprocessing methods (normalization, Savitzky-Golay and standard normal variate) effectively reduced the influence of noise and enhanced the resolution and characteristics of spectra in comparison with the raw spectra. The best preprocessing choice for spectral analysis should be performed based on a combination of statistical testing and model prediction with regards to the objective of the study [37].
Model selection is an important part of mathematical modeling which is often performed based on the complexities of the developed models and their prospective application [9,38]. Support Vector Machine can be well applied to high-dimensional data, and there is no limit to the value of each attribute [39]. This method produced classification accuracies similar to ours for the classification of cotton leaf through image analysis [40] and also for the detection of tomato [41] and guava [42] plant disease through leaf analysis. Bergo et al., [43] used NIRs and PLS-DA to distinguish between Swellenia macrophylla and Carapa guianensis. Soares-Filho et al., [44] were successful in classifying six look-alike Amazon species of mahogany using a handheld NIRs instrument. Buitrago et al., [45] selected the wavelengths that most effectively distinguish 19 species from infrared spectra using the fresh leaf spectrum. Hadlich et al., [16] identified 11 species in the Amazon forest using Vis-NIR spectra from the outer or inner shells of the trees collected by the handheld spectrometer in the field. This study confirmed that discrimination and classification of Amaranthus sp. in the field using portable Vis-NIR spectroscopy is possible in combination with different machine learning techniques. Previously, the discrimination of Amaranthus sp. would have been successfully performed with biochemical and DNA-based methods [4,46,47] but in this study, Vis-NIR spectroscopy proved capable of discriminating six Amaranthus sp. This is particularly important because the method is speedy and affordable. In addition, the plant has recently been rediscovered as a promising food crop, mainly due to its resistance to heat, drought, diseases and pests, and the high nutritional value of both seeds and leaves [48]. For example, the gluten-free seeds have a nutty flavor and are high in protein and calcium, while the leaves are reported to be rich in antioxidants and phytochemicals, depending on the species [49].
The species accuracy (71~99.7%) obtained from the Amaranthus spectrum dataset achieved a very high level of classification goal considering the growth stage of the plant, other measurement locations, and the measurement location of leaves on the plant. Changes in spectral properties related to the biochemical composition and structure of leaves, which depend on many factors such as the leaf developmental position or the leaf microclimate position on the plant species and plant body, are known to be powerful factors that induce spectra differentiation [50]. Due to changes in cell wall composition such as polysaccharides, proteins, and phenolic compounds, all of which can show significant changes throughout the plant growth period [51,52]. There are often spectral differences between different growth stages of the same species, but research suggests that plant species can be distinguished if the differences in spectral signatures between plant species are sufficiently large [15]. Early studies of plants using diffuse reflectance measurements suggested that plant cuticles and underlying cell walls determine spectral features [19,53]. Consequently, various symbionts, parasites, and epiphylls are found in and on plant tissue. In addition, these can modify the spectral signature. Discriminant functions graphs based only on young samples always show greater separation of species than graphs from adults, which is thought to be due to shared biotic contaminants, suggesting that some convergence occurs in mature plants [15]. Castro-Esau et al., [54] suggested that leaves of the same species, but of different age and health, will vary widely in their spectral reflectance properties, and that the internal leaf structure affects leaf reflectance in the near-infrared region. However, some plant species show spectral differences depending on the developmental stage, while others show the opposite. Therefore, it can be said that more research is needed to determine whether the morphological and chemical changes according to the developmental stage are the same phenomenon in plant species.

5. Conclusions

The results of this study demonstrated that Vis-NIR spectroscopy has the capability to discriminate Amaranthus sp. with a notable accuracy, up to 99.7%. A combination of Savitzky-Golay and Support Vector Machine yielded high reliability in the development of a varietal classification model, suggesting the possibility of Amaranthus sp. remote field analysis using Vis-NIR. Through this study, it can be said that the possibility of developing a technology that can classify Amaranthus sp. easily, quickly, and accurately even at the young stage of plants is possible and is recommended to be explored. In future studies, we recommend using Vis-NIR spectroscopy in combination with the appropriate preprocessing and models that can be helpful in the development and maintenance of plant libraries through species identification and discrimination. The study can be expanded for multiple applications in botany, such as the early diagnosis of certain plant diseases to reduce postharvest losses and also for guaranteed quality assurance in the food industries.

Author Contributions

Conceptualization: S.-I.S., Y.-J.O. and Y.-H.L.; methodology: S.-I.S., Y.-J.O., S.P., Y.-H.L., H.-J.K., T.-H.R., Y.-S.C. and E.-K.S.; formal analysis: S.-I.S., Y.-J.O., S.P., Y.-H.L. and W.-S.C.; data curation: S.-I.S., Y.-J.O. and Y.-H.L.; writing—original draft preparation: S.-I.S., S.P. and J.-L.Z.Z.; visualization: S.P. and J.-L.Z.Z.; project administration: S.-I.S.; funding acquisition: S.-I.S. All authors have read and agreed to the published version of the manuscript.

Funding

This study was carried out with the support of “Research Program for Agricultural Science & Technology Development and 2021 Post-doctoral Fellowship Program (Project No. PJ014943012021)”, National Institute of Agricultural Sciences, Rural Development Administration, Korea.

Institutional Review Board Statement

Not applicable.

Informed Consent Statement

Not applicable.

Conflicts of Interest

The authors declare no conflict of interest.

References

  1. Park, Y.-H.; Park, S.-H.; Yoo, K.-O. A newly naturalized species in Korea: Amaranthus powellii S. Watson (Amaranthaceae). Korean J. Plant Taxon. 2014, 44, 132–135. [Google Scholar] [CrossRef]
  2. Judd, W.S.; Campbell, C.S.; Kellog, E.A.; Stevens, P.F.; Dongoghus, M.J. Plant Systematics: A Phylogenetic Approach, 3rd ed.; Sinauer Associates: Sunderland, MA, USA, 2008; p. 620. [Google Scholar]
  3. Park, S.H. New Illustrations and Photographs of Naturalized Plants of Korea; Ilchokak Inc.: Seoul, Korea, 2009; p. 575. [Google Scholar]
  4. Xu, H.; Pan, X.; Wang, C.; Chen, Y.; Chen, K.; Zhu, S.; van Klinken, R.D. Species identification, phylogenetic analysis and detection of herbicide-resistant biotypes of Amaranthus based on ALS and ITS. Sci. Rep. 2020, 10, 11735. [Google Scholar] [CrossRef]
  5. Beech, E.; Rivers, M.; Oldfield, S.; Smith, P.P. GlobalTreeSearch: The first complete global database of tree species and country distributions. J. Sustain. For. 2017, 36, 454–489. [Google Scholar] [CrossRef]
  6. Hearn, D.J. Shape analysis for the automated identification of plants from images of leaves. Taxon 2009, 58, 934–954. [Google Scholar] [CrossRef]
  7. Achigan-Dako, E.G.; Sogbohossou, E.O.D.; Maundu, P. Current knowledge on Amaranthus spp.: Research avenues for improved nutritional value and yield in leafy amaranths in sub-Saharan Africa. Euphytica 2014, 197, 303–317. [Google Scholar] [CrossRef]
  8. Hennessy, A.; Clarke, K.; Lewis, M. Hyperspectral classification of plants: A review of waveband selection generalisability. Remote Sens. 2020, 12, 113. [Google Scholar] [CrossRef] [Green Version]
  9. Sohn, S.-I.; Pandian, S.; Oh, Y.-J.; Zaukuu, J.-L.Z.; Kang, H.-J.; Ryu, T.-H.; Cho, W.-S.; Cho, Y.-S.; Shin, E.-K.; Cho, B.-K. An overview of near infrared spectroscopy and its applications in the detection of genetically modified organisms. Int. J. Mol. Sci. 2021, 22, 9940. [Google Scholar] [CrossRef] [PubMed]
  10. Cheng, C.; Liu, J.; Zhang, C.; Cai, M.; Wang, H.; Xiong, W. An overview of infrared spectroscopy based on continuous wavelet transform combined with machine learning algorithms: Application to Chinese medicines, plant classification, and cancer diagnosis. Appl. Spectrosc. Rev. 2010, 45, 148–164. [Google Scholar] [CrossRef]
  11. Roth, K.L.; Roberts, D.A.; Dennison, P.; Alonzo, M.; Peterson, S.H.; Beland, M. Differentiating plant species within and across diverse ecosystems with imaging spectroscopy. Remote Sens. Environ. 2015, 167, 135–151. [Google Scholar] [CrossRef]
  12. Cozzolino, D.; Smyth, H.E.; Gishen, M. Feasibility study on the use of visible and near-infrared spectroscopy together with chemometrics to discriminate between commercial white wines of different varietal origins. J. Agric. Food Chem. 2003, 51, 7703–7708. [Google Scholar] [CrossRef]
  13. Ferrari, M.; Mottola, L.; Quaresima, V. Principles, techniques, and limitations of near infrared spectroscopy. Can. J. Appl. Physiol. 2004, 29, 463–487. [Google Scholar] [CrossRef] [Green Version]
  14. Durgante, F.M.; Higuchi, N.; Almeida, A.; Vicentini, A. Species spectral signature: Discriminating closely related plant species in the Amazon with near-infrared leaf-spectroscopy. For. Ecol. Manag. 2013, 291, 240–248. [Google Scholar] [CrossRef]
  15. Lang, C.; Costa, F.R.C.; Camargo, J.L.C.; Durgante, F.; Vicentini, A. Near infrared spectroscopy facilitates rapid identification of both young and mature Amazonian tree species. PLoS ONE 2015, 10, e0134521. [Google Scholar] [CrossRef]
  16. Hadlich, H.L.; Durgante, F.M.; dos Santos, J.; Higuchi, N.; Chambers, J.Q.; Vicentini, A. Recognizing Amazonian tree species in the field using bark tissues spectra. For. Ecol. Manag. 2018, 427, 296–304. [Google Scholar] [CrossRef] [Green Version]
  17. Alishahi, A.; Farahmand, H.; Prieto, N.; Cozzolino, D. Identification of transgenic foods using NIR spectroscopy: A review. Spectrochim. Acta Part A Mol. Biomol. Spectrosc. 2010, 75, 1–7. [Google Scholar] [CrossRef]
  18. Porker, K.; Zerner, M.; Cozzolino, D. Classification and authentication of barley (Hordeum vulgare) malt varieties: Combining attenuated total reflectance mid-infrared spectroscopy with chemometrics. Food Anal. Methods 2017, 10, 675–682. [Google Scholar] [CrossRef]
  19. Luz, B.R.; Crowley, J.K. Spectral reflectance and emissivity features of broad leaves plants: Prospects for remote sensing in the thermal infrared (8.0–14.0 μm). Remote Sens. Environ. 2007, 109, 393–405. [Google Scholar]
  20. Ullah, A.K.; Skidmore, A.; Ramoelo, T.A.; Groen, M.; Naeem, A. Retrieval of leaf water content spanning the visible to thermal infrared spectra. ISPRS J. Photogramm. Remote Sens. 2014, 93, 56–64. [Google Scholar] [CrossRef]
  21. Meerdink, S.; Roberts, D.A.; King, J.Y.; Roth, K.L.; Dennison, P.E.; Amaral, C.H.; Hook, S.J. Linking seasonal foliar traits to VSWIR-TIR spectroscopy across California ecosystems. Remote Sens. Environ. 2016, 186, 322–338. [Google Scholar] [CrossRef]
  22. Zaukuu, J.-L.Z.; Aouadi, B.; Lukács, M.; Bodor, Z.; Vitális, F.; Gillay, B.; Gillay, Z.; Friedrich, L.; Kovacs, Z. Detecting low concentrations of nitrogen-based adulterants in whey protein powder using benchtop and handheld NIR spectrometers and the feasibility of scanning through plastic bag. Molecules 2020, 25, 2522. [Google Scholar] [CrossRef]
  23. Harrison, D.; Rivard, B.; Sánchez-Azofeifa, A. Classification of tree species based on longwave hyperspectral data from leaves, a case study for a tropical dry forest. Int. J. Appl. Earth Obs. Geoinf. 2018, 66, 93–105. [Google Scholar] [CrossRef]
  24. Workman, J.J. Review of process and non-invasive near-infrared and infrared spectroscopy: 1993–1999. Appl. Spectrosc. Rev. 1999, 34, 1–89. [Google Scholar] [CrossRef]
  25. Rinnan, Å.; van den Berg, F.; Engelsen, S.B. Review of the most common pre-processing techniques for near-infrared spectra. TrAC Trends Anal. Chem. 2009, 28, 1201–1222. [Google Scholar] [CrossRef]
  26. Jiao, Y.; Li, Z.; Chen, X.; Fei, S. Preprocessing methods for near-infrared spectrum calibration. J. Chemom. 2020, 34, 3306. [Google Scholar] [CrossRef]
  27. Sandak, A.; Sandak, J.; Negri, M. Relationship between near-infrared (NIR) spectra and the geographical provenance of timber. Wood Sci. Technol. 2011, 45, 35–48. [Google Scholar] [CrossRef]
  28. Savitzky, A.; Golay, M.J.E. Smoothing and differentiation of data by simplified least squares procedures. Anal. Chem. 1964, 36, 1627–1639. [Google Scholar] [CrossRef]
  29. Barnes, R.J.; Dhanoa, M.S.; Lister, S.J. Standard normal variate transformation and de-trending of near-infrared diffuse reflectance spectra. Appl. Spectrosc. 1989, 43, 772–777. [Google Scholar] [CrossRef]
  30. Cortes, C.; Vapnik, V. Support-vector networks. Mach. Learn. 1995, 20, 273–297. [Google Scholar] [CrossRef]
  31. Nelder, J.A.; Wedderburn, R.W.M. Generalized linear models. J. R. Stat. Soc. Ser. A Gen. 1972, 135, 370. [Google Scholar] [CrossRef]
  32. Steele, B. Maximum posterior probability estimators of map accuracy. Remote Sens. Environ. 2005, 99, 254–270. [Google Scholar] [CrossRef]
  33. Psomas, A.; Zimmermann, N.E.; Kneubühler, M.; Kellenberger, T.; Itten, K. Seasonal variability in spectral reflectance for discriminating grasslands along a dry-mesic gradient in Switzerland. In Proceedings of the 4th EARSEL Workshop on Imaging Spectroscopy, Warsaw, Poland, 27–29 April 2005; pp. 709–722. [Google Scholar]
  34. Manevski, K.; Manakos, I.; Petropoulos, G.P.; Kalaitzidis, C. Discrimination of common Mediterranean plant species using field spectroradiometry. Int. J. Appl. Earth Obs. Geoinf. 2011, 13, 922–933. [Google Scholar] [CrossRef]
  35. Chen, Y.; Bin, J.; Zou, C.; Ding, M. Discrimination of fresh tobacco leaves with different maturity levels by near-infrared (NIR) spectroscopy and deep learning. J. Anal. Methods Chem. 2021, 2021, 9912589. [Google Scholar] [CrossRef]
  36. Fernández-Cabanás, V.M.; Garrido-Varo, A.; Pérez-Marín, D.; Dardenne, P. Evaluation of pretreatment strategies for near-infrared spectroscopy calibration development of unground and ground compound feedingstuffs. Appl. Spectrosc. 2006, 60, 17–23. [Google Scholar] [CrossRef] [PubMed]
  37. Delwiche, S.R.; Reeves, J.B.; Reeves, I.J. The effect of spectral pre-treatments on the partial least squares modelling of agricultural products. J. Near Infrared Spectrosc. 2004, 12, 177–182. [Google Scholar] [CrossRef]
  38. Borraz-Martínez, S.; Simó, J.; Gras, A.; Mestre, M.; Boqué, R. Multivariate classification of prunus dulcis varieties using leaves of nursery plants and near-infrared spectroscopy. Sci. Rep. 2019, 9, 19810. [Google Scholar] [CrossRef] [PubMed] [Green Version]
  39. Gaye, B.; Zhang, D.; Wulamu, A. Improvement of support vector machine algorithm in big data background. Math. Probl. Eng. 2021, 2021, 1–9. [Google Scholar] [CrossRef]
  40. Patil, S.P.; Zambre, R.S. Classification of cotton leaf spot disease using support vector machine. J. Eng. Res. Appl. 2014, 4, 92–97. [Google Scholar]
  41. Jayanthi, M.G.; Shashikumar, D.R. Automatic tomato plant leaf disease classification using multi-kernel support vector machine. Int. J. Eng. Adv. Technol. 2020, 9, 560–565. [Google Scholar] [CrossRef]
  42. Perumal, P. Guava leaf disease classification using support vector machine. Turk. J. Comput. Math. Educ. 2021, 12, 1177–1183. [Google Scholar]
  43. Bergo, M.C.; Pastore, T.C.; Coradin, V.T.; Wiedenhoeft, A.C.; Braga, J.W. NIRS identification of Swietenia macrophylla is robust across specimens from 27 countries. IAWA J. 2016, 37, 420–430. [Google Scholar] [CrossRef] [Green Version]
  44. Soares-Filho, B.S.; Oliveira, A.S.; Rajão, R.G.; Oliveira, U.; Santos, L.R.S.; Assunção, A.C. Economic Valuation of Changes in the Amazon Forest Area: Economic Losses by Fires to Sustainable Timber Production; Center for Remote Sensing: Bello Horizonte, Brazil, 2017. [Google Scholar]
  45. Acevedo, M.F.B.; Groen, T.A.; Hecker, C.A.; Skidmore, A.K. Identifying leaf traits that signal stress in TIR spectra. ISPRS J. Photogramm. Remote Sens. 2017, 125, 132–145. [Google Scholar] [CrossRef]
  46. Wetzel, D.K.; Horak, M.J.; Skinner, D.Z. Use of PCR-based molecular markers to identify weedy Amaranthus species. Weed Sci. 1999, 47, 518–523. [Google Scholar] [CrossRef]
  47. Viljoen, E.; Odeny, D.A.; Coetzee, M.P.A.; Berger, D.K.; Rees, J. Application of chloroplast Phylogenomics to resolve species relationships within the plant genus Amaranthus. J. Mol. Evol. 2018, 86, 216–239. [Google Scholar] [CrossRef] [PubMed]
  48. Srivastava, R. Nutritional quality of some cultivated and wild species of Amaranthus, L. Int. J. Pharm. Sci. Res. 2011, 2, 3152. [Google Scholar]
  49. Bang, J.-H.; Lee, K.; Jeong, W.; Han, S.; Jo, I.-H.; Choi, S.; Cho, H.; Hyun, T.; Sung, J.; Lee, J.; et al. Antioxidant activity and phytochemical content of nine Amaranthus species. Agronomy 2021, 11, 1032. [Google Scholar] [CrossRef]
  50. Jacquemoud, S.; Ustin, S.L. Leaf optical properties: A state of the art. In Proceedings of the 8th International Symposium of Physical Measurements & Signatures in Remote Sensing, Aussois, France, 8–12 January 2001; pp. 223–332. [Google Scholar]
  51. Raven, P.H.; Evert, R.F.; Eichhorn, S.E. Biologia Vegetal, 6th ed.; Editora Guanabara Koogan: Rio de Janeiro, Brazil, 2001. [Google Scholar]
  52. Dhugga, K.S. Building the wall: Genes and enzyme complexes for polysaccharide synthases. Curr. Opin. Plant Biol. 2001, 4, 488–493. [Google Scholar] [CrossRef]
  53. Wong, C.; Blevin, W. Infrared reflectances of plant leaves. Aust. J. Biol. Sci. 1967, 20, 501–508. [Google Scholar] [CrossRef] [Green Version]
  54. Castro-Esau, K.L.; Sánchez-Azofeifa, G.A.; Caelli, T. Discrimination of lianas and trees with leaf-level hyperspectral data. Remote Sens. Environ. 2004, 90, 353–372. [Google Scholar] [CrossRef]
Figure 1. Morphological representation of the leaves of all the species tested in the field. (A) Amaranthus patulus Bertol.; (B) Amaranthus spinosus L.; (C) Amaranthus lividus L.; (D) Amaranthus viridis L.; (E) Amaranthus retroflexus L.; (F) Amaranthus powellii S. Watson. Figures were captured in different geographical locations where the analysis has been done (Table 1).
Remotesensing 13 04149 g001
Figure 2. Raw spectra obtained from six Amaranthus sp. in the fields. (A) Amaranthus patulus Bertol.; (B) Amaranthus spinosus L.; (C) Amaranthus lividus L.; (D) Amaranthus viridis L.; (E) Amaranthus retroflexus L.; (F) Amaranthus powellii S. Watson.
Remotesensing 13 04149 g002
Figure 3. Principal Component Analysis based on the Vis-NIR spectral imaging of leave samples of six Amaranthus sp. Raw spectra have been used. Axes are first and second principal components.
Remotesensing 13 04149 g003
Figure 4. Average raw and preprocessed spectra of six Amaranthus sp. Average spectra of raw (A) preprocessed with different methods such as normalization (B) SNV (C) Savitzky-Golay (D) methods.
Remotesensing 13 04149 g004
Table 1. List of Amaranthus sp. studied in this research.
ClassesScientific NameVernacular NameDistribution in KoreaSampling Location
(Latitude, Longitude)
No. of Spectra
Class AAmaranthus patulus Bertol.Speen amaranthNational distribution 36.23438, 128.76171000
Class BAmaranthus spinosus L.Spiny amaranthSouthern distribution 33.32751, 126.25941001
Class CAmaranthus lividus L.Wild amaranthNational distribution 36.54434, 127.1181970
Class DAmaranthus viridis L.Green amaranthSouthwest distribution 35.23967, 126.45991370
Class EAmaranthus retroflexus L.Red-root amaranthNortheastern distribution 37.61179, 128.77461001
Class FAmaranthus powellii S. WatsonPowell’s amaranthNortheastern distribution 37.56574, 128.4476900
Table 2. Classification accuracy of the combinations of preprocessing and model for reflectance spectra from six Amaranthus sp.
ModelPreprocessingAverage Accuracy (%±SD)Run Time (ms)
Support Vector MachineRaw spectra98.0 ± 0.008 *11,535
Normalization (Area)91.3 ± 0.01419,456
Standard Normal Variate98.8 ± 0.00613,116
Derivative (Savitzky-Golay)99.7 ± 0.006 **11,535
Generalized Linear ModelRaw spectra74.5 ± 0.013 *15,239
Normalization (Area)93.0 ± 0.0122568
Standard Normal Variate92.5 ± 0.0121727
Derivative (Savitzky-Golay)98.0 ± 0.008 **1541
Decision TreeRaw spectra85.5 ± 0.010 *6878
Normalization (Area)72.8 ± 0.0125334
Standard Normal Variate89.6 ± 0.012 **6714
Derivative (Savitzky-Golay)89.0 ± 0.0303469
Naive BayesRaw spectra71.0 ± 0.023 *756
Normalization (Area)78.3 ± 0.010465
Standard Normal Variate89.0 ± 0.013 **452
Derivative (Savitzky-Golay)87.5 ± 0.026444
Key: *; Raw spectra **; Preprocessing method with the best accuracy.
Table 3. Means of percentage of correctly classified six Amaranthus sp. from four different preprocessing and four different classification model using reflectance spectra.
ModelSpecies Accuracy (% ± SE)
Raw SpectraNormalization
(Area)
Derivative
(Savitzky-Golay)
SNVSignificance
Naive Bayes66.8 ± 9.7 ab77.1 ± 7.185.0 ± 6.8 c86.5 ± 8.5ns
Generalized Linear Model54.2 ± 18.1 B b90.2 ± 5.0 A98.3 ± 0.8 A ab94.2 ± 3.0 A*
Decision Tree85.5 ± 3.0 ab69.7 ± 15.186.8 ± 4.3 bc93.7 ± 3.5ns
Support Vector Machine98.5 ± 0.8 a95.0 ± 3.599.7 ± 0.6 a99.4 ± 0.6ns
significance*ns*ns
ns; not significant, *; significant with the p ≤ 0.05; Different alphabetical small and capital letters shows the significance of the value in the order of column and row respectively.
Table 4. Analysis of variance of percentage of correctly classified six Amaranthus sp. from four different preprocessing and four different classification model using reflectance spectra.
SourcedfSSMSF-Valuep-Value
Preprocessing (P)30.4801180.1600394.70.0045
Model (M)30.4917060.1639024.820.0039
P × M90.6006990.0667441.960.0549
Error802.7227710.034035
Total954.295294
df: degree of freedom, SS: sum of squares, MS: mean sum of squares.
Table 5. Confusion matrix of species discrimination using different preprocessing methods and models.
RAW/SVMA. patulusA. spinosusA. lividusA. viridisA. retroflexusA. powelliiAverage Accuracy (%)
A. patulus86.210.006.900.000.006.9086
A. spinosus0.00100.000.000.000.000.00100
A. lividus0.000.00100.000.000.000.00100
A. viridis0.000.000.00100.000.000.00100
A. retroflexus0.000.000.000.0098.781.2299
A. powellii0.950.000.000.950.0098.1098
SG/SVMA. patulusA. spinosusA. lividusA. viridisA. retroflexusA. powelliiAverage Accuracy (%)
A. patulus100.000.000.000.000.000.00100
A. spinosus0.00100.000.000.000.000.00100
A. lividus0.000.0096.550.003.450.0097
A. viridis0.000.000.00100.000.000.00100
A. retroflexus0.000.000.000.00100.000.00100
A. powellii0.000.000.000.000.00100.00100
Normalization/SVMA. patulusA. spinosusA. lividusA. viridisA. retroflexusA. powelliiAverage Accuracy (%)
A. patulus55.562.780.0013.890.0027.7856
A. spinosus3.1395.310.000.000.001.5695
A. lividus0.000.0087.880.003.039.0988
A. viridis0.000.000.00100.000.000.00100
A. retroflexus0.000.000.000.00100.000.00100
A. powellii3.740.000.000.004.6791.5992
SNV/SVMA. patulusA. spinosusA. lividusA. viridisA. retroflexusA. powelliiAverage Accuracy (%)
A. patulus92.860.000.007.140.000.0093
A. spinosus0.0076.8317.072.443.660.0077
A. lividus0.000.00100.000.000.000.00100
A. viridis0.000.000.00100.000.000.00100
A. retroflexus0.000.000.000.00100.000.00100
A. powellii0.000.001.720.000.8697.4197
Publisher’s Note: MDPI stays neutral with regard to jurisdictional claims in published maps and institutional affiliations.

