Spatiotemporal Characteristics of Freeze-Thawing Erosion in the Source Regions of the Chin-Sha, Ya-Lung and Lantsang Rivers on the Basis of GIS

 ,
,
Abstract
:1. Introduction
2. Data and Methods
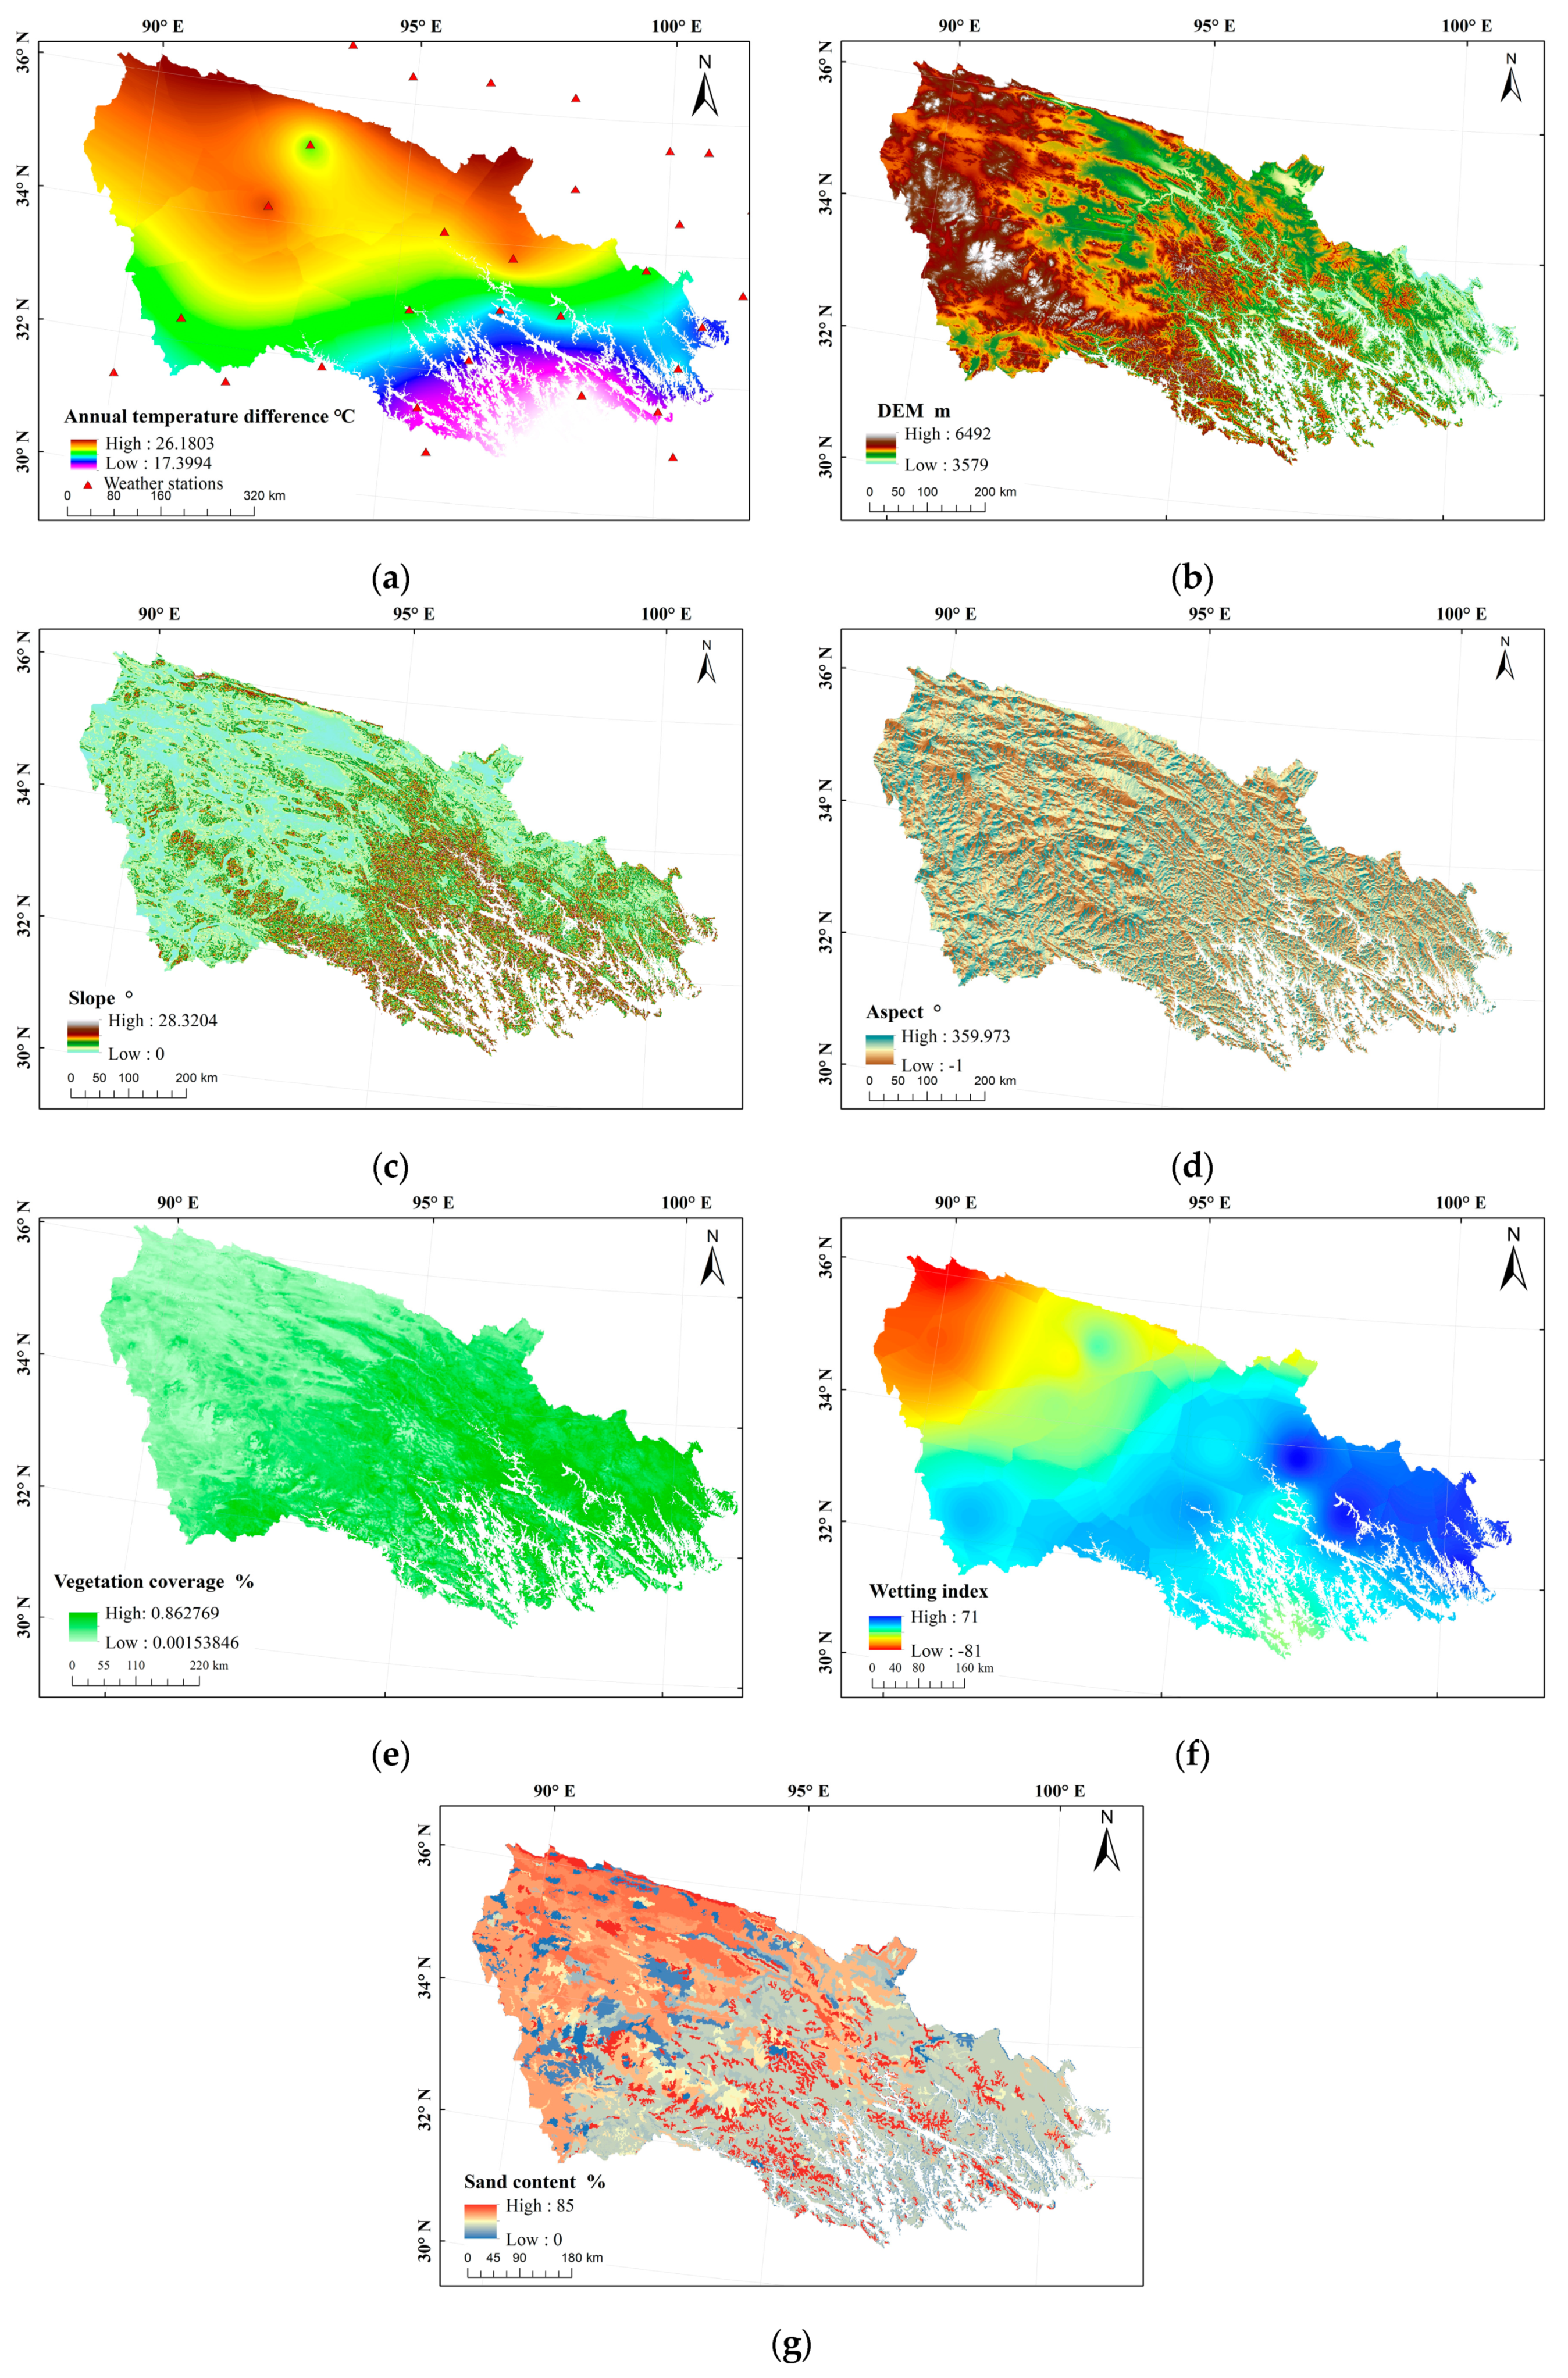
2.1. Research Area
2.2. Data Collection and Processing
2.3. Definition of the Scope of the Freeze-Thawing Erosion Area
2.4. Determining the Weight of the Freeze-Thaw Erosion Intensity Evaluation Factor
2.4.1. Annual Temperature Range
2.4.2. Elevation
2.4.3. Slope
2.4.4. Aspect
2.4.5. Vegetation Coverage
2.4.6. Moisture Index
2.4.7. Sand Content
2.5. Evaluation Factor Weight
- (1)
- building-up a hierarchical structure pattern
- (2)
- construct all comparison matrix in each level
- (3)
- single hierarchical sequencing and consistency test
- (4)
- overall hierarchical sequencing and consistency test
2.6. Evaluation Method of Freeze-Thawing Erosion Intensity
2.6.1. Index Normalization
2.6.2. Comprehensive Index Evaluation Method
2.7. Freeze-Thawing Erosion Evaluation Factor Grading
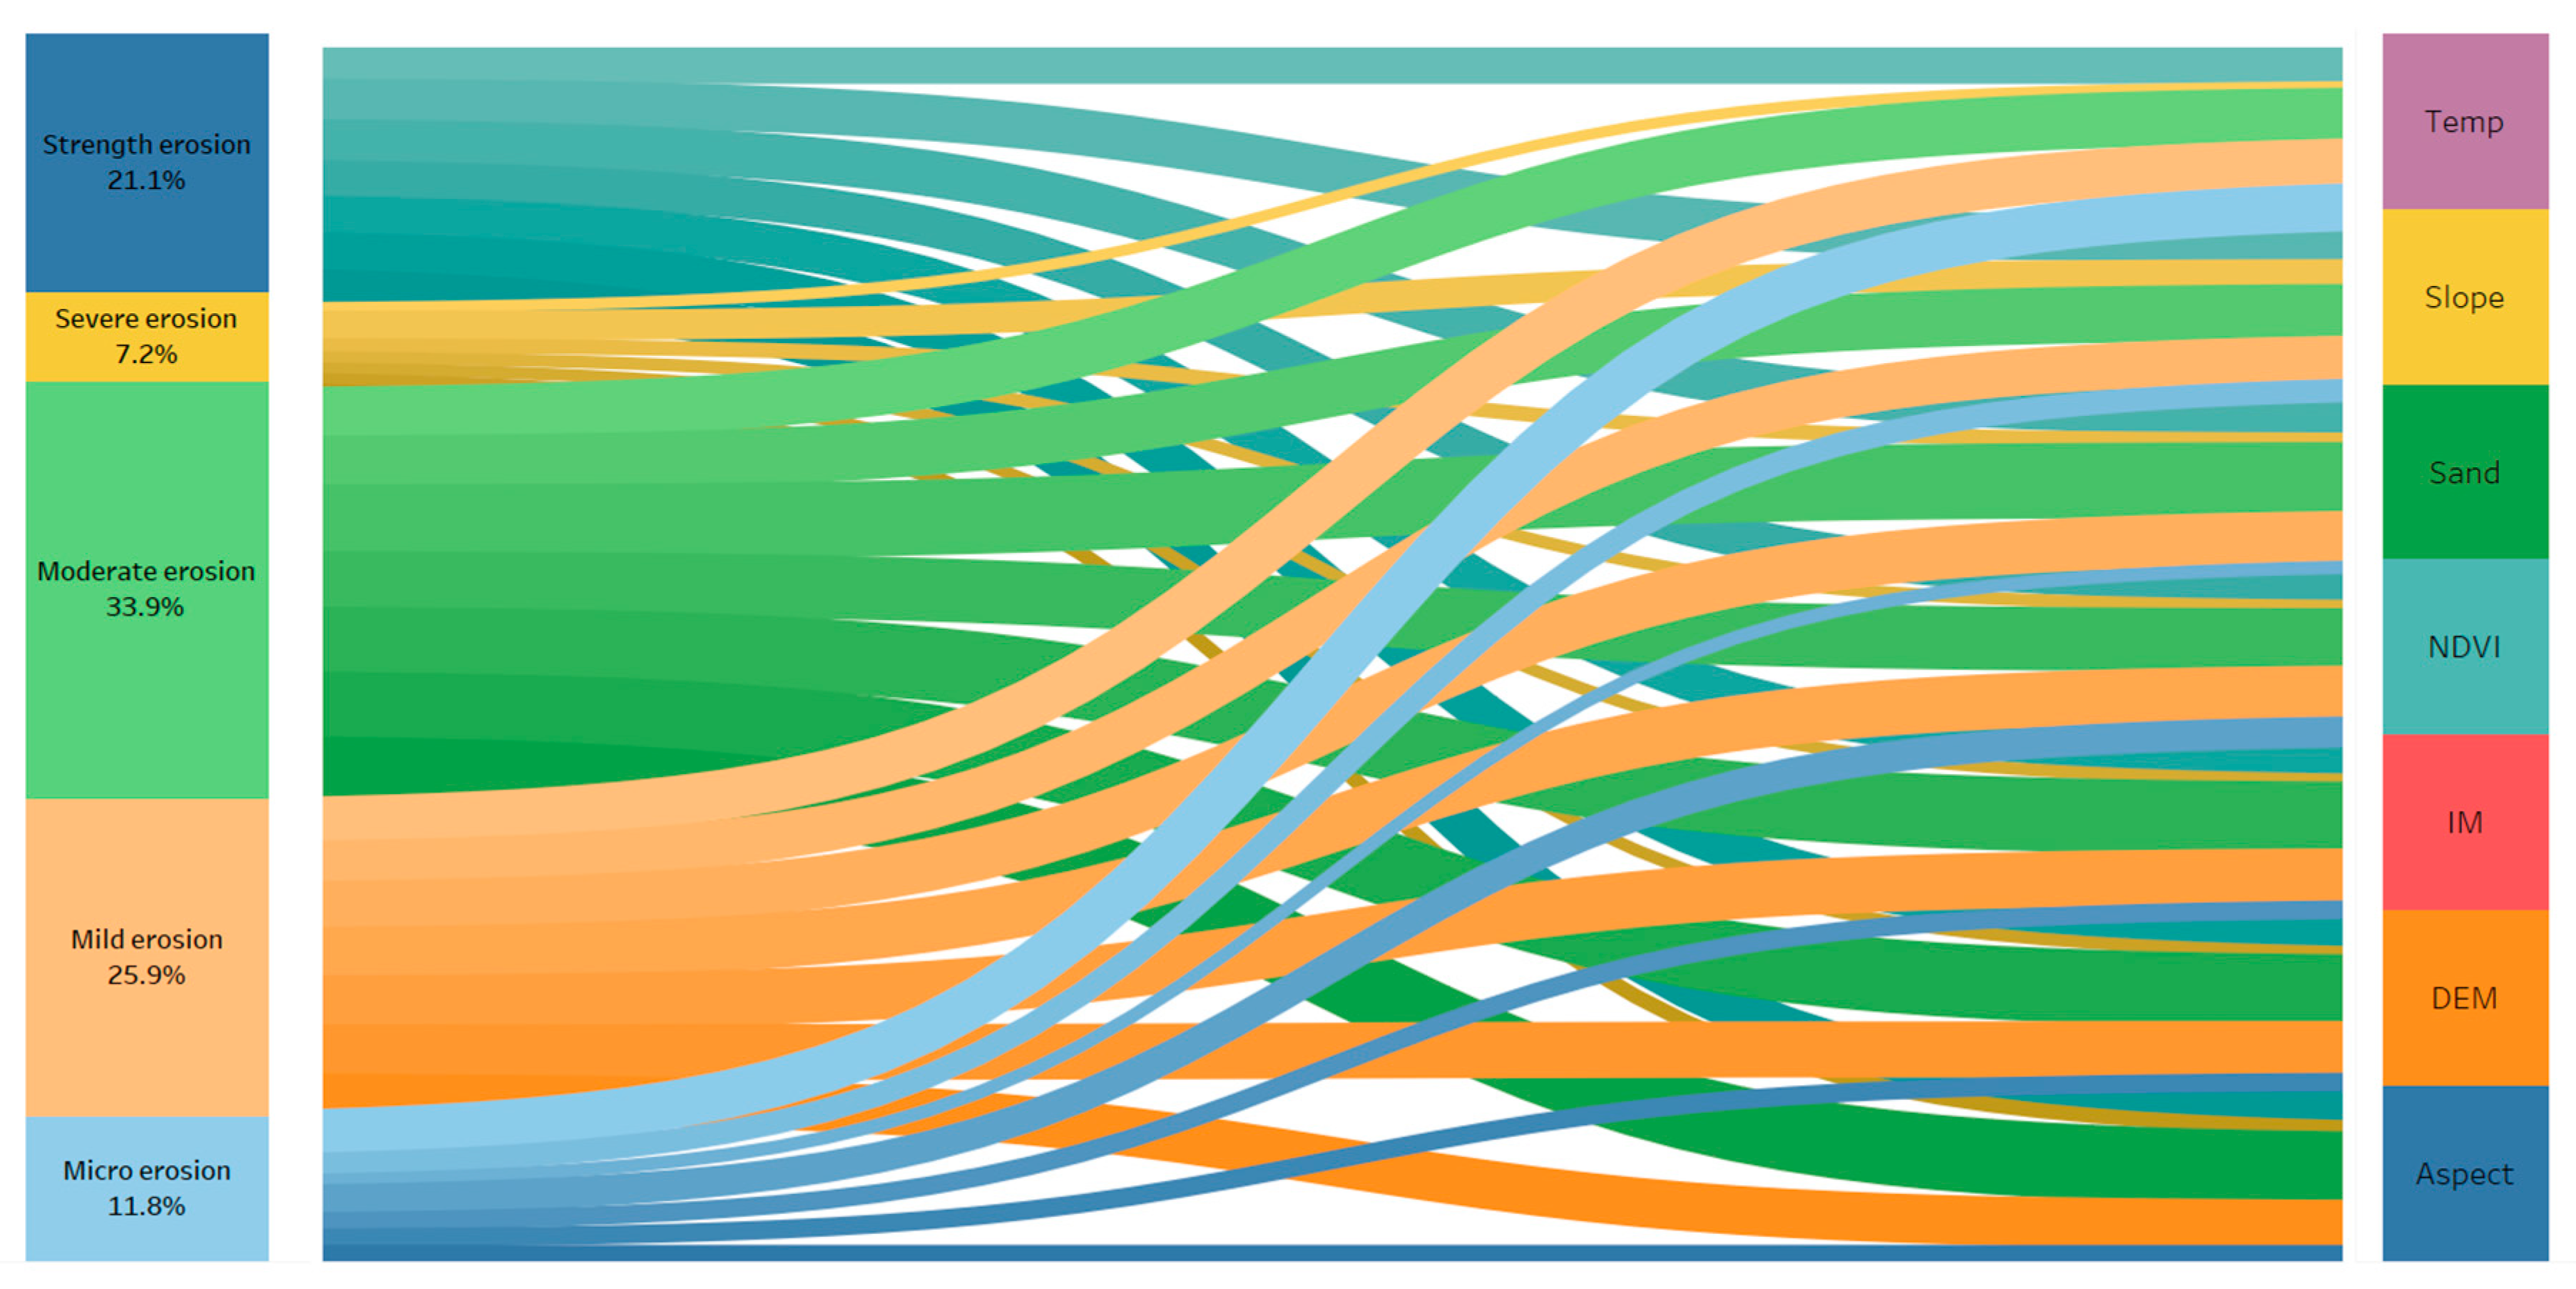
3. Results
3.1. Comprehensive Evaluation of Freeze-Thawing Erosion Intensity
3.2. Verification of the Freeze-Thawing Erosion Intensity Results
3.3. Effect Comparison of Freeze-Thawing Erosion Intensity
4. Discussion
4.1. Analysis of the Effect of Annual Temperature Range on Freeze-Thawing Erosion Intensity
4.2. Analysis of the Effect of Different Elevations on Freeze-Thawing Erosion Intensity
4.3. Analysis of the Effect of Different Slopes on Freeze-Thawing Erosion Intensity
4.4. Analysis of the Effect of Different Aspects on Freeze-Thawing Erosion Intensity
4.5. Analysis of the Effect of Different Vegetation Coverage on Freeze-Thawing Erosion Intensity
4.6. Analysis of the Effect of Different Moistures on Freeze-Thawing Erosion Intensity
4.7. Analysis of the Effect of Different Sand Contents on Freeze-Thawing Erosion Intensity
5. Conclusions
- (1)
- The intensity of erosion in the study area was mainly mild erosion, moderate erosion and strength erosion; micro erosion and severe erosion appeared to a lesser extent.
- (2)
- The spatial distribution of freeze-thawing erosion sensitivity is significantly different in different spatial patterns, and the intensity of freeze-thawing erosion is large in high altitude areas. The Tanggula Mountains contains the most of severe erosion area.
- (3)
- Annual temperature range, elevation, slope, aspect and content of sand in soil accelerate soil freeze-thawing erosion. Vegetation coverage inhibit freeze-thawing erosion. The increase of moisture index strengthened the role of NDVI and sand content. The increase of moisture index strengthened the inhibitory effect of NDVI but also strengthened the promoting effect of sand content. Under the comprehensive action of various factors, the melting of glaciers and the thaw of permafrost in the Qinghai-Tibet Plateau have accelerated the soil freeze-thawing erosion.
- (4)
- In this paper, the results of freeze-thawing erosion are compared with those published in the bulletin of soil and water conservation in recent years in Chindu County. The spatial distribution and intensity of freeze-thawing erosion are very similar, so the results are accurate.
Author Contributions
Funding
Institutional Review Board Statement
Informed Consent Statement
Data Availability Statement
Acknowledgments
Conflicts of Interest
References
- Guo, B.; Chen, S.; Han, B. Study on Quantitative Evaluation of Ecological Vulnerability of Silk Road Economic Belt (Domestic Section). Resour. Environ. Yangtze River Basin. 2019, 28, 2601–2611. [Google Scholar]
- Liu, S.Z.; Zhang, J.G.; Gu, S.X. Study on the soil erosion types in Tibet. J. Mt. Sci. 2006, 24, 592–596. [Google Scholar]
- Chen, B. A Study of Land Surface Energy and Water in Soil Freezing and Thawing Process and Impact on Regional Climate of the Qinghai-Tibet Plateau. Master’s Thesis, University of Chinese Academy of Sciences, Lanzhou, China, 2014. [Google Scholar]
- Li, Z.; Zhu, B.; Li, P. Advancement in study on soil erosion and soil and water conservation. Actor Pedol. Sinaica 2008, 45, 802–809. [Google Scholar]
- Zhang, K.; Liu, H. Research progress and prospect of freeze-thaw erosion in black soil areas in northeast China. Sci. Soil Water Conserv. 2018, 16, 17–24. [Google Scholar]
- Liu, S.; Liu, B.; Tao, H.; Zhang, L. The current situation and countermeasures of freeze-thawing erosion in China. Soil Water Conserv. China 2013, 10, 41–44. [Google Scholar]
- Luca, M. Govern our soils. Nature 2015, 528, 32–33. [Google Scholar]
- Farres, P.J.; Cousen, S.M. An improved method of aggregate stability measurement. Earth Surf. Process. Landf. 2010, 10, 321–329. [Google Scholar] [CrossRef]
- Qian, Z.; Ni, J.; Xue, A. Classification and discriminant method of severities of the Yellow River in 2001. Acta Geogr. Sin. 2001, 56, 691–699. [Google Scholar]
- Zhou, Y.; Guo, D.; Qiu, G.; Cheng, G.; Li, S. Geocryology in China, 1st ed.; Science Press: Beijing, China, 2000; pp. 15–115. [Google Scholar]
- Wei, X.; Ding, Y.; Li, X. Review and prospect of freeze-thawing-induced erosion research. Res. Soil Water Conserv. 2012, 19, 271–275. [Google Scholar]
- Sun, B.; Li, Z.; Xiao, J.; Zhang, L.; Ma, T.; Li, J.; Cheng, D. Research progress on the effects of freezing-thawing on soil physical and chemical properties and wind-water erosion. Chin. J. Appl. Ecol. 2019, 30, 337–347. [Google Scholar]
- Li, H.; Xu, E.; Zhang, H. Comprehensive division of soil erosion in Yili Valley. J. China Agric. Resour. Reg. Plan. 2018, 39, 116–124. [Google Scholar]
- Wang, F.; Han, X.; Li, L.; Zhang, K. How freezing and thawing processes affect black-soil aggregate stability in northeastern China. Sci. Cold Arid Reg. 2010, 2, 67. [Google Scholar]
- Luo, D.; Jin, H.; Lv, L.; Wu, Q. Temporal and spatial characteristics of permafrost active layer and freezing-thawing process of seasonal permafrost in the source area of the Yellow River. Chin. Sci. Bull. 2014, 59, 1327–1336. [Google Scholar] [CrossRef]
- Guo, B.; Jiang, L. Evaluation of freezing-thawing erosion intensity in qinghai-tibet plateau based on multi-source space-coupled data. Bull. Soil Water Conserv. 2017, 37, 12–19. [Google Scholar]
- Wang, L.; Xiao, Y.; Jiang, L.; Ouyang, Z. Evaluation and analysis of freeze-thawing erosion sensitivity in qinghai-tibet plateau. J. Glaciol. Geocryol. 2017, 39, 61–69. [Google Scholar]
- Wu, W.; Liu, F. Analysis and distribution characteristics of freeze-thawing erosion in headwater region of the three-river-source area. J. Qinghai Norm. Univ. (Philos. Soc. Sci. Ed.) 2010, 26, 57–61. [Google Scholar]
- Lv, Y.; Liu, Z.; Ye, B.; Zhang, S.; Zhang, Y. Evaluation of fine ecological sensitivity in western sichuan plateau. Res. Soil Water Conserv. 2016, 23, 272–277. [Google Scholar]
- Shi, Z.; Tao, H.; Liu, S.; Liu, B.; Guo, B. Evaluation and analysis of freeze-thawing erosion in sanjiangyuan area based on GIS. Trans. Chin. Soc. Agric. Eng. 2012, 28, 214–221. [Google Scholar]
- Li, D.; Wei, X.; Li, X.; Li, Y. Evaluation of freeze-thawing erosion sensitivity in gansu province based on RS and GIS. Res. Soil Water Conserv. 2015, 22, 1–6. [Google Scholar]
- De, J.; Yao, T.D.; Yao, P.; Chen, L.N. Characteristics of climate change in warm and cold periods revealed from ice cores and meteorological records duringthe past 100 years on the Tibetan Plateau. J. Glaciol. Geocryol. 2013, 35, 1382–1390. [Google Scholar]
- Song, C.; Pei, T.; Zhou, C.H. Research Progresses of Surface Temperature Characteristic Change over Tibetan Plateau since 1960. Prog. Geogr. 2012, 31, 1503–1509. [Google Scholar]
- Yao, T.D.; Qin, D.H.; Shen, Y.P.; Zhao, L.; Wang, N.L.; Lu, A.X. Cryospheric changes and their impacts on regional water cycle and ecological conditions in the Qinghai-Tibetan Plateau. Chin. J. Nat. 2013, 35, 179–186. [Google Scholar]
- Zhang, J.; Liu, S. A new method to define the distribution of freeze-thawing erosion areas in Tibet. Geogr. Geo-Inf. Sci. 2005, 21, 32–34. [Google Scholar]
- Zhang, R.; Wang, X.; Fan, H.; Zhou, L.; Wu, M.; Liu, Y. Study on the zonal erosion characteristics of freezing-thawing zone in China. Sci. Soil Water Conserv. 2009, 7, 24–28. [Google Scholar]
- Li, C.; Ma, J.; Tang, Z.; Zhou, W. Evaluation of freeze-thawing erosion intensity in sanjiangyuan area based on GIS. Soil Water Conserv. China 2011, 4, 41–43. [Google Scholar]
- Li, H.; Liu, S.; Zhong, X.; Zhang, J.; Wang, X. GIS-based evaluation of freeze-thawing erosion sensitivity in Tibet autonomous region. Soil Water Conserv. China 2005, 7, 44–46. [Google Scholar]
- Song, J.; Tang, G.; Wang, C.; Xiao, C. Analysis of marginal effect generated by DEM extraction slope. Bull. Soil Water Conserv. 2006, 26, 82–85. [Google Scholar]
- Zhang, X. Study on Spatial-Temporal Variation of Key Hydrological Elements in Yarlung Zangbo River Basin. Ph.D. Thesis, Beijing Forestry University, Beijing, China, 2011. [Google Scholar]
- Bhushan, N.; Kanwal, R. Strategic Decision Making: Applying the Analytic Hierarchy Process; Springer: London, UK, 2004; pp. 3–21. [Google Scholar]
- Saaty, T.L. Relative measurement and its generalization in decision making why pairwise comparisons are central in mathematics for the measurement of intangible factors the analytic hierarchy/network process. Rev. Real Acad. Cienc. Exactas Fis. Nat. Ser. A. Mat. 2008, 102, 251–318. [Google Scholar] [CrossRef]
- Yang, M.; Yao, T.; Gou, X.; Nozomi, H.; Yuki, F.H.; Amp, L.S. Diurnal freeze-thaw cycles of the ground surface on the Tibetan Plateau. Sci. Bull. 2007, 52, 136–139. [Google Scholar] [CrossRef]
- Lu, W.H.; Liu, S.D.; Sun, S.Q.; Zhu, X.C.; Zheng, M.D. Characteristics and Influence Factors of the Heat-wave Events in Ningbo from 1956 to 2016. Bull. Sci. Technol. 2019, 35, 54–59. [Google Scholar]
- Zhao, X.L.; Niu, R.Y. Similarities and differences of summer persistent heavy rainfall and atmospheric circulation charact characteristics in the middle and lower reaches of the Yangtze River between 2016 and 1998. Torrential Rain Disasters 2019, 38, 615–623. [Google Scholar]
- Chen, Q.; Wu, W.Z.; Zhou, Q.; Yang, Y.H. Comprehensive analysis of soil erosion in Sanjiangyuan area based on GIS. J. Anhui Agric. Sci. 2010, 38, 14989–14991, 15039. [Google Scholar]


| Data Name | Type | Resolution/m | Data/Year | The Data Sources |
|---|---|---|---|---|
| Study boundary | Vector | Resource and Environment Science and Data Center | ||
| Land use type | Raster | 500 | Resource and Environment Science and Data Center | |
| Meteorological dataset | The text data | 2006–2016 | National Meteorological Science Data Center | |
| DEM | Raster | 90 | Geospatial Data Cloud | |
| NDVI | Raster | 250 | 2006–2016 | National Aeronautics and Space Administration Earth Observing System |
| Moisture index | Raster | 1000 | 2006–2016 | Resource and Environment Science and Data Center |
| Sand content | Raster | 1000 | 2006–2016 | Resource and Environment Science and Data Center |
| The Evaluation Factors | Annual Temperature Difference (°C) | DEM (m) | Slope (°) | Aspect (°) | Vegetation Coverage (%) | Moisture Index | Sand Content (%) | Weight |
|---|---|---|---|---|---|---|---|---|
| Annual temperature difference (°C) | 1 | 1 | 1/2 | 5 | 3 | 2 | 4 | 0.20 |
| DEM (m) | 1 | 1/2 | 5 | 3 | 2 | 4 | 0.20 | |
| Slope (°) | 1 | 6 | 4 | 3 | 5 | 0.31 | ||
| Aspect (°) | 1 | 1/3 | 1/4 | 1/2 | 0.04 | |||
| Vegetation coverage (%) | 1 | 1/2 | 2 | 0.08 | ||||
| Moisture index | 1 | 3 | 0.12 | |||||
| Sand content (%) | 1 | 0.05 |
| Evaluation Factor Type | Hierarchical Assignment of Indicators | ||||
|---|---|---|---|---|---|
| 1 | 2 | 3 | 4 | 5 | |
| Annual temperature difference (°C) | ≤19 | 19–21 | 21–23 | 23–25 | ≥25 |
| Elevation (m) | ≤4000 | 4000–4500 | 4500–5000 | 5000–5500 | ≥5500 |
| Slope (°) | ≤3 | 3–8 | 8–9 | 9–12 | ≥12 |
| Aspect (°) | 0–36 | 36–72 | 72–108 | 108–144 | 144–216 |
| 324–360 | 288–324 | 252–288 | 216–252 | ||
| Vegetation coverage (%) | ≥80 | 60–80 | 40–60 | 20–40 | ≤20 |
| Moisture index | ≤−20 | −20–0 | 0–20 | 20–40 | ≥40 |
| Sand content (%) | ≤40 | 40–50 | 50–60 | 60–70 | ≥70 |
| The Intensity of Erosion | Area (km2) | The Proportion (%) |
|---|---|---|
| Nonfreeze-thawing erosion zone | 43,329 | |
| Micro erosion | 30,448 | 8.44 |
| Mild erosion | 92,030 | 25.50 |
| Moderate erosion | 131,317 | 36.38 |
| Strength erosion | 83,287 | 23.07 |
| Severe erosion | 23,866 | 6.61 |
Publisher’s Note: MDPI stays neutral with regard to jurisdictional claims in published maps and institutional affiliations. |
© 2021 by the authors. Licensee MDPI, Basel, Switzerland. This article is an open access article distributed under the terms and conditions of the Creative Commons Attribution (CC BY) license (http://creativecommons.org/licenses/by/4.0/).
Share and Cite
Lu, Y.; Liu, C.; Ge, Y.; Hu, Y.; Wen, Q.; Fu, Z.; Wang, S.; Liu, Y. Spatiotemporal Characteristics of Freeze-Thawing Erosion in the Source Regions of the Chin-Sha, Ya-Lung and Lantsang Rivers on the Basis of GIS. Remote Sens. 2021, 13, 309. https://doi.org/10.3390/rs13020309
Lu Y, Liu C, Ge Y, Hu Y, Wen Q, Fu Z, Wang S, Liu Y. Spatiotemporal Characteristics of Freeze-Thawing Erosion in the Source Regions of the Chin-Sha, Ya-Lung and Lantsang Rivers on the Basis of GIS. Remote Sensing. 2021; 13(2):309. https://doi.org/10.3390/rs13020309
Chicago/Turabian StyleLu, Yuefeng, Cong Liu, Yong Ge, Yulong Hu, Qiao Wen, Zhongliang Fu, Shaobo Wang, and Yong Liu. 2021. "Spatiotemporal Characteristics of Freeze-Thawing Erosion in the Source Regions of the Chin-Sha, Ya-Lung and Lantsang Rivers on the Basis of GIS" Remote Sensing 13, no. 2: 309. https://doi.org/10.3390/rs13020309