Next Issue
Volume 13, February-1
Previous Issue
Volume 13, January-1
 
 
remotesensing-logo

Journal Browser

Journal Browser

Remote Sens., Volume 13, Issue 2 (January-2 2021) – 172 articles

Cover Story (view full-size image): 
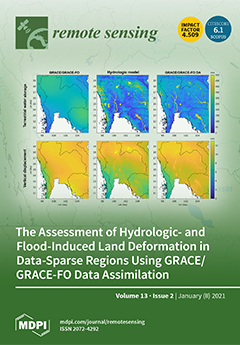
Accurate land deformation measurements can provide constructive insight into the regional geophysical and hydrologic processes. Global positioning system (GPS) networks are not uniformly distributed across the globe, posing a challenge to obtaining accurate deformation information in data-sparse regions. This paper computes vertical displacement by assimilating gravity data from the Gravity Recovery and Climate Experiment (GRACE) and GRACE Follow-On (GRACE-FO) into the hydrologic model using the GRACE/GRACE-FO data assimilation (DA) technique. Results confirm the GRACE/GRACE-FO DA success in providing vertical displacement estimates consistent with satellite data while maintaining high-spatial details of the model, highlighting the benefits of GRACE/GRACE-FO DA in data-sparse regions. View this paper
  • Issues are regarded as officially published after their release is announced to the table of contents alert mailing list.
  • You may sign up for e-mail alerts to receive table of contents of newly released issues.
  • PDF is the official format for papers published in both, html and pdf forms. To view the papers in pdf format, click on the "PDF Full-text" link, and use the free Adobe Reader to open them.
Order results
Result details
Section
Select all
Export citation of selected articles as:
22 pages, 6386 KiB  
Article
MorphEst: An Automated Toolbox for Measuring Estuarine Planform Geometry from Remotely Sensed Imagery and Its Application to the South Korean Coast
by Nathalie W. Jung, Guan-hong Lee, Yoonho Jung, Steven M. Figueroa, Kenneth D. Lagamayo, Tae-Chang Jo and Jongwi Chang
Remote Sens. 2021, 13(2), 330; https://doi.org/10.3390/rs13020330 - 19 Jan 2021
Cited by 5 | Viewed by 4083
Abstract
The rapid advance of remote sensing technology during the last few decades provides a new opportunity for measuring detectable estuarine spatial change. Although estuarine surface area and convergence are important hydraulic parameters often used to predict long-term estuarine evolution, the majority of automated [...] Read more.
The rapid advance of remote sensing technology during the last few decades provides a new opportunity for measuring detectable estuarine spatial change. Although estuarine surface area and convergence are important hydraulic parameters often used to predict long-term estuarine evolution, the majority of automated analyses of channel plan view dynamics have been specifically written for riverine systems and have limited applicability to most of the estuaries in the world. This study presents MorphEst, a MATLAB-based collection of analysis tools that automatically measure estuarine planform geometry. MorphEst uses channel masks to extract estuarine length, convergence length, estuarine shape, and areal gain and loss of estuarine surface area due to natural or human factors. Comparisons indicated that MorphEst estimates closely matched with independent measurements of estuarine surface area (r = 0.99) and channel width (r = 0.92) of 39 estuaries along the South Korean coast. Overall, this toolbox will help to improve the ability to solve research questions commonly associated with estuarine evolution as it introduces a tool to automatically measure planform geometric features from remotely sensed imagery. Full article
Show Figures

Graphical abstract

18 pages, 5418 KiB  
Article
A New Algorithm for the Retrieval of Sun Induced Chlorophyll Fluorescence of Water Bodies Exploiting the Detailed Spectral Shape of Water-Leaving Radiance
by Carolina Tenjo, Antonio Ruiz-Verdú, Shari Van Wittenberghe, Jesús Delegido and José Moreno
Remote Sens. 2021, 13(2), 329; https://doi.org/10.3390/rs13020329 - 19 Jan 2021
Cited by 7 | Viewed by 2747
Abstract
Sun induced chlorophyll fluorescence (SICF) emitted by phytoplankton provides considerable insights into the vital role of the carbon productivity of the earth’s aquatic ecosystems. However, the SICF signal leaving a water body is highly affected by the high spectral variability of its optically [...] Read more.
Sun induced chlorophyll fluorescence (SICF) emitted by phytoplankton provides considerable insights into the vital role of the carbon productivity of the earth’s aquatic ecosystems. However, the SICF signal leaving a water body is highly affected by the high spectral variability of its optically active constituents. To disentangle the SICF emission from the water-leaving radiance, a new high spectral resolution retrieval algorithm is presented, which significantly improves the fluorescence line height (FLH) method commonly used so far. The proposed algorithm retrieves the reflectance without SICF contribution by the extrapolation of the reflectance from the adjacent regions. Then, the SICF emission curve is obtained as the difference of the reflectance with SICF, the one actually obtained by any remote sensor (apparent reflectance), and the reflectance without SICF, the one estimated by the algorithm (true reflectance). The algorithm first normalizes the reflectance spectrum at 780 nm, following the similarity index approximation, to minimize the variability due to other optically active constituents different from chlorophyll. Then, the true reflectance is estimated empirically from the normalized reflectance at three wavelengths using a machine learning regression algorithm (MLRA) and a cubic spline fitting adjustment. Two large reflectance databases, representing a wide range of coastal and ocean water components and scattering conditions, were independently simulated with the radiative transfer model HydroLight and used for training and validation of the MLRA fitting strategy. The best results for the high spectral resolution SICF retrieval were obtained using support vector regression, with relative errors lower than 2% for the SICF peak value in 81% of the samples. This represents a significant improvement with respect to the classic FLH algorithm, applied for OLCI bands, for which the relative errors were higher than 40% in 59% of the samples. Full article
Show Figures

Graphical abstract

26 pages, 13189 KiB  
Article
High-Resolution SAR Image Classification Using Multi-Scale Deep Feature Fusion and Covariance Pooling Manifold Network
by Wenkai Liang, Yan Wu, Ming Li, Yice Cao and Xin Hu
Remote Sens. 2021, 13(2), 328; https://doi.org/10.3390/rs13020328 - 19 Jan 2021
Cited by 13 | Viewed by 3786
Abstract
The classification of high-resolution (HR) synthetic aperture radar (SAR) images is of great importance for SAR scene interpretation and application. However, the presence of intricate spatial structural patterns and complex statistical nature makes SAR image classification a challenging task, especially in the case [...] Read more.
The classification of high-resolution (HR) synthetic aperture radar (SAR) images is of great importance for SAR scene interpretation and application. However, the presence of intricate spatial structural patterns and complex statistical nature makes SAR image classification a challenging task, especially in the case of limited labeled SAR data. This paper proposes a novel HR SAR image classification method, using a multi-scale deep feature fusion network and covariance pooling manifold network (MFFN-CPMN). MFFN-CPMN combines the advantages of local spatial features and global statistical properties and considers the multi-feature information fusion of SAR images in representation learning. First, we propose a Gabor-filtering-based multi-scale feature fusion network (MFFN) to capture the spatial pattern and get the discriminative features of SAR images. The MFFN belongs to a deep convolutional neural network (CNN). To make full use of a large amount of unlabeled data, the weights of each layer of MFFN are optimized by unsupervised denoising dual-sparse encoder. Moreover, the feature fusion strategy in MFFN can effectively exploit the complementary information between different levels and different scales. Second, we utilize a covariance pooling manifold network to extract further the global second-order statistics of SAR images over the fusional feature maps. Finally, the obtained covariance descriptor is more distinct for various land covers. Experimental results on four HR SAR images demonstrate the effectiveness of the proposed method and achieve promising results over other related algorithms. Full article
(This article belongs to the Special Issue Deep Learning for Remote Sensing Image Classification)
Show Figures

Graphical abstract

24 pages, 6137 KiB  
Article
Comparison of Digital Image Correlation Methods and the Impact of Noise in Geoscience Applications
by Niccolò Dematteis and Daniele Giordan
Remote Sens. 2021, 13(2), 327; https://doi.org/10.3390/rs13020327 - 19 Jan 2021
Cited by 21 | Viewed by 3663
Abstract
Digital image correlation (DIC) is a commonly-adopted technique in geoscience and natural hazard studies to measure the surface deformation of various geophysical phenomena. In the last decades, several different correlation functions have been developed. Additionally, some authors have proposed applying DIC to other [...] Read more.
Digital image correlation (DIC) is a commonly-adopted technique in geoscience and natural hazard studies to measure the surface deformation of various geophysical phenomena. In the last decades, several different correlation functions have been developed. Additionally, some authors have proposed applying DIC to other image representations, such as image gradients or orientation. Many works have shown the reliability of specific methods, but they have been rarely compared. In particular, a formal analysis of the impact of different sources of noise is missing. Using synthetic images, we analysed 15 different combinations of correlation functions and image representations and we investigated their performances with respect to the presence of 13 noise sources. Besides, we evaluated the influence of the size of the correlation template. We conducted the analysis also on terrestrial photographs of the Planpincieux Glacier (Italy) and Sentinel 2B images of the Bodélé Depression (Chad). We observed that frequency-based methods are in general less robust against noise, in particular against blurring and speckling, and they tend to underestimate the displacement value. Zero-mean normalised cross-correlation applied to image intensity showed high-quality results. However, it suffers variations of the shadow pattern. Finally, we developed an original similarity function (DOT) that proved to be quite resistant to every noise source. Full article
(This article belongs to the Special Issue Remote Sensing Analysis of Geologic Hazards)
Show Figures

Graphical abstract

28 pages, 5107 KiB  
Article
On the Generalization Ability of Data-Driven Models in the Problem of Total Cloud Cover Retrieval
by Mikhail Krinitskiy, Marina Aleksandrova, Polina Verezemskaya, Sergey Gulev, Alexey Sinitsyn, Nadezhda Kovaleva and Alexander Gavrikov
Remote Sens. 2021, 13(2), 326; https://doi.org/10.3390/rs13020326 - 19 Jan 2021
Cited by 15 | Viewed by 3060
Abstract
Total Cloud Cover (TCC) retrieval from ground-based optical imagery is a problem that has been tackled by several generations of researchers. The number of human-designed algorithms for the estimation of TCC grows every year. However, there has been no considerable progress in terms [...] Read more.
Total Cloud Cover (TCC) retrieval from ground-based optical imagery is a problem that has been tackled by several generations of researchers. The number of human-designed algorithms for the estimation of TCC grows every year. However, there has been no considerable progress in terms of quality, mostly due to the lack of systematic approach to the design of the algorithms, to the assessment of their generalization ability, and to the assessment of the TCC retrieval quality. In this study, we discuss the optimization nature of data-driven schemes for TCC retrieval. In order to compare the algorithms, we propose a framework for the assessment of the algorithms’ characteristics. We present several new algorithms that are based on deep learning techniques: A model for outliers filtering, and a few models for TCC retrieval from all-sky imagery. For training and assessment of data-driven algorithms of this study, we present the Dataset of All-Sky Imagery over the Ocean (DASIO) containing over one million all-sky optical images of the visible sky dome taken in various regions of the world ocean. The research campaigns that contributed to the DASIO collection took place in the Atlantic ocean, the Indian ocean, the Red and Mediterranean seas, and the Arctic ocean. Optical imagery collected during these missions are accompanied by standard meteorological observations of cloudiness characteristics made by experienced observers. We assess the generalization ability of the presented models in several scenarios that differ in terms of the regions selected for the train and test subsets. As a result, we demonstrate that our models based on convolutional neural networks deliver a superior quality compared to all previously published approaches. As a key result, we demonstrate a considerable drop in the ability to generalize the training data in the case of a strong covariate shift between the training and test subsets of imagery which may occur in the case of region-aware subsampling. Full article
Show Figures

Graphical abstract

19 pages, 5673 KiB  
Article
Predicting the Presence of Leptospires in Rodents from Environmental Indicators Opens Up Opportunities for Environmental Monitoring of Human Leptospirosis
by Leon Biscornet, Christophe Révillion, Sylvaine Jégo, Erwan Lagadec, Yann Gomard, Gildas Le Minter, Gérard Rocamora, Vanina Guernier-Cambert, Julien Mélade, Koussay Dellagi, Pablo Tortosa and Vincent Herbreteau
Remote Sens. 2021, 13(2), 325; https://doi.org/10.3390/rs13020325 - 19 Jan 2021
Cited by 7 | Viewed by 3627
Abstract
Leptospirosis, an environmental infectious disease of bacterial origin, is the infectious disease with the highest associated mortality in Seychelles. In small island territories, the occurrence of the disease is spatially heterogeneous and a better understanding of the environmental factors that contribute to the [...] Read more.
Leptospirosis, an environmental infectious disease of bacterial origin, is the infectious disease with the highest associated mortality in Seychelles. In small island territories, the occurrence of the disease is spatially heterogeneous and a better understanding of the environmental factors that contribute to the presence of the bacteria would help implement targeted control. The present study aimed at identifying the main environmental parameters correlated with animal reservoirs distribution and Leptospira infection in order to delineate habitats with highest prevalence. We used a previously published dataset produced from a large collection of rodents trapped during the dry and wet seasons in most habitats of Mahé, the main island of Seychelles. A land use/land cover analysis was realized in order to describe the various environments using SPOT-5 images by remote sensing (object-based image analysis). At each sampling site, landscape indices were calculated and combined with other geographical parameters together with rainfall records to be used in a multivariate statistical analysis. Several environmental factors were found to be associated with the carriage of leptospires in Rattus rattus and Rattus norvegicus, namely low elevations, fragmented landscapes, the proximity of urbanized areas, an increased distance from forests and, above all, increased precipitation in the three months preceding trapping. The analysis indicated that Leptospira renal carriage could be predicted using the species identification and a description of landscape fragmentation and rainfall, with infection prevalence being positively correlated with these two environmental variables. This model may help decision makers in implementing policies affecting urban landscapes and/or in balancing conservation efforts when designing pest control strategies that should also aim at reducing human contact with Leptospira-laden rats while limiting their impact on the autochthonous fauna. Full article
Show Figures

Graphical abstract

24 pages, 2775 KiB  
Article
Triple-Attention-Based Parallel Network for Hyperspectral Image Classification
by Lei Qu, Xingliang Zhu, Jiannan Zheng and Liang Zou
Remote Sens. 2021, 13(2), 324; https://doi.org/10.3390/rs13020324 - 19 Jan 2021
Cited by 25 | Viewed by 3404
Abstract
Convolutional neural networks have been highly successful in hyperspectral image classification owing to their unique feature expression ability. However, the traditional data partitioning strategy in tandem with patch-wise classification may lead to information leakage and result in overoptimistic experimental insights. In this paper, [...] Read more.
Convolutional neural networks have been highly successful in hyperspectral image classification owing to their unique feature expression ability. However, the traditional data partitioning strategy in tandem with patch-wise classification may lead to information leakage and result in overoptimistic experimental insights. In this paper, we propose a novel data partitioning scheme and a triple-attention parallel network (TAP-Net) to enhance the performance of HSI classification without information leakage. The dataset partitioning strategy is simple yet effective to avoid overfitting, and allows fair comparison of various algorithms, particularly in the case of limited annotated data. In contrast to classical encoder–decoder models, the proposed TAP-Net utilizes parallel subnetworks with the same spatial resolution and repeatedly reuses high-level feature maps of preceding subnetworks to refine the segmentation map. In addition, a channel–spectral–spatial-attention module is proposed to optimize the information transmission between different subnetworks. Experiments were conducted on three benchmark hyperspectral datasets, and the results demonstrate that the proposed method outperforms state-of-the-art methods with the overall accuracy of 90.31%, 91.64%, and 81.35% and the average accuracy of 93.18%, 87.45%, and 78.85% over Salinas Valley, Pavia University and Indian Pines dataset, respectively. It illustrates that the proposed TAP-Net is able to effectively exploit the spatial–spectral information to ensure high performance. Full article
Show Figures

Graphical abstract

22 pages, 1505 KiB  
Article
Seasonal Variations of Daytime Land Surface Temperature and Their Underlying Drivers over Wuhan, China
by Liang Chen, Xuelei Wang, Xiaobin Cai, Chao Yang and Xiaorong Lu
Remote Sens. 2021, 13(2), 323; https://doi.org/10.3390/rs13020323 - 19 Jan 2021
Cited by 45 | Viewed by 4640
Abstract
Rapid urbanization greatly alters land surface vegetation cover and heat distribution, leading to the development of the urban heat island (UHI) effect and seriously affecting the healthy development of cities and the comfort of living. As an indicator of urban health and livability, [...] Read more.
Rapid urbanization greatly alters land surface vegetation cover and heat distribution, leading to the development of the urban heat island (UHI) effect and seriously affecting the healthy development of cities and the comfort of living. As an indicator of urban health and livability, monitoring the distribution of land surface temperature (LST) and discovering its main impacting factors are receiving increasing attention in the effort to develop cities more sustainably. In this study, we analyzed the spatial distribution patterns of LST of the city of Wuhan, China, from 2013 to 2019. We detected hot and cold poles in four seasons through clustering and outlier analysis (based on Anselin local Moran’s I) of LST. Furthermore, we introduced the geographical detector model to quantify the impact of six physical and socio-economic factors, including the digital elevation model (DEM), index-based built-up index (IBI), modified normalized difference water index (MNDWI), normalized difference vegetation index (NDVI), population, and Gross Domestic Product (GDP) on the LST distribution of Wuhan. Finally, to identify the influence of land cover on temperature, the LST of croplands, woodlands, grasslands, and built-up areas was analyzed. The results showed that low temperatures are mainly distributed over water and woodland areas, followed by grasslands; high temperatures are mainly concentrated over built-up areas. The maximum temperature difference between land covers occurs in spring and summer, while this difference can be ignored in winter. MNDWI, IBI, and NDVI are the key driving factors of the thermal values change in Wuhan, especially of their interaction. We found that the temperature of water area and urban green space (woodlands and grasslands) tends to be 5.4 °C and 2.6 °C lower than that of built-up areas. Our research results can contribute to the urban planning and urban greening of Wuhan and promote the healthy and sustainable development of the city. Full article
Show Figures

Graphical abstract

22 pages, 75112 KiB  
Article
A Density-Based Algorithm for the Detection of Individual Trees from LiDAR Data
by Melissa Latella, Fabio Sola and Carlo Camporeale
Remote Sens. 2021, 13(2), 322; https://doi.org/10.3390/rs13020322 - 19 Jan 2021
Cited by 34 | Viewed by 5050
Abstract
Nowadays, LiDAR is widely used for individual tree detection, usually providing higher accuracy in coniferous stands than in deciduous ones, where the rounded-crown, the presence of understory vegetation, and the random spatial tree distribution may affect the identification algorithms. In this work, we [...] Read more.
Nowadays, LiDAR is widely used for individual tree detection, usually providing higher accuracy in coniferous stands than in deciduous ones, where the rounded-crown, the presence of understory vegetation, and the random spatial tree distribution may affect the identification algorithms. In this work, we propose a novel algorithm that aims to overcome these difficulties and yield the coordinates and the height of the individual trees on the basis of the point density features of the input point cloud. The algorithm was tested on twelve deciduous areas, assessing its performance on both regular-patterned plantations and stands with randomly distributed trees. For all cases, the algorithm provides high accuracy tree count (F-score > 0.7) and satisfying stem locations (position error around 1.0 m). In comparison to other common tools, the algorithm is weakly sensitive to the parameter setup and can be applied with little knowledge of the study site, thus reducing the effort and cost of field campaigns. Furthermore, it demonstrates to require just 2 points·m2 as minimum point density, allowing for the analysis of low-density point clouds. Despite its simplicity, it may set the basis for more complex tools, such as those for crown segmentation or biomass computation, with potential applications in forest modeling and management. Full article
(This article belongs to the Special Issue 3D Point Clouds in Forest Remote Sensing)
Show Figures

Graphical abstract

27 pages, 14084 KiB  
Article
New Method for Automated Quantification of Vertical Spatio-Temporal Changes within Gully Cross-Sections Based on Very-High-Resolution Models
by Ante Šiljeg, Fran Domazetović, Ivan Marić, Nina Lončar and Lovre Panđa
Remote Sens. 2021, 13(2), 321; https://doi.org/10.3390/rs13020321 - 19 Jan 2021
Cited by 10 | Viewed by 2797
Abstract
Gully erosion is one of the most prominent natural denudation processes of the Mediterranean. It causes significant soil degradation and sediment yield. Most traditional field methods for measurement of erosion-induced spatio-temporal changes are time and labor consuming, while their accuracy and precision are [...] Read more.
Gully erosion is one of the most prominent natural denudation processes of the Mediterranean. It causes significant soil degradation and sediment yield. Most traditional field methods for measurement of erosion-induced spatio-temporal changes are time and labor consuming, while their accuracy and precision are highly influenced by various factors. The main research question of this study was how the measurement approach of traditional field sampling methods can be automated and upgraded, while satisfying the required measurement accuracy. The VERTICAL method was developed as a fully automated raster-based method for detection and quantification of vertical spatio-temporal changes within a large number of gully cross-sections (GCs). The developed method was tested on the example of gully Santiš, located at Pag Island, Croatia. Repeat unmanned aerial vehicle (UAV) photogrammetry was used, as a cost-effective and practical method for the creation of very-high-resolution (VHR) digital surface models (DSMs) of the chosen gully site. A repeat aerophotogrammetric system (RAPS) was successfully assembled and integrated into one functional operating system. RAPS was successfully applied for derivation of interval (the two-year research period) DSMs (1.9 cm/pix) of gully Santiš with the accuracy of ±5 cm. VERTICAL generated and measured 2379 GCs, along the 110 m long thalweg of gully Santiš, within which 749 052 height points were sampled in total. VERTICAL proved to be a fast and reliable method for automated detection and calculation of spatio-temporal changes in a large number of GCs, which solved some significant shortcomings of traditional field methods. The versatility and adaptability of VERTICAL allow its application for other, similar scientific purposes, where multitemporal accurate measurement of spatio-temporal changes in GCs is required (e.g., river material dynamics, ice mass dynamics, tufa sedimentation and erosion). Full article
(This article belongs to the Section Remote Sensing in Geology, Geomorphology and Hydrology)
Show Figures

Graphical abstract

17 pages, 18650 KiB  
Article
Using Sentinel-2 Images to Estimate Topography, Tidal-Stage Lags and Exposure Periods over Large Intertidal Areas
by José P. Granadeiro, João Belo, Mohamed Henriques, João Catalão and Teresa Catry
Remote Sens. 2021, 13(2), 320; https://doi.org/10.3390/rs13020320 - 19 Jan 2021
Cited by 7 | Viewed by 4564
Abstract
Intertidal areas provide key ecosystem services but are declining worldwide. Digital elevation models (DEMs) are important tools to monitor the evolution of such areas. In this study, we aim at (i) estimating the intertidal topography based on an established pixel-wise algorithm, from Sentinel-2 [...] Read more.
Intertidal areas provide key ecosystem services but are declining worldwide. Digital elevation models (DEMs) are important tools to monitor the evolution of such areas. In this study, we aim at (i) estimating the intertidal topography based on an established pixel-wise algorithm, from Sentinel-2 MultiSpectral Instrument scenes, (ii) implementing a set of procedures to improve the quality of such estimation, and (iii) estimating the exposure period of the intertidal area of the Bijagós Archipelago, Guinea-Bissau. We first propose a four-parameter logistic regression to estimate intertidal topography. Afterwards, we develop a novel method to estimate tide-stage lags in the area covered by a Sentinel-2 scene to correct for geographical bias in topographic estimation resulting from differences in water height within each image. Our method searches for the minimum differences in height estimates obtained from rising and ebbing tides separately, enabling the estimation of cotidal lines. Tidal-stage differences estimated closely matched those published by official authorities. We re-estimated pixel heights from which we produced a model of intertidal exposure period. We obtained a high correlation between predicted and in-situ measurements of exposure period. We highlight the importance of remote sensing to deliver large-scale intertidal DEM and tide-stage data, with relevance for coastal safety, ecology and biodiversity conservation. Full article
(This article belongs to the Section Environmental Remote Sensing)
Show Figures

Graphical abstract

15 pages, 5444 KiB  
Article
A Continental-Scale Assessment of Density, Size, Distribution and Historical Trends of Farm Dams Using Deep Learning Convolutional Neural Networks
by Martino E. Malerba, Nicholas Wright and Peter I. Macreadie
Remote Sens. 2021, 13(2), 319; https://doi.org/10.3390/rs13020319 - 18 Jan 2021
Cited by 25 | Viewed by 10170
Abstract
Farm dams are a ubiquitous limnological feature of agricultural landscapes worldwide. While their primary function is to capture and store water, they also have disproportionally large effects on biodiversity and biogeochemical cycling, with important relevance to several Sustainable Development Goals (SDGs). However, the [...] Read more.
Farm dams are a ubiquitous limnological feature of agricultural landscapes worldwide. While their primary function is to capture and store water, they also have disproportionally large effects on biodiversity and biogeochemical cycling, with important relevance to several Sustainable Development Goals (SDGs). However, the abundance and distribution of farm dams is unknown in most parts of the world. Therefore, we used artificial intelligence and remote sensing data to address this critical global information gap. Specifically, we trained a deep learning convolutional neural network (CNN) on high-definition satellite images to detect farm dams and carry out the first continental-scale assessment on density, distribution and historical trends. We found that in Australia there are 1.765 million farm dams that occupy an area larger than Rhode Island (4678 km2) and store over 20 times more water than Sydney Harbour (10,990 GL). The State of New South Wales recorded the highest number of farm dams (654,983; 37% of the total) and Victoria the highest overall density (1.73 dams km−2). We also estimated that 202,119 farm dams (11.5%) remain omitted from any maps, especially in South Australia, Western Australia and the Northern Territory. Three decades of historical records revealed an ongoing decrease in the construction rate of farm dams, from >3% per annum before 2000, to ~1% after 2000, to <0.05% after 2010—except in the Australian Capital Territory where rates have remained relatively high. We also found systematic trends in construction design: farm dams built in 2015 are on average 50% larger in surface area and contain 66% more water than those built in 1989. To facilitate sharing information on sustainable farm dam management with authorities, scientists, managers and local communities, we developed AusDams.org—a free interactive portal to visualise and generate statistics on the physical, environmental and ecological impacts of farm dams. Full article
(This article belongs to the Special Issue Applications of Remote Sensing in Limnology)
Show Figures

Graphical abstract

17 pages, 4981 KiB  
Article
Hazardous Noxious Substance Detection Based on Ground Experiment and Hyperspectral Remote Sensing
by Jae-Jin Park, Kyung-Ae Park, Pierre-Yves Foucher, Philippe Deliot, Stephane Le Floch, Tae-Sung Kim, Sangwoo Oh and Moonjin Lee
Remote Sens. 2021, 13(2), 318; https://doi.org/10.3390/rs13020318 - 18 Jan 2021
Cited by 8 | Viewed by 2950
Abstract
With an increase in the overseas maritime transport of hazardous and noxious substances (HNSs), HNS-related spill accidents are on the rise. Thus, there is a need to completely understand the physical and chemical properties of HNSs. This can be achieved through establishing a [...] Read more.
With an increase in the overseas maritime transport of hazardous and noxious substances (HNSs), HNS-related spill accidents are on the rise. Thus, there is a need to completely understand the physical and chemical properties of HNSs. This can be achieved through establishing a library of spectral characteristics with respect to wavelengths from visible and near-infrared (VNIR) bands to shortwave infrared (SWIR) wavelengths. In this study, a ground HNS measurement experiment was conducted for artificially spilled HNS by using two hyperspectral cameras at VNIR and SWIR wavelengths. Representative HNSs such as styrene and toluene were spilled into an outdoor pool and their spectral characteristics were obtained. The relative ratio of HNS to seawater decreased and increased at 550 nm and showed different constant ratios at the SWIR wavelength. Noise removal and dimensional compression procedures were conducted by applying principal component analysis on HNS hyperspectral images. Pure HNS and seawater endmember spectra were extracted using four spectral mixture techniques—N-FINDR, pixel purity index (PPI), independent component analysis (ICA), and vertex component analysis (VCA). The accuracy of detection values of styrene and toluene through the comparison of the abundance fraction were 99.42% and 99.56%, respectively. The results of this study are useful for spectrum-based HNS detection in marine HNS accidents. Full article
(This article belongs to the Special Issue Optical Oceanographic Observation)
Show Figures

Figure 1

20 pages, 7870 KiB  
Article
Landslide Hazard Assessment Map as an Element Supporting Spatial Planning: The Flysch Carpathians Region Study
by Izabela Skrzypczak, Wanda Kokoszka, Dawid Zientek, Yongjing Tang and Janusz Kogut
Remote Sens. 2021, 13(2), 317; https://doi.org/10.3390/rs13020317 - 18 Jan 2021
Cited by 19 | Viewed by 3488
Abstract
Landslides and rock falls are among the many phenomena that have an impact on sustainable construction and infrastructure safety. The main causes of landslides are natural meteorological and hydrological phenomena. In building design and construction, environmental monitoring by identifying geotechnical hazards must be [...] Read more.
Landslides and rock falls are among the many phenomena that have an impact on sustainable construction and infrastructure safety. The main causes of landslides are natural meteorological and hydrological phenomena. In building design and construction, environmental monitoring by identifying geotechnical hazards must be taken into account, as appropriate hazard assessment contributes to ensuring future construction safety. The Carpathian region in southern Poland is particularly predisposed to landslide formation. This may be favored by the nature of the shapes associated with the high and steep slopes of the region’s valleys. Another reason for concern is the flysch geological structure, which is characterized by alternating layers of water-permeable sandstones and poorly permeable shales, clays, and marls. Furthermore, the presence of a quaternary weathering cover makes the geological structure more susceptible to landslide processes and tectonic formations. The paper presents the results of a study whose aim was to elaborate a detailed landslide hazard map for a selected area in the Polish Carpathians, using statistical methods. The approach is based on the Hellwig method, which seems particularly useful in the assessment of susceptibility and landslide hazards on a local scale for a relatively small area. A two-stage study was conducted. The first stage of the research involved the creation of a database associated with environmental parameters and triggering factors, whereas the second stage consisted of the adoption of weights for seven thematic sections and their special features on the basis of expert knowledge. The hazard map developed as a result was compared to the mapping made using the weight-of-evidence method. The proposed data normalization method allows the use and analysis of both qualitative and quantitative data collected from various sources. The advantage of this method is the simple calculation procedure. A large-scale (1:2000) map might be used to assess the landslide hazard for specific cadastral units. Such a map becomes the basis for municipal spatial planning and may be able to influence investment decisions. Detailed landslide hazard maps are crucial for more precise risk evaluation for specific cadastral units. This, in turn, allows one to reduce serious economic and social losses, which might be the future results of landslides. Full article
(This article belongs to the Special Issue Geoinformation Technologies in Civil Engineering and the Environment)
Show Figures

Graphical abstract

20 pages, 7224 KiB  
Article
Impacts of Urbanization on the Muthurajawela Marsh and Negombo Lagoon, Sri Lanka: Implications for Landscape Planning towards a Sustainable Urban Wetland Ecosystem
by Darshana Athukorala, Ronald C. Estoque, Yuji Murayama and Bunkei Matsushita
Remote Sens. 2021, 13(2), 316; https://doi.org/10.3390/rs13020316 - 18 Jan 2021
Cited by 36 | Viewed by 9248
Abstract
Urban wetland ecosystems (UWEs) play important social and ecological roles but are often adversely affected by urban landscape transformations. Spatio-temporal analyses to gain insights into the trajectories of landscape changes in these ecosystems are needed for better landscape planning towards sustainable UWEs. In [...] Read more.
Urban wetland ecosystems (UWEs) play important social and ecological roles but are often adversely affected by urban landscape transformations. Spatio-temporal analyses to gain insights into the trajectories of landscape changes in these ecosystems are needed for better landscape planning towards sustainable UWEs. In this study, we examined the impacts of urbanization on the Muthurajawela Marsh and Negombo Lagoon (MMNL), an important UWE in Sri Lanka that provides valuable ecosystem services. We used remote sensing data to detect changes in the land use/cover (LUC) of the MMNL over a two-decade period (1997–2017) and spatial metrics to characterize changes in landscape composition and configuration. The results revealed that the spatial and socio-economic elements of rapid urbanization of the MMNL had been the main driver of transformation of its natural environment over the past 20 years. This is indicated by a substantial expansion of settlements (+68%) and a considerable decrease of marshland and mangrove cover (−41% and −21%, respectively). A statistical analysis revealed a significant relationship between the change in population density and the loss of wetland due to settlement expansion at the Grama Niladhari division level (n = 99) (where wetland includes marshland, mangrove, and water) (1997–2007: R2 = 0.435, p = 0.000; 2007–2017: R2 = 0.343, p = 0.000). The findings also revealed that most of the observed LUC changes occurred in areas close to roads and growth nodes (viz. Negombo, Ja-Ela, Wattala, and Katana), which resulted in both landscape fragmentation and infill urban expansion. We conclude that, in order to ensure the sustainability of the MMNL, there is an urgent need for forward-looking landscape and urban planning to promote environmentally conscious urban development in the area which is a highly valuable UWE. Full article
Show Figures

Graphical abstract

16 pages, 5729 KiB  
Article
Observations of Mesoscale Eddies in Satellite SSS and Inferred Eddy Salt Transport
by Oleg Melnichenko, Peter Hacker and Vasco Müller
Remote Sens. 2021, 13(2), 315; https://doi.org/10.3390/rs13020315 - 18 Jan 2021
Cited by 11 | Viewed by 3653
Abstract
Observations of sea surface salinity (SSS) from NASA’s Soil Moisture Active-Passive (SMAP) and ESA’s Soil Moisture and Ocean Salinity (SMOS) satellite missions are used to characterize and quantify the contribution of mesoscale eddies to the ocean transport of salt. Given large errors in [...] Read more.
Observations of sea surface salinity (SSS) from NASA’s Soil Moisture Active-Passive (SMAP) and ESA’s Soil Moisture and Ocean Salinity (SMOS) satellite missions are used to characterize and quantify the contribution of mesoscale eddies to the ocean transport of salt. Given large errors in satellite retrievals and, consequently, SSS maps, we evaluate two products from the two missions and also use two different methods to assess the eddy transport of salt. Comparing the two missions, we find that the estimates of the eddy transport of salt agree very well, particularly in the tropics and subtropics. The transport is divergent in the subtropical gyres (eddies pump salt out of the gyres) and convergent in the tropics. The estimates from the two satellites start to differ regionally at higher latitudes, particularly in the Southern Ocean and along the Antarctic Circumpolar Current (ACC), resulting, presumably, from a considerable increase in the level of noise in satellite retrievals (because of poor sensitivity of the satellite radiometer to SSS in cold water), or they can be due to insufficient spatial resolution. Overall, our study demonstrates that the possibility of characterizing and quantifying the eddy transport of salt in the ocean surface mixed layer can rely on the use of satellite observations of SSS. Yet, new technologies are required to improve the resolution capabilities of future satellite missions in order to observe mesoscale and sub-mesoscale variability, improve the signal-to-noise ratio, and extend these capabilities to the polar oceans. Full article
(This article belongs to the Special Issue Moving Forward on Remote Sensing of Sea Surface Salinity)
Show Figures

Graphical abstract

15 pages, 5906 KiB  
Technical Note
Pandemic Induced Changes in Economic Activity around African Protected Areas Captured through Night-Time Light Data
by Anupam Anand and Do-Hyung Kim
Remote Sens. 2021, 13(2), 314; https://doi.org/10.3390/rs13020314 - 18 Jan 2021
Cited by 29 | Viewed by 4894
Abstract
The importance of tourism for development is widely recognized. Travel restrictions imposed to contain the spread of COVID-19 have brought tourism to a halt. Tourism is one of the key sectors driving change in Africa and is based exclusively on natural assets, with [...] Read more.
The importance of tourism for development is widely recognized. Travel restrictions imposed to contain the spread of COVID-19 have brought tourism to a halt. Tourism is one of the key sectors driving change in Africa and is based exclusively on natural assets, with wildlife being the main attraction. Economic activities, therefore, are clustered around conservation and protected areas. We used night-time light data as a proxy measure for economic activity to assess change due to the pandemic. Our analysis shows that overall, 75 percent of the 8427 protected areas saw a decrease in light intensity in varying degrees in all countries and across IUCN protected area categories, including in popular protected area destinations, indicating a reduction in tourism-related economic activities. As countries discuss COVID-19 recovery, the methods using spatially explicit data illustrated in this paper can assess the extent of change, inform decision-making, and prioritize recovery efforts. Full article
(This article belongs to the Special Issue Remote Sensing of Night-Time Light)
Show Figures

Graphical abstract

27 pages, 29811 KiB  
Article
Spatiotemporal Variation of the Burned Area and Its Relationship with Climatic Factors in Central Kazakhstan
by Yongfang Xu, Zhaohui Lin and Chenglai Wu
Remote Sens. 2021, 13(2), 313; https://doi.org/10.3390/rs13020313 - 18 Jan 2021
Cited by 9 | Viewed by 2170
Abstract
Central Asia is prone to wildfires, but the relationship between wildfires and climatic factors in this area is still not clear. In this study, the spatiotemporal variation in wildfire activities across Central Asia during 1997–2016 in terms of the burned area (BA) was [...] Read more.
Central Asia is prone to wildfires, but the relationship between wildfires and climatic factors in this area is still not clear. In this study, the spatiotemporal variation in wildfire activities across Central Asia during 1997–2016 in terms of the burned area (BA) was investigated with Global Fire Emission Database version 4s (GFED4s). The relationship between BA and climatic factors in the region was also analyzed. The results reveal that more than 90% of the BA across Central Asia is located in Kazakhstan. The peak BA occurs from June to September, and remarkable interannual variation in wildfire activities occurs in western central Kazakhstan (WCKZ). At the interannual scale, the BA is negatively correlated with precipitation (correlation coefficient r = −0.66), soil moisture (r = −0.68), and relative humidity (r = −0.65), while it is positively correlated with the frequency of hot days (r = 0.37) during the burning season (from June to September). Composite analysis suggests that the years in which the BA is higher are generally associated with positive geopotential height anomalies at 500 hPa over the WCKZ region, which lead to the strengthening of the downdraft at 500 hPa and the weakening of westerlies at 850 hPa over the region. The weakened westerlies suppress the transport of water vapor from the Atlantic Ocean to the WCKZ region, resulting in decreased precipitation, soil moisture, and relative humidity in the lower atmosphere over the WCKZ region; these conditions promote an increase in BA throughout the region. Moreover, the westerly circulation index is positively correlated (r = 0.53) with precipitation anomalies and negatively correlated (r = −0.37) with BA anomalies in the WCKZ region during the burning season, which further underscores that wildfires associated with atmospheric circulation systems are becoming an increasingly important component of the relationship between climate and wildfire. Full article
Show Figures

Graphical abstract

24 pages, 19013 KiB  
Article
Error Correction of Multi-Source Weighted-Ensemble Precipitation (MSWEP) over the Lancang-Mekong River Basin
by Xiongpeng Tang, Jianyun Zhang, Guoqing Wang, Gebdang Biangbalbe Ruben, Zhenxin Bao, Yanli Liu, Cuishan Liu and Junliang Jin
Remote Sens. 2021, 13(2), 312; https://doi.org/10.3390/rs13020312 - 18 Jan 2021
Cited by 11 | Viewed by 3274
Abstract
The demand for accurate long-term precipitation data is increasing, especially in the Lancang-Mekong River Basin (LMRB), where ground-based data are mostly unavailable and inaccessible in a timely manner. Remote sensing and reanalysis quantitative precipitation products provide unprecedented observations to support water-related research, but [...] Read more.
The demand for accurate long-term precipitation data is increasing, especially in the Lancang-Mekong River Basin (LMRB), where ground-based data are mostly unavailable and inaccessible in a timely manner. Remote sensing and reanalysis quantitative precipitation products provide unprecedented observations to support water-related research, but these products are inevitably subject to errors. In this study, we propose a novel error correction framework that combines products from various institutions. The NASA Modern-Era Retrospective Analysis for Research and Applications (AgMERRA), the Asian Precipitation Highly-Resolved Observational Data Integration Towards Evaluation of Water Resources (APHRODITE), the Climate Hazards group InfraRed Precipitation with Stations (CHIRPS), the Multi-Source Weighted-Ensemble Precipitation Version 1.0 (MSWEP), and the Precipitation Estimation from Remotely Sensed Information using Artificial Neural Networks-Climate Data Records (PERSIANN) were used. Ground-based precipitation data from 1998 to 2007 were used to select precipitation products for correction, and the remaining 1979–1997 and 2008–2014 observe data were used for validation. The resulting precipitation products MSWEP-QM derived from quantile mapping (QM) and MSWEP-LS derived from linear scaling (LS) are evaluated by statistical indicators and hydrological simulation across the LMRB. Results show that the MSWEP-QM and MSWEP-LS can better capture major annual precipitation centers, have excellent simulation results, and reduce the mean BIAS and mean absolute BIAS at most gauges across the LMRB. The two corrected products presented in this study constitute improved climatological precipitation data sources, both time and space, outperforming the five raw gridded precipitation products. Among the two corrected products, in terms of mean BIAS, MSWEP-LS was slightly better than MSWEP-QM at grid-scale, point scale, and regional scale, and it also had better simulation results at all stations except Strung Treng. During the validation period, the average absolute value BIAS of MSWEP-LS and MSWEP-QM decreased by 3.51% and 3.4%, respectively. Therefore, we recommend that MSWEP-LS be used for water-related scientific research in the LMRB. Full article
(This article belongs to the Special Issue Remote Sensing in Hydrology and Water Resources Management)
Show Figures

Graphical abstract

17 pages, 4798 KiB  
Article
Ecological and Environmental Effects of Estuarine Wetland Loss Using Keyhole and Landsat Data in Liao River Delta, China
by Hongyan Yin, Yuanman Hu, Miao Liu, Chunlin Li and Jiujun Lv
Remote Sens. 2021, 13(2), 311; https://doi.org/10.3390/rs13020311 - 18 Jan 2021
Cited by 6 | Viewed by 3476
Abstract
An estuarine wetland is an area of high ecological productivity and biodiversity, and it is also an anthropic activity hotspot area, which is of concern. The wetlands in estuarine areas have suffered declines, which have had remarkable ecological impacts. The land use changes, [...] Read more.
An estuarine wetland is an area of high ecological productivity and biodiversity, and it is also an anthropic activity hotspot area, which is of concern. The wetlands in estuarine areas have suffered declines, which have had remarkable ecological impacts. The land use changes, especially wetland loss, were studied based on Keyhole and Landsat images in the Liao River delta from 1962 to 2016. The dynamics of the ecosystem service values (ESVs), suitable habitat for birds, and soil heavy metal potential ecological risk were chosen to estimate the ecological effects with the benefit transfer method, synthetic overlaying method, and potential ecological risk index (RI) method, respectively. The driving factors of land use change and ecological effects were analyzed with redundancy analysis (RDA). The results showed that the built-up area increased from 95.98 km2 in 1962 to 591.49 km2 in 2016, and this large change was followed by changes in paddy fields (1351.30 to 1522.39 km2) and dry farmland (189.5 to 294.14 km2). The area of wetlands declined from 1823.16 km2 in 1962 to 1153.52 km2 in 2016, and this change was followed by a decrease in the water area (546.2 to 428.96 km2). The land use change was characterized by increasing built-up (516.25%), paddy fields (12.66%) and dry farmland (55.22%) areas and a decline in the wetland (36.73%) and water areas (21.47%) from 1962–2016. Wetlands decreased by 669.64 km2. The ESV values declined from 6.24 billion US$ to 4.46 billion US$ from 1962 to 2016, which means the ESVs were reduced by 19.26% due to wetlands being cultivated and the urbanization process. The area of suitable habitat for birds decreased by 1449.49 km2, or 61.42% of the total area available in 1962. Cd was the primary soil heavy metal pollutant based on its concentration, accumulation, and potential ecological risk contribution. The RDA showed that the driving factors of comprehensive ecological effects include wetland area, Cd and Cr concentration, river and oil well distributions. This study provides a comprehensive approach for estuarine wetland cultivation and scientific support for wetland conservation. Full article
(This article belongs to the Special Issue Remote Sensing of Wetlands)
Show Figures

Graphical abstract

19 pages, 10556 KiB  
Article
A Field Weed Density Evaluation Method Based on UAV Imaging and Modified U-Net
by Kunlin Zou, Xin Chen, Fan Zhang, Hang Zhou and Chunlong Zhang
Remote Sens. 2021, 13(2), 310; https://doi.org/10.3390/rs13020310 - 18 Jan 2021
Cited by 36 | Viewed by 5001
Abstract
Weeds are one of the main factors affecting the yield and quality of agricultural products. Accurate evaluation of weed density is of great significance for field management, especially precision weeding. In this paper, a weed density calculating and mapping method in the field [...] Read more.
Weeds are one of the main factors affecting the yield and quality of agricultural products. Accurate evaluation of weed density is of great significance for field management, especially precision weeding. In this paper, a weed density calculating and mapping method in the field is proposed. An unmanned aerial vehicle (UAV) was used to capture field images. The excess green minus excess red index, combined with the minimum error threshold segmentation method, was used to segment green plants and bare land. A modified U-net was used to segment crops from images. After removing the bare land and crops from the field, images of weeds were obtained. The weed density was evaluated by the ratio of weed area to total area on the segmented image. The accuracy of the green plant segmentation was 93.5%. In terms of crop segmentation, the intersection over union (IoU) was 93.40%, and the segmentation time of a single image was 35.90 ms. Finally, the determination coefficient of the UAV evaluated weed density and the manually observed weed density was 0.94, and the root mean square error was 0.03. With the proposed method, the weed density of a field can be effectively evaluated from UAV images, hence providing critical information for precision weeding. Full article
(This article belongs to the Special Issue Precision Weed Mapping and Management Based on Remote Sensing)
Show Figures

Graphical abstract

18 pages, 20806 KiB  
Article
Spatiotemporal Characteristics of Freeze-Thawing Erosion in the Source Regions of the Chin-Sha, Ya-Lung and Lantsang Rivers on the Basis of GIS
by Yuefeng Lu, Cong Liu, Yong Ge, Yulong Hu, Qiao Wen, Zhongliang Fu, Shaobo Wang and Yong Liu
Remote Sens. 2021, 13(2), 309; https://doi.org/10.3390/rs13020309 - 17 Jan 2021
Cited by 10 | Viewed by 2497
Abstract
Freeze-thawing erosion is mainly distributed in the tundra, which is one of the main factors affecting soil erosion and soil conservation and affects the economic development of relevant countries and regions. The study area was selected to the north of Tanggula Mountain and [...] Read more.
Freeze-thawing erosion is mainly distributed in the tundra, which is one of the main factors affecting soil erosion and soil conservation and affects the economic development of relevant countries and regions. The study area was selected to the north of Tanggula Mountain and the south of Bayankera Mountain, to the east of The Qinghai-Tibet Plateau, as the headwaters of the Yangtze River and lancang River. The topography and climate were particularly prone to soil freeze-thawing erosion, and the ecological damage would seriously affect the production and life of people in the whole downstream area. Therefore, based on the analytic hierarchy process (AHP), this paper selects seven evaluation factors to analyze the temporal and spatial characteristics of freeze-thaw erosion in the study area and establishes a comprehensive weight evaluation model for freeze-thaw erosion. The results show that: (1) the evaluation model is effective, and the soil freeze-thawing erosion is strong in the whole research area; (2) the total area of the research area and the freeze-thawing erosion area are 418,843 km2 and 375,514 km2 respectively, the freeze-thawing erosion area accounting for 89.7% of the total research area, and the freeze-thawing erosion intensity ranged from 0.165 to 0.737; (3) the spatial distribution differs significantly, the freeze-thawing erosion intensity is mainly concentrated in high altitude areas, especially in the Tanggula Mountains; (4) slope, poor annual temperature, illumination, altitude and content of sand in soil accelerate soil freeze-thawing erosion, whereas vegetation index does not; wetness index enhanced the influence of vegetation coverage and sand content. (5) this research will provide scientific evidence for protection and restoration of ecological environment in the area. Full article
(This article belongs to the Special Issue Remote Sensing of Floodplain Rivers and Freshwater Ecosystems)
Show Figures

Figure 1

19 pages, 3796 KiB  
Article
Exploring the Suitability of UAS-Based Multispectral Images for Estimating Soil Organic Carbon: Comparison with Proximal Soil Sensing and Spaceborne Imagery
by James Kobina Mensah Biney, Mohammadmehdi Saberioon, Luboš Borůvka, Jakub Houška, Radim Vašát, Prince Chapman Agyeman, João Augusto Coblinski and Aleš Klement
Remote Sens. 2021, 13(2), 308; https://doi.org/10.3390/rs13020308 - 17 Jan 2021
Cited by 21 | Viewed by 4032
Abstract
Soil organic carbon (SOC) is a variable of vital environmental significance in terms of soil quality and function, global food security, and climate change mitigation. Estimation of its content and prediction accuracy on a broader scale remain crucial. Although, spectroscopy under proximal sensing [...] Read more.
Soil organic carbon (SOC) is a variable of vital environmental significance in terms of soil quality and function, global food security, and climate change mitigation. Estimation of its content and prediction accuracy on a broader scale remain crucial. Although, spectroscopy under proximal sensing remains one of the best approaches to accurately predict SOC, however, spectroscopy limitation to estimate SOC on a larger spatial scale remains a concern. Therefore, for an efficient quantification of SOC content, faster and less costly techniques are needed, recent studies have suggested the use of remote sensing approaches. The primary aim of this research was to evaluate and compare the capabilities of small Unmanned Aircraft Systems (UAS) for monitoring and estimation of SOC with those obtained from spaceborne (Sentinel-2) and proximal soil sensing (field spectroscopy measurements) on an agricultural field low in SOC content. Nine calculated spectral indices were added to the remote sensing approaches (UAS and Sentinel-2) to enhance their predictive accuracy. Modeling was carried out using various bands/wavelength (UAS (6), Sentinel-2 (9)) and the calculated spectral indices were used as independent variables to generate soil prediction models using five-fold cross-validation built using random forest (RF) and support vector machine regression (SVMR). The correlation regarding SOC and the selected indices and bands/wavelengths was determined prior to the prediction. Our results revealed that the selected spectral indices slightly influenced the output of UAS compared to Sentinel-2 dataset as the latter had only one index correlated with SOC. For prediction, the models built on UAS data had a better accuracy with RF than the two other data used. However, using SVMR, the field spectral prediction models achieved a better overall result for the entire study (log(1/R), RPD = 1.40; R2CV = 0.48; RPIQ = 1.65; RMSEPCV = 0.24), followed by UAS and then Sentinel-2, respectively. This study has shown that UAS imagery can be exploited efficiently using spectral indices. Full article
Show Figures

Figure 1

18 pages, 4693 KiB  
Article
Mangrove Phenology and Water Influences Measured with Digital Repeat Photography
by Veeranun Songsom, Werapong Koedsin, Raymond J. Ritchie and Alfredo Huete
Remote Sens. 2021, 13(2), 307; https://doi.org/10.3390/rs13020307 - 17 Jan 2021
Cited by 5 | Viewed by 2678
Abstract
The intertidal habitat of mangroves is very complex due to the dynamic roles of land and sea drivers. Knowledge of mangrove phenology can help in understanding mangrove growth cycles and their responses to climate and environmental changes. Studies of phenology based on digital [...] Read more.
The intertidal habitat of mangroves is very complex due to the dynamic roles of land and sea drivers. Knowledge of mangrove phenology can help in understanding mangrove growth cycles and their responses to climate and environmental changes. Studies of phenology based on digital repeat photography, or phenocams, have been successful in many terrestrial forests and other ecosystems, however few phenocam studies in mangrove forests showing the influence and interactions of water color and tidal water levels have been performed in sub-tropical and equatorial environments. In this study, we investigated the diurnal and seasonal patterns of an equatorial mangrove forest area at an Andaman Sea site in Phuket province, Southern Thailand, using two phenocams placed at different elevations and with different view orientations, which continuously monitored vegetation and water dynamics from July 2015 to August 2016. The aims of this study were to investigate fine-resolution, in situ mangrove forest phenology and assess the influence and interactions of water color and tidal water levels on the mangrove–water canopy signal. Diurnal and seasonal patterns of red, green, and blue chromatic coordinate (RCC, GCC, and BCC) indices were analyzed over various mangrove forest and water regions of interest (ROI). GCC signals from the water background were found to positively track diurnal water levels, while RCC signals were negatively related with tidal water levels, hence lower water levels yielded higher RCC values, reflecting brownish water colors and increased soil and mud exposure. At seasonal scales, the GCC profiles of the mangrove forest peaked in the dry season and were negatively related with the water level, however the inclusion of the water background signal dampened this relationship. We also detected a strong lunar tidal water periodicity in seasonal GCC values that was not only present in the water background, but was also detected in the mangrove–water canopy and mangrove forest phenology profiles. This suggests significant interactions between mangrove forests and their water backgrounds (color and depth), which may need to be accounted for in upscaling and coupling with satellite-based mangrove monitoring. Full article
(This article belongs to the Section Biogeosciences Remote Sensing)
Show Figures

Graphical abstract

21 pages, 5532 KiB  
Article
Aerial Imagery Feature Engineering Using Bidirectional Generative Adversarial Networks: A Case Study of the Pilica River Region, Poland
by Maciej Adamiak, Krzysztof Będkowski and Anna Majchrowska
Remote Sens. 2021, 13(2), 306; https://doi.org/10.3390/rs13020306 - 17 Jan 2021
Cited by 6 | Viewed by 3911
Abstract
Generative adversarial networks (GANs) are a type of neural network that are characterized by their unique construction and training process. Utilizing the concept of the latent space and exploiting the results of a duel between different GAN components opens up interesting opportunities for [...] Read more.
Generative adversarial networks (GANs) are a type of neural network that are characterized by their unique construction and training process. Utilizing the concept of the latent space and exploiting the results of a duel between different GAN components opens up interesting opportunities for computer vision (CV) activities, such as image inpainting, style transfer, or even generative art. GANs have great potential to support aerial and satellite image interpretation activities. Carefully crafting a GAN and applying it to a high-quality dataset can result in nontrivial feature enrichment. In this study, we have designed and tested an unsupervised procedure capable of engineering new features by shifting real orthophotos into the GAN’s underlying latent space. Latent vectors are a low-dimensional representation of the orthophoto patches that hold information about the strength, occurrence, and interaction between spatial features discovered during the network training. Latent vectors were combined with geographical coordinates to bind them to their original location in the orthophoto. In consequence, it was possible to describe the whole research area as a set of latent vectors and perform further spatial analysis not on RGB images but on their lower-dimensional representation. To accomplish this goal, a modified version of the big bidirectional generative adversarial network (BigBiGAN) has been trained on a fine-tailored orthophoto imagery dataset covering the area of the Pilica River region in Poland. Trained models, precisely the generator and encoder, have been utilized during the processes of model quality assurance and feature engineering, respectively. Quality assurance was performed by measuring model reconstruction capabilities and by manually verifying artificial images produced by the generator. The feature engineering use case, on the other hand, has been presented in a real research scenario that involved splitting the orthophoto into a set of patches, encoding the patch set into the GAN latent space, grouping similar patches latent codes by utilizing hierarchical clustering, and producing a segmentation map of the orthophoto. Full article
Show Figures

Graphical abstract

14 pages, 4066 KiB  
Article
Soil Salinity Mapping Using Machine Learning Algorithms with the Sentinel-2 MSI in Arid Areas, China
by Jiaqiang Wang, Jie Peng, Hongyi Li, Caiyun Yin, Weiyang Liu, Tianwei Wang and Huaping Zhang
Remote Sens. 2021, 13(2), 305; https://doi.org/10.3390/rs13020305 - 17 Jan 2021
Cited by 56 | Viewed by 7260
Abstract
Accurate monitoring of soil salinization plays a key role in the ecological security and sustainable agricultural development of arid regions. As a branch of artificial intelligence, machine learning acquires new knowledge through self-learning and continuously improves its own performance. The purpose of this [...] Read more.
Accurate monitoring of soil salinization plays a key role in the ecological security and sustainable agricultural development of arid regions. As a branch of artificial intelligence, machine learning acquires new knowledge through self-learning and continuously improves its own performance. The purpose of this study is to combine Sentinel-2 Multispectral Imager (MSI) data and MSI-derived covariates with measured soil salinity data and to apply three machine learning algorithms in modeling to estimate and map the soil salinity in the study sample area. According to the convenient transportation conditions, the study area and sampling quadrat were set up, and the 5-point method was used to collect the soil mixed samples, and 160 soil mixed samples were collected. Kennard–Stone (K–S) algorithm was used for sample classification, 70% for modeling and 30% for verification. The machine learning algorithm uses Support Vector Machines (SVM), Artificial Neural Network (ANN), and Random Forest (RF). The results showed that (1) the average reflectance of each band of the MSI data ranged from 0.21–0.28. According to the spectral characteristics corresponding to different soil electrical conductivity (EC) levels (1.07–79.6 dS m−1), the spectral reflectance of salinized soil in the MSI data ranged from 0.09–0.35. (2) The correlation coefficient between the MSI data and MSI-derived covariates and soil EC was moderate, and the correlation between certain MSI data sets and soil EC was not significant. (3) The SVM soil EC estimation model established with the MSI data set attained a higher performance and accuracy (R2 = 0.88, root mean square error (RMSE) = 4.89 dS m−1, and ratio of the performance to the interquartile range (RPIQ) = 1.96, standard error of the laboratory measurements to the standard error of the predictions (SEL/SEP) = 1.11) than those attained with the soil EC estimation models established with the RF and ANN models. (4) We applied the SVM soil EC estimation model to map the soil salinity in the study area, which showed that the farmland with higher altitudes discharged a large amount of salt to the surroundings due to long-term irrigation, and the secondary salinization of the farmland also caused a large amount of salt accumulation. This research provides a scientific basis for the simulation of soil salinization scenarios in arid areas in the future. Full article
(This article belongs to the Special Issue Advances of Proximal and Remote Sensing in Soil Salinity Mapping)
Show Figures

Graphical abstract

14 pages, 27296 KiB  
Article
A Single-Difference Multipath Hemispherical Map for Multipath Mitigation in BDS-2/BDS-3 Short Baseline Positioning
by Chao Liu, Yuan Tao, Haiqiang Xin, Xingwang Zhao, Chunyang Liu, Haojie Hu and Tengfei Zhou
Remote Sens. 2021, 13(2), 304; https://doi.org/10.3390/rs13020304 - 17 Jan 2021
Cited by 15 | Viewed by 2465
Abstract
The BeiDou Navigation Satellite System (BDS) features a heterogeneous constellation so that it is difficult to mitigate the multipath in the coordinate-domain. Therefore, mitigating the multipath in the observation-domain becomes more important. Sidereal filtering is commonly used for multipath mitigation, which needs to [...] Read more.
The BeiDou Navigation Satellite System (BDS) features a heterogeneous constellation so that it is difficult to mitigate the multipath in the coordinate-domain. Therefore, mitigating the multipath in the observation-domain becomes more important. Sidereal filtering is commonly used for multipath mitigation, which needs to calculate the orbit repeat time of each satellite. However, that poses a computational challenge and damages the integrity at the end of the multipath model. Therefore, this paper proposes a single-difference model based on the multipath hemispherical map (SD-MHM) to mitigate the BDS-2/BDS-3 multipath in a short baseline. The proposed method is converted from double-difference residuals to single-difference residuals, which is not restricted by the pivot satellite transformation. Moreover, it takes the elevation and the azimuth angles of the satellite as the independent variables of the multipath model. The SD-MHM overcomes the unequal observation time of some satellites and does not require specific hardware. The experimental results show that the SD-MHM reduces the root mean square of the positioning errors by 56.4%, 63.9%, and 67.4% in the east, north, and vertical directions; moreover, it contributes to an increase in the baseline accuracy from 1.97 to 0.84 mm. The proposed SD-MHM has significant advantages in multipath mitigation compared with the advanced sidereal filtering method. Besides, the SD-MHM also features an excellent multipath correction capability for observation data with a period of more than seven days. Therefore, the SD-MHM provides a universal strategy for BDS multipath mitigation. Full article
Show Figures

Figure 1

18 pages, 59509 KiB  
Article
Attribution of Long-Term Evapotranspiration Trends in the Mekong River Basin with a Remote Sensing-Based Process Model
by Shi Hu and Xingguo Mo
Remote Sens. 2021, 13(2), 303; https://doi.org/10.3390/rs13020303 - 16 Jan 2021
Cited by 12 | Viewed by 3265
Abstract
Using the Global Land Surface Satellite (GLASS) leaf area index (LAI), the actual evapotranspiration (ETa) and available water resources in the Mekong River Basin were estimated with the Remote Sensing-Based Vegetation Interface Processes Model (VIP-RS). The relative contributions of climate variables [...] Read more.
Using the Global Land Surface Satellite (GLASS) leaf area index (LAI), the actual evapotranspiration (ETa) and available water resources in the Mekong River Basin were estimated with the Remote Sensing-Based Vegetation Interface Processes Model (VIP-RS). The relative contributions of climate variables and vegetation greening to ETa were estimated with numerical experiments. The results show that the average ETa in the entire basin increased at a rate of 1.16 mm year−2 from 1980 to 2012 (36.7% of the area met the 95% significance level). Vegetation greening contributed 54.1% of the annual ETa trend, slightly higher than that of climate change. The contributions of air temperature, precipitation and the LAI were positive, whereas contributions of solar radiation and vapor pressure were negative. The effects of water supply and energy availability were equivalent on the variation of ETa throughout most of the basin, except the upper reach and downstream Mekong Delta. In the upper reach, climate warming played a critical role in the ETa variability, while the warming effect was offset by reduced solar radiation in the Mekong Delta (an energy-limited region). For the entire basin, the available water resources showed an increasing trend due to intensified precipitation; however, in downstream areas, additional pressure on available water resources is exerted due to cropland expansion with enhanced agricultural water consumption. The results provide scientific basis for practices of integrated catchment management and water resources allocation. Full article
(This article belongs to the Special Issue Remote Sensing in Hydrology and Water Resources Management)
Show Figures

Graphical abstract

13 pages, 4102 KiB  
Technical Note
Roll Calibration for CryoSat-2: A Comprehensive Approach
by Albert Garcia-Mondéjar, Michele Scagliola, Noel Gourmelen, Jerome Bouffard and Mònica Roca
Remote Sens. 2021, 13(2), 302; https://doi.org/10.3390/rs13020302 - 16 Jan 2021
Cited by 2 | Viewed by 2374
Abstract
CryoSat-2 is the first satellite mission carrying a high pulse repetition frequency radar altimeter with interferometric capability on board. Across track interferometry allows the angle to the point of closest approach to be determined by combining echoes received by two antennas and knowledge [...] Read more.
CryoSat-2 is the first satellite mission carrying a high pulse repetition frequency radar altimeter with interferometric capability on board. Across track interferometry allows the angle to the point of closest approach to be determined by combining echoes received by two antennas and knowledge of their orientation. Accurate information of the platform mispointing angles, in particular of the roll, is crucial to determine the angle of arrival in the across-track direction with sufficient accuracy. As a consequence, different methods were designed in the CryoSat-2 calibration plan in order to estimate interferometer performance along with the mission and to assess the roll’s contribution to the accuracy of the angle of arrival. In this paper, we present the comprehensive approach used in the CryoSat-2 Mission to calibrate the roll mispointing angle, combining analysis from external calibration of both man-made targets, i.e., transponder and natural targets. The roll calibration approach for CryoSat-2 is proven to guarantee that the interferometric measurements are exceeding the expected performance. Full article
(This article belongs to the Section Ocean Remote Sensing)
Show Figures

Graphical abstract

28 pages, 10622 KiB  
Article
Assessment of BRDF Impact on VIIRS DNB from Observed Top-of-Atmosphere Reflectance over Dome C in Nighttime
by Jinjin Li, Shi Qiu, Yu Zhang, Benyong Yang, Caixia Gao, Yonggang Qian, Yaokai Liu and Yongguang Zhao
Remote Sens. 2021, 13(2), 301; https://doi.org/10.3390/rs13020301 - 16 Jan 2021
Cited by 3 | Viewed by 2747
Abstract
The Day–Night Band (DNB) imaging sensor of the Visible Infrared Imaging Radiometer Suite (VIIRS) adds nighttime monitoring capability to the Suomi National Polar-Orbiting Partnership and National Oceanic and Atmospheric Administration 20 weather satellite launched in 2011 and 2017, respectively. Nighttime visible imagery has [...] Read more.
The Day–Night Band (DNB) imaging sensor of the Visible Infrared Imaging Radiometer Suite (VIIRS) adds nighttime monitoring capability to the Suomi National Polar-Orbiting Partnership and National Oceanic and Atmospheric Administration 20 weather satellite launched in 2011 and 2017, respectively. Nighttime visible imagery has already found diverse applications, but image quality is often unsatisfactory. In this study, variations in observed top-of-atmosphere (TOA) reflectance were examined in terms of nighttime bidirectional effects. The Antarctica Dome C ground site was selected due to high uniformity. First, variation of reflectance was characterized in terms of viewing zenith angle, lunar zenith angle, and relative lunar azimuth angle, using DNB data from 2012 to 2020 and Miller–Turner 2009 simulations. Variations in reflectance were observed to be strongly anisotropic, suggesting the presence of bidirectional effects. Then, based on this finding, three popular bidirectional reflectance distribution function (BRDF) models were evaluated for effectiveness in correcting for these effects on the nighttime images. The observed radiance of VIIRS DNB was compared with the simulated radiance respectively based on the three BRDF models under the same geometry. Compared with the RossThick-LiSparseReciprocal (RossLi) BRDF model and Hudson model, the Warren model has a higher correlation coefficient (0.9899–0.9945) and a lower root-mean-square-error (0.0383–0.0487). Moreover, the RossLi BRDF model and Hudson model may have similar effects in the description of the nighttime TOA over Dome C. These findings are potentially useful to evaluate the radiometric calibration stability and consistency of nighttime satellite sensors. Full article
Show Figures

Graphical abstract

Previous Issue
Back to TopTop