Article

Long-Term Projection of Water Cycle Changes over China Using RegCM

1
Faculty of Engineering and Applied Science, University of Regina, Regina, SK S4S 0A2, Canada
2
State Key Laboratory of Hydrology-Water Resources and Hydraulic Engineering, Nanjing Hydraulic Research Institute, Nanjing 210029, China
3
School of Climate Change and Adaptation, University of Prince Edward Island, 550 University Ave., Charlottetown, PE C1A 4P3, Canada
*
Author to whom correspondence should be addressed.
Remote Sens. 2021, 13(19), 3832; https://doi.org/10.3390/rs13193832
Submission received: 29 August 2021 / Revised: 21 September 2021 / Accepted: 23 September 2021 / Published: 25 September 2021
(This article belongs to the Special Issue Remote Sensing for Climate Change)

Abstract

:
The global water cycle is becoming more intense in a warming climate, leading to extreme rainstorms and floods. In addition, the delicate balance of precipitation, evapotranspiration, and runoff affects the variations in soil moisture, which is of vital importance to agriculture. A systematic examination of climate change impacts on these variables may help provide scientific foundations for the design of relevant adaptation and mitigation measures. In this study, long-term variations in the water cycle over China are explored using the Regional Climate Model system (RegCM) developed by the International Centre for Theoretical Physics. Model performance is validated through comparing the simulation results with remote sensing data and gridded observations. The results show that RegCM can reasonably capture the spatial and seasonal variations in three dominant variables for the water cycle (i.e., precipitation, evapotranspiration, and runoff). Long-term projections of these three variables are developed by driving RegCM with boundary conditions of the Geophysical Fluid Dynamics Laboratory Earth System Model under the Representative Concentration Pathways (RCPs). The results show that increased annual average precipitation and evapotranspiration can be found in most parts of the domain, while a smaller part of the domain is projected with increased runoff. Statistically significant increasing trends (at a significant level of 0.05) can be detected for annual precipitation and evapotranspiration, which are 0.02 and 0.01 mm/day per decade, respectively, under RCP4.5 and are both 0.03 mm/day per decade under RCP8.5. There is no significant trend in future annual runoff anomalies. The variations in the three variables mainly occur in the wet season, in which precipitation and evapotranspiration increase and runoff decreases. The projected changes in precipitation minus evapotranspiration are larger than those in runoff, implying a possible decrease in soil moisture.

1. Introduction

The global water cycle is becoming more intense in a warming climate; increases in precipitation, evapotranspiration, and runoff can be widely observed over the world [1,2]. The resulting extreme rainstorms and heavy runoff can themselves lead to losses of life and damage to infrastructure (such as urban drainage systems), not to mention that they may also cause flood events that are of more devastating consequences [3]. On the other hand, the delicate balance of the three variables also deserves attention, as, according to the surface water budget equation d S / d t = P E R (where S denotes the subsurface storage of water substances, P is precipitation, E is evapotranspiration, and R is runoff) [2,4], they are closely associated with variations in soil moisture. In cases where meteorological drought occurs (i.e., long-term rainfall deficit), the interactions among the water cycle components could affect how the meteorological drought is propagated to hydrological drought (i.e., long-term runoff deficit) and agriculture drought (i.e., long-term soil moisture deficit), which can have significant influences on regional water availability and agriculture [5]. In addition, variations in the water cycle can have profound long-term environmental [6,7,8] and ecological [9,10] implications. In China, disasters caused by variations in water cycle components have been recorded. For example, a series of flood events that occurred in the Yangtze River Basin in 2020, in which the inflow to the Three Gorges Dam once reached 75,000 m3/s during the fifth flood, caused the death/disappearance of 219 people and an economic loss of 178.96 billion yuan by 13 August [11,12]. In order to avoid losses such as above, studies of future variations in the water cycle are needed to help provide scientific foundations for the design of relevant adaptation and mitigation measures.
Previous attempts have been made in projecting future changes in individual water cycle components. For example, Li et al. [13] applied a self-organizing map to study the future changes in summer precipitation in eastern China using global climate model (GCM) data of climate model intercomparison project phase 5 (CMIP5). Dong et al. [14] examined the climate change impacts on reference evapotranspiration in Xinjiang, China based on CMIP5 GCM projections. Yan et al. [15] projected future runoff in the Yellow River Basin using CMIP5 GCM data through global Bayesian model averaging. Fewer studies can be found focusing on more than one water-cycle-related variable. One example is the study of Gu et al. [16] on future precipitation and runoff changes and the resultant drought events over China using GCM and hydrological model ensembles. In another study conducted by Zhang et al. [2], future changes in the three water cycle components over global land monsoon regions were systematically examined using the GMIP5 GCM ensemble.
In general, most of the previous studies that simultaneously involve the projection of more than one water cycle component are based on GCM data. However, precipitation, evapotranspiration, and runoff are closely related to land surface processes that are largely dependent on topographic and land-use information, which is not adequately depicted in GCMs due to their coarse resolution [17,18]. Climate downscaling, including statistical and dynamical approaches, is commonly undertaken to derive regional- and/or local-scale information [18]. While both techniques have been demonstrated to be capable of correcting biases in GCM outputs, studies have shown that statistical simulations can inherit unphysical signals from the driving data, and thus fail to generate physically consistent regional climate projections as regional climate models (RCMs) used in the dynamical approach do [19]. The applicability of RCMs to the simulation of temperature and precipitation over China has been tested by various previous studies, which suggest that RCMs can refine large-scale climate information in complex terrains, correct certain biases in the boundary conditions, and provide results that correspond better with the observations [17,20]. Among all RCMs, RegCM has been noted to perform well over China [21,22]. For example, Pan et al. [23] conducted climate projections over Northwest China, and suggested that RegCM can reproduce the spatial patterns of temperature, precipitation, and climate extremes over this region. Gao [24] simulated climate over China using RegCM and WRF, and noticed that RegCM shows better skills in simulating the temperature and precipitation pattern and magnitude in dry regions. Jiang et al. [25] compared the performance of RegCM and PRECIS in modeling precipitation over China, and indicated that the former outperforms the latter in capturing annual precipitation and wet days in eastern China.
Therefore, as an extension of previous studies, the objective of this study is to examine, through the application of an RCM, climate change impacts on the water cycle components over China. Specifically, regional climate simulations over China are undertaken using RegCM. Model performance is evaluated via the comparison of the simulated climate against the remote sensing and gridded observation data. Then, high-resolution long-term projections of precipitation, evapotranspiration, and runoff under two emission scenarios are developed, and the changes and trends of these variables are subsequently evaluated. The results of this research could be beneficial to the forecast and control of flood and drought events in China.

2. Methodology and Data

Dynamical downscaling of water cycle components over China is developed using RegCM, which is a regional climate model developed by the International Center for Theoretical Physics [26]. The Community Land Model version 4.5 (CLM4.5) coupling is enabled in RegCM simulations to provide an improved description of land surface processes (e.g., carbon cycle, vegetation dynamics, and river routing) [27,28]. The detailed representation of water vapor fluxes for both non-vegetated and vegetated surfaces in CLM is expected to help with the simulation of evapotranspiration. In addition, CLM is embedded with SIMTOP (simple TOPMODEL-based runoff model) [29], which can take into account the influence of topological information in runoff generation. The simulated total runoff is then routed to active ocean or marginal seas through a river transport model [30]. More details about RegCM parameterization scheme configuration can be found in Lu et al. [22].
Two rounds of RegCM hindcast simulations are conducted for model validation purposes; one of them is driven by the ERA-Interim reanalysis data developed by the European Centre for Medium-Range Weather Forecasts [31], which provide the realistic historical climate over China; the other one is driven by the historical climate scenario of the Earth System Model developed by the Geophysical Fluid Dynamics Laboratory (GFDL) [32,33], which is used to provide the baseline for projections. The baseline period is 1986 to 2005.
The RegCM performance is validated through comparisons of the annual and seasonal averages of model results with those of the observations, remote sensing data, and reconstructed data. The months included in each season are as follows: December (of the previous year), January, and February for winter; March, April, and May for spring; June, July, and August for summer; September, October, and November for autumn. Spatial correlation is employed as a quantitative metric to reflect the similarity between the annual and seasonal averaged observation/remote sensing data/reconstructed data and the simulation results.
In this study, version 4 of the high-resolution gridded observation dataset from the Climate Research Unit (CRU) [34] is used for verifying the model-generated temperature and precipitation. This dataset is generated through the interpolation of extensive networks of gauge station observations into a 0.5° regular grid [34], and is widely applied for the calibration/validation of global and regional climate models [35].
For evapotranspiration, two sets of remote sensing data are employed, specifically, version 6 of the Resolution Imaging Spectroradiometer (MODIS) terrestrial evapotranspiration product (MOD16A2GF v006) [36], and the latest version of the Global Land Evapotranspiration Amsterdam Model (GLEAM, v3.5b) [37,38]. The MOD16A2GF dataset is created from remotely sensed data products of MODIS (e.g., land cover and albedo) based on the Penman–Monteith equation [39]. On the other hand, GLEAM assembles various satellite-based observations (e.g., radiation from GERES, precipitation from TMPA and MSWEP, air temperature from AIRS, soil moisture from SMOS and ERA CCI SM) and derives global evaporation variables with the Priestley and Taylor model [37]. Both datasets were demonstrated to be able to reasonably represent the actual evapotranspiration over China [40,41]. The evapotranspiration from MOD16A2GF and the actual evaporation from GLEAM are used for validating the RegCM-generated evapotranspiration. It is worth noting that the start years of these two remote sensing datasets are 2000 and 2003, respectively; therefore, RegCM results averaged over the same periods (i.e., 2000 to 2005 and 2003 to 2005) are used for comparison. To assist the validation for evapotranspiration over the entire baseline period, station-based observed tank evaporation from the National Meteorological Information Center of China (NIMC) is also used (data available at data.cma.cn; accessed on 9 April 2019). The locations of the stations are shown in Figure S1 in the Supplementary Materials.
For runoff, the validation was undertaken through the comparison of the model outputs with the Global Runoff Reconstruction (GRUN), which is constructed through machine learning techniques based on runoff and meteorological observations [42]. This dataset is widely used in weather and climate research and is shown to have a reasonable performance over China [43,44,45].
For future climate, GFDL projections of two representative concentration pathways (RCPs) are employed, which are RCP4.5 and RCP8.5, respectively, for intermediate and heavy emissions. Simulations are conducted for the entire twenty-first century. Three time-slices are considered in result analysis: 2020 to 2039 (or 2030s), 2040 to 2069 (or 2050s), and 2070 to 2099 (or 2080s); time averages and trends are calculated with respect to these periods. In addition, since the water cycle components are closely related to atmospheric moisture contents, and the saturation vapor pressure is related to the temperature following the Clausius–Clapeyron equation [46], different warming periods are also considered in this study. The warming periods are defined as twenty-year periods in which the domain average temperature increases by 1, 1.5, 2, 3, and 4 °C compared with the baseline average. Table 1 lists the respective periods for each warming level under the two emission scenarios. The numerical values of future trends are obtained based on Sen’s slope estimator, and their statistical significance is examined by Mann–Kendall tests [47,48,49,50].

3. Results

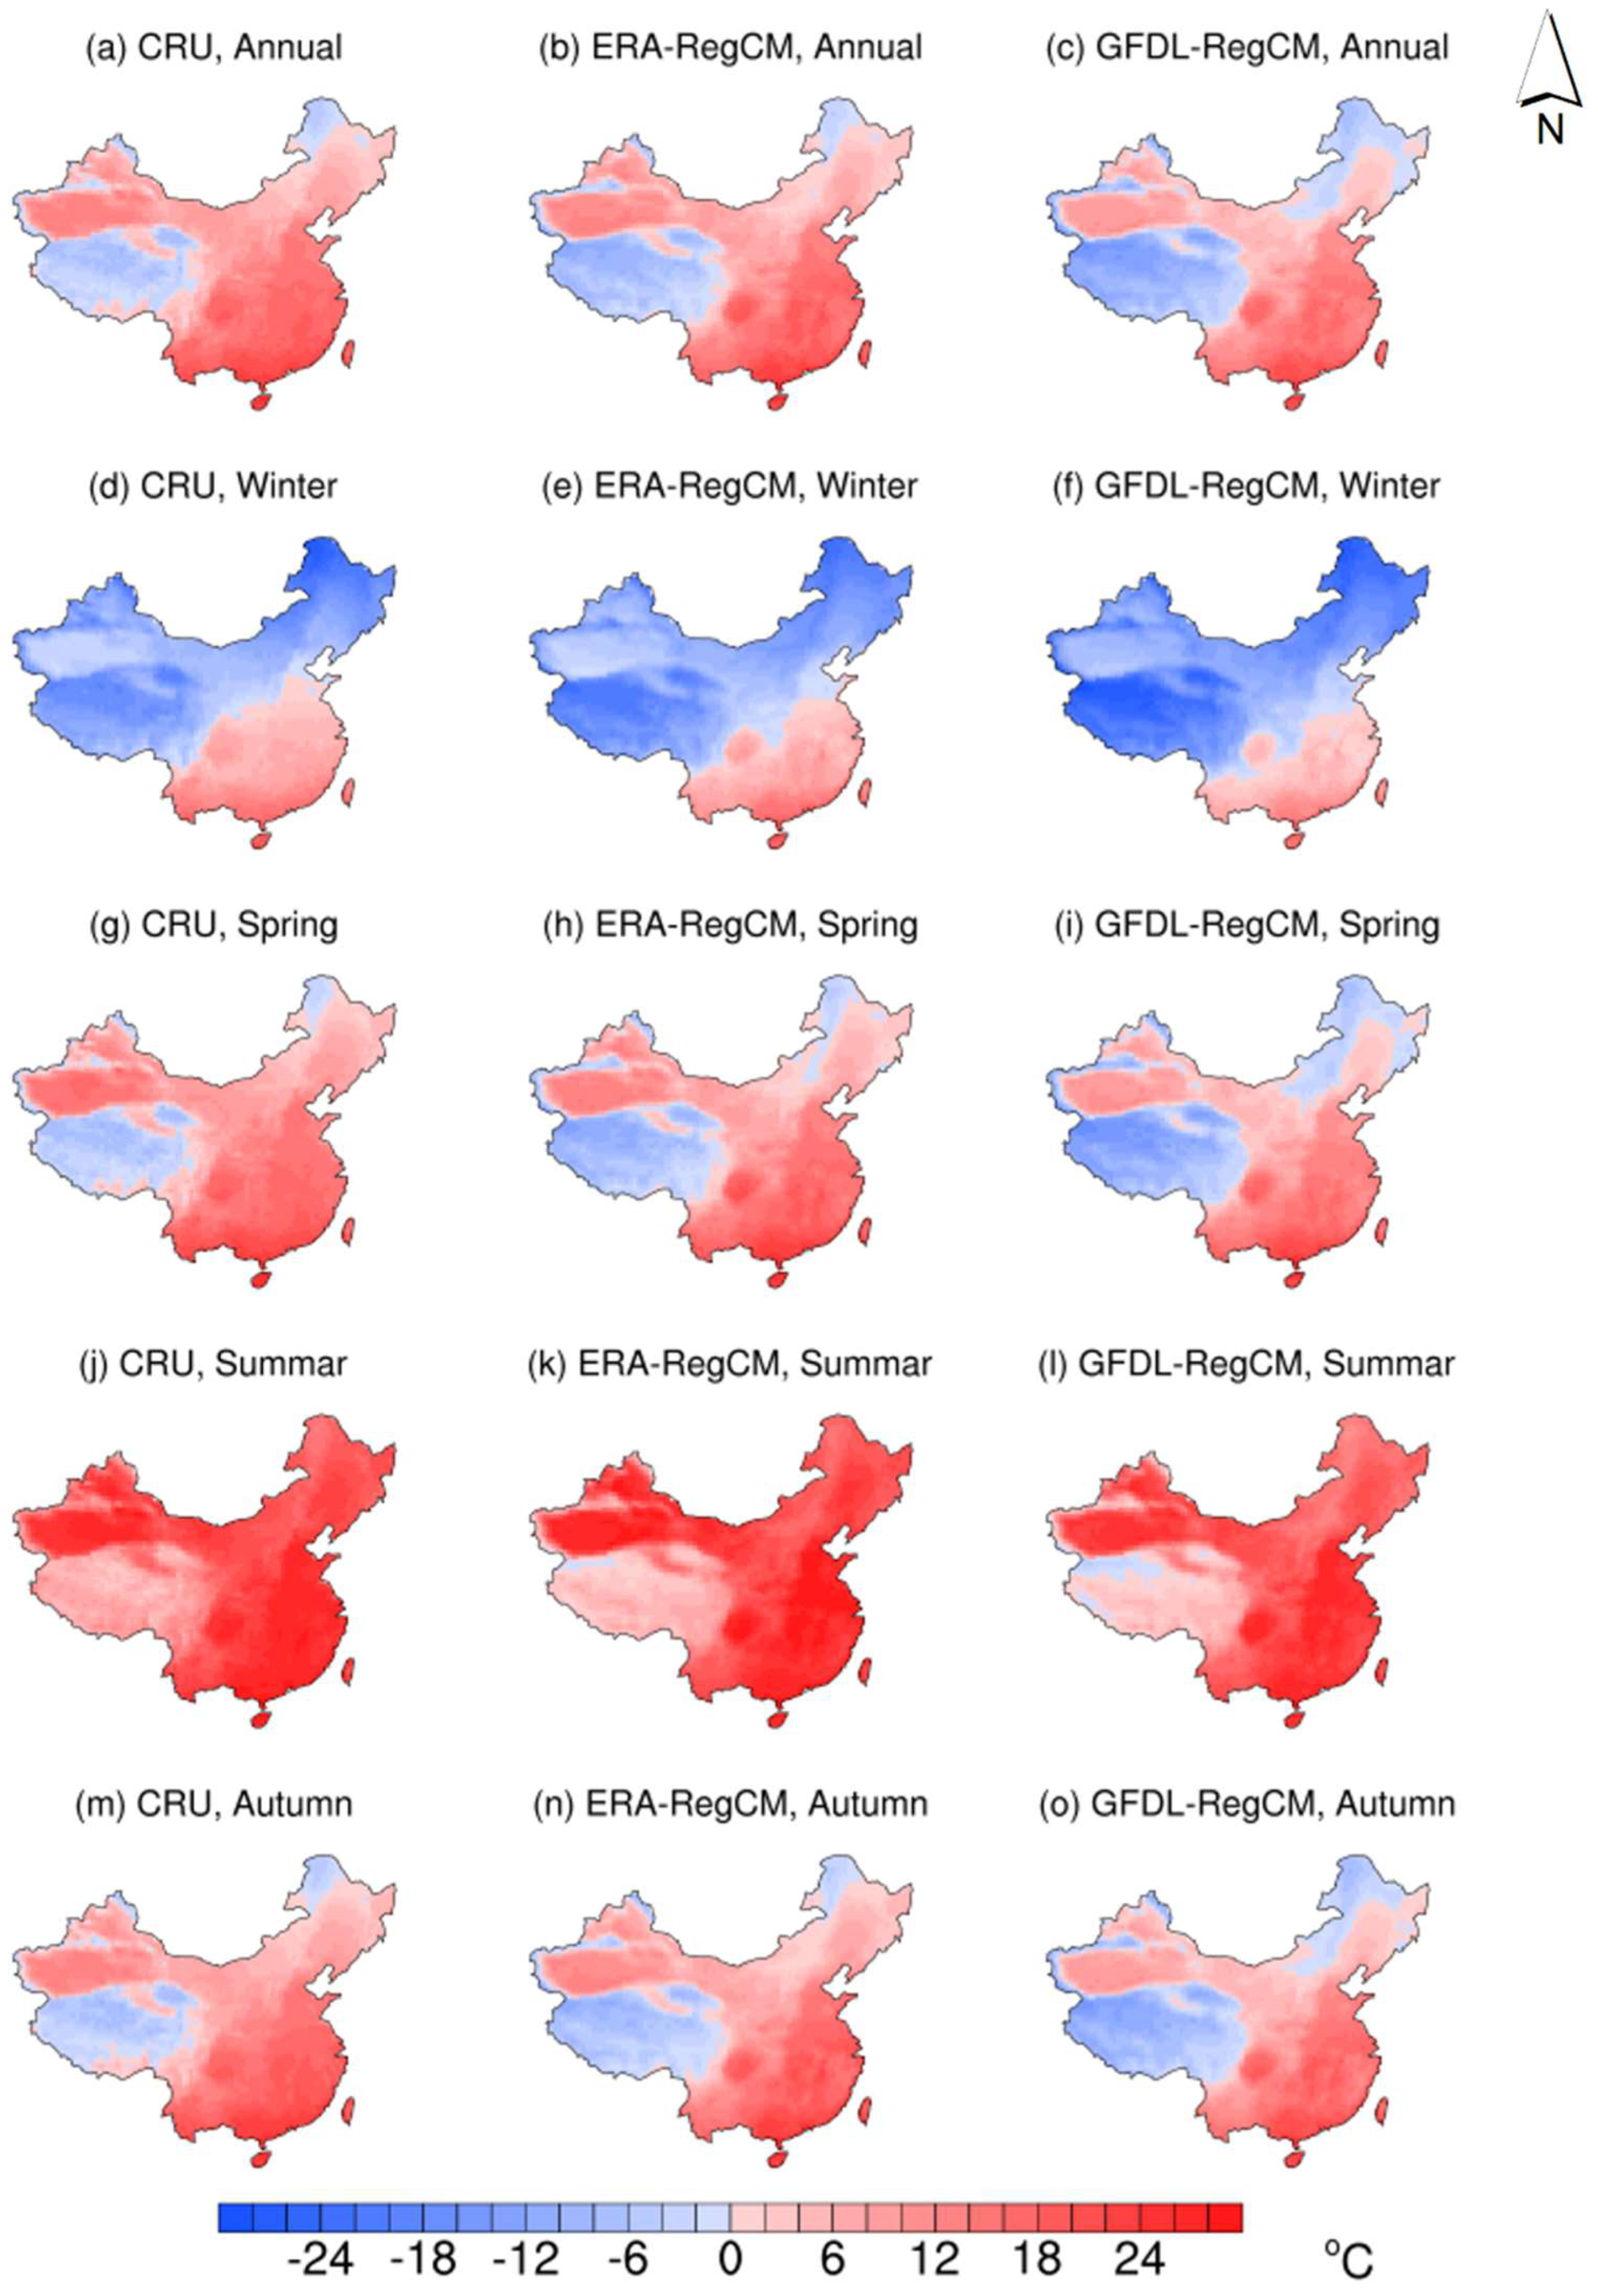
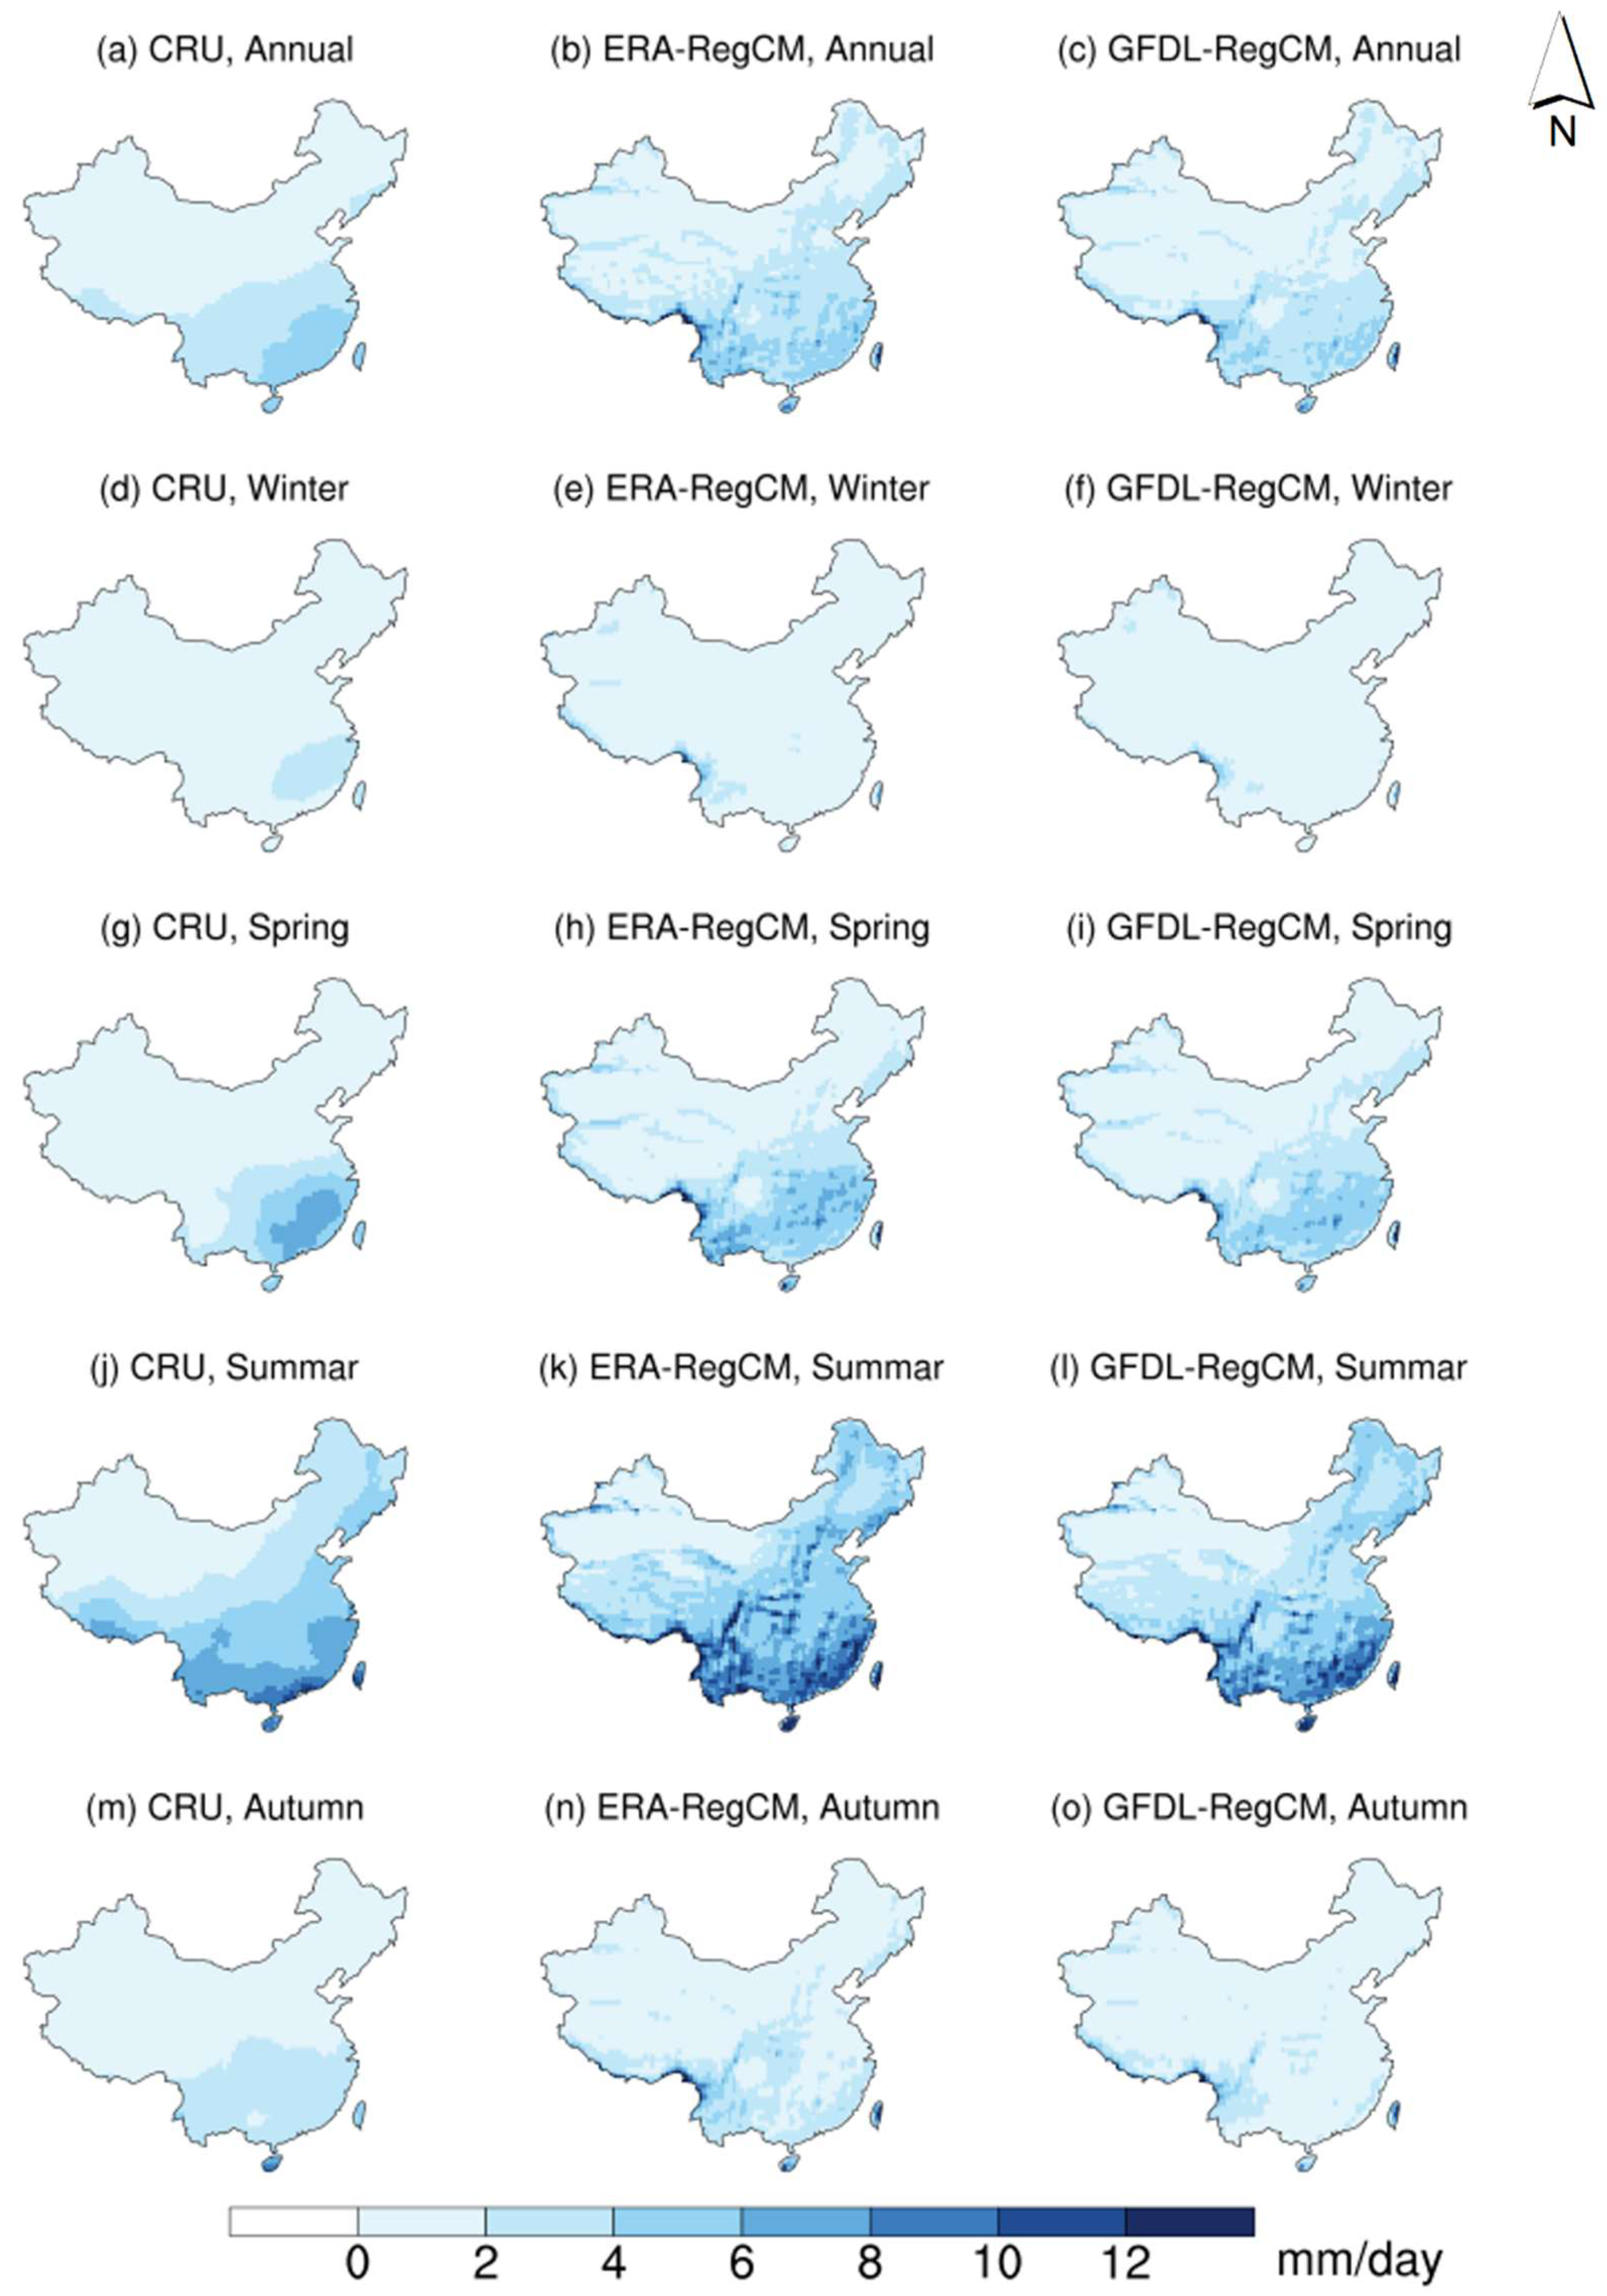
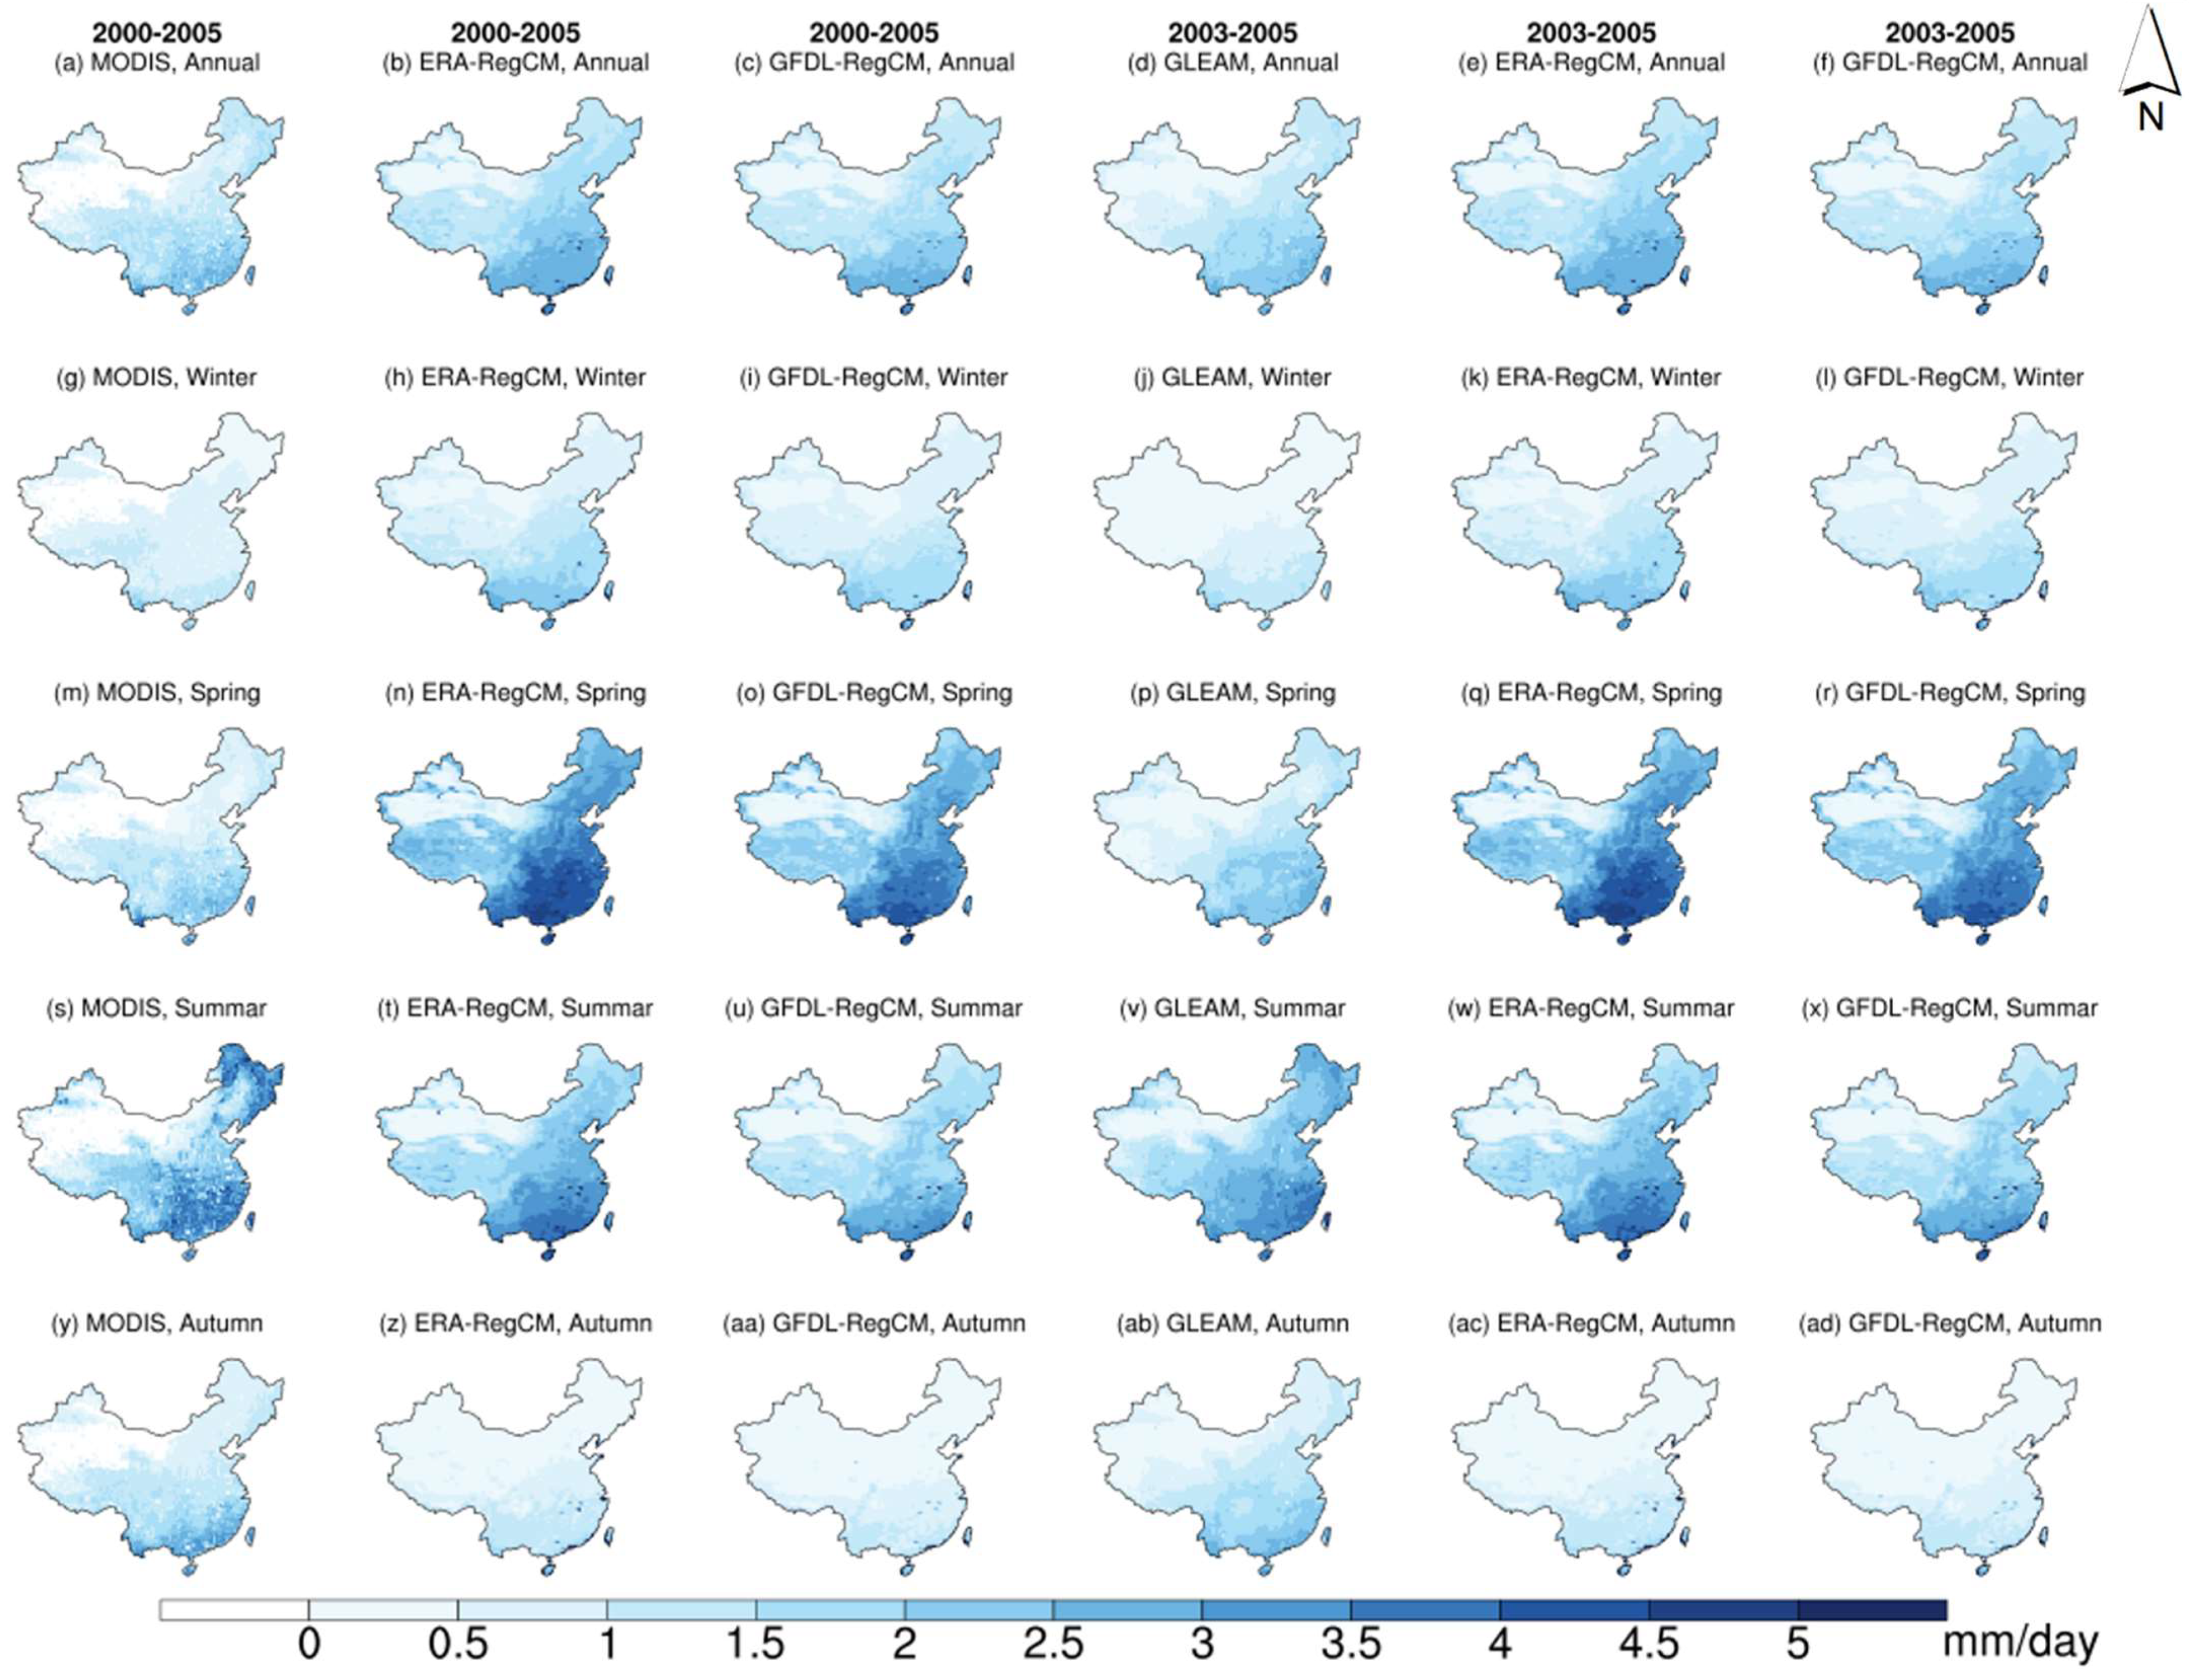
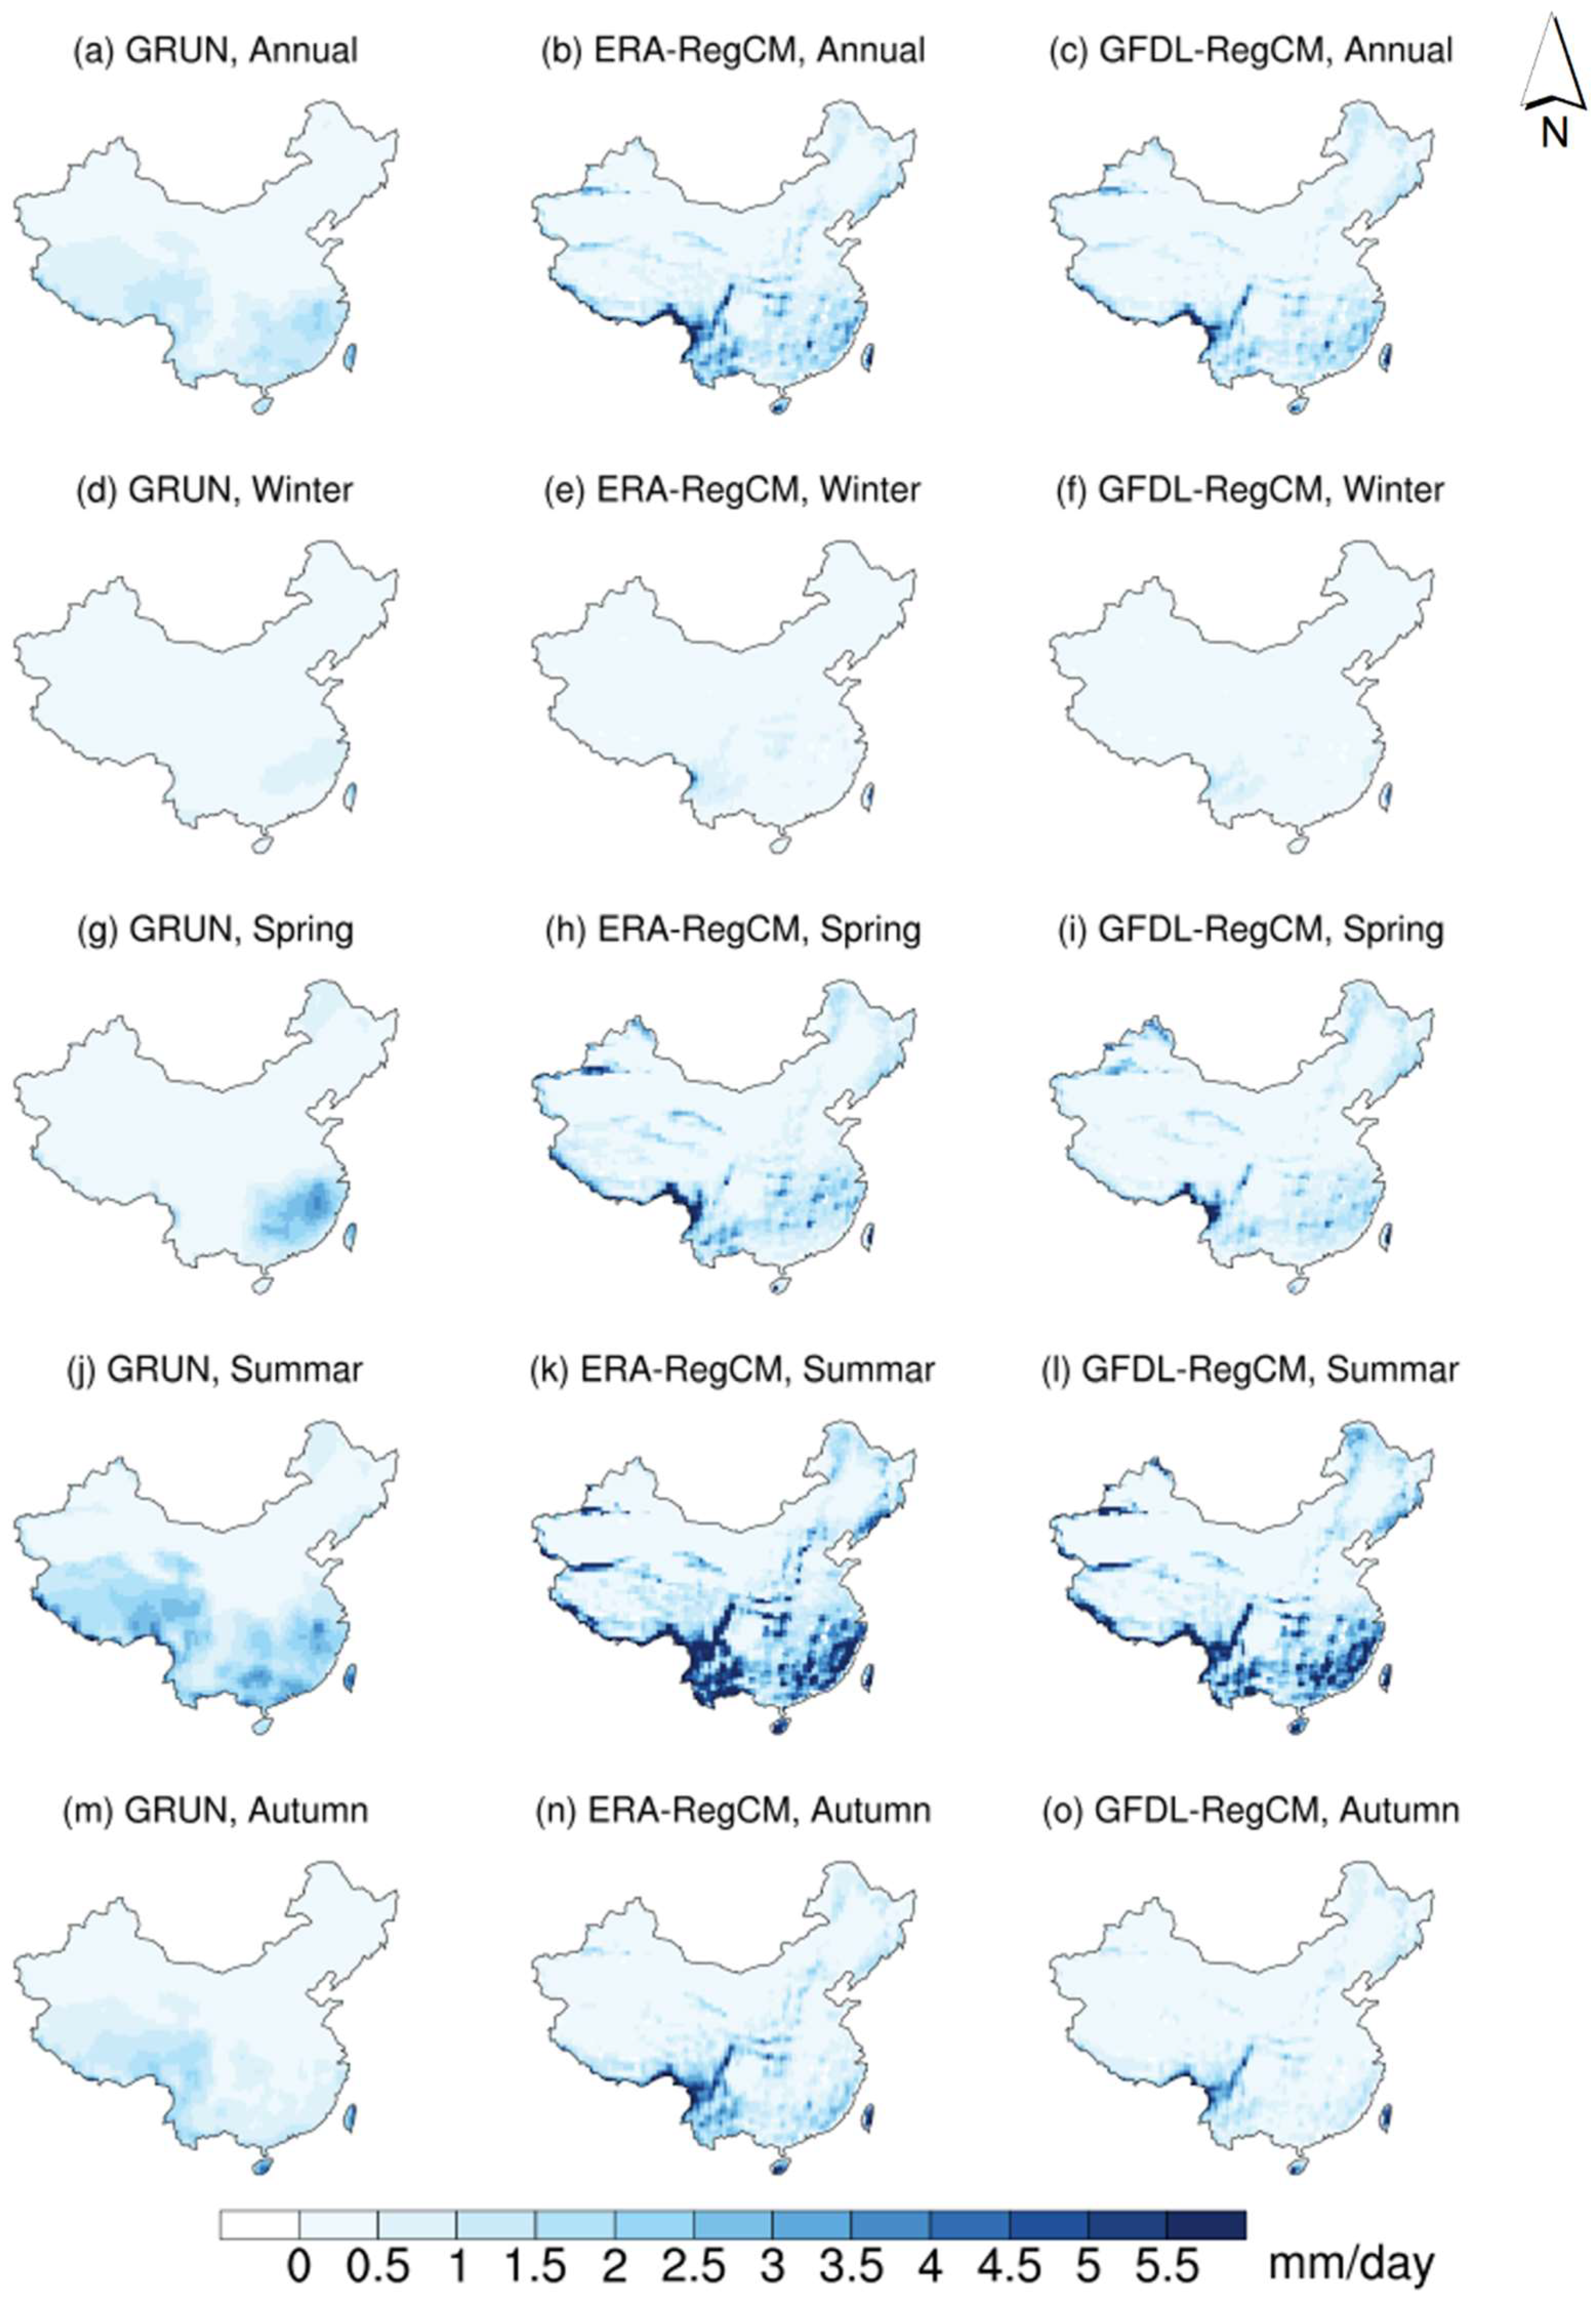
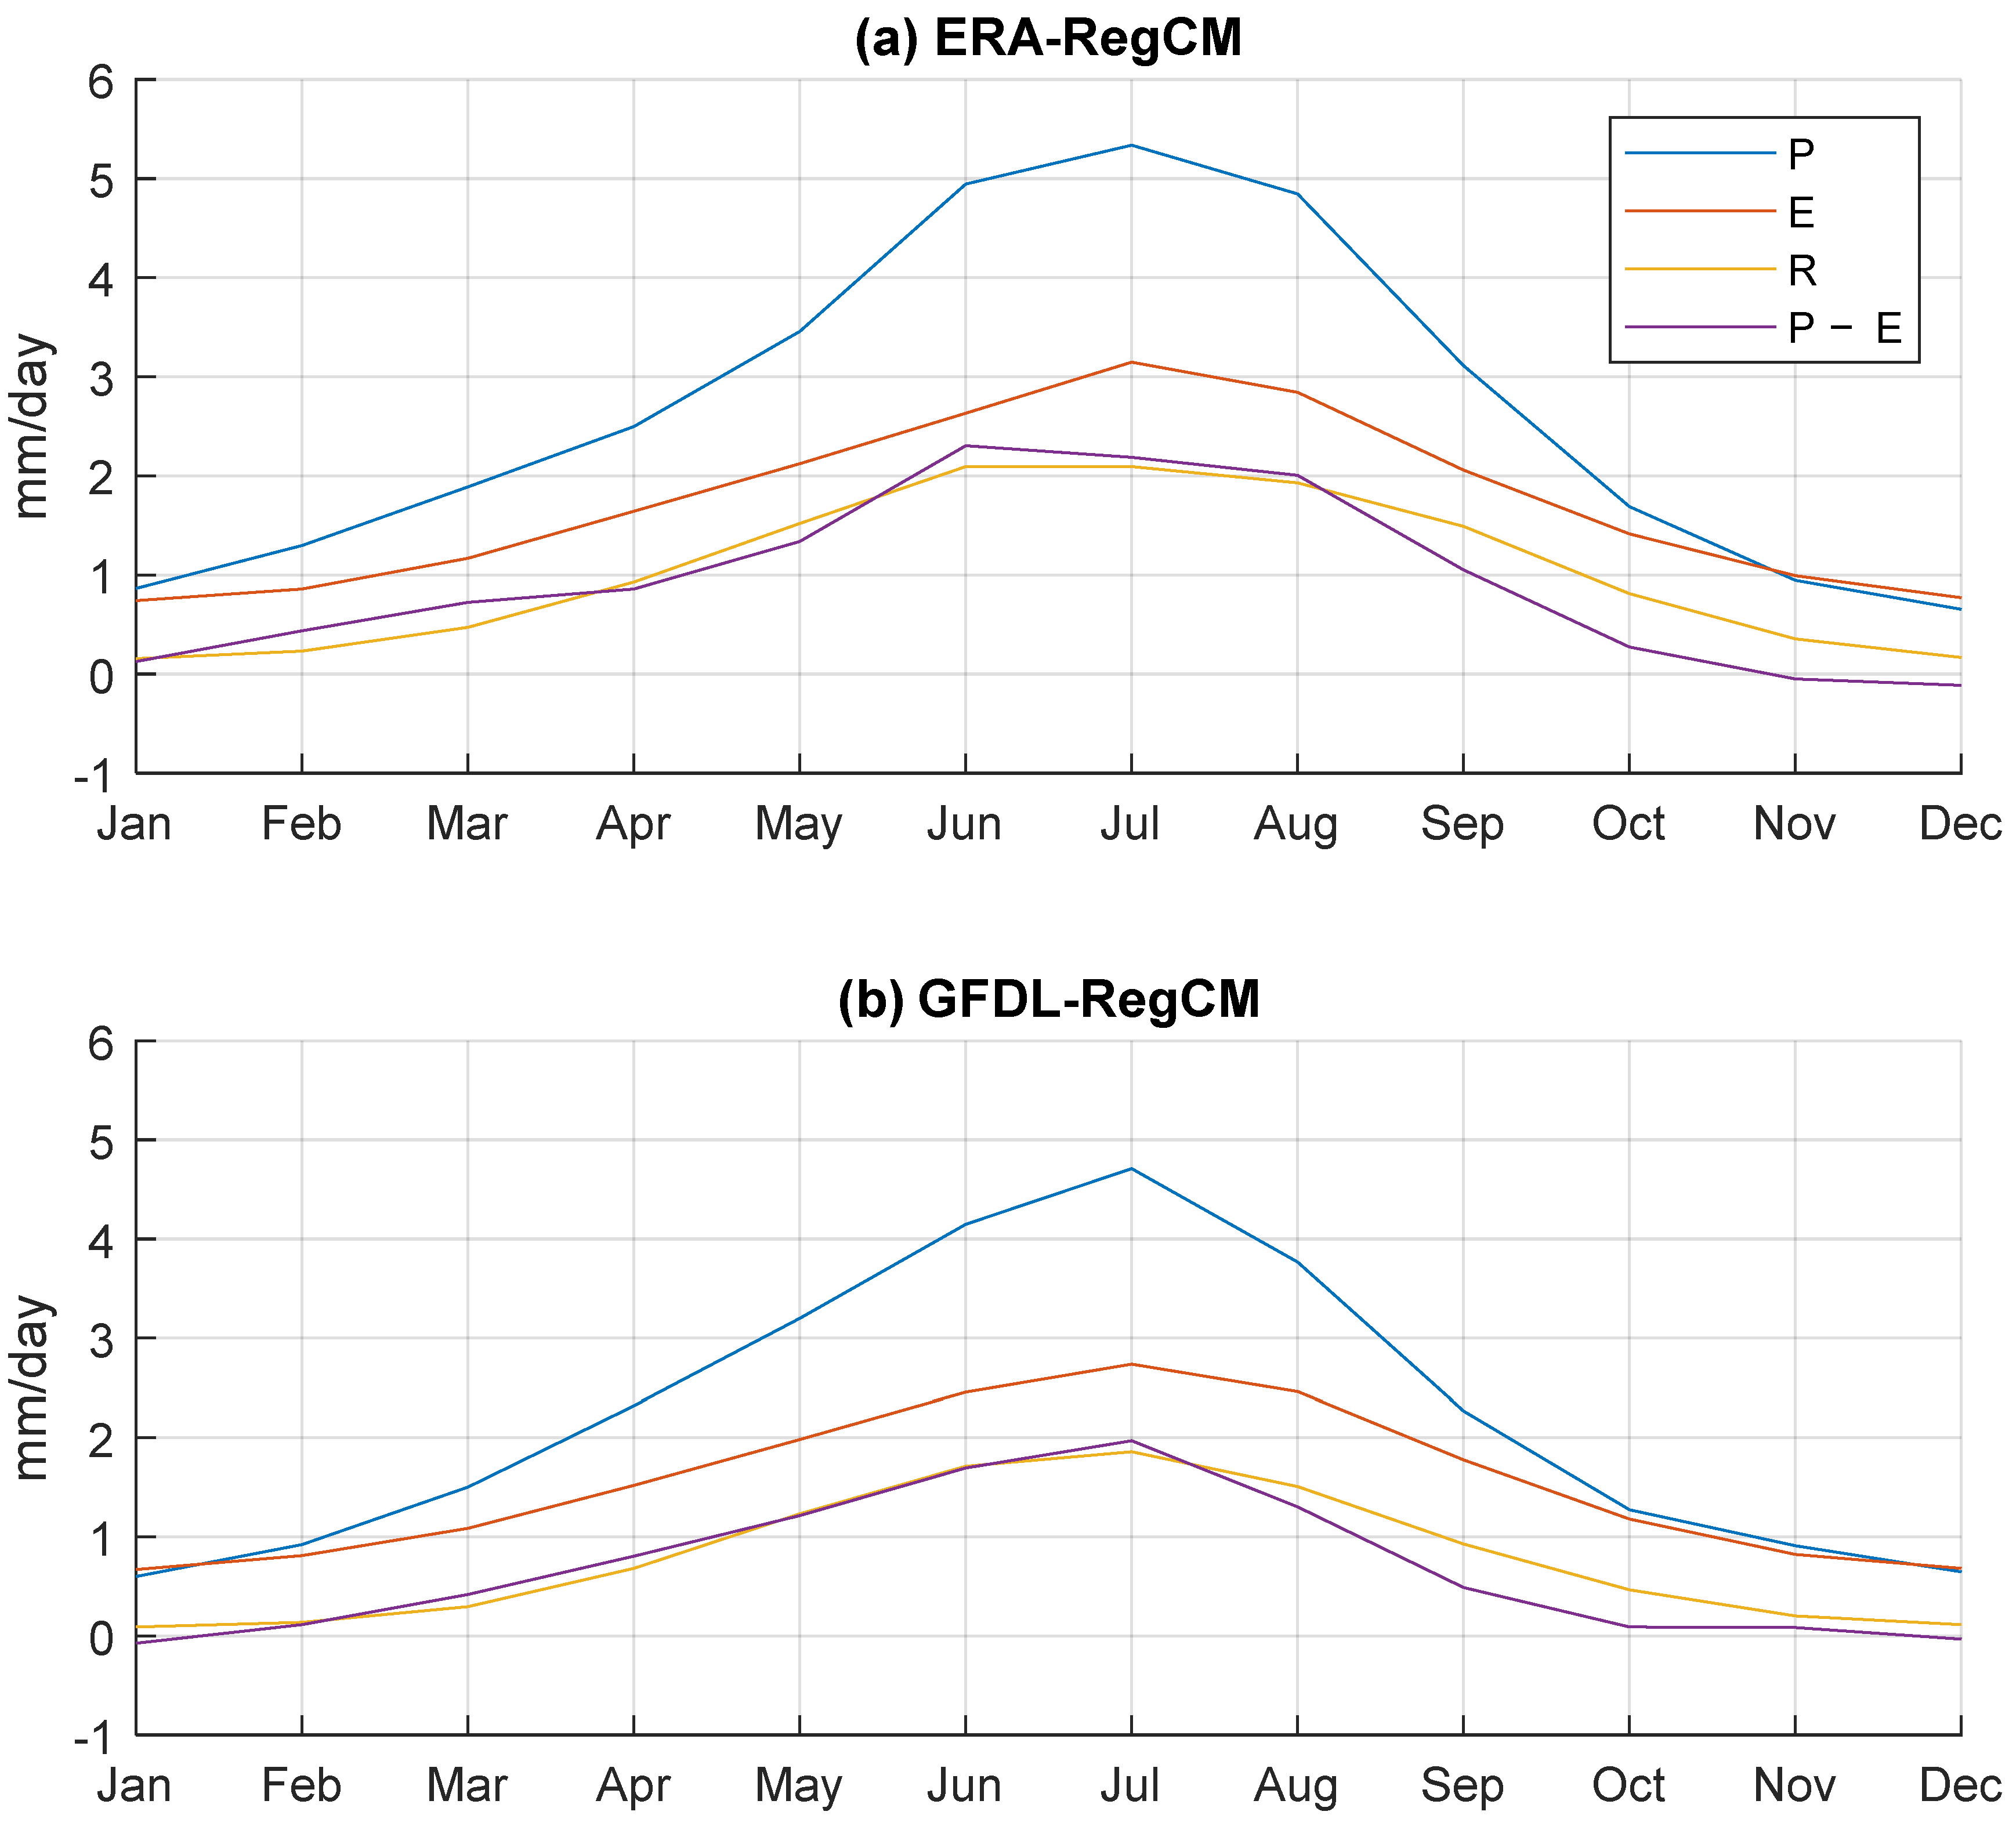
3.1. Model Validation

Validation results for near-surface temperature, precipitation, evapotranspiration, and runoff are shown in Figure 1, Figure 2, Figure 3 and Figure 4, respectively. The columns of each figure are for different datasets (i.e., CRU, MODIS, GLEAM, GRUN, RegCM driven by ERA-Interim, and RegCM driven by GFDL); the rows are for annual and seasonal averages. It can be observed that RegCM can reasonably reproduce the spatial distribution and seasonal variations of temperature over China. As shown by the CRU observations (Figure 1a), above-zero baseline-average temperature can be found in most parts of the domain, except for the Tibetan Plateau and a small part of northeastern China. This spatial feature is realistically generated in the two sets of RegCM results, although with underestimations of various degrees (Figure 1b,c). Such underestimations, as discussed by Lu et al. [22], are partly caused by the model setup and partly due to the driving GCM data. Temperature over China demonstrates clear seasonality, i.e., hot summer, cold winter, and mild spring and autumn. RegCM is able to capture the seasonal variations, although underestimations can still be observed. The spatial correlation between the observed and modeled temperature can be found in Table S1 in the Supplementary Materials. The high correlation (ranges between 0.94 and 0.98) indicates RegCM’s good performance in temperature. In addition, the results of RegCM driven by GFDL have higher correlations with the observations than those of the raw GCM data (please refer to Table S2 in the Supplementary Materials), which suggests that RegCM is able to correct some biases in GFDL’s temperature results.
The performance of RegCM with respect to precipitation is less satisfactory than for temperature. Although it is able to generate the observed wet-in-the-southeast and dry-in-the-northwest precipitation pattern, underestimations can be found over the southeastern part of the domain and overestimations over the northwestern part (Figure 2a–c). This over- and underestimation pair was shown to be related to the simulation bias in vapor pressure by Lu et al. [22], who further argued that the bias in vapor pressure could be associated with the bias in temperature. There is also an apparent dry bias near the Sichuan Basin and a wet bias near the southeastern edge of the Tibetan Plateau, which could be related to the configuration of the cumulus convective scheme [22]. The spatial correlation (Table S1) is lower for precipitation than for temperature, which is consistent with the above results. The seasonal precipitation over China shows clear monsoon features (more precipitation in summer and less in winter), which is shared by the two sets of RegCM results.
The spatial pattern of actual evapotranspiration from MODIS and GLEAM (Figure 3a,d) shows more regional details than the observed precipitation pattern from CRU, which is in part due to the higher resolution of remote sensing data than that of the gridded observation, and in part due to evapotranspiration’s closer relationship with the geophysical characteristics of the domain than precipitation. The two sets of remote sensing data show similar annual patterns; subtle differences exist sporadically over the domain, which could be explained by the different skills of the two datasets over different land-use types [51]. RegCM shows better skills in simulating evapotranspiration than precipitation (Figure 3b,c,e,f), although minor overestimations can be noticed. As shown in Table S1, for annual average evapotranspiration, the spatial correlations between RegCM results and GLEAM are higher than 0.8, and those for MODIS are higher than 0.6, indicating a reasonable performance for RegCM in evapotranspiration. The spatial correlation between RegCM results and the observed tank evaporation from NIMC is 0.50 and 0.42, respectively, for the two rounds of hindcast simulations. The lower correlation between RegCM and NIMC could be related to the difference between tank evaporation and actual evapotranspiration. In terms of the seasonal variations, RegCM demonstrates overestimations in spring and winter, and underestimations in summer and autumn.
The RegCM-generated spatial patterns for runoff show considerably larger biases than for other variables. Apparent overestimations can be spotted near the southeastern corner of the Tibetan Plateau, which is likely to be related to the wet bias in precipitation that occurs at the same location. Slight underestimations in runoff can be found over the entire Tibetan Plateau, where overestimations in evapotranspiration can be identified; the latter is likely to be the cause of the former. The spatial correlations between the annual average runoff of the two sets of RegCM results and GRUN are 0.67 and 0.66, respectively (Table S1). From the seasonal perspective, the GRUN reconstructed runoff is high in summer and low in winter. This monsoon feature is well captured by RegCM. As shown by the spatial correlation, for runoff, RegCM shows better skills in summer/autumn (ranges between 0.65 and 0.69) than in winter/spring (between 0.37 and 0.53).
The RegCM-simulated domain average annual cycles for precipitation, evapotranspiration, and runoff are also examined (shown in Figure 5). The two sets of RegCM results present similar features (please refer to Figure S2 in the Supplementary Materials for a direct comparison of the two sets of simulation results). All three variables show a peak in their annual cycles during the monsoon period (May to September), which is consistent with previous results. On domain average, a considerable part of the precipitation is balanced by evapotranspiration, and a smaller portion is attributed to the runoff. The difference between the simulated precipitation and evapotranspiration is also plotted in Figure 5. As indicated by the surface water budget equation, the amount of precipitation that is not balanced by the other two variables contributes to the moisture storage in soil. It can be observed that the difference between precipitation and evapotranspiration is larger than runoff in early spring, and this relationship reverses in autumn, which indicates water storage in spring and dissipation in autumn.

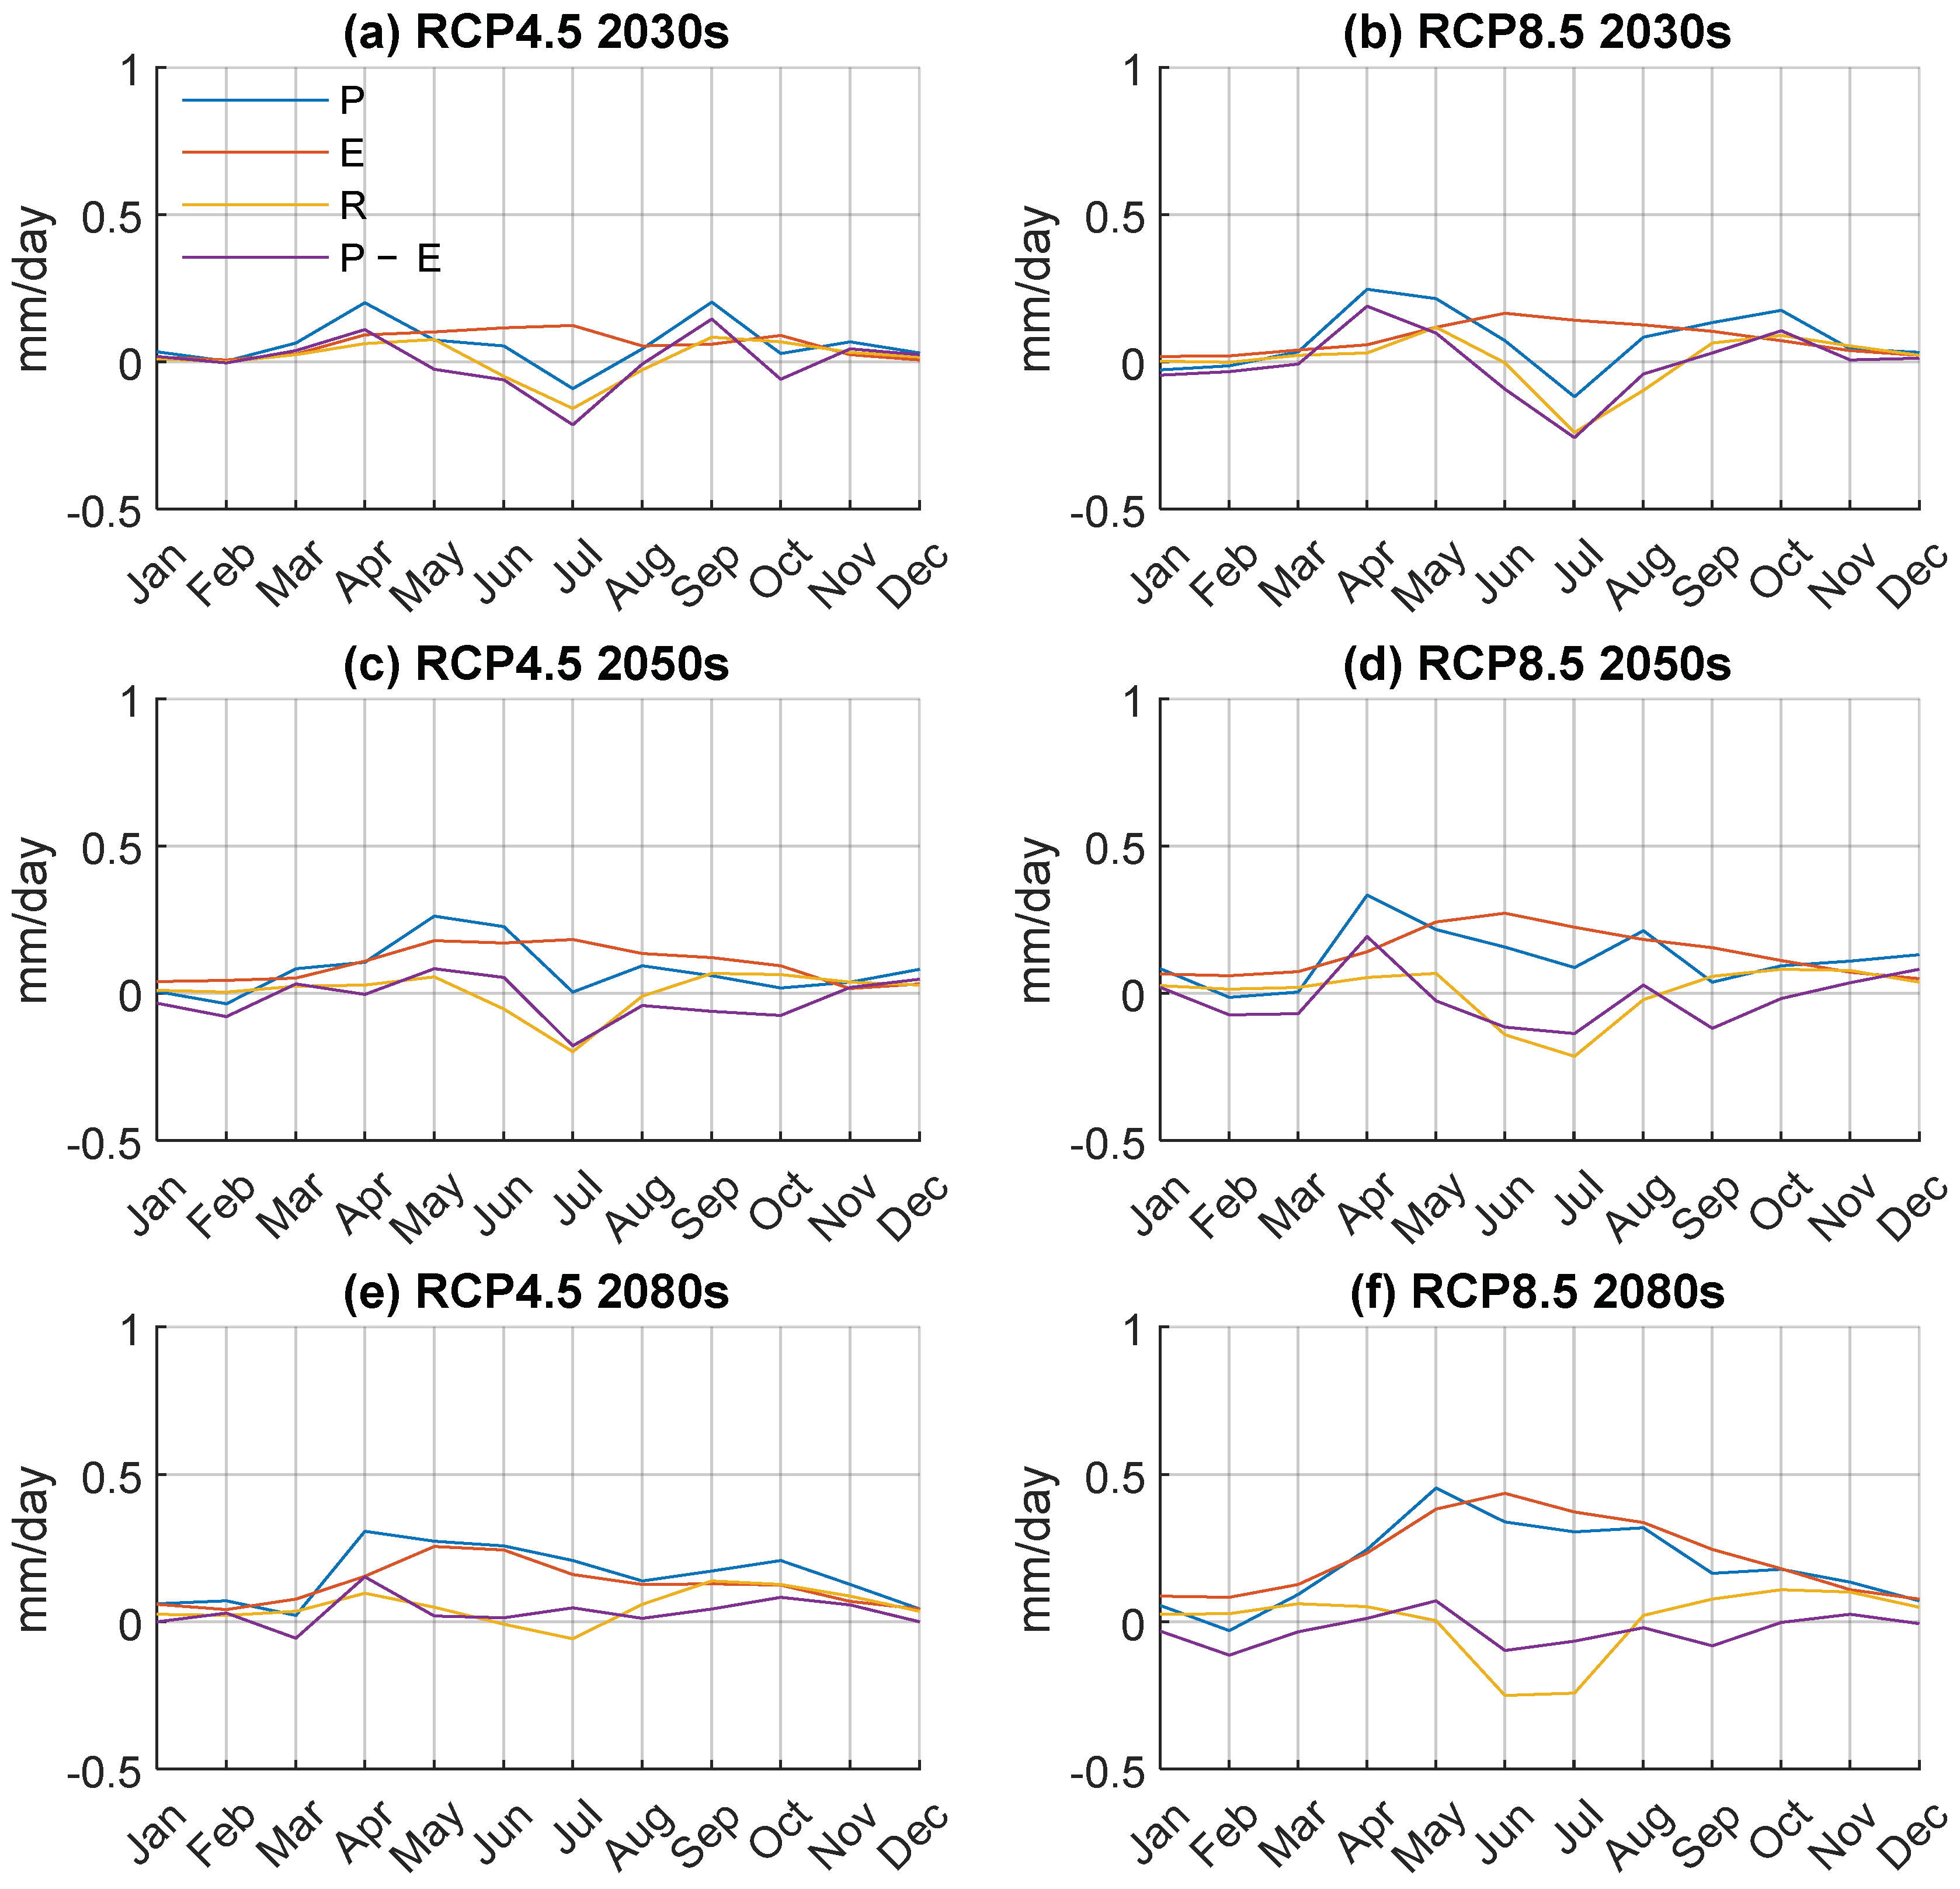
3.2. Future Changes in Precipitation, Evapotranspiration, and Runoff

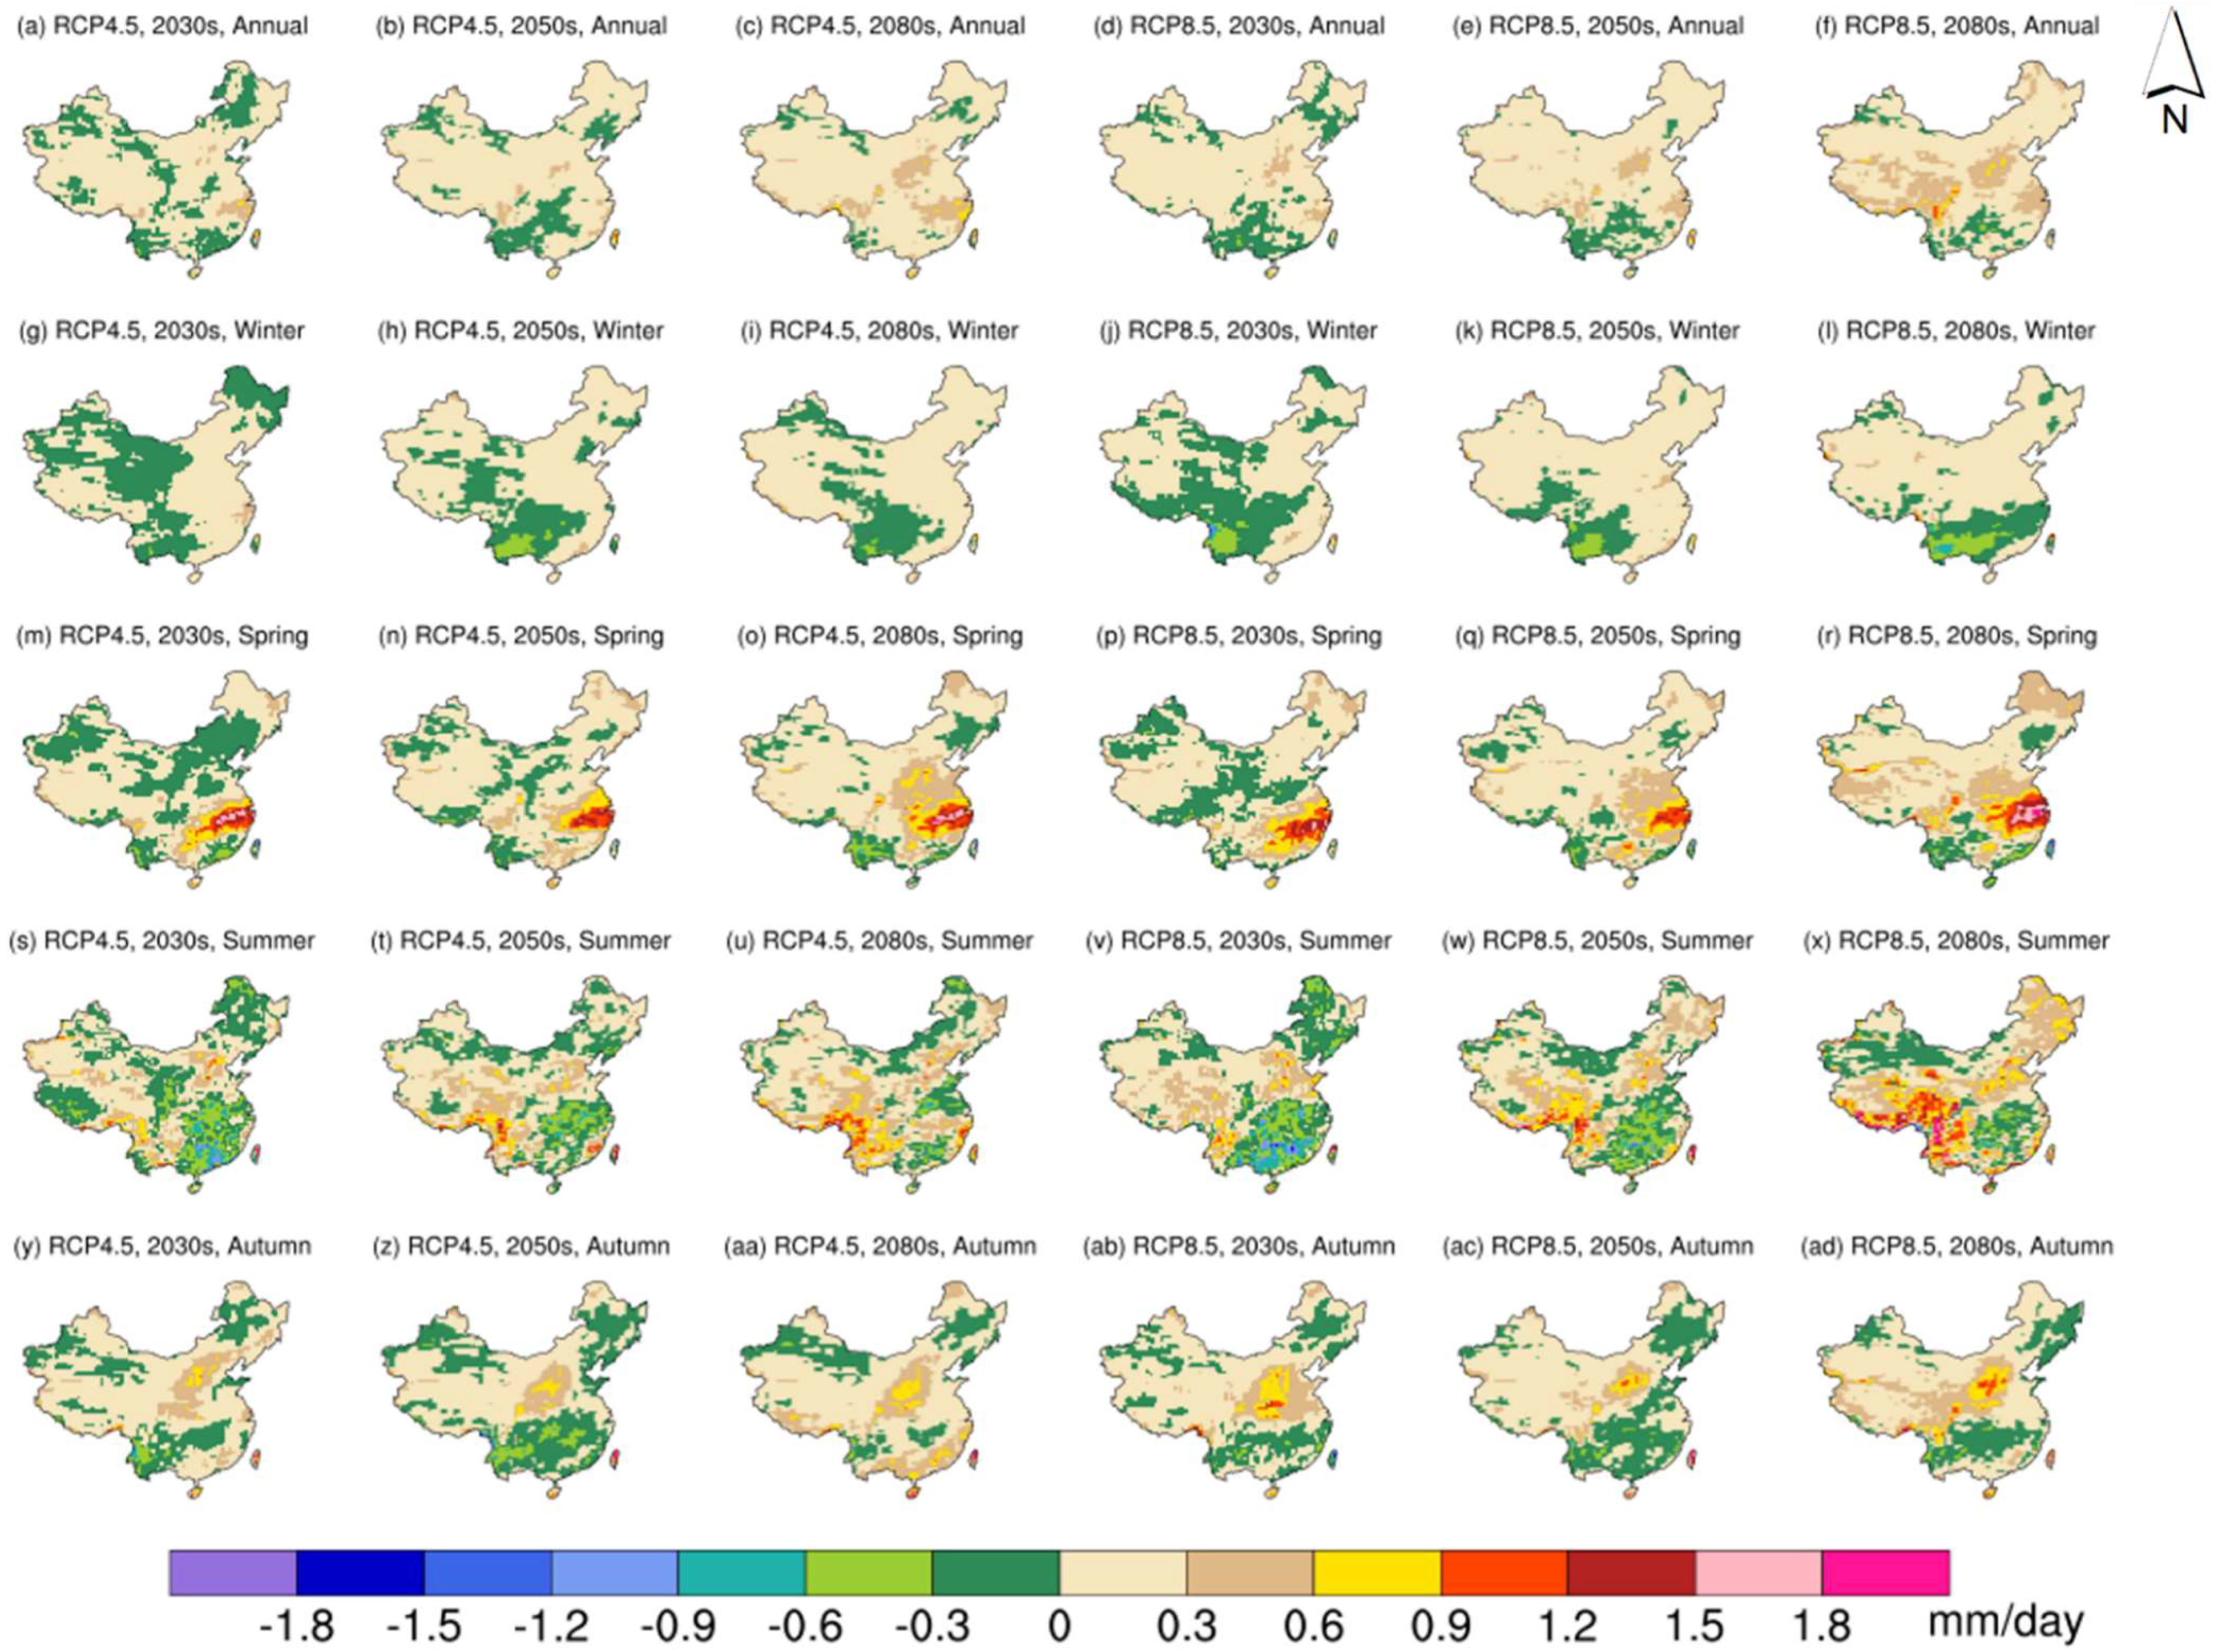
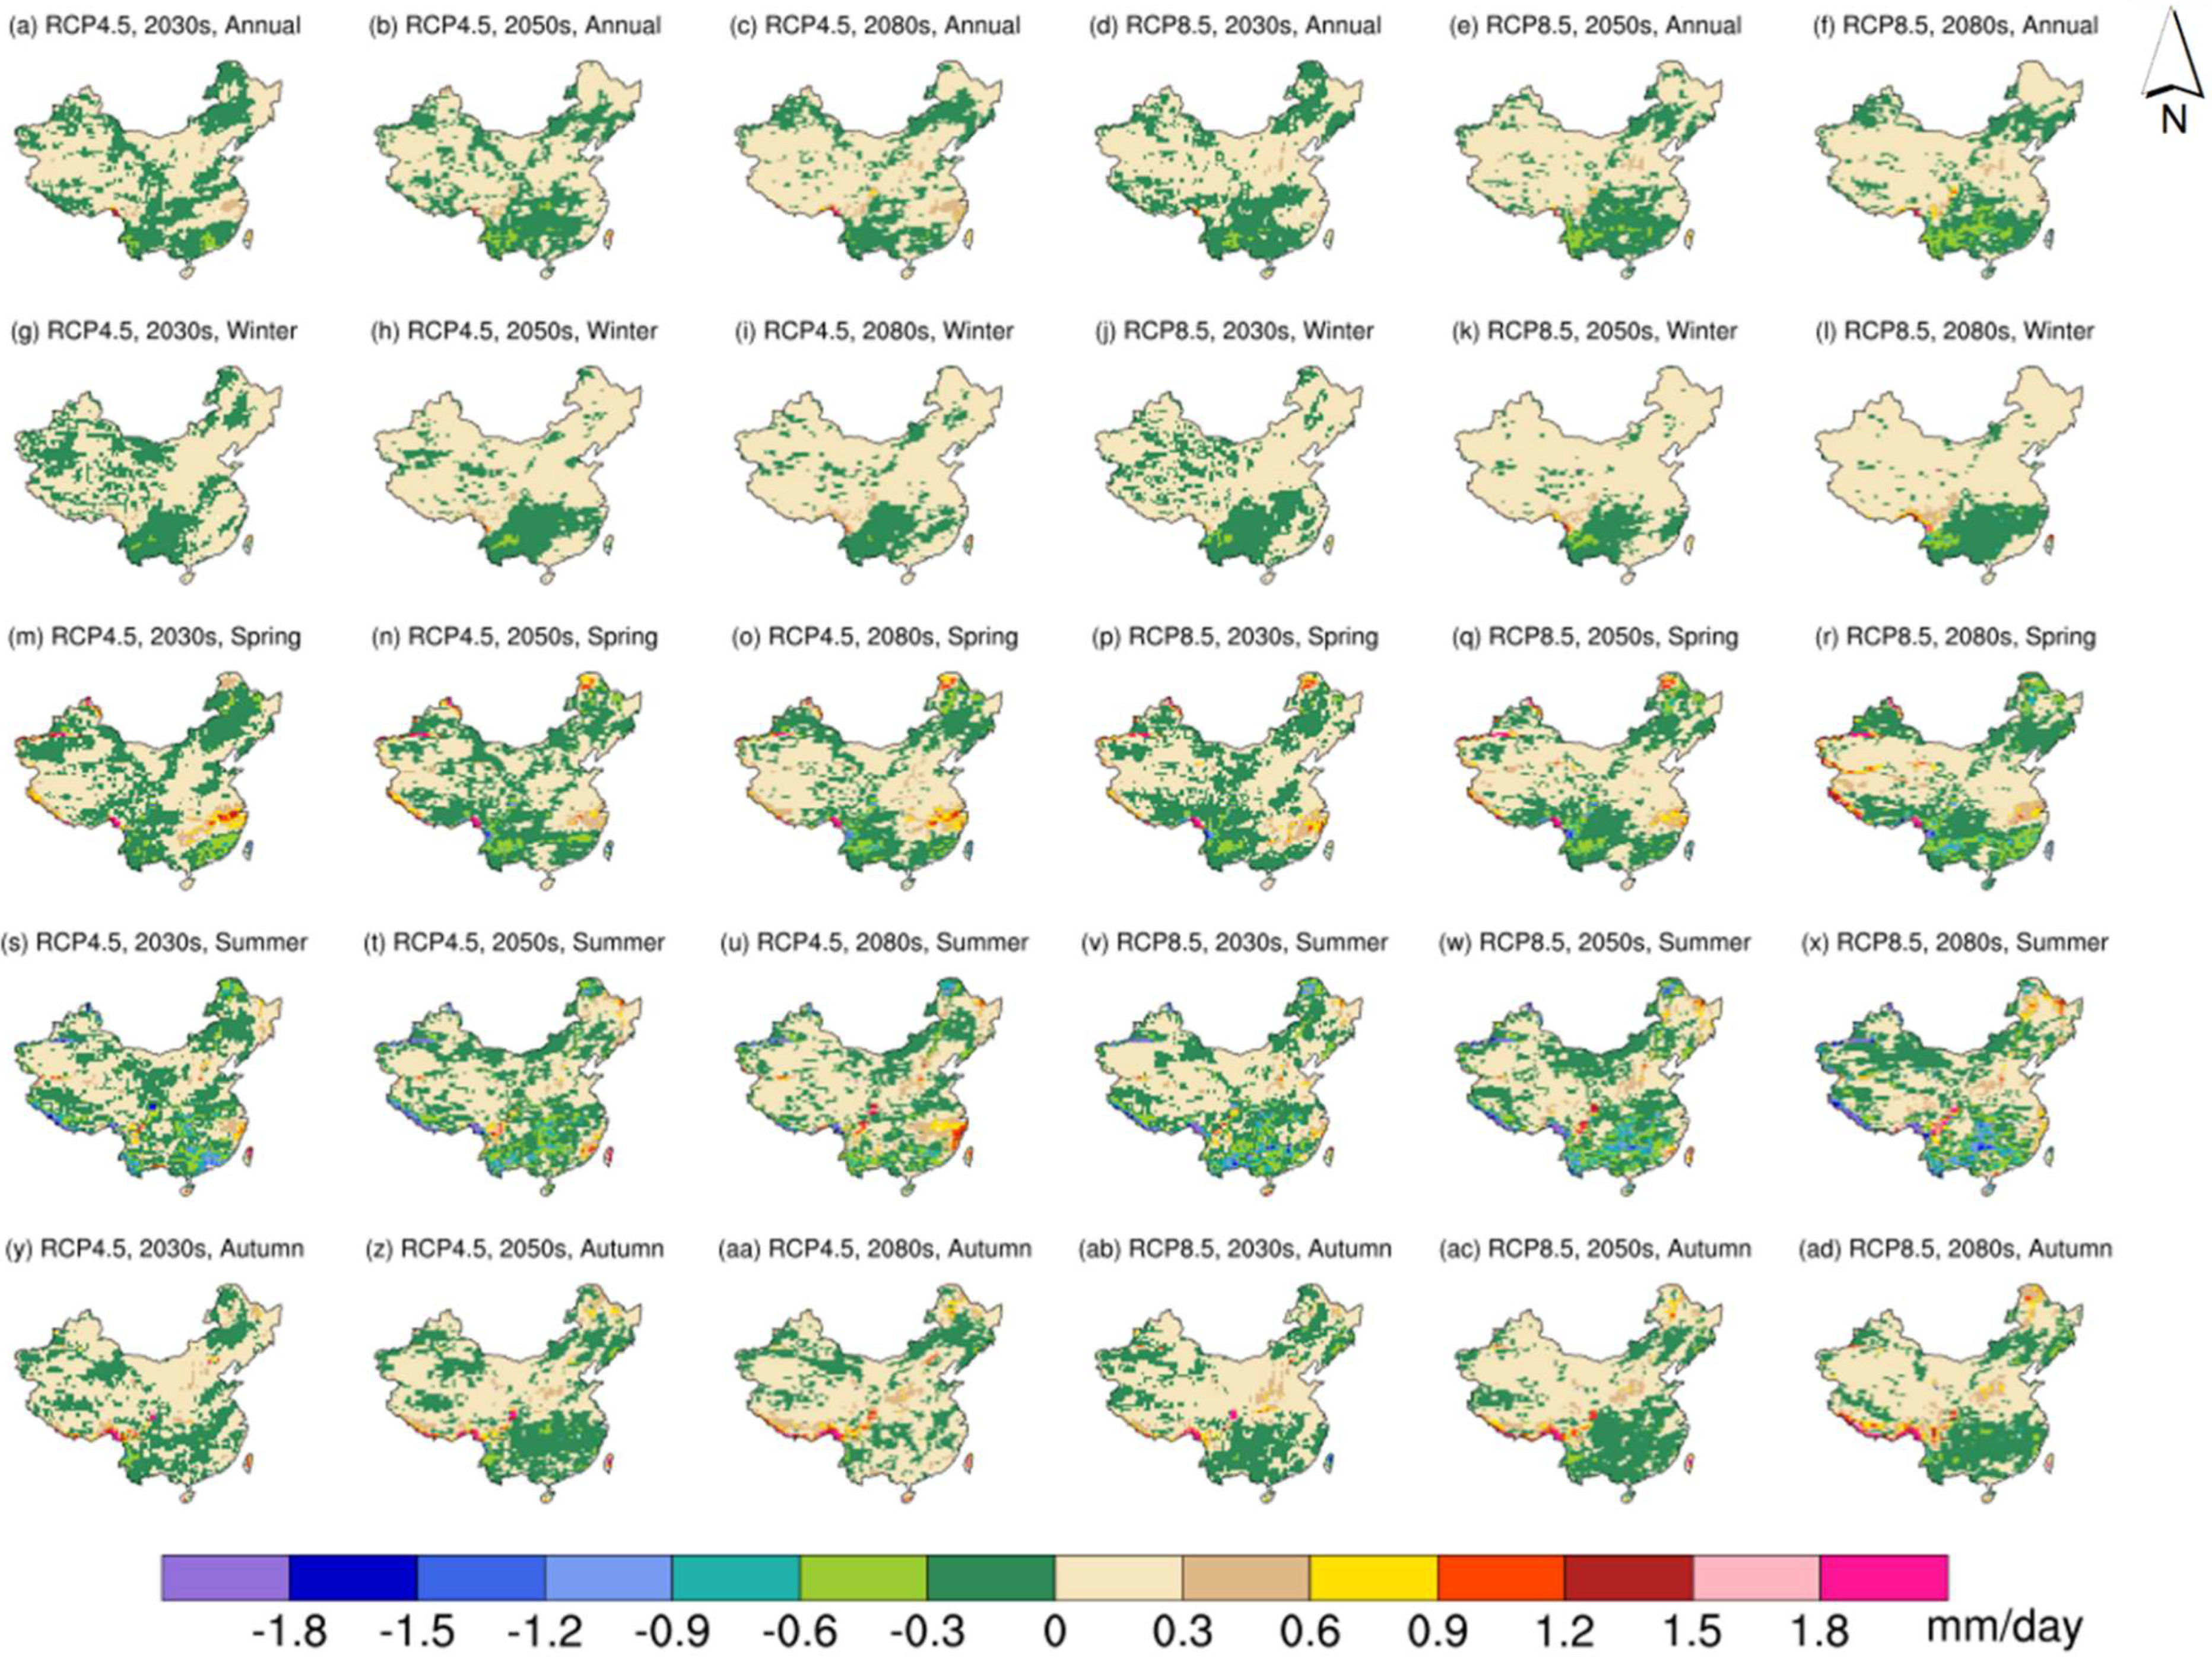
3.2.1. Precipitation

Having reasonable skills in reproducing the historical climate over China, RegCM is subsequently used to project future changes in water cycle components. The projected changes in precipitation over China in three future periods and under two emission scenarios are shown in Figure 6. The left three columns are for RCP4.5 and the right three for RCP8.5; for each scenario, the three columns, respectively, indicate 2030s, 2050s, and 2080s. The rows in the figure are the annual and seasonal averages. On annual average, increases in precipitation can be found in most parts of the domain. Precipitation changes of the two RCPs show certain similarities. For example, in the 2080s, precipitation increases of larger than 0.3 mm/day are expected in parts of the Tibetan Plateau, Yellow River Basin, Haihe River Basins, Yangtze Plain, and southern coastal hilly regions under both scenarios. In general, the area experiencing increased precipitation is larger under RCP8.5, especially in the Tibetan Plateau, where more pronounced increases (over 0.9 mm/day in the southeastern corner) can be observed as well.
Precipitation changes demonstrate apparent seasonal variations. In winter, precipitation decreases of over 0.3 mm/day can be found in parts of the Yunnan–Guizhou Plateau in the 2050s and 2080s under RCP4.5 and in the 2030s and 2050s under RCP8.5. In the 2080s under RCP8.5, more severe changes over larger areas can be noticed; parts of the Pearl River Basin are projected with precipitation decreases of over 0.3 mm/day and parts of the Yunnan–Guizhou Plateau of over 0.6 mm/day. Summer precipitation exhibits similar patterns of changes in the 2050s under the two scenarios, where decreases of over 0.3 mm/day are to be found in the middle and lower reaches of the Yangtze River Basin, and increases of over 0.9 mm/day are expected near the Hengduan Mountains located in the southeastern corner of the Tibetan Plateau. In the 2080s, the spatial distributions of summer precipitation change under the two scenarios are quite different. Under RCP4.5, precipitation decreases of over 0.3 mm/day are likely to occur in the very north of northeastern China, parts of the Yangtze Plain, and parts of the Pearl River Basin, while increases of over 0.9 mm/day are projected in the Hengduan Mountains and the southeastern coastal hilly regions. In comparison, under RCP8.5, decreases in summer precipitation mainly occur in the middle and lower reaches of the Yangtze River Basin (over 0.3 mm/day), while increases of over 0.9 mm/day are to be found in the southern parts of the Tibetan Plateau, Hengduan Mountains, and parts of the Haihe River Basin. The changes in summer precipitation may be related to variations in its major moisture transport branches, which are the transportations by the Indian monsoon, Southeast Asian monsoon, and midlatitude westerlies, as shown by Simmonds [52]. The increases in summer precipitation in southeastern China and decreases in central south and southeastern China under both scenarios could indicate an enhanced Indian summer monsoon and a subsided Southeast Asian summer monsoon. In spring and autumn, precipitation increases are to be seen in the Yangtze Plain (can reach over 1.8 mm/day) and the Yellow River Basin (over 0.9 mm/day), respectively.
The annual series of domain average precipitation under both RCPs are shown in Figure 7. For both scenarios, precipitation demonstrates an evident increasing trend (although a decreasing trend can be observed between 2050 and 2060 under RCP4.5). The Mann–Kendall test confirms the statistical significance of the trends at an α level of 0.05 (when the period of 2010 to 2100 is considered as a whole). The magnitudes of trends, given by Sen’s slope estimator, are 0.02 and 0.03 mm/day per decade under RCP4.5 and RCP8.5, respectively (as shown in Table 2). Some seasonal trends are also statistically significant; summer precipitation shows increasing trends of 0.02 and 0.05 mm/day per decade under the two scenarios, and autumn precipitation increases at a rate of 0.02 mm/day per decade under RCP8.5.
Precipitation changes (with respect to the baseline period) in the three future periods under both scenarios are listed in Table 3. Under RCP4.5, the annual average precipitation is projected to increase by 0.06, 0.08, and 0.16 mm/day, respectively, in the three future periods (statistically significant at an α level of 0.05). Under RCP8.5, precipitation change in the 2030s is not statistically significant, and the increases in the 2050s and 2080s are 0.12 and 0.2 mm/day, respectively. Spring and summer precipitation is expected to undergo larger increases than that in winter and autumn. These numbers are consistent with the changes in the annual cycles of precipitation as shown in Figure 8, in which large precipitation increases can be found from April to September in the 2050s and 2080s under both scenarios.
Precipitation changes with respect to different warming levels under the two scenarios are shown in Table 4. The magnitudes of changes under the same warming level are similar under different scenarios. For example, with a domain average warming of 2 °C, the annual average precipitation is likely to increase by 0.12 and 0.13 mm/day under RCP4.5 and RCP8.5, respectively. This phenomenon is reasonable because, according to the Clausius–Clapeyron equation, the increase in the water holding capacity of the atmosphere is the same given the same temperature increase. The change in precipitation is not necessarily the same since the actual amount of water vapor available can be different. At a warming level of 2 °C, spring and summer precipitation is also projected to increase by 0.15 and 0.17 mm/day under RCP4.5, and by 0.21 and 0.17 mm/day under RCP8.5. When domain average warming reaches 4 °C under RCP8.5, the annual, spring, and summer precipitation are projected to increase by 0.19, 0.24, and 0.27 mm/day, respectively.

3.2.2. Evapotranspiration
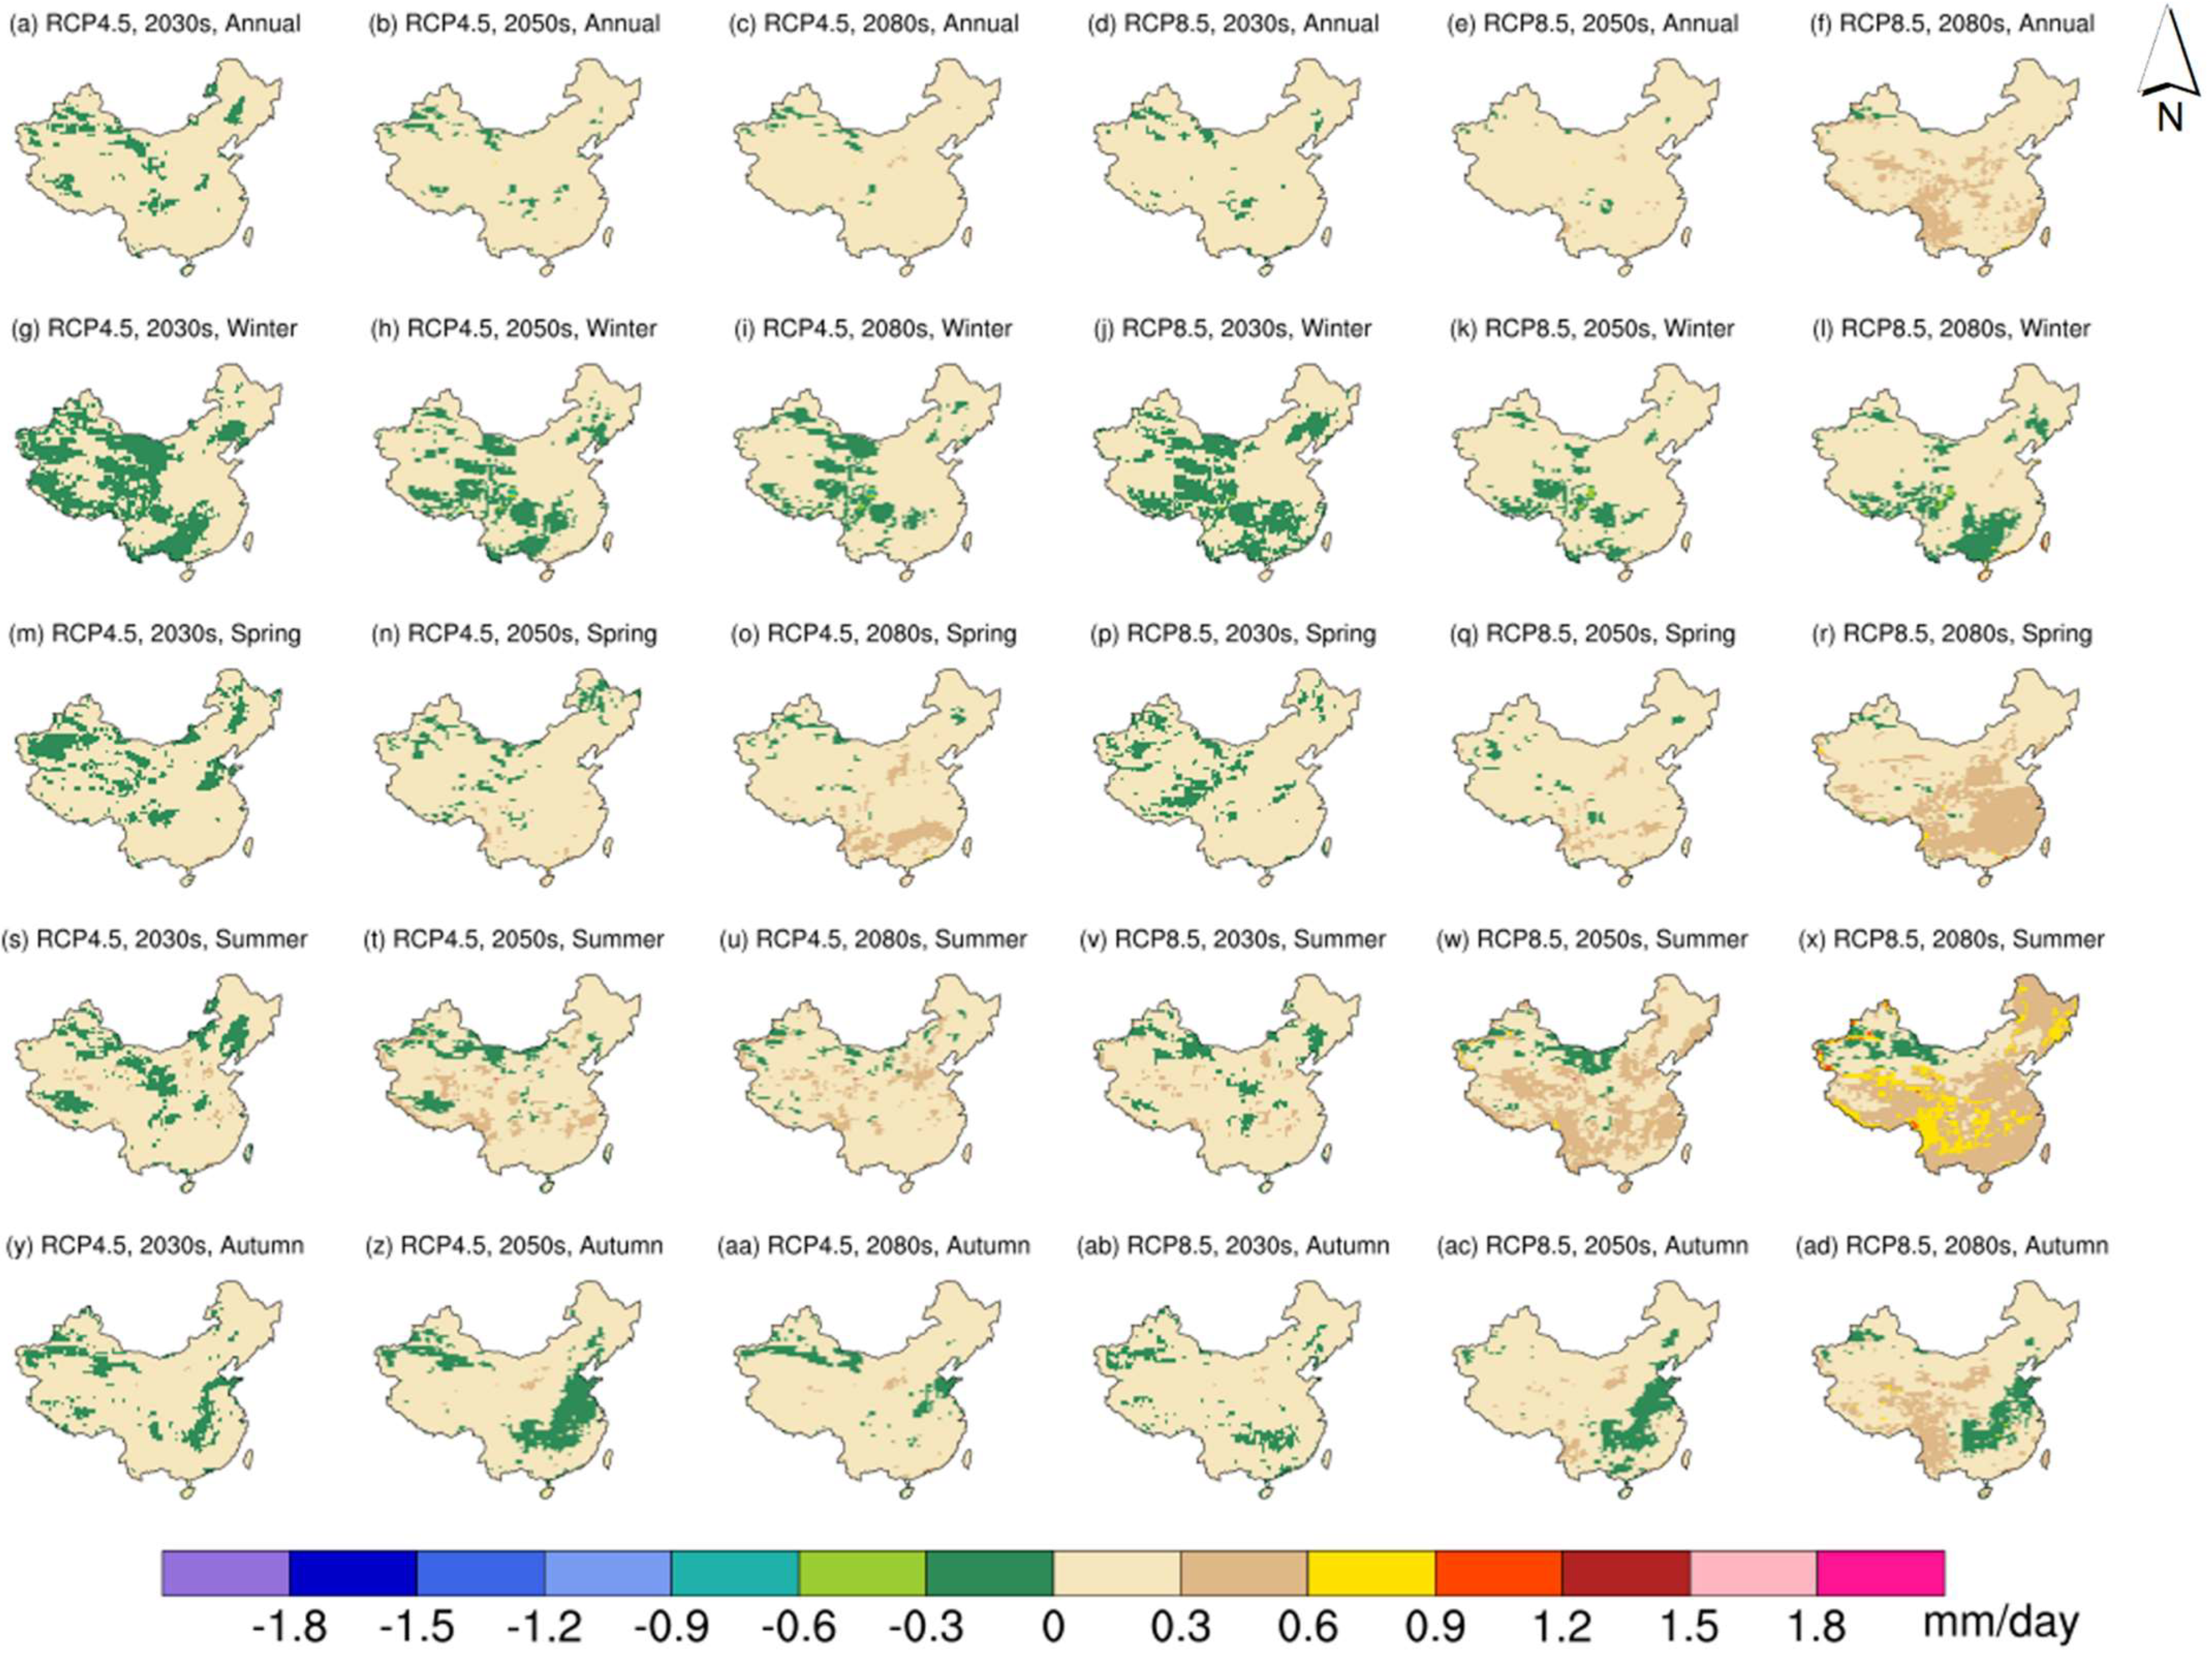
The projected changes in evapotranspiration over China are shown in Figure 9. Similar to the spatial pattern of precipitation changes, the annual average evapotranspiration is likely to increase over most parts of the domain. The area experiencing increased evapotranspiration is larger than that for precipitation, but the magnitude of the increase is smaller when compared with precipitation. Annual average evapotranspiration changes are within ±0.3 mm/day for most of the time under both scenarios, except that increases of over 0.3 mm/day are projected in the Hengduan Mountains, Yunnan–Guizhou Plateau, and southeastern coastal hilly regions in the 2080s under RCP8.5. Intra-annual variations can also be observed for evapotranspiration changes. The most pronounced changes are to occur in summer, in which evapotranspiration increases of over 0.3 mm/day can be found over the entire domain except parts in northern and northeastern China in the 2080s under RCP8.5, and increases of over 0.6 mm/day are to be seen in the Hengduan Mountains. In spring, evaporation increases of over 0.3 mm/day are projected in areas between the Yangtze River and Pearl River Basins in the 2080s under RCP4.5, and in most of the southern parts of the domain in the same period under RCP8.5. In autumn, evapotranspiration increases of over 0.3 mm/day can be found in the Hengduan Mountains. Evapotranspiration changes in winter are within ±0.3 mm/day for all future periods under both scenarios.
The annual average evapotranspiration time series is shown in Figure 7, which appears to be less fluctuating than those of the other two variables. Evident increasing trends can be observed under both scenarios, the magnitudes of which are 0.01 and 0.03 mm/day per decade (statistically significant at an α level of 0.05), respectively (Table 2). All seasonal trends are exclusively statistically significant, which are 0.01, 0.02, 0.01, and 0.01 mm/day per decade, respectively, for winter, spring, summer, and autumn under RCP4.5 and 0.01, 0.03, 0.04, and 0.02 mm/day per decade under RCP8.5. Annual and seasonal evapotranspiration changes in the three future periods under both scenarios are all statistically significant, except for winter in the 2030s under RCP4.5 (Table 3). Under RCP4.5, annual average evapotranspiration is projected to increase by 0.06, 0.1, and 0.12 mm/day, respectively, for the 2030s, 2050s, and 2080s, while, under RCP8.5, the increases are 0.08, 0.14, and 0.22 mm/day. Such increases in evapotranspiration can also be observed in Figure 8, in which evapotranspiration changes are always above zero and larger increases can be found in the monsoon months. At a domain average warming of 2 °C, annual average evapotranspiration is projected to increase by 0.12 and 0.14 mm/day under the two scenarios (Table 4), which are close to the amount of precipitation increases. For the 4 °C warming period under RCP8.5, annual evapotranspiration is likely to increase by 0.21 mm/day, and seasonal evapotranspiration by 0.08, 0.23, 0.36, and 0.18 mm/day for winter, spring, summer, and autumn, respectively.

3.2.3. Runoff

Figure 10 shows the projected changes in future runoff. In general, the annual and seasonal variations in runoff share a certain resemblance with those in precipitation, and only the area experiencing increased runoff is considerably smaller. Runoff changes in most parts of the domain are within ±0.3 mm/day in the three future periods under both scenarios. Under RCP4.5, runoff increases of over 0.3 mm/day can be found in the Yangtze Plain in the 2080s. Under RCP8.5, over 0.3 mm/day decreases in runoff are likely to occur in parts of the Yunnan–Guizhou Plateau in the 2050s and also in parts of the Yangtze River Basin in the 2080s. Seasonal changes in future runoff also demonstrate distinct characteristics. Among all seasons, runoff changes in summer are most severe. For example, under RCP4.5, runoff increases of over 1.2 mm/day are projected in the southeastern coastal hilly regions in the 2080s, which can be related to the increased precipitation in this area. Under RCP8.5, a considerable part of the Yangtze River Basin is projected to experience a runoff reduction of over 0.6 mm/day in the 2080s, which is likely to be caused by the simultaneous decrease in precipitation and increase in evapotranspiration. In winter, changes in runoff are within ±0.3 mm/day in most parts of the domain, with decreases in the central and southwestern parts and increases elsewhere. Spring runoff is projected to increase in the Yangtze Plain by at least over 0.3 mm/day in the future. In autumn, parts of the Yellow River and Haihe River Basins are to receive runoff increases of over 0.3 mm/day. The observed changes in runoff are closely related to the corresponding changes in precipitation.
As shown in Figure 7, the interannual variation in runoff is highly correlated with those in precipitation and precipitation minus evapotranspiration (hereafter as P E ). In addition, the changes in P E are slightly larger than those in runoff, which are consistent with the observations of Zhang et al. [2]. They offered two possible explanations: problems with model spinup or water balance closure, and changes in terrestrial water storage as a result of global warming [2]. The latter case indicates a reduction in future soil moisture, which may bring a negative influence on agriculture. The time series of annual average runoff do not exhibit apparent trends, which is consistent with the lack of a significant trend as shown in Table 2. Previous studies also noticed that the annual runoff series does not demonstrate a trend in the historical period; for example, no statistically significant trend can be detected in the Huaihe River Basin, according to Yu et al. [53]. Significant weak trends of 0.01 mm/day per decade are projected in autumn under RCP4.5 and in winter and autumn under RCP8.5. In comparison with precipitation and evapotranspiration, there is no statistically significant change in annual average runoff except for the 2080s under RCP4.5 (0.05 mm/day). Statistically significant runoff reductions are projected in summer, which are −0.08 and −0.09 mm/day in the 2030s and 2050s under RCP4.5 and −0.12, −0.13, and −0.16 mm/day in the three future periods under RCP8.5. Such a runoff reduction in summer is also evident in Figure 8. These observations are partially consistent with those of Zhang et al. [2], who noticed that changes in precipitation, evapotranspiration, runoff, and P E mainly occur in the wet season with simultaneous increases in all variables. In this study, the most pronounced changes also occur in the wet season. The projected reduction in runoff and P E could be related to the difference in the domain selection between this and Zhang et al.’s studies. There is no significant change in annual average runoff under all warming levels and emission scenarios, except that an increase of 0.04 mm/day is projected at a warming level of 3 °C under RCP8.5. At a warming level of 2 °C, runoff changes of 0.02 and 0.08 mm/day are likely to occur in winter and autumn under RCP4.5, and 0.03, −0.11, and 0.08 mm/day in winter, summer, and autumn under RCP8.5. With a domain average warming of 4 °C, runoff in winter, summer, and autumn is to change by 0.03, −0.15, and 0.01 mm/day under RCP8.5.

4. Discussions and Conclusions

In this study, the long-term variations in the water cycle over China are studied using RegCM. The performance of RegCM in terms of temperature, precipitation, evapotranspiration, and runoff is validated through comparisons of the model-generated results with gridded observations, remote sensing data, and reconstructed data. The results show that RegCM can reasonably capture the spatial and seasonal variations in these variables, although certain biases exist, such as a cold bias in the entire domain, a dry and wet bias pair in the southeastern and northwestern parts of the domain, some over- and underestimations of evapotranspiration, respectively, in winter/spring and summer/autumn, and some over- and underestimations of runoff near the Tibetan Plateau.
Long-term projections of precipitation, evapotranspiration, and runoff under two emission scenarios are then developed. The results show that increased annual average precipitation and evapotranspiration can be found in most parts of the domain, while a smaller part of the domain is projected with increased runoff.
For precipitation, the regions most affected by global warming are the Yangtze Plain, Yellow River and Haihe River Basins, and southeastern parts of the Tibetan Plateau, where over 0.3 mm/day increases are expected in the 2080s under both scenarios. The projected increase in precipitation in the Yellow River and Haihe River Basins can also be observed in a CMIP6 GCM ensemble according to Tian et al. [54]. It is worth noting that although the projected precipitation increase in the Tarim Basin is within 0.3 mm/day, the percentage change could be large considering its low annual average total precipitation, which is why several studies (e.g., [55,56]) identified it as an area vulnerable to climate change. Precipitation increase has been shown to be among the driving factors for the increased flood frequency in the Tarim River Basin since the 1980s [57]; the increase in future precipitation as projected by this and the previous studies may indicate increased flood risks in this area, which suggests the need for relevant flood prevention measures.
For evapotranspiration, areas experiencing evident increases are the Hengduan Mountains, Yunnan–Guizhou Plateau, and southeastern coastal hilly regions; the magnitude of change is 0.3 mm/day in the 2080s under RCP8.5. The apparent evapotranspiration increase in southeastern coastal hilly regions is also noted by Su et al. [58]. In terms of seasonal variations, summer and spring are likely to see larger increases in evapotranspiration; this feature is consistent with Ma et al.’s observation [59]. The developed projections in evapotranspiration can be used to evaluate climate change impacts on drought conditions through the calculation of evapotranspiration deficit; this index, compared with those that are based on precipitation and soil moisture, could more effectively reflect moisture deficiency in ecosystems [60].
For runoff, the regions most affected are the Yangtze Delta, Yunnan–Guizhou Plateau, and parts of the Yangtze River Basin, with increases of 0.3 mm/day for the first region in the 2080s under RCP4.5 and decreases of over 0.3 mm/day for the latter two regions in the 2080s under RCP8.5. The projected decrease in runoff in the middle reaches of the Yangtze River Basin is consistent with the results from Xing et al.’s study [61]. In addition, the runoff reduction in the Yunnan–Guizhou Plateau and the upper reaches of the Yangtze River Basin is also noticed by Zhai et al. in their ensemble projection of runoff [62]. Extreme high and low runoff are often related to flood and drought hazards [63], and the runoff projection developed in this study could help identify regions vulnerable to increased flood and drought risks, and thus support flood mitigation and water resource management [64].
In summary, future precipitation and evapotranspiration are likely to increase over China in the wet season, while runoff decreases. The projected changes in precipitation minus evapotranspiration are larger than those in runoff, implying a possible decrease in soil moisture. It is important that future variations in the water cycle components be considered when designing flood and drought mitigation measures.
Extensions of this study can be conducted with respect to the current limitations. For example, more sophisticated bias correction techniques can be applied to the model results. In addition, more GCMs can be used to drive RegCM so that an ensemble can be constructed for more robust projections.

Supplementary Materials

The following are available online at https://www.mdpi.com/article/10.3390/rs13193832/s1, Figure S1: Location of NIMC weather stations. Note: Red dots indicate selected stations for evapotranspiration data. The NIMC tank evaporation data contains a large number of missing data; the stations are selected if the percentage of missing data is less than 50% for each season. Figure S2: Simulated annual cycles for precipitation, evapotranspiration, runoff, and the difference between precipitation and evapotranspiration in the baseline period. The R2’s for the two sets of RegCM results are 0.88, 0.92, 0.83, and 0.82, respectively for precipitation, evapotranspiration, runoff, and the difference between precipitation and evapotranspiration. Table S1: Spatial correlation between RegCM-generated results and observations, remote sensing data, and reconstructed data. Table S2: Spatial correlation between raw GFDL data and observations.

Author Contributions

Conceptualization, C.L., G.H. and X.W.; Data curation, C.L. and X.W.; Formal analysis, C.L.; Funding acquisition, G.H.; Investigation, C.L.; Methodology, C.L. and X.W.; Project administration, G.H.; Resources, C.L. and G.H.; Software, C.L. and X.W.; Supervision, G.H.; Validation, C.L., G.H., X.W., G.W., J.Z. and T.S.; Visualization, C.L.; Writing—original draft, C.L.; Writing—review and editing, C.L. and X.W. All authors have read and agreed to the published version of the manuscript.

Funding

This research was supported by the National Key Research and Development Plan (2016YFA0601502), Natural Sciences Foundation (U2040212), Canada Research Chair Program, and Natural Science and Engineering Research Council of Canada.

Data Availability Statement

The gridded observation data are obtained from the Climate Research Unit (https://crudata.uea.ac.uk/cru/data/hrg/; accessed on 18 March 2019). Remote sensing datasets are obtained from the Land Processes Distributed Active Archive Center (https://lpdaac.usgs.gov/; accessed on 9 September 2021) and the Global Land Evaporation Amsterdam Model (https://www.gleam.eu/; accessed on 29 June 2021). The reconstructed runoff data are obtained from Ghiggi et al. [42]. The station-based observations are obtained from the National Meteorological Information Center of China (data.cma.cn; accessed on 9 April 2019). The reanalysis data used to drive RegCM are obtained from the European Centre for Medium-Range Weather Forecasts (https://www.ecmwf.int/en/forecasts/datasets/reanalysis-datasets/era-interim; accessed on 22 November 2017). Global climate model data are obtained from the Geophysical Fluid Dynamics Laboratory and downloaded from the Earth System Grid Federation (https://esgf-node.llnl.gov/search/cmip5/; accessed on 4 April 2017).

Acknowledgments

We are very grateful for the helpful inputs from the editor and anonymous reviewers.

Conflicts of Interest

The authors declare no conflict of interest.

References

  1. Sun, Y.; Solomon, S.; Dai, A.; Portmann, R.W. How Often Will It Rain? J. Clim. 2007, 20, 4801–4818. [Google Scholar] [CrossRef]
  2. Zhang, W.; Zhou, T.; Zhang, L.; Zou, L. Future Intensification of the Water Cycle with an Enhanced Annual Cycle over Global Land Monsoon Regions. J. Clim. 2019, 32, 5437–5452. [Google Scholar] [CrossRef]
  3. Tan, L.; Schultz, D.M. Damage classification and recovery analysis of the Chongqing, China, floods of August 2020 based on social-media data. J. Clean. Prod. 2021, 313, 127882. [Google Scholar] [CrossRef]
  4. Trenberth, K.E.; Fasullo, J.T. Regional Energy and Water Cycles: Transports from Ocean to Land. J. Clim. 2013, 26, 7837–7851. [Google Scholar] [CrossRef]
  5. Hanel, M.; Rakovec, O.; Markonis, Y.; Máca, P.; Samaniego, L.; Kyselý, J.; Kumar, R. Revisiting the recent European droughts from a long-term perspective. Sci. Rep. 2018, 8, 9499. [Google Scholar] [CrossRef]
  6. Shrestha, N.K.; Wang, J. Water Quality Management of a Cold Climate Region Watershed in Changing Climate. J. Environ. Inform. 2019, 35, 56–80. [Google Scholar] [CrossRef]
  7. Xie, W.P.; Yang, J.S.; Yao, R.J.; Wang, X.P. Impact Study of Impoundment of the Three Gorges Reservoir on Salt-Water Dynamics and Soil Salinity in the Yangtze River Estuary. J. Environ. Inform. 2020, 36, 11–23. [Google Scholar] [CrossRef]
  8. Yao, Y.; Huang, G.; An, C.; Chen, X.; Zhang, P.; Xin, X.; Jian, S.; Agnew, J. Anaerobic digestion of livestock manure in cold regions: Technological advancements and global impacts. Renew. Sustain. Energy Rev. 2020, 119, 109494. [Google Scholar] [CrossRef]
  9. Wang, X.; Wang, P.F.; Wang, C.; Chen, J.; Hou, J.; Miao, L.Z.; Feng, T.; Yuan, Q.S. Taxonomic and Functional Responses of Sediment Bacterial Community to Anthropogenic Disturbances in the Yarlung Tsangpo River on the Tibetan Plateau. J. Environ. Inform. 2019, 35, 23–33. [Google Scholar] [CrossRef]
  10. Wu, H.P.; Chen, J.; Zeng, G.M.; Xu, J.J.; Sang, L.H.; Liu, Q.; Dai, J.; Xiong, W.P.; Yuan, Z.; Wang, Y.Q.; et al. Effects of Early Dry Season on Habitat Suitability for Migratory Birds in China’s Two Largest Freshwater Lake Wetlands after the Impoundment of Three Gorges Dam. J. Environ. Inform. 2019, 36, 82–92. [Google Scholar] [CrossRef]
  11. Xinhua Net Latest flood on China’s Yangtze River Passes Three Gorges Dam. 2020. Available online: www.xinhuanet.com/english/2020-08/22/c_139310599.htm (accessed on 16 July 2021).
  12. China News 63 Million People Affected and 219 Killed in This Year’s Flood Disaster. 2020. Available online: www.chinanews.com/sh/2020/08-13/9263764.shtml (accessed on 16 July 2021). (In Chinese).
  13. Li, M.; Jiang, Z.; Zhou, P.; Le Treut, H.; Li, L. Projection and possible causes of summer precipitation in eastern China using self-organizing map. Clim. Dyn. 2020, 54, 2815–2830. [Google Scholar] [CrossRef]
  14. Dong, Q.; Wang, W.; Shao, Q.; Xing, W.; Ding, Y.; Fu, J. The response of reference evapotranspiration to climate change in Xinjiang, China: Historical changes, driving forces, and future projections. Int. J. Climatol. 2020, 40, 235–254. [Google Scholar] [CrossRef]
  15. Yan, Z.; Zhou, Z.; Liu, J.; Han, Z.; Gao, G.; Jiang, X. Ensemble Projection of Runoff in a Large-Scale Basin: Modeling with a Global BMA Approach. Water Resour. Res. 2020, 56, e2019WR026134. [Google Scholar] [CrossRef]
  16. Gu, L.; Chen, J.; Yin, J.; Xu, C.; Zhou, J. Responses of Precipitation and Runoff to Climate Warming and Implications for Future Drought Changes in China. Earth’s Future 2020, 8, e2020EF001718. [Google Scholar] [CrossRef]
  17. Giorgi, F. Thirty Years of Regional Climate Modeling: Where Are We and Where Are We Going next? J. Geophys. Res. Atmos. 2019, 124, 5696–5723. [Google Scholar] [CrossRef] [Green Version]
  18. Giorgi, F.; Hewitson, B.; Arritt, R.; Gutowski, W.; Knutson, T.; Landsea, C.; Christensen, J.; Hulme, M.; Von Storch, H.; Whetton, J.P.; et al. Regional Climate Information—Evaluation and Projections. In Climate Change 2001: The Scientific Bases; Cambridge University Press: Cambridge, UK, 2001; pp. 583–638. [Google Scholar]
  19. Walton, D.; Berg, N.; Pierce, D.; Maurer, E.; Hall, A.; Lin, Y.; Rahimi, S.; Cayan, D. Understanding Differences in California Climate Projections Produced by Dynamical and Statistical Downscaling. J. Geophys. Res. Atmos. 2020, 125, e2020JD032812. [Google Scholar] [CrossRef]
  20. Fan, D.; Jiang, Z.; Tian, Z.; Dong, G.; Sun, L. The Effects of Climate Change on Chinese Medicinal Yam Over North China Under the High-Resolution PRECIS Projection. Earth Space Sci. 2021, 8, e2021EA001804. [Google Scholar] [CrossRef]
  21. Ashfaq, M.; Cavazos, T.; Reboita, M.S.; Torres-Alavez, J.A.; Im, E.-S.; Olusegun, C.F.; Alves, L.; Key, K.; Adeniyi, M.O.; Tall, M.; et al. Robust late twenty-first century shift in the regional monsoons in RegCM-CORDEX simulations. Clim. Dyn. 2021, 57, 1463–1488. [Google Scholar] [CrossRef]
  22. Lu, C.; Huang, G.; Wang, X. Projected changes in temperature, precipitation, and their extremes over China through the RegCM. Clim. Dyn. 2019, 53, 5859–5880. [Google Scholar] [CrossRef]
  23. Pan, X.D.; Zhang, L.; Huang, C.L. Future Climate Projection in Northwest China with RegCM4.6. Earth Space Sci. 2020, 7, e2019EA000819. [Google Scholar] [CrossRef]
  24. Gao, S. Dynamical downscaling of surface air temperature and precipitation using RegCM4 and WRF over China. Clim. Dyn. 2020, 55, 1283–1302. [Google Scholar] [CrossRef]
  25. Jiang, Z.; Tian, Z.; Dong, G.; Sun, L.; Zhang, P.; Buonomo, E.; Fan, D. High-Resolution Projections of Mean and Extreme Precipitation over China by Two Regional Climate Models. J. Meteorol. Res. 2020, 34, 965–985. [Google Scholar] [CrossRef]
  26. Grell, G.A.; Dudhia, J.; Stauffer, D.R. A Description of the Fifth-Generation Penn State/NCAR Mesoscale Model (MM5). 1994. Available online: https://opensky.ucar.edu/islandora/object/technotes:170 (accessed on 15 July 2021).
  27. Steiner, A.L.; Pal, J.S.; Giorgi, F.; Dickinson, R.E.; Chameides, W.L. The coupling of the Common Land Model (CLM0) to a regional climate model (RegCM). Theor. Appl. Climatol. 2005, 82, 225–243. [Google Scholar] [CrossRef]
  28. Oleson, K.W.; Lawrence, D.M.; Bonan, G.B.; Drewniak, B.; Huang, M.; Koven, C.D.; Levis, S.; Li, F.; Riley, W.J.; Subin, Z.M.; et al. Technical Description of Version 4.5 of the Community Land Model (CLM). 2013. Available online: https://opensky.ucar.edu/islandora/object/technotes:515 (accessed on 29 August 2021).
  29. Niu, G.-Y.; Yang, Z.-L.; Dickinson, R.E.; Gulden, L.E. A simple TOPMODEL-based runoff parameterization (SIMTOP) for use in global climate models. J. Geophys. Res. 2005, 110, D21106. [Google Scholar] [CrossRef] [Green Version]
  30. Branstetter, M.L. Development of a Parallel River Transport Algorithm and Applications to Climate Studies; The University of Texas at Austin: Austin, TX, USA, 2001. [Google Scholar]
  31. Dee, D.P.; Uppala, S.M.; Simmons, A.J.; Berrisford, P.; Poli, P.; Kobayashi, S.; Andrae, U.; Balmaseda, M.A.; Balsamo, G.; Bauer, P.; et al. The ERA-Interim reanalysis: Configuration and performance of the data assimilation system. Q. J. R. Meteorol. Soc. 2011, 137, 553–597. [Google Scholar] [CrossRef]
  32. Dunne, J.P.; John, J.G.; Adcroft, A.J.; Griffies, S.M.; Hallberg, R.W.; Shevliakova, E.; Stouffer, R.J.; Cooke, W.; Dunne, K.A.; Harrison, M.J.; et al. GFDL’s ESM2 Global Coupled Climate–Carbon Earth System Models. Part I: Physical Formulation and Baseline Simulation Characteristics. J. Clim. 2012, 25, 6646–6665. [Google Scholar] [CrossRef] [Green Version]
  33. Dunne, J.P.; John, J.G.; Shevliakova, E.; Stouffer, R.J.; Krasting, J.P.; Malyshev, S.L.; Milly, P.C.D.; Sentman, L.T.; Adcroft, A.J.; Cooke, W.; et al. GFDL’s ESM2 Global Coupled Climate–Carbon Earth System Models. Part II: Carbon System Formulation and Baseline Simulation Characteristics. J. Clim. 2013, 26, 2247–2267. [Google Scholar] [CrossRef] [Green Version]
  34. Harris, I.; Osborn, T.J.; Jones, P.; Lister, D. Version 4 of the CRU TS monthly high-resolution gridded multivariate climate dataset. Sci. Data 2020, 7, 109. [Google Scholar] [CrossRef] [Green Version]
  35. Sun, Q.; Miao, C.; Duan, Q.; Ashouri, H.; Sorooshian, S.; Hsu, K. A Review of Global Precipitation Data Sets: Data Sources, Estimation, and Intercomparisons. Rev. Geophys. 2018, 56, 79–107. [Google Scholar] [CrossRef] [Green Version]
  36. Running, S.; Mu, Q.; Zhao, M.; Moreno, A. MOD16A2GF MODIS/Terra Net Evapotranspiration Gap-Filled 8-Day L4 Global 500 m SIN Grid V006 [Data Set]. 2019. Available online: https://lpdaac.usgs.gov/ (accessed on 9 September 2021).
  37. Martens, B.; Miralles, D.G.; Lievens, H.; van der Schalie, R.; de Jeu, R.A.M.; Fernández-Prieto, D.; Beck, H.E.; Dorigo, W.A.; Verhoest, N.E.C. GLEAM v3: Satellite-based land evaporation and root-zone soil moisture. Geosci. Model Dev. 2017, 10, 1903–1925. [Google Scholar] [CrossRef] [Green Version]
  38. Miralles, D.G.; Holmes, T.R.H.; De Jeu, R.A.M.; Gash, J.H.; Meesters, A.G.C.A.; Dolman, A.J. Global land-surface evaporation estimated from satellite-based observations. Hydrol. Earth Syst. Sci. 2011, 15, 453–469. [Google Scholar] [CrossRef] [Green Version]
  39. Mu, Q.; Zhao, M.; Running, S.W. MODIS Global Terrestrial Evapotranspiration (ET) Product (NASA MOD16A2/A3) Algorithm Theoretical Basis Document Collection 5; Missoula. 2013. Available online: https://modis-land.gsfc.nasa.gov/pdf/MOD16ATBD.pdf (accessed on 8 September 2021).
  40. Liu, Z.; Shao, Q.; Liu, J. The Performances of MODIS-GPP and -ET Products in China and Their Sensitivity to Input Data (FPAR/LAI). Remote Sens. 2014, 7, 135–152. [Google Scholar] [CrossRef]
  41. Yang, X.; Yong, B.; Ren, L.; Zhang, Y.; Long, D. Multi-scale validation of GLEAM evapotranspiration products over China via ChinaFLUX ET measurements. Int. J. Remote Sens. 2017, 38, 5688–5709. [Google Scholar] [CrossRef]
  42. Ghiggi, G.; Humphrey, V.; Seneviratne, S.I.; Gudmundsson, L. GRUN: An observation-based global gridded runoff dataset from 1902 to 2014. Earth Syst. Sci. Data 2019, 11, 1655–1674. [Google Scholar] [CrossRef] [Green Version]
  43. Li, J.; Miao, C.; Wei, W.; Zhang, G.; Hua, L.; Chen, Y.; Wang, X. Evaluation of CMIP6 Global Climate Models for Simulating Land Surface Energy and Water Fluxes During 1979–2014. J. Adv. Model. Earth Syst. 2021, 13, e2021MS002515. [Google Scholar] [CrossRef]
  44. Ding, Y.; Xu, J.; Wang, X.; Cai, H.; Zhou, Z.; Sun, Y.; Shi, H. Propagation of meteorological to hydrological drought for different climate regions in China. J. Environ. Manag. 2021, 283, 111980. [Google Scholar] [CrossRef]
  45. Luo, Y.; Yang, Y.; Yang, D.; Zhang, S. Quantifying the impact of vegetation changes on global terrestrial runoff using the Budyko framework. J. Hydrol. 2020, 590, 125389. [Google Scholar] [CrossRef]
  46. Trenberth, K.E.; Dai, A.; Rasmussen, R.M.; Parsons, D.B. The Changing Character of Precipitation. Bull. Am. Meteorol. Soc. 2003, 84, 1205–1218. [Google Scholar] [CrossRef]
  47. Mann, H.B. Nonparametric Tests Against Trend. Econometrica 1945, 13, 245. [Google Scholar] [CrossRef]
  48. Kendall, M.G. Rank Correlation Methods, 4th ed.; Charles Griffin: London, UK, 1975. [Google Scholar]
  49. Theil, H. A rank-invariant method of linear and polynomial regression analysis. In Henri Theil’s Contributions to Economics and Econometrics; Springer: Dordrecht, The Netherlands; Volume 23, pp. 345–381.
  50. Sen, P.K. Estimates of the Regression Coefficient Based on Kendall’s Tau. J. Am. Stat. Assoc. 1968, 63, 1379. [Google Scholar] [CrossRef]
  51. Khan, M.S.; Liaqat, U.W.; Baik, J.; Choi, M. Stand-alone uncertainty characterization of GLEAM, GLDAS and MOD16 evapotranspiration products using an extended triple collocation approach. Agric. For. Meteorol. 2018, 252, 256–268. [Google Scholar] [CrossRef]
  52. Simmonds, I.; Bi, D.; Hope, P. Atmospheric Water Vapor Flux and Its Association with Rainfall overChina in Summer. J. Clim. 1999, 12, 1353–1367. [Google Scholar] [CrossRef]
  53. Yu, B.Y.; Wu, P.; Sui, J.; Ni, J.; Whitcombe, T. Variation of Runoff and Sediment Transport in the Huai River—A Case Study. J. Environ. Inform. 2020, 35, 138–147. [Google Scholar] [CrossRef]
  54. Tian, J.; Zhang, Z.; Ahmed, Z.; Zhang, L.; Su, B.; Tao, H.; Jiang, T. Projections of precipitation over China based on CMIP6 models. Stoch. Environ. Res. Risk Assess. 2021, 35, 831–848. [Google Scholar] [CrossRef]
  55. Xu, H.; Chen, H.; Wang, H. Future changes in precipitation extremes across China based on CMIP6 models. Int. J. Climatol. 2021. [Google Scholar] [CrossRef]
  56. Wu, Y.; Guo, J.; Lin, H.; Bai, J.; Wang, X. Spatiotemporal patterns of future temperature and precipitation over China projected by PRECIS under RCPs. Atmos. Res. 2021, 249, 105303. [Google Scholar] [CrossRef]
  57. Zhang, Q.; Gu, X.; Singh, V.P.; Sun, P.; Chen, X.; Kong, D. Magnitude, frequency and timing of floods in the Tarim River basin, China: Changes, causes and implications. Glob. Planet. Chang. 2016, 139, 44–55. [Google Scholar] [CrossRef] [Green Version]
  58. Su, B.; Zhao, J.; Wang, Y.; Tao, H.; Gao, C.; Liu, F.; Li, X.; Jiang, T. Spatial and Temporal Variation of Actual Evapotranspiration in China under the 1.5 °C and 2.0 °C Global Warming Scenarios (In Chinese). Chin. J. Agrometeorol. 2018, 39, 293–303. [Google Scholar] [CrossRef]
  59. Ma, X.; Zhao, C.; Tao, H.; Zhu, J.; Kundzewicz, Z.W. Projections of actual evapotranspiration under the 1.5 °C and 2.0 °C global warming scenarios in sandy areas in northern China. Sci. Total Environ. 2018, 645, 1496–1508. [Google Scholar] [CrossRef]
  60. Kim, D.; Ha, K.; Yeo, J. New Drought Projections Over East Asia Using Evapotranspiration Deficits From the CMIP6 Warming Scenarios. Earth’s Future 2021, 9, e2020EF001697. [Google Scholar] [CrossRef]
  61. Xing, W.; Wang, W.; Zou, S.; Deng, C. Projection of future runoff change using climate elasticity method derived from Budyko framework in major basins across China. Glob. Planet. Chang. 2018, 162, 120–135. [Google Scholar] [CrossRef]
  62. Zhai, R.; Tao, F.; Xu, Z. Spatial–temporal changes in runoff and terrestrial ecosystem water retention under 1.5 and 2 °C warming scenarios across China. Earth Syst. Dyn. 2018, 9, 717–738. [Google Scholar] [CrossRef] [Green Version]
  63. Zhai, R.; Tao, F.; Lall, U.; Fu, B.; Elliott, J.; Jägermeyr, J. Larger Drought and Flood Hazards and Adverse Impacts on Population and Economic Productivity Under 2.0 than 1.5 °C Warming. Earth’s Future 2020, 8, e2019EF001398. [Google Scholar] [CrossRef]
  64. Kundzewicz, Z.; Su, B.; Wang, Y.; Xia, J.; Huang, J.; Jiang, T. Flood risk and its reduction in China. Adv. Water Resour. 2019, 130, 37–45. [Google Scholar] [CrossRef]
Figure 1. Observed and RegCM-simulated near-surface temperature over China. The annual and seasonal averages are calculated with respect to the baseline period of 1986 to 2005.
Remotesensing 13 03832 g001
Figure 2. Observed and RegCM-simulated precipitation over China. The annual and seasonal averages are calculated with respect to the baseline period of 1986 to 2005.
Remotesensing 13 03832 g002
Figure 3. Remotely sensed and RegCM-simulated evapotranspiration over China. The annual and seasonal averages are calculated with respect to the period of 2000 to 2005 for MODIS and 2003 to 2005 for GLEAM.
Remotesensing 13 03832 g003
Figure 4. Reconstructed and RegCM-simulated runoff over China. The annual and seasonal averages are calculated with respect to the baseline period of 1986 to 2005.
Remotesensing 13 03832 g004
Figure 5. Simulated annual cycles for precipitation, evapotranspiration, runoff, and the difference between precipitation and evapotranspiration in the baseline period.
Remotesensing 13 03832 g005
Figure 6. Projected changes in precipitation over China.
Remotesensing 13 03832 g006
Figure 7. Projected domain average anomalies of precipitation, evapotranspiration, and runoff. The time series are smoothed with a 20-year moving average filter.
Remotesensing 13 03832 g007
Figure 8. Projected changes in the annual cycles of precipitation, evapotranspiration, and runoff.
Remotesensing 13 03832 g008
Figure 9. Projected changes in evapotranspiration over China.
Remotesensing 13 03832 g009
Figure 10. Projected changes in runoff over China.
Remotesensing 13 03832 g010
Table 1. Future periods in which warming over China reaches 1, 1.5, 2, 3, and 4 °C under RCP4.5 and RCP8.5.
Warming LevelRCP4.5RCP8.5
1 °C2021~20402008~2027
1.5 °C2027~20462030~2049
2 °C2067~20862046~2065
3 °C-2056~2075
4 °C-2069~2088
Table 2. Future trends (mm/day per decade) of domain average precipitation, evapotranspiration, and runoff (P, E, and R denote precipitation, evapotranspiration, and runoff, respectively).
PeriodAnnualWinterSpringSummerAutumn
PRCP4.52030s0.02−0.040.020.15−0.05
2050s−0.050.02−0.09−0.06−0.03
2080s0.01−0.010−0.010.02
2010~21000.020.010.020.020.01
RCP8.52030s0.04−0.010.060.050.05
2050s0.0700.010.150.07
2080s−0.02−0.020.020.03−0.06
2010~21000.030.010.020.050.02
ERCP4.52030s0.030.010.020.050.02
2050s0.0100.020.030
2080s000.010−0.01
2010~21000.010.010.020.010.01
RCP8.52030s0.0300.030.050.02
2050s0.030.010.030.040.05
2080s0.0200.020.040
2010~21000.030.010.030.040.02
RRCP4.52030s00−0.020.02−0.01
2050s−0.040−0.01−0.09−0.04
2080s0.010.010.03−0.020.01
2010~21000.010.010.010.010.01
RCP8.52030s0.0200.010.040.05
2050s0.040.010.020.070.04
2080s−0.0200.02−0.06−0.01
2010~21000.010.01000.01
Notes: Numbers in bold font indicate trends that are statistically significant at α = 0.05.
Table 3. Projected changes (mm/day) in precipitation, evapotranspiration, and runoff at different future periods (P, E, and R denote precipitation, evapotranspiration, and runoff, respectively).
PeriodsAnnualWinterSpringSummerAutumn
PRCP4.52030s0.060.020.1100.1
2050s0.080.020.150.110.04
2080s0.160.060.20.20.17
RCP8.52030s0.0700.160.010.12
2050s0.120.070.180.150.08
2080s0.20.030.260.320.16
ERCP4.52030s0.060.010.070.10.06
2050s0.10.040.110.160.08
2080s0.120.050.160.180.11
RCP8.52030s0.080.020.070.140.07
2050s0.140.060.150.230.11
2080s0.220.080.250.380.18
RRCP4.52030s0.010.010.05−0.080.06
2050s00.010.04−0.090.06
2080s0.050.030.0600.12
RCP8.52030s00.010.06−0.120.07
2050s00.030.05−0.130.07
2080s00.030.04−0.160.1
Notes: Numbers in bold font indicate trends that are statistically significant at α = 0.05.
Table 4. Projected changes (mm/day) in precipitation, evapotranspiration, and runoff at different warming levels (P, E, and R denote precipitation, evapotranspiration, and runoff, respectively).
Warming LevelAnnualWinterSpringSummerAutumn
PRCP4.51 °C0.060.020.13−0.010.08
1.5 °C0.0800.150.10.08
2 °C0.120.070.150.170.1
RCP8.51 °C0.03−0.020.10.030
1.5 °C0.050.020.140.010.04
2 °C0.130.060.210.170.08
3 °C0.20.040.220.340.19
4 °C0.190.050.240.270.2
ERCP4.51 °C0.060.010.070.10.06
1.5 °C0.070.020.080.130.06
2 °C0.120.050.160.190.09
RCP8.51 °C0.040.020.040.090.03
1.5 °C0.090.030.10.180.07
2 °C0.140.060.140.220.12
3 °C0.180.060.20.290.17
4 °C0.210.080.230.360.18
RRCP4.51 °C0.010.010.06−0.080.06
1.5 °C0.020.010.06−0.050.06
2 °C0.020.020.04−0.060.08
RCP8.51 °C−0.03−0.010.03−0.140.01
1.5 °C−0.020.010.03−0.160.05
2 °C0.010.030.06−0.110.08
3 °C0.040.030.04−0.060.13
4 °C00.030.03−0.150.1
Notes: Numbers in bold font indicate trends that are statistically significant at α = 0.05.
Publisher’s Note: MDPI stays neutral with regard to jurisdictional claims in published maps and institutional affiliations.

