Article

Wearable Near-Infrared Spectroscopy as a Physiological Monitoring Tool for Seals under Anaesthesia

1
Sea Mammal Research Unit, Scottish Oceans Institute, University of St. Andrews, St. Andrews KY16 8LB, Fife, UK
2
School of Applied Sciences, Abertay University, Dundee DD1 1HG, UK
3
Department of Biomedical Engineering, Carnegie Mellon University, 5000 Forbes Avenue, Pittsburgh, PA 15213, USA
4
Neuroscience Institute, Carnegie Mellon University, 4400 Forbes Avenue, Pittsburgh, PA 15213, USA
*
Author to whom correspondence should be addressed.
Remote Sens. 2021, 13(18), 3553; https://doi.org/10.3390/rs13183553
Submission received: 5 July 2021 / Revised: 20 August 2021 / Accepted: 30 August 2021 / Published: 7 September 2021
(This article belongs to the Special Issue Near Infrared Spectroscopy in Animal Ecophysiology)

Abstract

:
Chemical immobilisation of pinnipeds is a routine procedure in research and veterinary practice. Yet, there are inevitable risks associated with chemical immobilisation, and the physiological response to anaesthetic agents in pinnipeds remains poorly understood. The current study used wearable continuous-wave near-infrared spectroscopy (NIRS) data from 10 trials of prolonged anaesthesia (0.5 to 1.4 h) induced through ketamine and midazolam in five grey seals (Halichoerus grypus) involved in other procedures. The aim of this study was to (1) analyse the effect of each compound on heart rate, arterial oxygen saturation (SpO2), and relative concentration changes in oxygenated [ΔO2Hb] and deoxygenated haemoglobin [ΔHHb] in cerebral tissue and (2) to investigate the use of NIRS as a real-time physiological monitoring tool during chemical immobilisation. Average group responses of ketamine (n = 27) and midazolam (n = 11) administrations were modelled using generalised additive mixed models (GAMM) for each dependent variable. Following ketamine and midazolam administration, [ΔHHb] increased and [ΔO2Hb] remained relatively stable, which was indicative of apnoea. Periods of apnoea were confirmed from respiratory band data, which were simultaneously collected during drugging trials. Given that SpO2 remained at 97% during apnoea, we hypothesized that increasing cerebral [ΔHHb] was a result of venous congestion as opposed to decreased oxygen delivery. Changes in heart rate were limited and appeared to be driven by the individual pharmacological actions of each drug. Future research could include simultaneous measures of metabolic rate, such as the relative change in concentration of cytochrome-c-oxidase, to guide operators in determining when apnoea should be considered prolonged if changes in [ΔHHb] and [ΔO2Hb] occur beyond the limits recorded in this study. Our findings support the use of NIRS as real-time physiological monitoring tool during pinniped chemical immobilisation, which could assist veterinarians and researchers in performing safe anaesthetic procedures.

Graphical Abstract

1. Introduction

Handling animals is essential for many applications in wildlife research. Over the past several decades, research into pinniped (seals, sea lions, fur seals, and walruses) behaviour and physiology has increased markedly, and many studies require wild and captive animals to be safely captured or handled. For example, the deployment of electronic animal-borne tags to study animal movements and dive behaviour has now become commonplace; between 1965 and 2013, tag data were used in 545 scientific papers which equates to the handling of several thousand wild pinnipeds around the world [1]. Similarly, a number of long term pinniped behaviour and life history studies have involved the repeated capture and sampling of several thousand individuals over their lifetimes (e.g., den Heyer and Bowen 2017 [1]). The increased usage of chemical immobilisation in pinnipeds requires an understanding of the pharmacology of anaesthetic agents in pinniped species and safe drugging procedures, which overcome potential challenges faced by anaesthetising these animals.
Pinnipeds are medium- to large-sized animals that are potentially dangerous and require expert handling in order to maximise welfare and safeguard both animals and handlers [2]. As such, sedation and anaesthesia are common practice in pinniped husbandry, medicine, and research [3]. Despite being relatively routine procedures for many species, there are elevated risks associated with anaesthesia and sedation for pinnipeds. For example, pinnipeds are episodic breathers and terminal apnoea is a potential risk during anaesthesia [4,5,6]. Previous work with anaesthetic agents have produced highly variable results, including mortalities, as chemical compounds and administration procedures were adapted to the idiosyncrasies of these species [3,7]. Nevertheless, efficient protocols for both gas and injection anaesthesia in pinnipeds do now exist [3,8,9,10,11]. Injectable anaesthetics can be administered intramuscularly or intravenously. There are many injectable anaesthetic drugs suitable for use in pinnipeds; these include combinations of a dissociative anaesthetic (e.g., ketamine and tiletamine) and a sedative (e.g., diazepam, midazolam, and zolazepam). Gas anaesthesia is typically used to maintain prolonged immobilisation or to achieve a surgical plane of anaesthesia in pinnipeds and common agents include halothane, sevoflurane, and isoflurane [3,9].
The appropriate anaesthetic procedure depends on the drugging scenario (e.g., conditions in the field vs. in captivity, the plane and duration of anaesthesia needed for a given experimental set-up or medical procedure, and the species being anaesthetised, etc.) [3,8,9]. Ketamine is widely used in veterinary practices for large animals and is the most common anaesthetic agent for pinnipeds [3,12]. It provides a rapid induction and recovery from anaesthesia with a wide margin of safety as it preserves respiratory and cardiac function at small doses [13]. Ketamine stimulates the sympathetic nervous system and cardiovascular system, causing the presentation of a dissociative state, which is characterised by a lack of responsive awareness. [12]. The most frequently reported adverse effect of ketamine on pinnipeds is muscular quivering and tremors [9,10,14]. As such, ketamine is now generally used in combination with sedatives providing muscle-relaxant properties such as midazolam [3,9,10].
Midazolam is a benzodiazepine, which is a class of drug that causes neural inhibition throughout the central nervous system [15,16]. While they are generally considered to have minimal effects on cardiovascular systems, benzodiazepines may decrease systemic vascular resistance, cause a moderate decline in arterial blood pressure, and increase heart rate [15]. In pinnipeds, benzodiazepines are generally used with a high margin of safety [3]. While ketamine was once frequently combined with diazepam, midazolam, which is more recently available, is now the preferred alternative for pinnipeds due to its high solubility and rapid onset of action [9].
Despite the wide margins of safety in current procedures for pinniped chemical immobilisation, results from previous studies have shown a high variability in individual response to routine anaesthetic agents [3,17,18]. Given the uncertainty in physiological responses to drugging, various antagonists have been used in an attempt to improve the safety of anaesthetic procedures for pinnipeds. Doxapram, yohimbine, flumazenil, and atipamezole are some examples of antagonists, which have been employed for emergency resuscitation or to decrease recovery times from pinniped anaesthesia [9,10].
Importantly, seals have an accentuated “dive response” upon submersion under water and the inhibition of respiration [19]. While all air-breathing vertebrates exhibit the dive response, diving marine mammals, including pinnipeds, have developed specialised anatomical and physiological adaptations to withstand longer periods of submersion at depth. Elephant seals, for example, can dive to depths beyond a kilometre [20] for as long as 2 h [21,22]. In pinnipeds, the dive response activates nervous system activity and is characterised by the rapid onset of pronounced bradycardia (i.e., reduction in heart rate) and peripheral arterial constriction [23]. The resulting decrease in cardiac output and increase in peripheral resistance causes a major redistribution of blood to high-priority tissues, especially the brain [24]. Major circulatory changes and extended periods of apnoea likely means that pinnipeds exhibit a unique set of responses under chemical immobilisation [3]. Further, previous research has provided evidence for some level of cognitive control of the dive response in California sea lions (Zalophus californianus) [25], harbour porpoises (Phocoena phocoena) [26], bottlenose dolphins (Tursiops truncatus) [27], and harbour seals (Phoca vitulina) [4,5]. For example, a study conducted by McKnight et al., 2019 applied wearable near-infrared spectroscopy (NIRS) technology to voluntarily diving harbour seals in order to investigate resulting haemodynamic changes in the blubber and brain [5]. Their results showed that circulatory changes of the dive response occurred in advance of submersion under water and surfacing. These findings [4,5,25,26,27] indicate that the assumed autonomic system of diving mammals is influenced by cognitive input.
The use of drugs, which impact cognitive performance, may therefore render the maintenance of physiological parameters vulnerable in pinnipeds, especially when these mechanisms of control are, in-part, cognitive as well as autonomic. As a result, safe chemical immobilisation procedures require careful real-time monitoring to prevent overdosage and to avoid the need for intubation during extended apnoea. In pinnipeds, the plane of anaesthesia is typically inferred through observation of basic responses and subtle body movements [9]. Current methods used to monitor physiological status during pinniped chemical immobilisation procedures include monitoring heart rate and respiratory rate, pulse oximetry and/or capnography for monitoring ventilation, mucous membrane colour to monitor oxygenation, and using rectal temperature probes to measure body temperature [9]. Although the appropriate maintenance of brain oxygenation is one of the most important factors for physiological homeostasis under anaesthesia, the brain is one of the least monitored organs during anaesthesia, even in humans [28]. This paucity of information is derived, in part by a lack of suitable technologies for making accurate real-time measurements of cerebral oxygenation. Wearable NIRS technology offers a potential research tool with which to study and monitor the physiological responses, including cerebral oxygenation, of pinniped species to chemical immobilisation.
NIRS is an optical imaging method that measures light absorbance through biologic tissues in the near-infrared spectral window (750–1000 nm) [29]. NIRS devices operate by emitting specific wavelengths of near-infrared light from a light-emitting optode, that correspond to the absorption spectra of cerebral chromophores: oxygenated haemoglobin, deoxygenated haemoglobin, and oxidised cytochrome-c-oxidase. The oxygenation status of these compounds determines the wavelengths of near-infrared light that they absorb. Scattered light, which is not absorbed by chromophores, is detected by photodiode receivers/optodes. The NIRS system then translates the loss of light intensity into measurements of relative change in concentration of the targeted chromophores. These measurements act as proxies for several other important physiological parameters, including cerebral blood perfusion, cerebral oxygenation, heart rate, breathing rate, proxies of blood pressure changes, oxygen consumption, and arterial oxygen saturation [29]. Considering the paucity of information on physiological responses of pinnipeds to anaesthesia, the application of this technology could elucidate the effects of anaesthetic agents on brain haemoglobin oxygenation in pinnipeds and could provide real-time physiological monitoring during chemical immobilisation procedures.
This study used existing continuous-wave, spatially resolved NIRS [30] data from ten trials of prolonged anaesthesia induced in five grey seals (Halichoerus grypus) due to their involvement in other experimental procedures. The injectable anaesthetic agents, ketamine and midazolam, were used to induce and maintain anaesthesia. NIRS measurements were taken from an array of optical sensors that were fitted to a customised neoprene cap placed on the head of each seal. The aims of this study were to (1) characterise the effect of each drug on heart rate, arterial oxygen saturation (SpO2), and cerebral haemoglobin oxygenation as measures of systemic changes to physiological homeostasis and (2) to investigate the use of NIRS as a real-time physiological monitoring tool during chemical immobilisation.

2. Materials and Methods

2.1. Ethics Statement

Procedures for capture, handling, and housing of animals conformed to the Animals (Scientific Procedures) Act 1986, under the Sea Mammal Research Units’ Home Office licence (#70/7806).

2.2. Experimental Methods

Five juvenile grey seals (1 female and 4 males) were captured in the Moray Firth, Scotland and were temporarily housed at the Sea Mammal Research Unit (SMRU) for a Natural Environment Research Council funded study on the impacts of pollutants on fat tissue function (see Supplementary Tables S1 and S2 for capture dates and morphometric data, respectively). The captured seals were taking part in a series of experiments; two of which provided the data used in the current study. One study involved measuring cerebral activation in response to a series of acoustic, visual, and tactile stimuli [31]. The other study involved measuring the relationship between tissue oxygenation, blubber depth, and fatness [32].

2.2.1. Drugging Procedure

All seals were fasted overnight (approximately 12–18 h) before the experimental and chemical immobilisation procedures. Prior to experimentation, seals were captured and handled in a pup bag to administer 4.0 mL of midazolam (Hypnovel, Roche Products Ltd., Welwyn Garden City, UK; 5 mg/mL solution) intramuscularly as a premedication sedative. They were left in isolation for 10 min for the sedative to take effect. Seals were then re-captured to administer 1 mg/kg ketamine (Ketamidor, Chanelle Pharma, Loughrea, UK; 100 mg/mL solution) intravenously to induce anaesthesia. A further ketamine dose was administered if excessive movements were apparent. Once individuals were observed under a suitable plane of anaesthesia, they were moved into an indoor lab for the experimental trials.
Intermittently, throughout the experimental trials 0.25–0.5 mL of Ketamidor doses were administered intravenously to maintain immobilisation and 1.0 mL of Hypnovel doses were administered intravenously to control muscle tremors. The number and frequency of doses that were given during each experimental trial was dependent on the seals’ individual responses to the drugs, with the exception of the initial intramuscular dose of midazolam, which was constant across all individuals. The drugging procedure utilised here is bespoke for prolonged anaesthesia in seals only. The drugging procedure, necessary for prolonged maintenance of an adequate plane of anaesthesia for the studies described in Section 2.2, has been developed to safely manage seals with a structured balance of an anaesthetic agent (ketamine) and a sedative (midazolam) across time.

2.2.2. Instrumentation

For each experimental trial, the seals were fitted with a customised neoprene cap containing an optode array that was connected to the near-infrared spectroscopy device (‘Brite24′ Artinis Medical Systems BV, Einsteinweg, The Netherlands), which was measuring changes in light intensity at a sampling frequency of 10 Hz. The customised head cap was developed using 3D photogrammetry software (Photomodeler Scanner 2016, Photomodeler Technologies, Vancouver, Canada) to create a computational model of a juvenile grey seal head [31]. Once completed, the head cap was fitted to the head of a freshly dead juvenile grey seal and 3D photogrammetry software was then used to create a model of the seal’s head that incorporated the optode/detector locations so that the cerebral locations of NIRS signals could be interpreted in analysis [31]. For further detail on neoprene cap design and attachment methods see McKnight et al., 2021 [31].
The optode/detector array consisted of 8 photodiode detectors and 16 LED dual-wavelength emitters. Each emitter provided two near-infrared light sources with wavelengths of 755–758 nm and 839–854 nm. The optode/detector array provided 28 channels, of which 20 had an optode-detector separation distance of around 30 mm (long channels), which were sensitive to the brain and superficial layers (scalp and skull). The remaining 8 channels had an optode-detector distance of around 10 mm (short channels) and were only sensitive to the superficial layers. Short channels are typically used to filter out signals from the superficial layers to isolate the cerebral haemodynamic response signals needed for functional NIRS analysis. An area of hair (10 mm diameter) was cut from each optode location using handheld clippers to prevent interference with NIRS signals during experimental trials.
Measured changes in light intensity were automatically converted to measurements of relative change in concentration of oxygenated [ΔO2Hb] and deoxygenated haemoglobin [ΔHHb] within the NIRS control software; Oxysoft (Version 3.2.51.2, Artinis Medical Systems BV, Einsteinweg, The Netherlands). Both [ΔO2Hb] and [ΔHHb] measurements were made using the modified Beer-Lambert law, which describes tissue optical absorption, assuming constant scattering [33,34]. For each experimental trial, individual respirations were also measured using a respiratory band (‘FLOW’, Sweetzpot, Oslo, Norway), which was secured around their chest. The respiratory band data were collected at a sampling frequency of 10 Hz.

2.2.3. Data Collection

Data used for analysis was gathered as part of two separate experiments. The first series of experiments (n = 10) were conducted in November of 2018 [31]. After initial drugging and instrument fitting, individual seals were exposed to visual, auditory, and tactile stimuli. Each seal underwent this experimental procedure twice. The second series of experiments (n = 5) were conducted in November and December of 2018 [32]. In each experimental trial, the customised neoprene head cap was used to measure [ΔO2Hb] and [ΔHHb] in the brain opportunistically while other physiological parameters were simultaneously measured. Each seal underwent this experimental procedure once.
These two studies resulted in 15 experimental trials using chemical immobilisation and NIRS to measure oxygenation changes in the brain. It was not possible to conduct control trials in which animals were not anaesthetised, given that instrument attachment required animals to remain motionless. For both experimental procedures, each trial was filmed using a mounted GoPro 4 White (Clearview Way, San Mateo, CA, USA) once individuals were moved to the indoor lab. Therefore, the initial intramuscular dose of midazolam was not recorded for any of the trials. Since the onset of action for both ketamine and midazolam occurs within seconds [13,15,35], times associated with each administration were recorded to the closest second. These were extracted from visually inspecting video footage and were inserted as labels within their respective experimental trials in Oxysoft. However, during five of the trials, the camera view around the timing of the administrations was intermittently obstructed by personnel; in those cases, the experimental trial was excluded from further analyses. Of the remaining 10 trials used for analysis, two midazolam and six ketamine administrations were not included in analysis for the same reason. Further, from the five seals included in experimentation, only four provided visible midazolam administrations, which were used in analysis. In total, 32 ketamine administrations (Marvin: 11, L’Hollie: 5, Haans: 3, Gruber: 6, Jones: 7) and 11 midazolam administrations (Marvin: 1, L’Hollie: 2, Gruber: 6, Jones: 2) were taken forward to data extraction.

2.3. Data Extraction

To measure the variation in brain oxygenation and its physiological drivers in response to drugging events, a series of post hoc modelling approaches were undertaken. [ΔO2Hb], [ΔHHb], heart rate, and SpO2 were extracted as dependent variables resulting in four separate responses to both ketamine and midazolam. The respiratory band data were additionally extracted to be included as an independent variable for model selection and to count the mean number of breaths throughout drugging trials. [ΔO2Hb] and [ΔHHb] were chosen for analysis to assess whether essential cerebral oxygenation and blood volume were maintained during chemical immobilisation. Heart rate and SpO2 were analysed as they are informative physiological parameters of systemic cardiorespiratory changes. Further, these two parameters are commonly monitored during pinniped anaesthesia and allow for comparison with other studies.

2.3.1. Extraction of Haemodynamic Variables ([ΔO2Hb] and [ΔHHb])

Drugging times were incorporated into Oxysoft and measurements of [ΔO2Hb] and [ΔHHb] (μ mol L−1) were extracted to Microsoft Excel (Version 16.43, Microsoft Corporation, Redmond, WA, USA) to construct data tables for modelling. For each ketamine and midazolam administration, 5 min pre-administration to 5 min post-administration of [ΔO2Hb] and [ΔHHb] measurements were extracted for one long channel in the left hemisphere of the brain and one long channel in the right hemisphere (Figure 1). The channels shown in Figure 1 were chosen as they represented the shallowest skin-cortical tissue paths. Given that the onset of action for both ketamine and midazolam occurs within 1 min of intravenous administration [13,15,35], the 10 min time frame was extracted to provide a buffer period within which physiological changes would be captured. For the purpose of this study, short channels receiving NIRS signals from superficial layers were not subtracted from long channels because we were analysing systemic level changes. Therefore, it was not necessary to eliminate systemic interference of the superficial layers, especially given that the magnitude of systemic changes is not significantly affected by contamination from extracerebral signals.
Once measurements were extracted, they were compiled into two data tables: one for all ketamine administrations and one for all midazolam administrations. A drug administration and its analysis time window is referred to as a ‘drugging trial’ for the purpose of this paper. For each drugging trial, the animal ID, side (left or right hemisphere), cumulative bolus volume of both midazolam and ketamine at time of administration (mL), bolus volume of either ketamine or midazolam at time of administration (mL), and time since initial drugging of ketamine or midazolam (s) were compiled as independent variables in the models.
Exploratory plots revealed that oxygenation responses were apparent up to 3 min post-administration and that 1 min pre-administration was sufficient time to provide a baseline to compare the response to. Therefore, the data were restricted to 60 s pre-administration and 180 s post-administration. All further analyses were conducted on this restricted dataset and for the purpose of this paper, time (s) as an independent variable with respect to modelling refers to the 60 s pre- to 180 s post-administration analysis window.
The exploratory plots were also used to identify potential outliers of concentration measurements that occurred outside the physiological limits of these animals. Since we analysed systemic changes in [ΔO2Hb] and [ΔHHb], physiological signals such as heart rate and breathing contributed to measured systemic changes [29]. Breathing, in particular, may induce marked changes in [ΔO2Hb] up to 20 µ mol L−1 within a frequency bandwidth of 0.2 to 0.6 Hz. If changes in [ΔO2Hb] and [ΔHHb] occurred at a greater magnitude, those signals were more likely a result of motion artefacts, such as cap re-adjustment, and were removed from analysis. Similarly, if outliers in [ΔO2Hb] did not present regular cardiac pulsations, they were more likely disrupted signals and were removed from analysis. For three ketamine drugging trials and four midazolam drugging trials, the analysis windows were therefore cut to less than 60 s pre-administration and 180 s post-administration. Another four ketamine drugging trials were completely removed from analysis under the same reasoning. Additionally, two ketamine drugging trials were administered 9 s in succession and therefore one of these trials was removed from analysis to prevent pseudoreplication (see Supplementary Table S3 for the distribution of the number of usable drugging trials across individual seals).
Measures of total haemoglobin ([ΔtHb] = [ΔO2Hb] + [ΔHHb]) and relative haemoglobin difference ([ΔHbdiff] = [ΔO2Hb] − [ΔHHb]) were also added to the data table for analysis. [ΔtHb] was used as a proxy for relative cerebral blood volume changes and [ΔHbdiff] was used as a measure of relative haemoglobin oxygenation changes. These parameters were added to the raw data plots (see Results) to quantify what the magnitudes of change in [ΔO2Hb] and [ΔHHb] mean for overall cerebral blood volume and oxygenation changes.

2.3.2. Extraction of Respiratory Data

The respiratory band data were included as independent variables in analysis to account for the associated systemic changes in haemoglobin concentration on cerebral oxygenation. Additionally, changes in intrathoracic pressure during respiration affect heart rate [36]. During inhalation, the decrease in intrathoracic pressure increases venous return stimulating atrial stretch receptors and causing increased heart rate (Bainbridge reflex). The converse occurs during exhalation (Reverse Bainbridge reflex).
To add respiratory band measurements as a variable for analysis, we needed to correct the drift in the respiratory band impedance measures. A generalised additive model (GAM) was created for each drugging trial of the respiratory band data in RStudio (Version 1.2.1335, RStudio PBC, Boston, MA, USA) using the “gam” function of the “mgcv” package (Version 1.8–31). The respiratory band data were fitted within each model and the residuals were subtracted to isolate the original values and reverse the effect of the drift over time. The corrected respiratory band data were then extracted and added to the corresponding time frame of each drugging trial.
The respiratory band data were further used to count the number of breaths in each drugging trial to assess whether our drugging methodology affected breathing patterns of the anaesthetised seals. Seals on land and during diving show a similar pattern of episodic breathing, characterised by infrequent periods of rapid deep breaths in between longer periods of apnoea. In captive freely diving grey seals, the average respiratory rate at the surface was 19 breaths min−1 occurring between average dive durations of around 4 min [37]. To derive breathing rates in our study, the raw and corrected respiratory band data were plotted for each drugging trial and the number of breaths were counted by the maxima (inspiration) or minima (expiration) of voltage magnitude changes that extended beyond the baseline voltage variability of the respiratory band. Additionally, [ΔO2Hb] for each channel of the optode/detector array was simultaneously plotted for each corresponding drugging trial to verify that the identified patterns of breathing were reflected in the NIRS measurements. The mean number of breaths were calculated in 30 s intervals of each drugging trial and were included in the Results independent of statistical modelling.

2.3.3. Heart Rate Extraction

The method for heart rate extraction used here is described in detail in [38]. In short, heart rate was extracted from NIRS measurements using the heart rate derivation algorithm presented in [39]. The first step of the algorithm is the pre-processing step in which systemic artefacts, motion artefacts, and other unrelated frequency components were removed from the NIRS signal through the use of a 100th order zero-phase bandpass FIR filter between 0.1 Hz and 4 Hz. In the second step, heart rate was extracted by applying the AMPD method [40] for the detection of peak points in the pre-processed signal. The final step of the derivation algorithm is the correction process in which a window method [39] was used to reduce errors in peak detection. Extracted heart rate data were added to the corresponding time scale for each drugging trial in beats per minute (BPM).

2.3.4. Arterial Oxygen Saturation (SpO2) Extraction

The SpO2 extraction process was performed in MATLAB (Version 9.9.0.1495850 [R2020b], The MathWorks Inc., Natick, MA, USA) based on methods used in Menssen et al., 2009 [41]. First, a highpass 3rd order zero-phase Butterworth filter with a cut-off frequency at 0.4 Hz was applied to the [ΔO2Hb] and [ΔHHb] measurements. The filtered [ΔO2Hb] and [ΔHHb] measurements were used to create frequency spectrograms showing heart rate variation across the analysis windows. To generate these spectrograms, fast Fourier transforms (FFTs) were calculated. The FFT window size was dependent on the variation in heart rate within each drugging trial (mean: 32 s, range: 16–40 s) and the FFT overlap was always 90%. The spectral power of [ΔO2Hb] and [ΔHHb] at the most prominent frequency component was extracted as this was identified as the heart rate at any given time point within the spectrogram. Using the extracted values of spectral power, SpO2 was calculated as SpO2 = [ΔO2Hbp] / ([ΔO2Hbp] + [ΔHHbp]) for each time point. Once extracted, SpO2 measurements and their respective time stamps were synchronised with the existing data frames containing the remaining variables for analysis.

2.4. Statistical Modelling

The average group response to ketamine and midazolam was modelled using generalised additive mixed models (GAMM) for each dependent variable: [ΔO2Hb], [ΔHHb], heart rate, and SpO2. GAMMs were chosen for analysis due to their flexibility in capturing non-linear changes in the physiological responses to drugging and for their ability to incorporate random effects, which account for individual variation. All data analyses were completed in RStudio (Version 1.2.1335) and the “gamm” function of the “mgcv” package (Version 1.8–31) was used to construct GAMMs.
Models for [ΔO2Hb], [ΔHHb], and heart rate were constructed using 27 trials of ketamine administration and 11 trials of midazolam administration. Haemodynamic signals were originally collected at a sampling frequency of 10 Hz to extract heart rate. However, ketamine and midazolam exert their pharmacological effects in a matter of seconds, meaning it was not necessary to analyse a sub-second response in [ΔHHb], [ΔO2Hb], and heart rate following drugging. To improve processing efficiency the dataset was reduced to a sampling frequency of 2 Hz for the [ΔO2Hb], [ΔHHb], and heart rate models. The reduction in sampling frequency was only completed following heart rate and SpO2 extraction for the purpose of statistical modelling.
The SpO2 extraction relied upon wider sampling windows to generate an SpO2 estimate, meaning SpO2 analysis was more sensitive to motion artefacts than the instantaneous measures of heart rate. Therefore, four ketamine drugging trials and two midazolam drugging trials were removed from SpO2 analysis during the extraction process because we were unable to identify reliable measurements of heart rate. The number of FFTs that were calculated (i.e., the frequency spectrogram window size and overlap) during SpO2 extraction limited the number of SpO2 measurements that were calculated and extracted. As such, the SpO2 dataset was not reduced further for statistical modelling.
The independent variables used in model selection are presented in Table 1. Time since initial drugging and bolus volumes were included to account for the magnitude of response based on how much of either compound was already present and how long the animal had been under anaesthesia. The bolus volumes for midazolam consisted of doses 5 mL, 6 mL, 7 mL, 8 mL, and 9 mL. When this variable was included as a smooth function the models would not run due to limited variation in the data. Therefore, midazolam bolus volume was included as a factor variable.
The cumulative bolus volume of ketamine and midazolam was used to account for the potential additive effect of the two drugs in combination. The effect of either drug on the other was not accounted for by the use of an interaction term because the aim of our study was not to disentangle the isolated effect of each drug but rather to characterise the response to a standardised drugging procedure.
The respiratory band data were included in [ΔO2Hb], [ΔHHb], and heart rate model selection to account for the effects of breathing on systemic changes in dependent variables. However, model selection for the response in SpO2 did not include the respiratory band data since the effects of breathing were accounted for and removed in the SpO2 extraction process.
The Side (left or right hemisphere) variable was included as a factor variable instead of an interaction term for [ΔO2Hb] and [ΔHHb] models, since the raw data showed a high degree of similarity between the haemodynamic signals of the two hemispheres. Despite this similarity, it was still included in model selection to avoid the assumption of a global haemodynamic response to drugging in the brain. The Side (left or right hemisphere) factor variable was not included in heart rate and SpO2 model selection, given that changes in heart rate and SpO2 are systemic and should not differ between the left and right hemispheres of the brain. The animal ID was included as a random effect for all models to account for individual variation.
Family selection included Gaussian, Gaussian with a log link, Gaussian with an identity link, gamma, gamma with a log link, tweedie, poisson, and quasipoisson families [42]. Dependent variables were transformed to positive values for families that require them (i.e., Gaussian with a log link). This transformation was completed by adding the magnitude of the minimum value for each dependent variable to their respective dataset. The family for each model was chosen based on inspection of normality and residual distribution in residual plots. Backward elimination model selection was conducted using Akaike Information Criterion (AIC) based on the protocol of the “mgcv” R package developer [42]. The model with the lowest AIC was chosen as the best fit model and model predictions were plotted. An example code for model selection of the [ΔHHb] response to ketamine is presented in the Supplementary Materials. Model selection for SpO2 did not include family selection. Since SpO2 is the percentage of [ΔO2Hb] in [ΔtHb], the binomial family was chosen for SpO2 response models based on its ability to model proportions. Using the binomial family, the same process of backward elimination model selection was conducted and model predictions were plotted. All response models were initially run without a specification of knots, which resulted in overfitting. Therefore, the number of knots was specified as k = 4 for all smooth terms within the haemodynamic, heart rate, and SpO2 response models for ketamine and midazolam to prevent overfitting.

3. Results

Responses to each drug were successfully measured for 27 extracted trials of ketamine administration and 11 trials of midazolam administration (see Supplementary Table S3 for the distribution of the number of drugging trials across individual seals). The neoprene head cap with integrated emitters and receivers of a NIRS system continuously measured [ΔHHb] and [ΔO2Hb] throughout experimentation. A suitable plane of anaesthesia was maintained throughout experimentation and all seals included in this study were left to emerge in a safe area and monitored to ensure smooth recovery following the experimental trials. Given that the drugging procedure required an initial midazolam and ketamine drugging to induce anaesthesia, neither drug was tested in isolation and within each drugging trial the animals were under the influence to varying degrees of both drugs (See Supplementary Figure S1 for raw measurements of four drugging trials administered in succession). Therefore, the 60 s pre-administration baseline within each drugging trial is not representative of a normal resting state and may differ between trials. Observed patterns in the raw data were reflected in the modelled data for [ΔHHb], [ΔO2Hb], heart rate, and SpO2.

3.1. Ketamine

3.1.1. Raw Data

[HHb] increased following ketamine administration (Figure 2A,B; pre-administration mean: −0.3 μ mol L−1 and range: −0.5 to 0.02 μ mol L−1, post-administration mean: 1.4 μ mol L−1 and range: −0.3 to 4.1 μ mol L−1), whereas [ΔO2Hb] decreased (Figure 2A,B; pre-administration mean: 0.9 μ mol L−1 and range: −0.7 to 2.9 μ mol L−1, post-administration mean: −1.9 μ mol L−1 and range: −4.3 to 1.8 μ mol L−1). [ΔtHb] was initially decreasing and then increased following ketamine administration (Figure 2A,B; pre-administration mean: 0.6 μ mol L−1 and range: −1.0 to 2.6 μ mol L−1, post-administration mean: −0.4 μ mol L−1 and range: −2.2 to 2.5 μ mol L−1). [ΔHbdiff] decreased following ketamine administration (Figure 2A,B; pre-administration mean: 1.1 μ mol L−1 and range: −0.7 to 3.2 μ mol L−1, post-administration mean: −3.3 μ mol L−1 and range: −8.2 to 1.5 μ mol L−1). The left and right hemispheres (Figure 2A,B) showed the same trends for the haemodynamic variables with marginal differences in exact values of measurements. Heart rate was variable throughout the analysed time frame, although heart rate variation decreased following ketamine administration (Figure 2C; pre-administration mean: 95.8 BPM and range: 72.4 to 117.9 BPM, post-administration mean: 78.3 BPM and range: 58.6 to 107.5 BPM). Additionally, heart rate generally decreased following ketamine administration. SpO2 remained high throughout the analysis window (Figure 2D; pre-administration mean: 97.8% and range: 94.4 to 99.4%, post-administration mean: 98.3% and range: 94.1 to 99.8%).

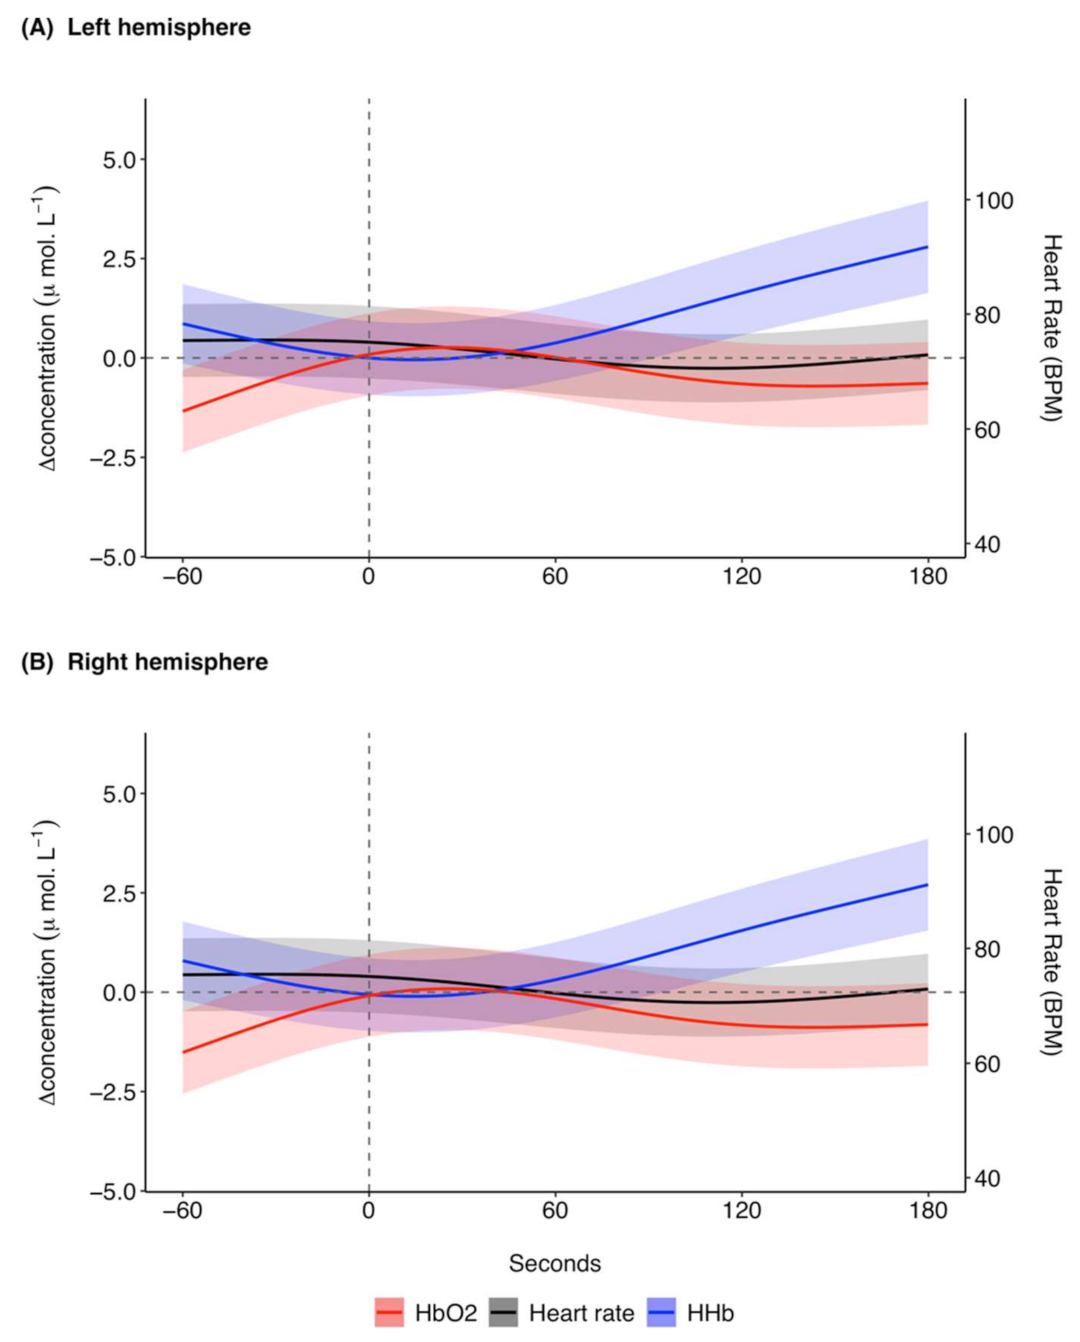
3.1.2. Model Results

The model prediction plot for the response to ketamine showed a decrease in [ΔHHb] prior to ketamine administration (Figure 3). [ΔHHb] continued to decrease until approximately 20 s, after which there was a marked increase in [ΔHHb] that continued until 180 s. The model prediction plot for the response in [ΔO2Hb] to ketamine showed an increase in [ΔO2Hb] prior to administration (Figure 3). This increase continued until approximately 30 s after ketamine administration. [ΔO2Hb] then decreased and became relatively constant at approximately 120 s with a negative [ΔO2Hb] of around −0.6 μ mol L−1. Overall, the response in [ΔO2Hb] occurred at a lower magnitude of change in comparison to [ΔHHb]. The left (Figure 3A) and right (Figure 3B) hemispheres showed the same trends for the haemodynamic variables with marginal differences in exact values of measurements.
The predicted mean heart rate was relatively stable at around 75 BPM before ketamine administration (Figure 3). Following ketamine administration, heart rate initially decreased until approximately 110 s, after which it increased until the end of the analysis window. The changes in heart rate were relatively small, with predicted mean values between 70.6 and 75.5 BPM. The model predictions for the responses in SpO2 to ketamine administration remained relatively stable with a range of 97.6 to 97.9% (Supplementary Figure S4).
The [ΔHHb] response to ketamine was modelled assuming errors with a Gaussian log link distribution. The model with the lowest AIC retained all variables except the respiratory band (Equation (1) in the Supplementary Materials, Supplementary Table S4). The response of [ΔO2Hb] to ketamine was modelled assuming errors with a Gaussian identity link distribution. For the [ΔO2Hb] model, all covariates were retained (Equation (2) in the Supplementary Materials, Supplementary Table S4). The response in heart rate to ketamine was modelled assuming errors with a Gaussian log link distribution. All covariates included in heart rate model selection were retained in the model with the lowest AIC (Equation (3) in the Supplementary Materials, Supplementary Table S4). The binomial family was used to model the response of SpO2 and the model with the lowest AIC retained all variables included in model selection except the time since initial drugging (Equation (4) in the Supplementary Materials, Supplementary Table S4). For model outputs of each response model see Supplementary Tables S5–S8.

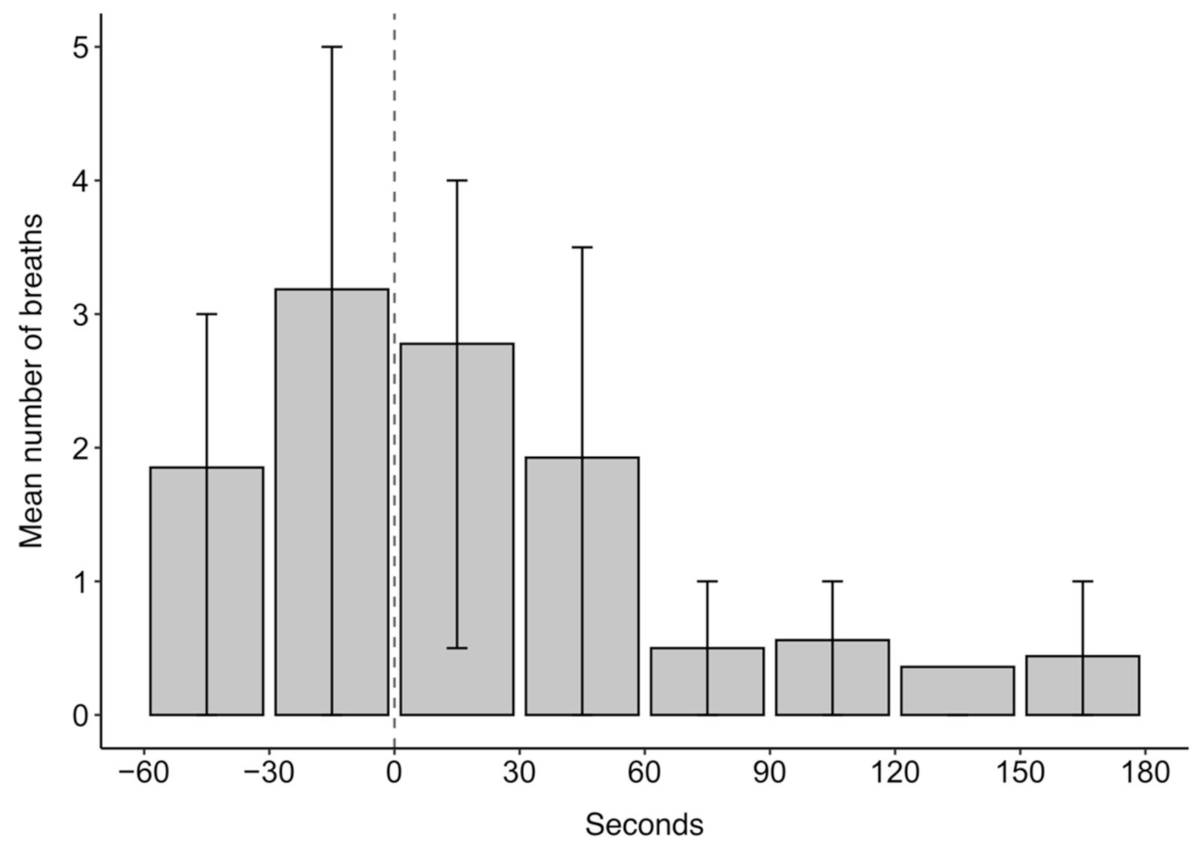
3.1.3. Breathing Rates

The mean number of breaths over the 4 min analysis window of ketamine drugging trials was 11.5. Breathing was episodic throughout the analysed drugging trials as evidenced in the quartile ranges for the mean number of breaths in 30 s intervals presented in Figure 4. In Figure 4, the highest mean number of breaths occurred within 30 s before ketamine administration, after which the number of breaths decreased. The episodic nature of breathing was characterised, in part, by periods of hyperventilation, which typically occurred before ketamine administration and within 60 s after administration.

3.2. Midazolam

3.2.1. Raw Data

Following midazolam administration [HHb] increased (Figure 5A,B; pre-administration mean: 0.2 μ mol L−1 and range: −0.8 to 2.7 μ mol L−1, post-administration mean: 1.8 μ mol L−1 and range: −0.01 to 3.9 μ mol L−1). [ΔO2Hb] initially showed a marginal decrease following midazolam administration and then increased towards the end of the analysis window (Figure 5A,B; pre-administration mean: 0.2 μ mol L−1 and range: −1.3 to 1.3 μ mol L−1, post-administration mean: −0.6 μ mol L−1 and range: −2.2 to 1.6 μ mol L−1). There was an overall increase in [ΔtHb] following midazolam administration (Figure 5A,B; pre-administration mean: 0.4 μ mol L−1 and range: −2.0 to 3.6 μ mol L−1, post-administration mean: 1.2 μ mol L−1 and range: −0.7 to 4.7 μ mol L−1) with a concomitant decrease in [ΔHbdiff] (Figure 5A,B; pre-administration mean: 0.04 μ mol L−1 and range: −1.8 to 1.1 μ mol L−1, post-administration mean: −2.5 μ mol L−1 and range: −5.1 to 0.2 μ mol L−1). The left and right hemispheres showed the same trends for the haemodynamic variables with marginal differences in exact values of measurements (Figure 5A,B). Heart rate was variable throughout the analysis window and showed a marginal decrease following midazolam administration (Figure 5C; pre-administration mean: 83.2 BPM and range: 58.0 to 111.0 BPM, post-administration mean: 71.5 BPM and range: 50.0 to 95.3 BPM). SpO2 remained high throughout the analysed time frame (Figure 5D; pre-administration mean: 98.5% and range: 94.3 to 99.6%, post-administration mean: 98.8% and range: 96.4 to 99.9%).

3.2.2. Model Results

The model predictions in response to midazolam showed that [ΔHHb] remained relatively stable at around 0.0 μ mol L−1 prior to midazolam administration (Figure 6). After administration there was a marked increase in [ΔHHb] until 140 s after which there was a plateau at around 2.6 μ mol L−1 until 180 s. There was a marginal decrease in [ΔO2Hb] from −60 to 80 s (Figure 6). After 80 s, [ΔO2Hb] increased until 180 s. As for the ketamine model predictions, the response in [ΔO2Hb] to midazolam occurred at a lower magnitude of change in comparison to [ΔHHb]. Further, the left (Figure 6A) and right (Figure 6B) hemispheres for the midazolam model predictions showed the same trends for the haemodynamic response variables with marginal differences in exact values of measurements.
The predicted mean heart rate showed a decrease from −60 to around 40 s, after which it increased for the remaining time frame of analysis (Figure 6). The changes in modelled heart rate were relatively small, ranging from 72.2 to 78.7 BPM. The 95% confidence intervals were larger for the midazolam model predictions (Figure 6) than for the ketamine model predictions (Figure 3) across the [ΔHHb], [ΔO2Hb], and heart rate models. As for the response to ketamine, the model predictions for the response in SpO2 to midazolam administration remained relatively stable from −60 to 180 s with a range of 97.5 to 97.9% (Supplementary Figure S7).
The [ΔHHb] response to midazolam was modelled assuming Gaussian log link distribution of errors. The model with the lowest AIC retained all dependent variables except for the time since initial drugging (Equation (1) in the Supplementary Materials, Supplementary Table S9). The [ΔO2Hb] response to midazolam was modelled assuming a Gaussian distribution of errors. All covariates except for the time since initial drugging were retained in the model with the lowest AIC (Equation (2) in the Supplementary Materials, Supplementary Table S9). The heart rate response to midazolam was modelled assuming a Gaussian log link distribution of errors. The model with the lowest AIC retained all of the covariates included in model selection for heart rate (Equation (3) in the Supplementary Materials, Supplementary Table S9). The binomial family was used to model the response of SpO2 and the model with the lowest AIC retained all variables included in model selection except midazolam bolus volume (Equation (4) in the Supplementary Materials, Supplementary Table S9). For model outputs of each response model see Supplementary Tables S10–S13 in the Supplementary Materials.

3.2.3. Breathing Rates

The mean number of breaths over the 4 min analysis window of midazolam drugging trials was 8.5. Breathing was generally sporadic throughout the midazolam drugging trials (Figure 7). There was a general decrease in the mean number of breaths during the analysis window, with an increase in the last 30 s interval. The mean number of breaths was generally lower for midazolam than for ketamine drugging trials, although midazolam drugging trials also showed bouts of hyperventilation. For midazolam drugging trials, the bouts of hyperventilation occurred within the 60 s before and 60 s after midazolam administration and 150 s after midazolam administration.

4. Discussion

Despite chemical immobilisation being a routine procedure in many animals, the physiological responses to anaesthetic and sedative agents in pinnipeds remains poorly understood [43]. To the best of our knowledge, this is the first study to use NIRS technology to monitor brain haemodynamics and oxygenation of pinnipeds during anaesthesia. Data were collected using a customised neoprene headcap with integrated emitters and receivers of a continuous-wave NIRS device that measured real-time changes in received light intensity. While the predicted mean haemodynamic changes in response to midazolam occurred at a smaller magnitude with greater variability, the haemodynamic response to both ketamine and midazolam showed an overall increase in [ΔHHb] and marginal decrease in [ΔO2Hb], which is indicative of apnoea. Further support for this response was seen in the decreasing mean number of breaths following the administration of both drugs. SpO2 remained high throughout all drugging trials, which suggests that cerebral oxygen delivery was maintained despite apnoea. Changes in heart rate appeared to be driven by the individual pharmacological actions of each drug since the response differed between ketamine and midazolam administration.
Given that the seals in our study recovered safely from all experimental trials, the recorded haemodynamic measurements provide limits within which grey seals did not experience hypoxic injury. Further work is needed to define values that could provide an early warning for when intervention is needed if changes in [ΔHHb] and [ΔO2Hb] occur beyond the limits recorded in this study. That may be particularly useful given that apnoea is a common side-effect of pinniped anaesthesia and mortalities have occurred following anaesthesia-induced periods of apnoea within the aerobic dive limit of a species (i.e., the time beyond which a diving mammal depends on anaerobic metabolism for the remainder of a dive) [44,45]. Further, pre-existing conditions, such as verminous pneumonia, have been linked to mortality following ketamine anaesthesia in pinnipeds [46]. If the clinical condition of the animal is unknown, NIRS could provide early warning signs of compromised cerebral oxygen supply and demand that would affect its ability to recover from the administration of certain anaesthetic agents.

4.1. NIRS as a Monitoring Tool during Anaesthesia

The continuous-wave NIRS system used here provided measurements of [ΔHHb] and [ΔO2Hb] in real-time and is therefore practical for monitoring of cerebral hemodynamic and oxygenation changes during anaesthesia. However, the SpO2 and heart rate measurements used in this study were extracted retrospectively from [ΔHHb] and [ΔO2Hb]. Further development work would therefore be required to monitor these parameters in real time. In theory, the filters used for SpO2 and heart rate extraction could be run in tandem with the NIRS analysis software, Oxysoft, to provide real-time measurements.
The benefits of using NIRS to monitor anaesthetic effects include its high temporal resolution, its ability to measure oxygenation changes in response to interventions, its ability to monitor cerebral and systemic physiological changes, and the relative ease at which the technology can be transported and fitted to animals [47]. These features support the use of NIRS as a real-time physiological monitoring tool in the field and in captive facilities. Further support for the use of NIRS as an anaesthetic monitoring tool comes from its ability to measure differences in haemodynamic and oxygenation changes between types of anaesthetic agents [48] and various concentrations of the same agent [49].
Despite its potential, there are some limitations associated with the use of NIRS technology. Confounding factors such as motion artefacts or improper contact between optical probes and the skin may interfere with the recorded signals. Several studies using NIRS during human anaesthesia have found that changes in head position affect the recorded haemodynamic measurements [50,51,52]. The use of NIRS as a monitoring tool during pinniped anaesthesia would require the initial administration of a sedative or anaesthetic agent, as used in our drugging methodology, to ensure the animal remains still during optode attachment. Additionally, operators should ensure that optodes remain properly attached following instances of movement.
Another consideration is that NIRS measures regional oxygenation changes in areas of optode attachment. While the data used for our study were taken from a 28 channel NIRS system, for processing efficiency the analysis was limited to data derived from a single channel in each hemisphere. Nonetheless, the analysed patterns of haemodynamic changes and the gross physiological signals were broadly similar between the two independent channels and visual inspection of the other channels showed similar trends. Further, the magnitude of change in response to regional activation is much lower than that of the systemic level changes analysed in this study. For this reason, the results from our study were likely not affected by the seals’ involvement in other experimentation during anaesthesia. The changes in response variables expected from those experiments were below 1 μ mol L−1 [31], whereas the systemic changes related to drugging events occurred at magnitudes up to 19 μ mol L−1. The monitoring of systemic level changes would inform operators of a global cerebral response, such as apnoea, which may compromise cerebral integrity and therefore it is not necessary to analyse regional cortical activation for physiological monitoring of pinnipeds under anaesthesia. The use of a single channel system within each hemisphere would improve the ease of attachment and interpretation of NIRS data for seals under anaesthesia, while still providing real-time cerebral monitoring of systemic changes. Alternatively, the use of three optode-detector separation distances, and therefore three channels in each hemisphere, could provide the additional measure of Tissue Saturation Index (TSI); an absolute measure of oxygenated haemoglobin.
Given that we analysed systemic level changes, extracerebral signals from short channels were not subtracted from deeper haemodynamic signals of the two long channels, which were chosen for analysis. While the channels chosen for analysis provided identifiable patterns of haemodynamic changes in response to drugging, these measurements were likely affected by some degree of extracerebral signal contamination and future work using short channel regression could help to refine cortical data received from potential monitoring NIRS systems [53].
Although we found a global cerebral response to drugging, the ‘Side (left or right hemisphere)’ factor variable was retained in both haemodynamic models for ketamine and midazolam. The magnitude of difference between the modelled measurements of the two hemispheres was less than the system noise of the NIRS device, which occurs even when the device is not used on living beings. Given that both the physiological makeup of living beings and the optode attachment on seals in our study are not perfectly symmetrical, it is unlikely that the hemispheres would provide the same signal, even in global systemic changes. However, there may still have been slight system or mechanical differences between the optodes of each side that were causing a consistent change in the values measured from the left and right hemispheres. The experiments used for this study represent the first time that a multichannel NIRS system has been used on a non-domesticated animal and if this system were to be developed in practice to monitor anaesthesia, the difference between the hemisphere measurements would need to be explored further.
Given the novel application of a multichannel NIRS system to measure cerebral haemodynamics and oxygenation in an animal, some assumptions were made about the optical properties of seal haemoglobin and cerebral tissue. The assumptions were based on those made by McKnight et al., 2019 [5] and were unlikely to affect the systemic level of changes analysed in our study. Further, if the optical properties did not adhere to our assumptions, only the magnitude of change would be affected, meaning patterns of relative changes in [ΔHHb] and [ΔO2Hb] would remain the same, thus not affecting any of the physiological parameters studied here.
If developed further, the use of NIRS may help researchers and veterinarians overcome some of the risks from chemical immobilisation in pinnipeds by providing early indicators of when an intervention may be needed. This could help advance surgical procedures requiring safe protocols for sedation or anaesthesia. The risks of heavy anaesthesia, in particular, are a prominent limitation in performing surgical procedures on marine mammals [54], meaning the use of a reliable anaesthetic monitoring tool would encourage the use of surgery as a suitable option for diagnostics and treatment in pinnipeds. Given that other marine mammal species face comparable anatomical challenges, the use of NIRS could be broadened to monitor cerebral integrity during anaesthesia for several marine mammal species that face risks of anaesthesia.

4.2. Physiological Responses to Drugging

The overall trends in haemodynamic measurements made here for ketamine and midazolam are representative of the cerebral response to apnoea. While drugging trials showed patterns of episodic breathing, the number of breaths generally decreased following drug administration for both ketamine and midazolam. Breathing patterns for ketamine drugging trials, in particular, were characterised by initial bouts of hyperventilation followed by prolonged periods of apnoea up to 3.5 min. When comparing the respiratory band and [ΔO2Hb] data of individual drugging trials it was evident that the observed increase in [ΔHHb] and decrease in [ΔO2Hb] frequently occurred at the onset of apnoea following re-oxygenation (see Supplementary Figure S8). Hyperventilation was likely to have been the result of the anaesthetic effects of previous drug doses wearing off as moving around and contacting the animals was kept to a minimum.
Drugging trials were also characterised by a high SpO2, around 97%, and increasing [ΔtHb], which suggests that arterial blood oxygen delivery to the brain was maintained despite drug-induced periods of apnoea. The concomitant increase in [ΔHHb] could be explained by increased metabolic rate causing the rate of oxygen consumption to exceed the rate of oxygen delivery to the brain. However, it remains unlikely that metabolic rate influenced the increase in [ΔHHb], given the magnitude of response observed in this study. Further, neuronal activation typically causes arterial vasodilation and a surge in oxygen supply, which exceeds the demand, meaning [ΔO2Hb] would also be increasing under this haemodynamic epiphenomenon [47].
We suggest that increasing [ΔHHb] was more likely a result of venous congestion during apnoea. Similar haemodynamic changes representative of venous congestion have been observed in harbour seals in anticipation of diving [5]. When increased arterial delivery is paired with increased venous drainage, cerebral oxygenation increases [5]. However, under venous congestion, arterial delivery of oxygenated blood is not matched with increased venous drainage, causing the relative contribution of [ΔHHb] and [ΔtHb] to increase while cerebral oxygenation decreases [55,56]. Given that [ΔO2Hb] remained relatively stable, the increases in [ΔtHb] observed in our raw data (Figure 2 and Figure 5) were likely a function of increasing [ΔHHb], for ketamine and midazolam druggings. In addition, the periods of hyperventilation primarily observed at the beginning of drugging trials and the high SpO2 suggests that seals were well oxygenated at the onset of apnoea, despite increasing [ΔHHb].
Venous congestion may be a result of a mechanical blockage in drainage vessels or increased central venous pressure [57,58,59,60]. The periods of hyperventilation observed in our results were typically characterised by an initial exhalation followed by inhalation, suggesting that the seals’ lungs were filled throughout periods of apnoea (Supplementary Figure S8) [31]. Therefore, we propose that venous congestion was a result of increased central venous pressure induced by maintaining positive pressure in the lungs. The same mechanisms occur in the Valsalva Manoeuvre, which is associated with the breathing mechanics of phocid seals. In the Valsalva Manoeuvre, exhalation is attempted against a closed airway and the preceding inspiratory gasp causes increased intrathoracic pressure. As a result, central venous pressure increases, causing decreased cerebral venous outflow and a concomitant increase in intracranial pressure [61,62].
In our drugging trials, the seals’ maintenance of high SpO2 suggests that venous congestion did not affect cerebral oxygen delivery during apnoea. However, if anaesthetised seals undergo reduced cerebral oxygenation over longer periods of apnoea than seen in our study, it is possible that they could risk facing cerebral metabolic dysfunction or elevated intracranial pressure. Future research should make simultaneous measurements of cerebral metabolism to investigate whether venous congestion could limit the amount of [ΔO2Hb] available for cerebral metabolism with broadband NIRS measures of change in concentration of oxidised cytochrome-c-oxidase ([ΔCCO]) [63]. The additional measure of [ΔCCO] could guide researchers in determining when apnoea should be considered prolonged if changes in [ΔHHb] and [ΔO2Hb] occur beyond the limits recorded in this study.
The response in heart rate to ketamine administration in this study supports ketamine-induced changes in arterial blood pressure recorded in previous studies conducted on dogs [64] and sheep [65]. The initial decrease in heart rate could be attributed to a direct depressant effect of ketamine on the myocardium, which was observed in isolated rabbit [64] and guinea pig hearts [66]. The subsequent increase in heart rate may then have been the result of central nervous system activation, which overrides the peripherally mediated depressant effects at lower doses [65]. Support for the centrally mediated cardiovascular stimulatory effects of ketamine comes from that fact that they can be attenuated by central nervous system depressants such as benzodiazepines [67]. The model predictions for midazolam showed a decrease in heart rate pre-administration, which persisted until approximately 40 s at which point heart rate increased. The point at which heart rate increased likely represents midazolam’s onset of action. Midazolam has a rapid onset of action of 30 to 60 s when administered intravenously [15]. The increase in heart rate is typically a result of the decrease in systemic vascular resistance caused by midazolam [15]. Simultaneous measures of blood pressure changes throughout chemical immobilisation could provide further support for these conclusions on the pharmacological actions of each drug.
For both ketamine and midazolam, the raw heart rate data were variable, which is typical of seals. However, the predicted mean heart rate for both drugs remained between 69 and 79 BPM throughout the analysis windows. Since we did not have measurements of resting heart rate before chemical immobilisation, we can compare our measurements of heart rate to that of unanaesthetised elephant seals, which experience similar changes in heart rate to grey seals during apnoea on land and whilst diving [68,69]. In juvenile northern elephant seals the mean apnoeic and eupnoeic heart rates are 45 and 65 BPM, respectively, during periods of quiet wakefulness or sleep on land [68]. Assuming grey seals in our study experienced a similar range in heart rate before drugging, chemical immobilisation caused a moderate increase in heart rate, which suggests that ketamine exerted some stimulatory effects on the cardiovascular system during anaesthesia. In another study, in which ketamine was used as the sole immobilising agent, northern elephant seals experienced a mean increase of 13 BPM in heart rate following immobilisation [14]. Given the range in heart rate experienced following ketamine and midazolam administrations in our study, it is unlikely that our levels of midazolam dosage significantly dampened the cardiostimulatory effects of ketamine.

4.3. Additional Modelling Interpretations

In this study, GAMM models were used to create predictions for the response of the dependent variables to ketamine or midazolam. The mass of individual seals on the date of experimentation was not included in statistical modelling because intravenous drug doses were administered based on individual response as opposed to mass. Additionally, differences in mass would only affect the magnitude of systemic changes and duration of recovery [70,71,72]. The model for the response of [ΔO2Hb] to ketamine retained all covariates whereas the model for [ΔHHb] did not retain the respiratory band data. This is likely due to the influence of breath-holding on blood oxygen levels. For midazolam [ΔHHb] and [ΔO2Hb] model selection, the ‘time since initial drugging’ covariate was not retained. Midazolam is a short-acting benzodiazepine and therefore does not accumulate after repeated doses [73]. The time since initial drugging may therefore not have been a significant factor in predicting the response to midazolam because the effects of the initial intramuscular dose subsided before the first intravenous dose of midazolam was administered. In contrast, the ‘midazolam bolus volume’ covariate was retained in all midazolam models. This could have been the result of accumulated ketamine doses altering the magnitude of response to midazolam.
The model predictions for responses in [ΔHHb], [ΔO2Hb], and heart rate to midazolam had greater variability than for ketamine, as seen in the 95% confidence intervals of Figure 6. This could be attributed to the lower sample size of midazolam and the varying levels of potency in ketamine between midazolam drugging trials. Since ketamine was administered more frequently than midazolam, we expected the trends in response to ketamine to be reflected in the response to midazolam. In addition, since midazolam was used to limit the physiological impacts of ketamine, we expected to see relatively smaller magnitudes of change in response to midazolam. Indeed, the [ΔO2Hb] and [ΔHHb] model predictions for midazolam could be suggestive of a dampened response to ketamine. Despite ketamine and midazolam’s opposing mechanisms of actions, which typically result in opposite physiological responses as observed in humans [13,15], our study showed a similar trend in [ΔO2Hb] and [ΔHHb] in response to both drugs, as a result of apnoea, which causes a global cerebral response. On the contrary, the trend in heart rate was different following the administration of ketamine and midazolam, which suggests that heart rate was driven by the individual mechanisms of action of each drug.

5. Conclusions

An understanding of the pharmacology of anaesthetic agents and real-time physiological monitoring is essential to ensure safe chemical immobilisation procedures. The purpose of the current study was to investigate the effect of ketamine and midazolam on heart rate, arterial oxygen saturation (SpO2), and cerebral haemoglobin oxygenation of grey seals using near-infrared spectroscopy (NIRS) and to establish whether NIRS could provide real time, non-invasive physiological monitoring during chemical immobilisation. The haemodynamic findings from this study showed that the onset of apnoea dominated the cerebral response to drugging. Given that SpO2 remained high, we hypothesised that cerebral deoxygenation in response to ketamine and midazolam druggings was a result of venous congestion. Given the safe induction and recovery from anaesthesia, the haemodynamic changes observed in the current study represent limits within which seals recovered safely and experienced no adverse side effects. Beyond these limits, measures of oxygen delivery would need to be supported with measures of utilisation to assess whether there is a threat of metabolic dysfunction. In conclusion, the findings from this study support the use of NIRS technology as basis for a tool to study the physiological effects of anaesthetic agents and to monitor the cerebral response during chemical immobilisation of pinnipeds These insights may be of assistance to veterinarians and researchers that require safe chemical immobilisation procedures.

Supplementary Materials

The following are available online at https://www.mdpi.com/article/10.3390/rs13183553/s1, Table S1: The capture dates of the individual seals included in the experimental trials, Table S2: Mass (kg), girth (cm), and length (cm) of individual seals on the dates of the experimental procedures, Table S3: The number of drugging trials for each individual seal that were used in analysis for the effects of ketamine and midazolam, Example model selection code, Figure S1: Example of cerebral haemodynamics and global systemic changes for a series of ketamine and midazolam druggings administered in succession, Figure S2: Cerebral haemodynamics of (A) [ΔHHb] (μ mol L−1) and (B) [ΔO2Hb] (μ mol L−1), (C) heart rate (BPM), (D) relative cerebral blood volume changes [ΔtHb] (μ mol L−1), and (E) relative haemoglobin oxygenation changes [ΔHbdiff] (μ mol L−1) for 60 s before and 180 s after ketamine administration at time 0 s for n=27 trials across five grey seals, Figure S3: The SpO2 (%) for 60 s before and 180 s after ketamine administration at time 0 s for n = 23 trials across five grey seals, Figure S4: GAMM model prediction outcomes for SpO2 (%) 60 s before and 180 s after ketamine administration at time 0 s for n=23 trials across five grey seals, Table S4: GAMM equations for [ΔHHb] (μ mol L−1), [ΔO2Hb] (μ mol L−1), heart rate (BPM), and SpO2 (proportion of [ΔO2Hb] to [tHb]) for 60 s before and 180 s after ketamine administration at time 0 s for n number of trials across five grey seals, Table S5: The estimates and standard error for coefficients of a GAMM of the response in [ΔHHb] (μ mol L−1) to ketamine injection (n = 27) across five grey seals (Equation (1), Table S4), Table S6: The estimates and standard error for coefficients of a GAMM of the response in [ΔO2Hb] (μ mol L−1) to ketamine injection (n = 27) across five grey seals (Equation (2), Table S4), Table S7: The estimates and standard error for coefficients of a GAMM of the response in heart rate (BPM) to ketamine injection (n = 27) across five grey seals (Equation (3), Table S4), Table S8: The estimates and standard error for coefficients of a GAMM of the response in SpO2 (proportion of [ΔO2Hb] to [tHb]) to ketamine injection (n = 23) across five grey seals (Equation (4), Table S4), Figure S5: Cerebral haemodynamics of (A) [ΔHHb] (μ mol L−1) and (B) [ΔO2Hb] (μ mol L−1), (C) heart rate (BPM), (D) relative cerebral blood volume changes [ΔtHb] (μ mol L−1), and (E) relative haemoglobin oxygenation changes [ΔHbdiff] (μ mol L−1) for 60 s before and 180 s after midazolam administration at time 0 s for n=11 trials across four grey seals, Figure S6: The SpO2 (%) for 60 s before and 180 s after midazolam administration at time 0 s for n = 9 trials across four seals, Figure S7: GAMM model prediction outcomes for SpO2 (%) 60 s before and 180 s after midazolam administration at time 0 s for n=9 trials across four grey seals, Table S9: GAMM equations for [HHb] (μ mol L−1), [ΔO2Hb] (μ mol L−1), heart rate (BPM), and SpO2 (proportion of [ΔO2Hb] to [tHb]) for 60 s before and 180 s after midazolam administration at time 0 s for n number of trials across four grey seals, Table S10: The estimates and standard error for coefficients of a GAMM of the response in [ΔHHb] (μ mol L−1) to midazolam injection (n = 11) across four grey seals (Equation (1), Table S9), Table S11: The estimates and standard error for coefficients of a GAMM of the response in [ΔO2Hb] (μ mol L−1) to midazolam injection (n = 11) across four grey seals (Equation (2), Table S9), Table S12: The estimates and standard error for coefficients of a GAMM of the response in heart rate (BPM) to midazolam injection (n = 11) across four grey seals (Equation (3), Table S9), Table S13: The estimates and standard error for coefficients of a GAMM of the response in SpO2 (proportion of [ΔO2Hb] to [tHb]) to midazolam injection (n = 9) across four grey seals (Equation (4), Table S9), Figure S8: (A) The corrected respiratory band measurements (mV) for an experimental trial with multiple intravenous administrations of ketamine and midazolam and (B) the corrected respiratory band measurements (mV) and (C) haemodynamic measurements (μ mol L−1) of a single ketamine drugging trial.

Author Contributions

Conceptualization, J.C.M., E.-M.S.B. and G.D.H.; methodology, J.C.M., G.D.H. and E.-M.S.B.; software, A.R., J.M.K. and J.W.; validation, E.-M.S.B., J.C.M. and G.D.H.; formal analysis, E.-M.S.B.; investigation, E.-M.S.B., J.C.M., G.D.H., S.E.W.M. and R.M.; resources, K.A.B., A.R., J.M.K., J.W., R.M. and S.E.W.M.; data curation, E.-M.S.B.; writing—original draft preparation, E.-M.S.B.; writing—review and editing, J.C.M., G.D.H., K.A.B., A.R., S.E.W.M., R.M., J.M.K. and J.W.; visualization, E.-M.S.B.; supervision, E.-M.S.B.; project administration, E.-M.S.B.; funding acquisition, J.C.M., G.D.H. and K.A.B. All authors have read and agreed to the published version of the manuscript.

Funding

This research was funded as part of the Department for Business, Energy and Industrial Strategy Offshore Energy Strategic Environmental Assessment Programme. National Capability funding was provided by the Natural Environment Research Council to the Sea Mammal Research Unit grant number: NE/R015007/1. Supplementary funding supporting K.A.B. was provided by the Natural Environment Research Council grant numbers: NE/M013723/1 and NE/M01357X/1.

Institutional Review Board Statement

Not applicable.

Informed Consent Statement

The study was conducted according to the guidelines of the Declaration of Helsinki, and carried out under the Animals in Scientific Procedures Act (licence 70/7806: 20/12/2013), with local licence approval from the University of St. Andrews Animal Welfare and Ethics Committee.

Data Availability Statement

The data presented in this study are available in the Supplementary Materials.

Acknowledgments

We thank Artinis Medical Systems BV (Einsteinweg, The Netherlands) for providing the near-infrared spectroscopy (NIRS) technology used during experimentation and Mathijs Bronkhorst for providing assistance with the use of Oxysoft, the Artinis Medical Systems BV NIRS control software. We thank Steve Balfour for creating the 3D model of a seal head used to make the neoprene head cap. We thank Laura Oller Lopez for allowing us to collect NIRS data used in this analysis during her experiments.

Conflicts of Interest

The authors declare no conflict of interest. The funders had no role in the design of the study; in the collection, analyses, or interpretation of data; in the writing of the manuscript, or in the decision to publish the results.

References

  1. McIntyre, T. Trends in tagging of marine mammals: A review of marine mammal biologging studies. Afr. J. Mar. Sci. 2014, 36, 409–422. [Google Scholar] [CrossRef] [Green Version]
  2. Dierauf, L.A.; Gulland, F.M.D. (Eds.) CRC Handbook of Marine Mammal Medicine: Health, Disease, and Rehabilitation, 2nd ed.; CRC Press: Danvers, MA, USA, 2001. [Google Scholar]
  3. Gales, N.J. Chemical restraint and anesthesia of pinnipeds: A review. Mar. Mammal Sci. 1989, 5, 228–256. [Google Scholar] [CrossRef]
  4. Jones, D.R.; Fisher, H.D.; McTaggart, S.; West, N.H. Heart rate during breath-holding and diving in the unrestrained harbor seal (Phoca vitulina richardi). Can. J. Zool. 1973, 51, 671–680. [Google Scholar] [CrossRef]
  5. McKnight, J.C.; Bennett, K.A.; Bronkhorst, M.; Russell, D.J.F.; Balfour, S.; Milne, R.; Bivins, M.; Moss, S.E.W.; Colier, W.; Hall, A.J.; et al. Shining new light on mammalian diving physiology using wearable near-infrared spectroscopy. PLoS Biol. 2019, 17, e3000306. [Google Scholar] [CrossRef]
  6. Ridgway, S.H.; Harrison, R.J.; Joyce, P.L. Sleep and cardiac rhythm in the gray seal. Science 1975, 187, 553–555. [Google Scholar] [CrossRef]
  7. Gales, N.; Hindell, M.; Kirkwood, R. (Eds.) Marine Mammals: Fisheries, Tourism and Management Issues; CSIRO Publishing: Collingwood, VIC, Australia, 2003. [Google Scholar]
  8. Brunson, D.B. Comparative anesthesia and analgesia of aquatic mammals. In Veterinary Anaesthesia and Analgesia; Grimm, K.A., Lamont, L.A., Tranquili, W.J., Greene, S.A., Robertson, S.A., Eds.; John Wiley & Sons: Ames, IA, USA, 2015; pp. 777–783. [Google Scholar]
  9. Lynch, M.; Bodley, K. Phocid seals. In Immobilization and Anesthesia Zoo Animal & Wildlife; West, G., Heard, D., Caulkett, N., Eds.; Blackwell Publishing: Ames, IA, USA, 2007; pp. 459–468. [Google Scholar]
  10. Lynch, M.J.; Thamindjis, M.A.; Gardner, H. Immobilisation of pinniped species. Aust. Vet. J. 1999, 77, 181–185. [Google Scholar] [CrossRef] [PubMed]
  11. Baylis, A.M.M.; Page, B.; Staniland, I.; Arnould, J.P.Y.; McKenzie, J. Taking the sting out of darting: Risks, restraint drugs and procedures for the chemical restraint of Southern Hemisphere otariids. Mar. Mammal Sci. 2015, 31, 322–344. [Google Scholar] [CrossRef]
  12. Wolff, K.; Winstock, A.R. Ketamine: From medicine to misuse. CNS Drugs 2006, 20, 199–218. [Google Scholar] [CrossRef]
  13. Sinner, B.; Graf, B.M. Ketamine. In Handbook of Experimental Pharmacology: Modern Anesthetics; Schüttler, J., Schwilden, H., Eds.; Springer: Berlin/Heidelberg, Germay, 2008; Volume 182, pp. 313–335. [Google Scholar]
  14. Briggs, G.D.; Henrickson, R.V.; Burney, D.V.M.; Le Boeuf, J. Ketamine immobilization of northern elephant seals. J. Am. Vet. Med. Assoc. 1975, 167, 546–548. [Google Scholar]
  15. Olkkola, K.T.; Ahonen, J. Midazolam and other benzodiazepines. In Handbook of Experimental Pharmacology: Modern Anesthetics; Schüttler, J., Schwilden, H., Eds.; Springer: Heidelberg, Germany, 2008; Volume 182, pp. 335–360. [Google Scholar] [CrossRef]
  16. Saldman, L.J. Midazolam: Pharmacology and uses. Anesthesiology 1985, 62, 310–324. [Google Scholar]
  17. Parry, K.; Anderson, S.S.; Fedak, M.A. Chemical immobilization of gray seals. J. Wildl. Manag. 1981, 45, 986–990. [Google Scholar] [CrossRef]
  18. Dabin, W.; Beauplet, G.; Guinet, C. Response of wild subantarctic fur seal (Arctocephalus tropicalis) females to ketamine and tiletamine-zolazepam anesthesia. J. Wildl. Dis. 2002, 38, 846–850. [Google Scholar] [CrossRef] [PubMed] [Green Version]
  19. Kaczmarek, J.; Reichmuth, C.; McDonald, B.I.; Kristensen, J.H.; Larson, J.; Johansson, F.; Sullivan, J.L.; Madsen, P.T. Drivers of the dive response in pinnipeds; apnea, submergence or temperature? J. Exp. Biol. 2018, 221. [Google Scholar] [CrossRef] [PubMed] [Green Version]
  20. McIntyre, T.; de Bruyn, P.J.N.; Ansorge, I.J.; Bester, M.N.; Bornemann, H.; Plötz, J.; Tosh, C.A. A lifetime at depth: Vertical distribution of southern elephant seals in the water column. Polar Biol. 2010, 33, 1037–1048. [Google Scholar] [CrossRef]
  21. Hindell, M.A.; Slip, D.J.; Burton, H.R. The diving behaviour of adult male and female southern elephant seals, Mirounga leonina (Pinnipedia, Phocidae). Aust. J. Zool. 1991, 39, 595–619. [Google Scholar] [CrossRef]
  22. Hindell, M.A.; Slip, D.J.; Burton, H.R.; Bryden, M.M. Physiological implications of continuous, prolonged, and deep dives of the southern elephant seal (Mirounga leonina). Can. J. Zool. 1992, 70, 370–379. [Google Scholar] [CrossRef]
  23. Schytte Blix, A. Adaptations to deep and prolonged diving in phocid seals. J. Exp. Biol. 2018, 221. [Google Scholar] [CrossRef] [Green Version]
  24. Blix, A.S.; Elsner, R.; Kjekhus, J.K. Cardiac output and its distribution through capillaries and A-V shunts in diving seals. Acta Physiol. Scand. 1983, 118, 109–116. [Google Scholar] [CrossRef]
  25. Ridgway, S.H.; Carder, D.A.; Clark, W. Conditioned bradycardia in the sea lion Zalophus californianus. Nature 1975, 256, 37–38. [Google Scholar] [CrossRef]
  26. Elmegaard, S.L.; Johnson, M.; Madsen, P.T.; McDonald, B.I. Cognitive control of heart rate in diving harbor porpoises. Curr. Biol. 2016, 26, 1175–1176. [Google Scholar] [CrossRef] [Green Version]
  27. Fahlman, A.; Cozzi, B.; Manley, M.; Jabas, S.; Malik, M.; Blawas, A.; Janik, V.M. Conditioned variation in heart rate during static breath-holds in the bottlenose dolphin (Tursiops truncatus). Front. Physiol. 2020, 11, 1509. [Google Scholar] [CrossRef]
  28. Murkin, J.M.; Arango, M. Near-infrared spectroscopy as an index of brain and tissue oxygenation. Br. J. Anaesth. 2009, 103, 3–13. [Google Scholar] [CrossRef] [Green Version]
  29. Fantini, S.; Ruesch, A.; Kainerstorfer, J.M. Noninvasive optical studies of the brain: Contributions from systemic physiology. In Neurophotonics and Biomedical Spectroscopy; Alfano, R.R., Shi, L., Eds.; Elsevier: Amsterdam, The Netherlands, 2019; pp. 25–52. [Google Scholar]
  30. Suzuki, S.; Takasaki, S.; Ozaki, T.; Kobayashi, Y. A tissue oxygenation monitor using NIR spatially resolved spectroscopy. In SPIE, Optical Tomography and Spectroscopy of Tissue III; SPIE: Bellingham, WA, USA, 1999; Volume 3597, pp. 582–592. [Google Scholar] [CrossRef]
  31. McKnight, J.C.; Ruesch, A.; Bennett, K.; Bronkhorst, M.; Balfour, S.; Moss, S.E.W.; Milne, R.; Tyack, P.L.; Kainerstorfer, J.M.; Hastie, G.D. Shining new light on sensory brain activation and physiological measurement in seals using wearable optical technology. Philos. Trans. R. Soc. B 2021, 376, 20200224. [Google Scholar] [CrossRef]
  32. Oller, L.; Bennett, K.A.; McKnight, J.C.; Moss, E.W.; Milne, R.; Hall, A.J.; Rocha, J. Partial pressure of oxygen in adipose tissue and its relationship with fatness in a natural animal model of extreme fat deposition, the grey seal. Physiol. Rep. 2021, 9, e14972. [Google Scholar] [CrossRef]
  33. Reynolds, E.O.R.; Wyatt, J.S.; Azzopardi, D.; Delpy, D.T.; Cady, E.B.; Cope, M.; Wray, S. New non-invasive methods for assessing brain oxygenation and haemodynamics. Br. Med. Bull. 1988, 44, 1052–1075. [Google Scholar] [CrossRef] [Green Version]
  34. Delpy, D.T.; Cope, M.; van der Zee, P.; Arridge, S.; Wray, S.; Wyatt, J. Estimation of optical pathlength through tissue from direct time of flight measurement. Phys. Med. Biol. 1988, 33, 1433–1442. [Google Scholar] [CrossRef] [PubMed] [Green Version]
  35. Green, S.M.; Roback, M.G.; Kennedy, R.M.; Krauss, B. Clinical practice guideline for emergency department ketamine dissociative sedation: 2011 update. Ann. Emerg. Med. 2011, 57, 449–461. [Google Scholar] [CrossRef] [PubMed]
  36. Laude, D.; Goldman, M.; Escourrou, P.; Elghozi, J.-L. Effect of breathing pattern on blood pressure and heart rate oscillations in humans. Clin. Exp. Pharmacol. Physiol. 1993, 20, 619–626. [Google Scholar] [CrossRef]
  37. Reed, J.Z.; Chambers, C.; Fedak, M.A.; Butler, P.J. Gas exchange of captive freely diving grey seals (Halichoerus grypus). J. Exp. Biol. 1994, 191, 1–18. [Google Scholar] [CrossRef] [PubMed]
  38. McKnight, J.C.; Mulder, E.; Ruesch, A.; Kairnerstorfer, J.; Wu, J.; Hakimi, N.; Balfour, S.; Bronkhorst, M.; Horschig, J.M.; Pernett, F.; et al. When the human brain goes diving: Using near-infrared spectroscopy to measure cerebral and systemic cardiovascular responses to deep, breath-hold diving in elite freedivers. Philos. Trans. R. Soc. B 2021, 376, 20200349. [Google Scholar] [CrossRef]
  39. Hakimi, N.; Setarehdan, S.K. Stress assessment by means of heart rate derived from functional near- infrared spectroscopy. J. Biomed. Opt. 2018, 23, 1–12. [Google Scholar] [CrossRef] [Green Version]
  40. Scholkmann, F.; Boss, J.; Wolf, M. An efficient algorithm for automatic peak detection in noisy periodic and quasi-periodic signals. Algorithms 2012, 5, 588–603. [Google Scholar] [CrossRef] [Green Version]
  41. Menssen, J.; Colier, W.; Hopman, J.; Liem, D.; de Korte, C. A method to calculate arterial and venous saturation from near infrared spectroscopy (NIRS). In Oxygen Transport to Tissue XXX. Advances in Experimental Medicine and Biology; Liss, P., Hansell, P., Bruley, D.F., Harrison, D.K., Eds.; Springer: Boston, MA, USA, 2009; Volume 645, pp. 135–140. [Google Scholar] [CrossRef]
  42. Wood, S.N. Package ‘mgcv’. 2021. Available online: https://cran.r-project.org/web/packages/mgcv/mgcv.pdf (accessed on 20 August 2021).
  43. Pang, D.S.J.; Rondenay, Y.; Measures, L.; Lair, S. The effects of two dosages of midazolam on short-duration anesthesia in the harp seal (Phoca groenlandica). J. Zoo Wildl. Med. 2006, 37, 27–32. [Google Scholar] [CrossRef]
  44. Mitchell, P.; Burton, H. Immobilisation of southern elephant seals and leopard seals with cyclohexamine anaesthetics and xylazine. Vet. Rec. 1991, 129, 332–336. [Google Scholar] [CrossRef]
  45. Woods, R.; Hindell, M.; Slip, D.J. Effects of physiological state on duration of sedation in southern elephant seals. J. Wildl. Dis. 1989, 25, 586–590. [Google Scholar] [CrossRef] [Green Version]
  46. Geraci, J.R. An appraisal of ketamine as an immobilizing agent in wild and captive pinnipeds. J. Am. Vet. Med. Assoc. 1973, 163, 574–577. [Google Scholar] [PubMed]
  47. Ferrari, M.; Quaresima, V. A brief review on the history of human functional near-infrared spectroscopy (fNIRS) development and fields of application. Neuroimage 2012, 63, 921–935. [Google Scholar] [CrossRef]
  48. Valencia, L.; Rodríguez-Pérez, A.; Kühlmorgen, B.; Santana, R.Y. Does sevoflurane preserve regional cerebral oxygen saturation measured by near-infrared spectroscopy better than propofol? Ann. Fr. Anesth. Reanim. 2014, 33, 59–65. [Google Scholar] [CrossRef]
  49. Iwasaki, K.; Nomoto, Y.; Ishiwata, M.; Yokota, T.; Ogawa, R. Vital capacity induction with 8% sevoflurane and N2O causes cerebral hyperemia. J. Anesth. 2003, 17, 3–7. [Google Scholar] [CrossRef] [PubMed]
  50. Lovell, A.T.; Marshall, A.C.; Elwell, C.E.; Smith, M.; Goldstone, J.C. Changes in cerebral blood volume with changes in position in awake and anesthetized subjects. Anesth. Analg. 2000, 90, 372–376. [Google Scholar] [CrossRef] [PubMed]
  51. Kim, S.J.; Kwon, J.Y.; Cho, A.R.; Kim, H.K.; Kim, T.K. The effects of sevoflurane and propofol anesthesia on cerebral oxygenation in gynecological laparoscopic surgery. Korean J. Anesthesiol. 2011, 61, 225–232. [Google Scholar] [CrossRef] [Green Version]
  52. Kitajima, T.; Okuda, Y.; Yamaguchi, S.; Takanishi, T.; Kumagai, M.; Ido, K. Response of cerebral oxygen metabolism in the head-up position during laparoscopic cholecystectomy. Surg. Laparosc. Endosc. 1998, 8, 449–452. [Google Scholar] [CrossRef] [PubMed]
  53. Saager, R.B.; Berger, A.J. Measurement of layer-like hemodynamic trends in scalp and cortex: Implications for physiological baseline suppression in functional near-infrared spectroscopy. J. Biomed. Opt. 2008, 13, 034017. [Google Scholar] [CrossRef] [PubMed]
  54. Higgins, J.L.; Hendrickson, D.A. Surgical procedures in pinniped and cetacean species. J. Zoo Wildl. Med. 2013, 44, 817–836. [Google Scholar] [CrossRef] [PubMed]
  55. Lucas, S.J.E.; Tzeng, Y.C.; Galvin, S.D.; Thomas, K.N.; Ogoh, S.; Ainslie, P.N. Influence of changes in blood pressure on cerebral perfusion and oxygenation. Hypertension 2010, 55, 698–705. [Google Scholar] [CrossRef] [PubMed] [Green Version]
  56. Heine, M.; Subudhi, A.W.; Roach, R.C. Effect of ventilation on cerebral oxygenation during exercise: Insights from canonical correlation. Respir. Physiol. Neurobiol. 2009, 166, 125–128. [Google Scholar] [CrossRef] [PubMed] [Green Version]
  57. Cuypers, J.; Matakas, F.; Potolicchio, S.J. Effect of central venous pressure on brain tissue pressure and brain volume. J. Neurosurg. 1976, 45, 89–94. [Google Scholar] [CrossRef] [PubMed]
  58. Brazy, J.E. Effects of crying on cerebral blood volume and cytochrome aa3. J. Pediatr. 1988, 112, 457–461. [Google Scholar] [CrossRef]
  59. Todd, M.M.; Weeks, J.B.; Warner, D.S. The influence of intravascular volume expansion on cerebral blood flow and blood volume in normal rats. Anesthesiology 1993, 78, 945–953. [Google Scholar] [CrossRef]
  60. Tsai, F.Y.; Kostanian, V.; Rivera, M.; Lee, K.W.; Chen, C.C.; Nguyen, T.H. Cerebral venous congestion as indication for thrombolytic treatment. Cardiovasc. Intervent. Radiol. 2007, 30, 675–687. [Google Scholar] [CrossRef]
  61. Hamilton, W.F.; Woodbury, R.A.; Harper, H.T. Physiologic relationships between intrathoracic, intraspinal and arterial pressures. J. Am. Med. Assoc. 1936, 107, 853–856. [Google Scholar] [CrossRef]
  62. Haykowsky, M.J.; Eves, N.D.; Warburton, D.E.R.; Findlay, M.J. Resistance exercise, the Valsalva Maneuver, and cerebrovascular transmural pressure. Med. Sci. Sport. Exerc. 2003, 35, 65–68. [Google Scholar] [CrossRef] [PubMed]
  63. Phan, P.; Highton, D.; Lai, J.; Smith, M.; Elwell, C.; Tachtsidis, I. Multi-channel multi-distance broadband near-infrared spectroscopy system to measure the spatial response of cellular oxygen metabolism and tissue oxygenation. Biomed. Opt. Express 2016, 7, 4424–4440. [Google Scholar] [CrossRef] [PubMed]
  64. Dowdy, E.G.; Kaya, K. Studies of the mechanism of cardiovascular responses to CI-581. Anesthesiology 1968, 29, 931–943. [Google Scholar] [CrossRef] [PubMed]
  65. Waterman, A.; Livingston, A. Some physiological effects of ketamine in sheep. Res. Vet. Sci. 1978, 25, 225–233. [Google Scholar] [CrossRef]
  66. Chang, P. The effects of ketamine on guinea pig heart. Br. J. Anaesth. 1973, 45, 929–930. [Google Scholar] [CrossRef]
  67. Morse, Z.; Sano, K.; Kanri, T. Effects of a midazolam-ketamine admixture in human volunteers. Anesth. Prog. 2004, 51, 76–79. [Google Scholar]
  68. Andrews, R.D.; Jones, D.R.; Williams, J.D.; Thorson, P.H.; Oliver, G.W.; Costa, D.P.; Le Boeuf, B.J. Heart rates of northern elephant seals diving at sea and resting on the beach. J. Exp. Biol. 1997, 200, 2083–2095. [Google Scholar] [CrossRef]
  69. Thompson, D.; Fedak, M.A. Cardiac responses of grey seals during diving at sea. J. Exp. Biol. 1993, 174, 139–164. [Google Scholar] [CrossRef]
  70. Field, I.C.; Bradshaw, C.J.A.; McMahon, C.R.; Harrington, J.; Burton, H.R. Effects of age, size and condition of elephant seals (Mirounga leonina) on their intravenous anaesthesia with tiletamine and zolazepam. Vet. Rec. 2002, 151, 235–240. [Google Scholar] [CrossRef]
  71. McMahon, C.R.; Burton, H.; McLean, S.; Slip, D.; Bester, M. Field immobilization of southern elephant seals with intravenous tiletamine and zolazepam. Vet. Rec. 2000, 146, 251–254. [Google Scholar] [CrossRef] [PubMed]
  72. Mellish, J.-A.E.; Tuomi, P.A.; Hindle, A.G.; Horning, M. Chemical immobilization of Weddell seals (Leptonychotes weddellii) by ketamine/midazolam combination. Vet. Anaesth. Analg. 2010, 37, 123–131. [Google Scholar] [CrossRef] [PubMed]
  73. Cohen, W.S.; Roberts, W.N.; Levenson, J.L. Benzodiazepines, other anxiolytic agents, and sedative hypnotics. In Systemic Lupus Erythematosus; Lahita, R., Ed.; Elsevier: Amsterdam, The Netherlands, 2004; pp. 785–825. [Google Scholar] [CrossRef]
Figure 1. The optode array configuration overlaid on the head of a juvenile grey seal for anatomical perspective of the light emitter (red points) and detector (black points) locations. Black lines indicate each of twenty 3 cm optode-detector distance channels and green circles indicate the two channels that were chosen for analysis, which are found between the parietal and pre-frontal lobe.
Remotesensing 13 03553 g001
Figure 2. Example of cerebral haemodynamics and global systemic changes for 60 s before and 180 s after ketamine administration at time 0 s for one drugging trial. Cerebral haemodynamics include [ΔHHb] (μ mol L−1), [ΔO2Hb] (μ mol L−1), relative cerebral blood volume changes [ΔtHb] (μ mol L−1), and relative haemoglobin oxygenation changes [ΔHbdiff] (μ mol L−1) in the (A) left and (B) right hemispheres of the brain. Systemic changes include (C) heart rate (BPM) and (D) SpO2 (%). All concentrations are expressed as relative changes from a baseline (0 μ mol L−1) at time of drug administration. This ketamine drugging trial was taken from Jones on 6 December 2018 and was preceded by an initial intramuscular dose of midazolam and five intravenous ketamine doses. For combined raw data for all ketamine drugging trials see Supplementary Figures S2 and S3. [ΔHHb], change in concentration of deoxygenated haemoglobin; [ΔO2Hb], change in concentration of oxygenated haemoglobin; [ΔtHb], change in concentration of total haemoglobin; [ΔHbdiff], difference in concentration of oxygenated and deoxygenated haemoglobin; SpO2, arterial oxygen saturation.
Remotesensing 13 03553 g002
Figure 3. GAMM model prediction outcomes for [ΔHHb] (μ mol L−1), [ΔO2Hb] (μ mol L−1), and heart rate (BPM) in the (A) left hemisphere and (B) right hemisphere for 60 s before and 180 s after ketamine administration at time 0 s for 27 trials across five grey seals. For illustrative purposes a baseline shift was completed so that all concentrations are expressed as relative changes from a baseline (0 μ mol L−1) between the left and right hemispheres at time of drug administration. Changes in heart rate are systemic, meaning the presented model prediction outcomes for heart rate are the same for the left and right hemispheres. The shaded regions represent the 95% confidence intervals. GAMM, generalised additive mixed model; [ΔHHb], change in concentration of deoxygenated haemoglobin; [ΔO2Hb], change in concentration of oxygenated haemoglobin.
Remotesensing 13 03553 g003
Figure 4. The mean number of breaths in 30 s intervals for 60 s before and 180 s after ketamine administration at time 0 s for 27 trials across five grey seals. Error bars represent the upper (75th percentile) and lower (25th percentile) quartile range of the data.
Remotesensing 13 03553 g004
Figure 5. Example of cerebral haemodynamics and global systemic changes for 60 s before and 180 s after midazolam administration at time 0 s for one drugging trial. Cerebral haemodynamics include [ΔHHb] (μ mol L−1), [ΔO2Hb] (μ mol L−1), relative cerebral blood volume changes [ΔtHb] (μ mol L−1), and relative haemoglobin oxygenation changes [ΔHbdiff] (μ mol L−1) in the (A) left and (B) right hemispheres of the brain. Systemic changes include (C) heart rate (BPM) and (D) SpO2 (%). All concentrations are expressed as relative changes from a baseline (0 μ mol L−1) at time of drug administration. This midazolam drugging trial was taken from Gruber on 6 December 2018 and was preceded by an initial intramuscular dose of midazolam, one intravenous dose of midazolam, and three intravenous ketamine doses. For combined raw data for all midazolam drugging trials see Supplementary Figures S5 and S6. [ΔHHb], change in concentration of deoxygenated haemoglobin; [ΔO2Hb], change in concentration of oxygenated haemoglobin; [ΔtHb], change in concentration of total haemoglobin; [ΔHbdiff], difference in concentration of oxygenated and deoxygenated haemoglobin; SpO2, arterial oxygen saturation.
Remotesensing 13 03553 g005
Figure 6. GAMM model prediction outcomes for [ΔHHb] (μ mol L−1), [ΔO2Hb] (μ mol L−1), and heart rate (BPM) in the (A) left hemisphere and (B) right hemisphere for 60 s before and 180 s after midazolam administration at time 0 s for 11 trials across four grey seals. For illustrative purposes a baseline shift was completed so that all concentrations are expressed as relative changes from a baseline (0 μ mol L−1) between the left and right hemispheres at time of drug administration. Changes in heart rate are systemic, meaning the presented model prediction outcomes for heart rate are the same for the left and right hemispheres. The shaded regions represent the 95% confidence intervals. GAMM, generalised additive mixed model; [ΔHHb], change in concentration of deoxygenated haemoglobin; [ΔO2Hb], change in concentration of oxygenated haemoglobin.
Remotesensing 13 03553 g006
Figure 7. The mean number of breaths in 30 s intervals for 60 s before and 180 s after midazolam administration at time 0 s for 11 trials across four grey seals. Error bars represent the upper (75th percentile) and lower (25th percentile) quartile range of the data.
Remotesensing 13 03553 g007
Table 1. The independent variables included in the model selection process for the response in [ΔO2Hb], [ΔHHb], heart rate, and SpO2 to ketamine and midazolam administration. For each independent variable, the variable type (smooth function, factor variable, or random effect) and the dependent variable and drug for which it was included in model selection is presented.
VariableVariable TypeDependent VariableDrug
Time series starting at 60 s pre-drugging to 180 s post-druggingSmooth[ΔO2Hb], [ΔHHb], heart rate, and SpO2Ketamine and
midazolam
Time since initial drugging (s)Smooth[ΔO2Hb], [ΔHHb], heart rate, and SpO2Ketamine and
midazolam
Cumulative bolus volume of ketamine and midazolam (mL)Smooth [ΔO2Hb], [ΔHHb], heart rate, and SpO2Ketamine and
midazolam
Respiratory band (mV)Smooth[ΔO2Hb], [ΔHHb], and heart rateKetamine and
midazolam
Ketamine bolus volume (mL)Smooth[ΔO2Hb], [ΔHHb], heart rate, and SpO2Ketamine
Midazolam bolus volume (mL)Factor[ΔO2Hb], [ΔHHb], heart rate, and SpO2Midazolam
Side (left or right hemisphere)Factor [ΔO2Hb] and [ΔHHb]Ketamine and
midazolam
Animal IDRandom effect[ΔO2Hb], [ΔHHb], heart rate, and SpO2Ketamine and
midazolam
Publisher’s Note: MDPI stays neutral with regard to jurisdictional claims in published maps and institutional affiliations.

