Article

Impacts of Saline-Alkali Land Improvement on Regional Climate: Process, Mechanisms, and Implications

1
Remote Sensing and Geographic Information Research Center, Northeast Institute of Geography and Agroecology, Chinese Academy of Sciences, Changchun 130102, China
2
Remote Sensing and Geographic Information Research Center, Changchun Jingyuetan Remote Sensing Observation Station, Chinese Academy of Sciences, Changchun 130102, China
3
College of Geography Science, Changchun Normal University, Changchun 130031, China
4
School of Life Science, Liaoning Normal University, Dalian 116029, China
5
School of Public Administration, Hainan University, Haikou 570228, China
*
Author to whom correspondence should be addressed.
Remote Sens. 2021, 13(17), 3407; https://doi.org/10.3390/rs13173407
Submission received: 6 August 2021 / Revised: 26 August 2021 / Accepted: 26 August 2021 / Published: 27 August 2021
(This article belongs to the Topic Climate Change and Environmental Sustainability)

Abstract

:
Studying land use change and its associated climate effects is important to understand the role of human activities in the regulation of climate systems. By coupling remote sensing measurements with a high-resolution regional climate model, this study evaluated the land surface changes and corresponding climate impact caused by planting rice on saline-alkali land in western Jilin (China). Our results showed that paddy field expansion became the dominant land use change in western Jilin from 2015 to 2019, 25% of which was converted from saline-alkali land; this percentage is expected to increase in the near future. We found that saline-alkali land reclamation to paddy fields significantly increased the leaf area index (LAI), particularly in July and August, whereas it decreased albedo, mainly in May and June. Our simulation results showed that planting rice on saline-alkali land can help decrease the air temperature and increase the relative humidity. The temperature and humidity effects showed different magnitudes during the growing season and were most significant in July and August, followed by September and June. The nonradiative process, rather than the radiative process, played a dominant role in regulating the regional climate in this case, and the biophysical competition between evapotranspiration (ET) and albedo determined the temperature and relative humidity response differences during the growing season.

1. Introduction

Both land use changes and CO2 emissions have been documented as dominant driving factors influencing the climate system at different scales from global to regional [1,2,3,4,5]. However, at the regional scale, some studies emphasize that climate change induced by land use change is even greater than climate change induced by greenhouse gases [6,7,8]. Understanding the predominant regional land use change as well as the mechanisms by which it affects climate through altering energy, momentum, and water exchange processes is crucial to fully clarify how humans modify and regulate climate [9,10,11]. In addition, studying land use changes and estimating their climate impact is also a major requirement for the sustainable development of agriculture [12,13,14,15].
Global land use trajectories show the transition from pre-settlement natural ecosystems to intensive complex composite ecosystems, in which urbanization and intensive agriculture plays an increasingly important role in supporting the unprecedented population and its associated crop requirements [16,17,18,19]. Based on satellite big data, Kuang et al. detected significant global urbanization since the beginning of the 21st century [19]. The human-induced cropland expansion has been examined as the major driver for a series of land-use changes, including deforestation, grassland, and wetland reclamation across both tropical and temperature regions [18,20,21]. Through using land-use management, China and India lead in the global widespread greening since 2000, among which, fertilization use and irrigation drive the greening and food production increase in croplands [22]. Although some studies have investigated the regional climate impacts caused by urban expansion and agricultural intensification, mainly the land use conversion from forest, grassland, and wetland to farmland, agricultural practice, and agricultural irrigation [1,7,23,24,25,26,27,28,29,30], attention has rarely been given to exploring the connection between the vegetation restoration caused by saline-alkali land improvement and regional climate responses and the role in seasonal transitions in temperature and energy balance.
As a widely distributed area of the black soil region, the Northeast China has experienced unprecedented agricultural intensification since the 1950s and has become the major grain-producing area in China [31,32,33]. However, the ecological environment has become increasingly vulnerable across the transitional climate and ecological zone of northern China due to high-intensity land development [34]. As a result, some grassland or farmland in subarid, ecologically fragile areas such as western Jilin has degraded into saline-alkali land and resulted in severe environmental and ecological problems [35]. Recently, the development of saline-alkali soil improvement technology has made planting rice in saline-alkali land possible, and this will become the dominant land use in the near future with sufficient policy support [36]. Saline-alkali land improvement substantially changes the surface biophysical and biochemical properties and influences the interactions between the land surface and atmosphere [37]. However, comprehensive evaluations of how saline-alkali land improvements influence surface plant physiological and optical parameters and further affect the local climate are still lacking.
Satellite observations provide detailed Earth surface information and have become the most commonly used approach to study environmental change [38,39,40]. Some studies have used remote sensing measurements to investigate the response of surface temperature to land use changes such as afforestation and urbanization [41,42]. However, it is difficult to identify the mechanisms corresponding to climate impact. High-resolution regional climate modelling involving a land surface model can accurately represent the energy and moisture exchanges at the surface/atmosphere interface and has become an efficient way to simulate climate effects based on historic and future land use changes [43,44,45,46,47,48]. Precise land surface properties are essential in simulating the interactions between the surface and the atmosphere and have been widely documented [49,50]. Coupling spatially continuous satellite observations with regional climate models has become the state-of-the-art approach to study climate impacts due to land surface changes [51].
Therefore, in this study, we quantify the air temperature and relative humidity impacts related to changes from regional typical and novel land use changes—from saline-alkali land to paddy fields. First, the historic and future projected land use changes in western Jilin were analysed. We then evaluated the influence of saline-alkali land improvement on two crucial surface parameters, including albedo and leaf area index (LAI). Finally, the climate responses, mechanisms and implications for saline-alkali land improvement were simulated and further analysed by coupling the land surface model into the regional climate model. Through this study, our results can provide suggestions for regional agricultural development.

2. Materials and Methods

2.1. Study Area

Western Jilin is located in the western part of Jilin Province in Northeast China, extending from 43°59′27″N to 46°18′5″N latitude and 121°37′31″E to 126°10′43″E longitude (Figure 1). With a total area of 46,900 km2, western Jilin contains ten county-level cities, including Zhenlai, Taobei, Taonan, Tongyu, Da’an, Qian’an, Changling, Qianguo, Ningjiang and Fuyu. The landform of western Jilin is an alluvial and proluvial plain with an average altitude of 160 m. The climate is dominated by a temperate continental climate with distinct seasonal variation. The average annual temperature is 4–5 °C, and the annual precipitation is 350–500 mm. The water resources are rich, the main rivers of which are the Taoer River, Nenjiang River and Songhua River. Affected by landform and climate, the soil is mainly light chernozem and meadow soil. From the perspective of ecological zoning, western Jilin is located in the ecotone between agriculture and animal husbandry.
The long-term agricultural intensification that began in the 1950s contributed to severe land degradation; as a result, increasing amounts of land were converted to saline-alkali land, and the ecological environment has became increasingly vulnerable. Since the 2010s, saline-alkali soil improvement technology has been promoted to cultivate rice on unused saline-alkali land and has become a new regional land use change characteristic. As a result, western Jilin has become the ideal area to fully understand how human activities regulate or modify climate at the regional scale.

2.2. Data Processing

2.2.1. Land Use and Land Cover (LULC) Data

In this study, we used time series land use datasets produced by the Chinese Academy of Sciences (CAS) (downloaded from http://www.resdc.cn/ (accessed on 25 June 2021)) to describe the land use pattern in western Jilin. Two periods, 1975 to 2015 and 2015 to 2019, were used to analyse land use change over the past 45 years. Based on the land use maps from 2015 and 2019, we extracted the unchanged pure grids (where the dominant type is the only land use type in that grid) at a 1 km × 1 km spatial resolution for paddy fields and saline-alkali land. There were 1621 and 1478 pure grids for saline-alkali land and paddy fields in our study area, respectively (Figure S1). These pure pixels were used to extract the interannual cycle of surface properties, including LAI and albedo.
In this study, we used the CAS LULC data from 2015 to represent the land use pattern in China. The European Space Agency (ESA) Climate Change Initiate (CCI) land use and land cover dataset from 2015 was used to fill in the land use data outside Northeast China. Both the CAS and CCI LULC data were converted to USGS 24-category land use categories at a resolution of 1 km. The fraction of each LULC type, the dominant LULC type and the land mask layer at each grid were then obtained through spatial statistical analysis using ArcGIS and Python processing.

2.2.2. Land Surface Parameters Datasets

LAI and albedo are two dominant surface biogeophysical parameters influencing the energy budget and water cycling. The LAI determines the vegetation transpiration and CO2 exchange of the vegetation canopy, whereas the surface albedo can affect the shortwave radiation absorbed by the surface. Temporally and spatially continuous LAI and albedo data can help represent the interactions between the land surface and atmosphere more accurately. In this study, we used MODIS products, including the MOD15A2 8-day composite LAI dataset and the MCD43B3 daily albedo dataset, to represent the spatial heterogeneity of LAI and albedo. To match the temporal resolution and projection of Weather Research and Forecasting (WRF) preprocessing, the 8-day composite or daily datasets were first aggregated monthly, and the projection was transformed into a Lambert equal area projection. To avoid the influence of climate variation, we used the 2015–2019 five-year average monthly LAI and albedo to update the original corresponding dataset in the WRF preprocessing.

2.2.3. Climate Forcing Dataset

ERA5 reanalysis datasets were used to force the WRF model at both the surface and pressure levels. ERA5 is the fifth generation of ECMWF atmospheric reanalysis of the global climate, which began with the FGGE reanalysis produced in the 1980s, followed by ERA-15, ERA-40 and most recently ERA-Interim. These data have a high spatial resolution of 0.25 × 0.25 degrees and a high temporal resolution, which can reach three hours. The long-term (1950 to the most current) ERA5 datasets have been widely applied to historic and future climate change research. At the surface level, 19 surface variables including the 10 m u component of wind, 10 m v component of wind, 2 m dewpoint temperature, 2 m temperature, land sea mask, mean sea level pressure, sea ice cover, sea surface temperature, skin temperature, snow depth, soil temperature at four soil layers, surface pressure, volumetric soil water at four soil layers were used, and at the pressure level, six variables including geopotential, relative humidity, specific humidity, temperature, u component of wind, and v component of wind at 37 vertical levels were used for the meteorological forcing.

2.2.4. Meteorological Observation Dataset

The monthly dataset of surface climate data in China from the China Meteorological Data Service Center (CMDSC) (http://cdc.cma.gov.cn/ (accessed on 25 June 2021)) was used to validate the efficiency of our simulation. This monthly dataset spans a period from 1951 to the present and includes 23 meteorological variables. Two climate variables, including air temperature (at 2 m) and relative humidity (at 2 m) at six meteorological stations covering western Jilin were selected to compare the observed results with the model-simulated results. The six meteorological stations included Baicheng, Fuyu, Qianguo, Tongyu, Qian’an and Changling.

2.3. Regional Climate Sumulation

The Weather Research and Forecasting (WRF) model has been used in a broad range of applications, including regional climate research and forecast research across scales ranging from metres to thousands of kilometres [52]. Based on different dynamic solvers, the WRF system contains an advanced research WRF (ARW) core and a nonhydrostatic mesoscale model (NMM) core. In this study, we used the flexible, efficient and state-of-the-art atmospheric ARW simulation system version 3.6 to perform the numerical simulation.
We designed two domains in our experiments (Figure 2), which had horizontal resolutions of 30 km and 10 km, respectively. The first domain included all of Northeast China, whereas the second domain included our study area: western Jilin and its surrounding areas. The two scenarios were designed to simulate the impact of saline-alkali land improvements on the regional climate. In the control scenario, the land use and land cover (LULC) data from 2015 were used to calculate the LULC-related land surface variables, including the dominant LULC type, the fraction of each LULC type, and the land mask at each domain resolution. The 2015–2019 5-year average monthly LAI and albedo were used to replace the corresponding initial model geostatistical datasets. In the sensitivity experiments, all the saline-alkali land in 2015 was converted to paddy fields, referring to herbaceous wetlands from the 24-category USGS land use categories. The seasonally varied LAI and albedo on the converted saline-alkali land were updated based on the statistical characteristics of pure paddy fields (Table 1). The initial boundary conditions and the physical parameterization schemes were held constant in both the control and sensitivity experiments. Therefore, the regional climate impacts due to saline-alkali land improvement can be identified.
The main schemes used in the simulation were as follows: the microphysics was a WRF Single-Moment 3-class scheme, both the longwave radiation and shortwave radiation were CAM schemes, the surface layer was an MM5 similarity scheme, the land surface was represented by the Noah Land Surface Model, the planetary boundary layer was a Yonsei University scheme, and the cumulus parameterization was a Kain-Fritsch scheme. Given that the growing season in western Jilin extends from late May to late September, the two experiments were initialized on 1 May to 1 October of each year from 2015 to 2019. The results from the first month were used to spin up the model, and the results from following months (June, July, August and September) were used for analysis in this paper.

3. Results

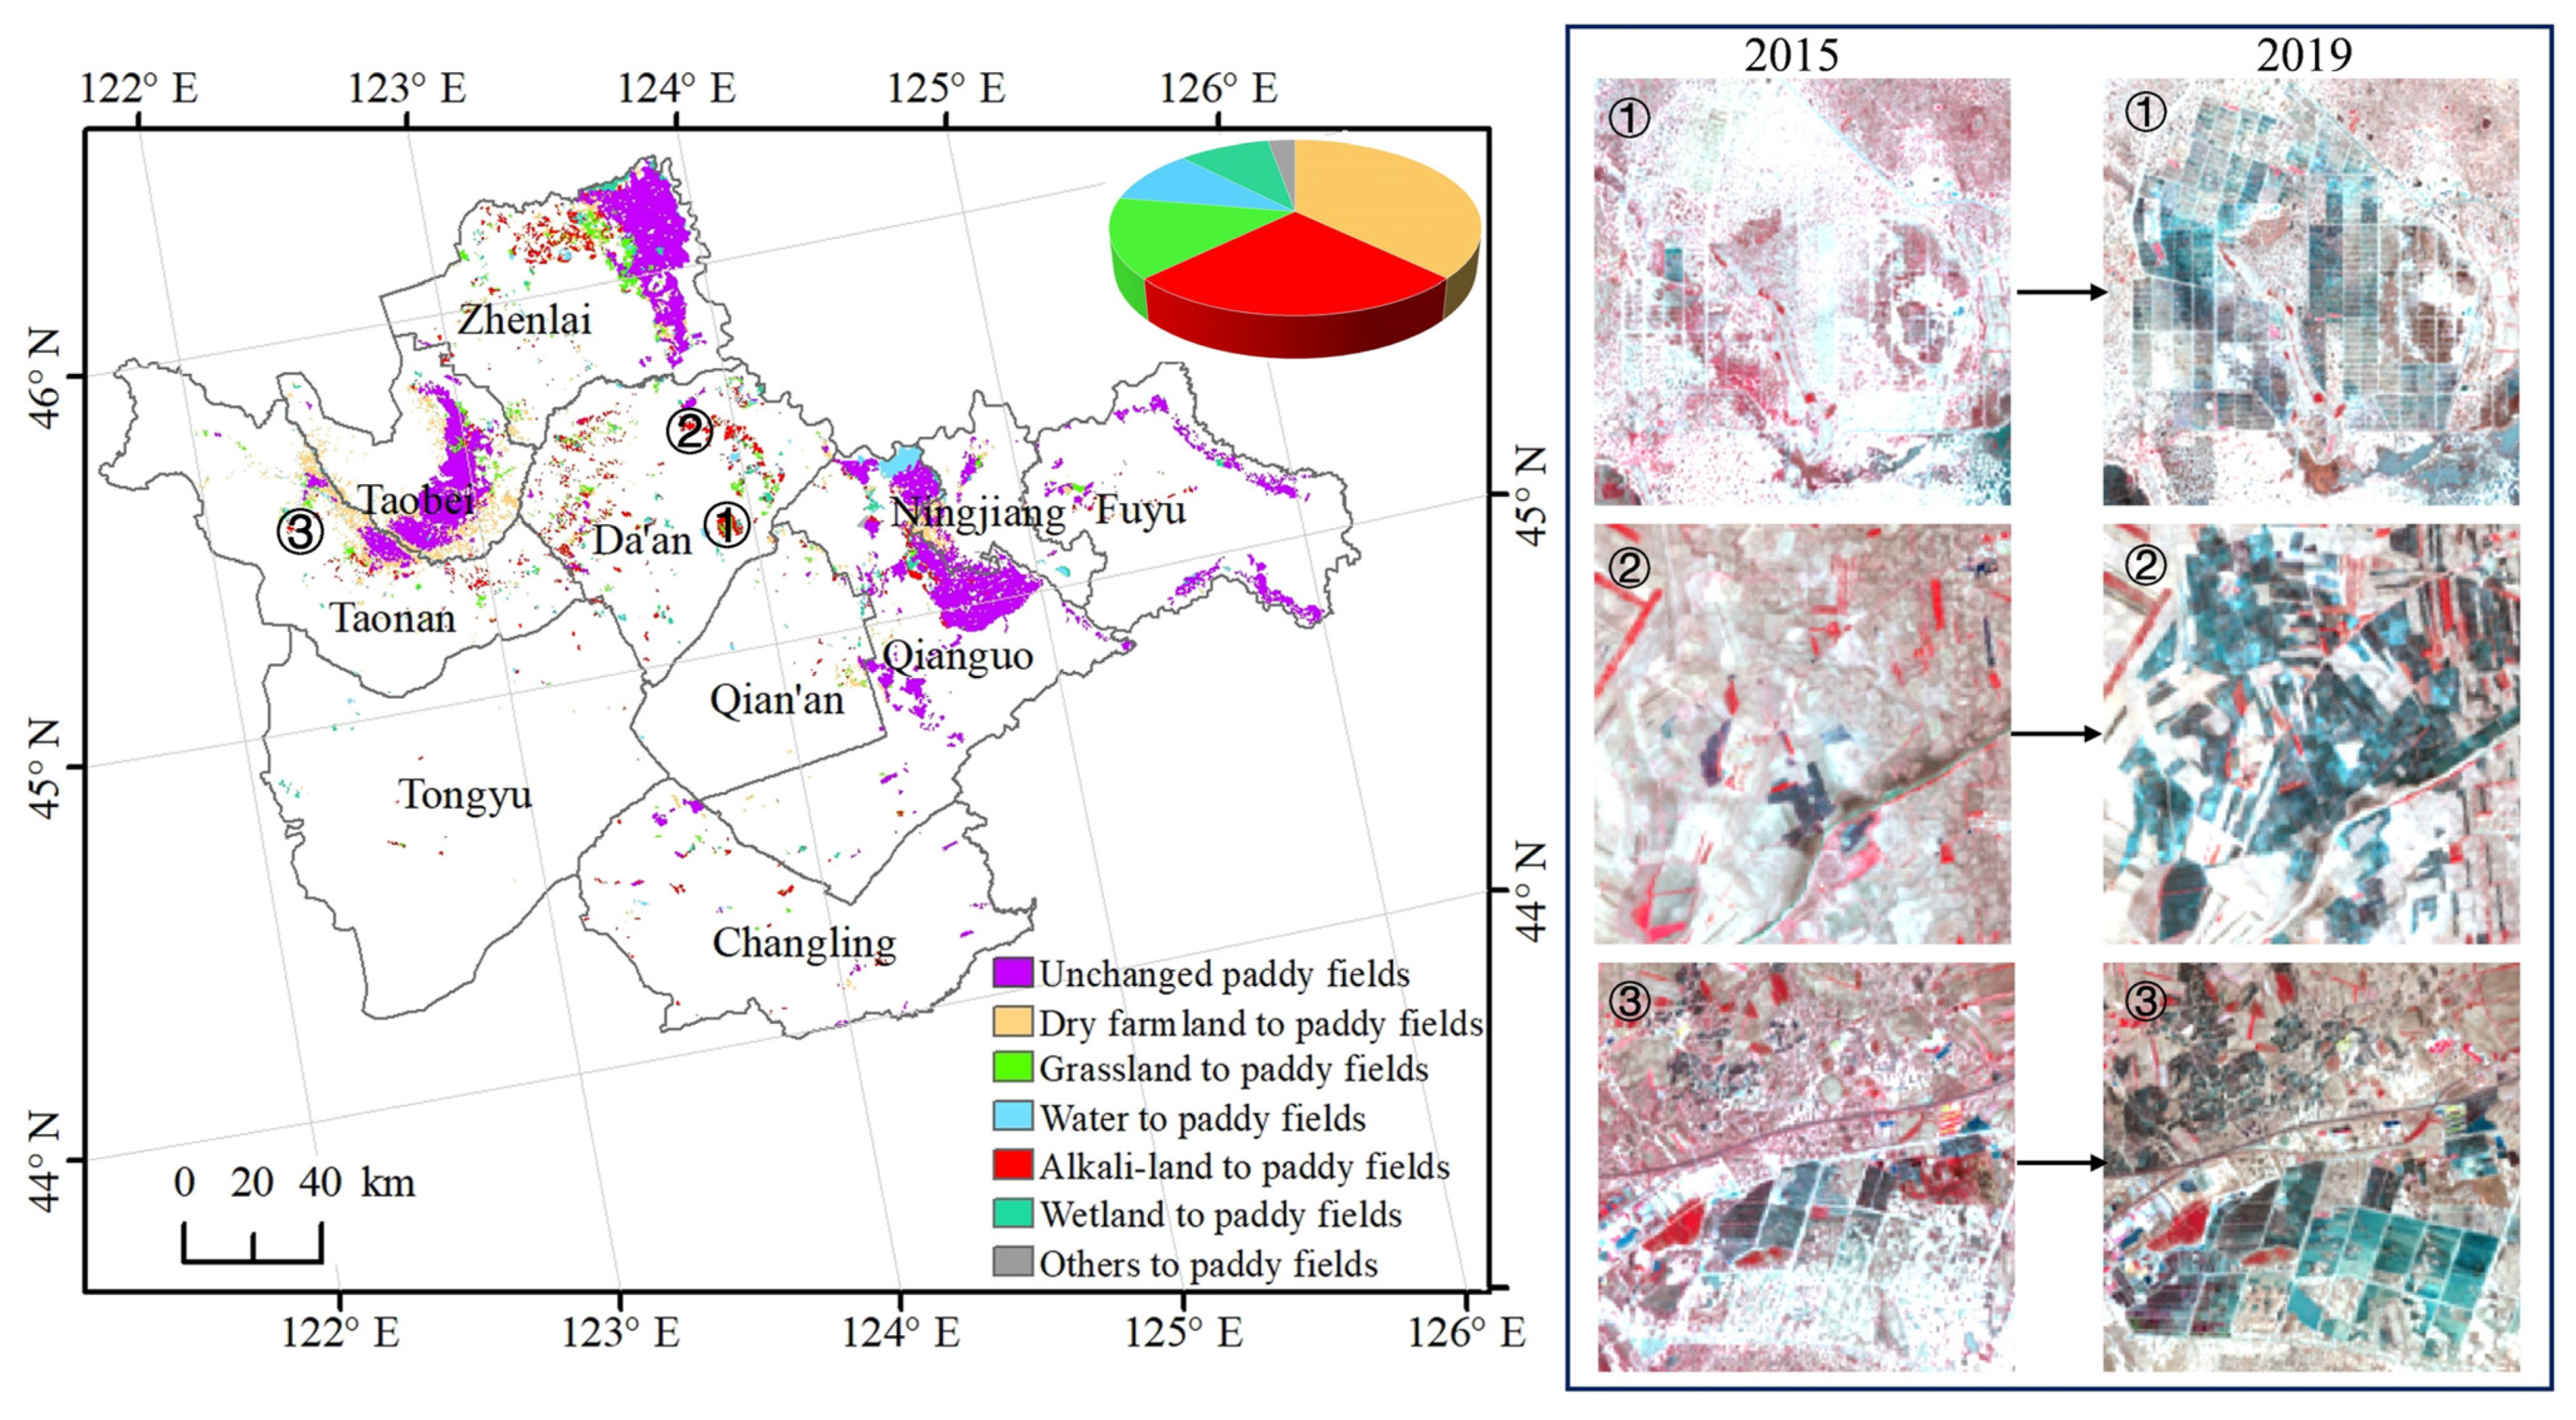
3.1. Land Use Changes in Western Jilin: Historic, Current and Future

Dry farmland, grassland and saline-alkali land are three dominant land use types in western Jilin, accounting for approximately 75~78% of the total area. Remarkable land use conversions were identified from 1975 to 2015 in western Jilin due to both human activities and natural environmental changes (Figure 3). Extensive grassland degradation to saline-alkali land was observed mainly in Da’an, Tongyu, Changling and Zhenlai. In Qian’an and Qianguo, a large number of grasslands have been reclaimed to dry farmland. Notable paddy field expansion from dry farmland or wetland was observed in the main rice planting areas such as Zhenlai, Taobei and Qianguo. In addition, notable built-up land expansion was also detected from 1975 to 2015.
A land use transition matrix was created to determine the specific land use conversions in western Jilin (Table 2). From 1975 to 2015, grassland decreased by 3228 km2, 43.9% of which was reclaimed to dry farmland, and 39.4% of which degraded to saline-alkali land. Paddy fields and dry farmland increased by 1738 and 620 km2, respectively, indicating that agricultural development was the dominant driving factor of the land use changes in western Jilin during our study period. Expanded paddy fields were primarily converted from dry farmland (52.8%) and wetlands (33%). It should be noted that approximately 6% of the paddy field expansion was converted from saline-alkali land due to novel techniques of planting rice on saline-alkali land. As a result, degraded saline-alkali land has become an important reserved cultivated land resource in these regions. In addition, wetland and water decreased by 636 and 200 km2, respectively, whereas built-up land, woodland and barren land increased by 437, 317 and 32 km2, respectively.
Recent remote sensing measurement records from 2015 to 2019 showed that paddy field expansion continued at an increasing rate. In those four years, paddy fields increased by 2031 km2, compared with 1738 km2 in the past 40 years from 1975 to 2015 (Figure 4).
A total of 37.1% of the increase in paddy fields was converted from dry farmland, most of which were located in areas adjacent to already existing paddy fields. Saline-alkali land reclamation has become the second most important approach to paddy field expansion, with a 520.9 km2 increase in western Jilin. An increased plant area is a direct way to guarantee or increase food production and is beneficial due to the low land cost of saline-alkali land and provincial government support. Paddy field development on saline-alkali land in western Jilin has become and will continue to be the main trend in future land use management.

3.2. Impact of Saline-Alkali Land Development to Paddy Fields on Land Surface Geophysical Parameters

The distribution of both albedo and LAI showed notable spatial heterogeneity across western Jilin (Figure 5). Previous studies have suggested that the land use distribution, vegetation coverage and background geophysical conditions may explain why this region shows this spatial variation. By comparing the land use pattern and the LAI/albedo pattern, we found that the saline-alkali land-dominated regions such as Da’an, Qian’an and Tongyu showed higher albedo and lower LAI than those of other regions. For the main region of paddy fields such as the northern part of Qianguo, Taobei and the eastern part of Zhenlai, the albedo was lower and the LAI was higher. As our study focused on the climate impact due to the conversion from saline-alkali land to paddy fields, the albedo and LAI for the pure saline-alkali land and paddy fields were separated. The albedo for the saline-alkali land during the growing season was 0.21 ± 0.02, whereas it was 0.15 ± 0.007 for the paddy field. The LAI for the saline-alkali land during the growing season was 0.57 ± 0.19, whereas it was 1.99 ± 0.24 for the paddy field.
The monthly mean albedo and LAI based on zonal statistics (Figure 6a,b) indicated that the seasonal variation in albedo/LAI for the paddy field was much greater than that for the saline-alkali land. At the beginning of the growing season, including May and June, the albedo in the paddy field was less than 0.10; however, it was greater than 0.2 for the saline-alkali land. With the tillering, heading and fruiting of rice and vegetation growth in saline-alkali land, the albedo differences from July to October decreased. The LAI variations paralleled the air temperature changes, which increased from May on and reached their peak value in July and then decreased gradually to October. However, the differences in LAI between the paddy fields and saline-alkali land were not synchronized with albedo. Instead of occurring in May and June, the distinct differences in LAI mainly occurred in July and August (3.35 m2/m2 and 2.37 m2/m2, respectively). These asynchronous differences in surface parameters between paddy fields and saline-alkali land are likely to bring distinct seasonal climate responses to saline-alkali land improvements.

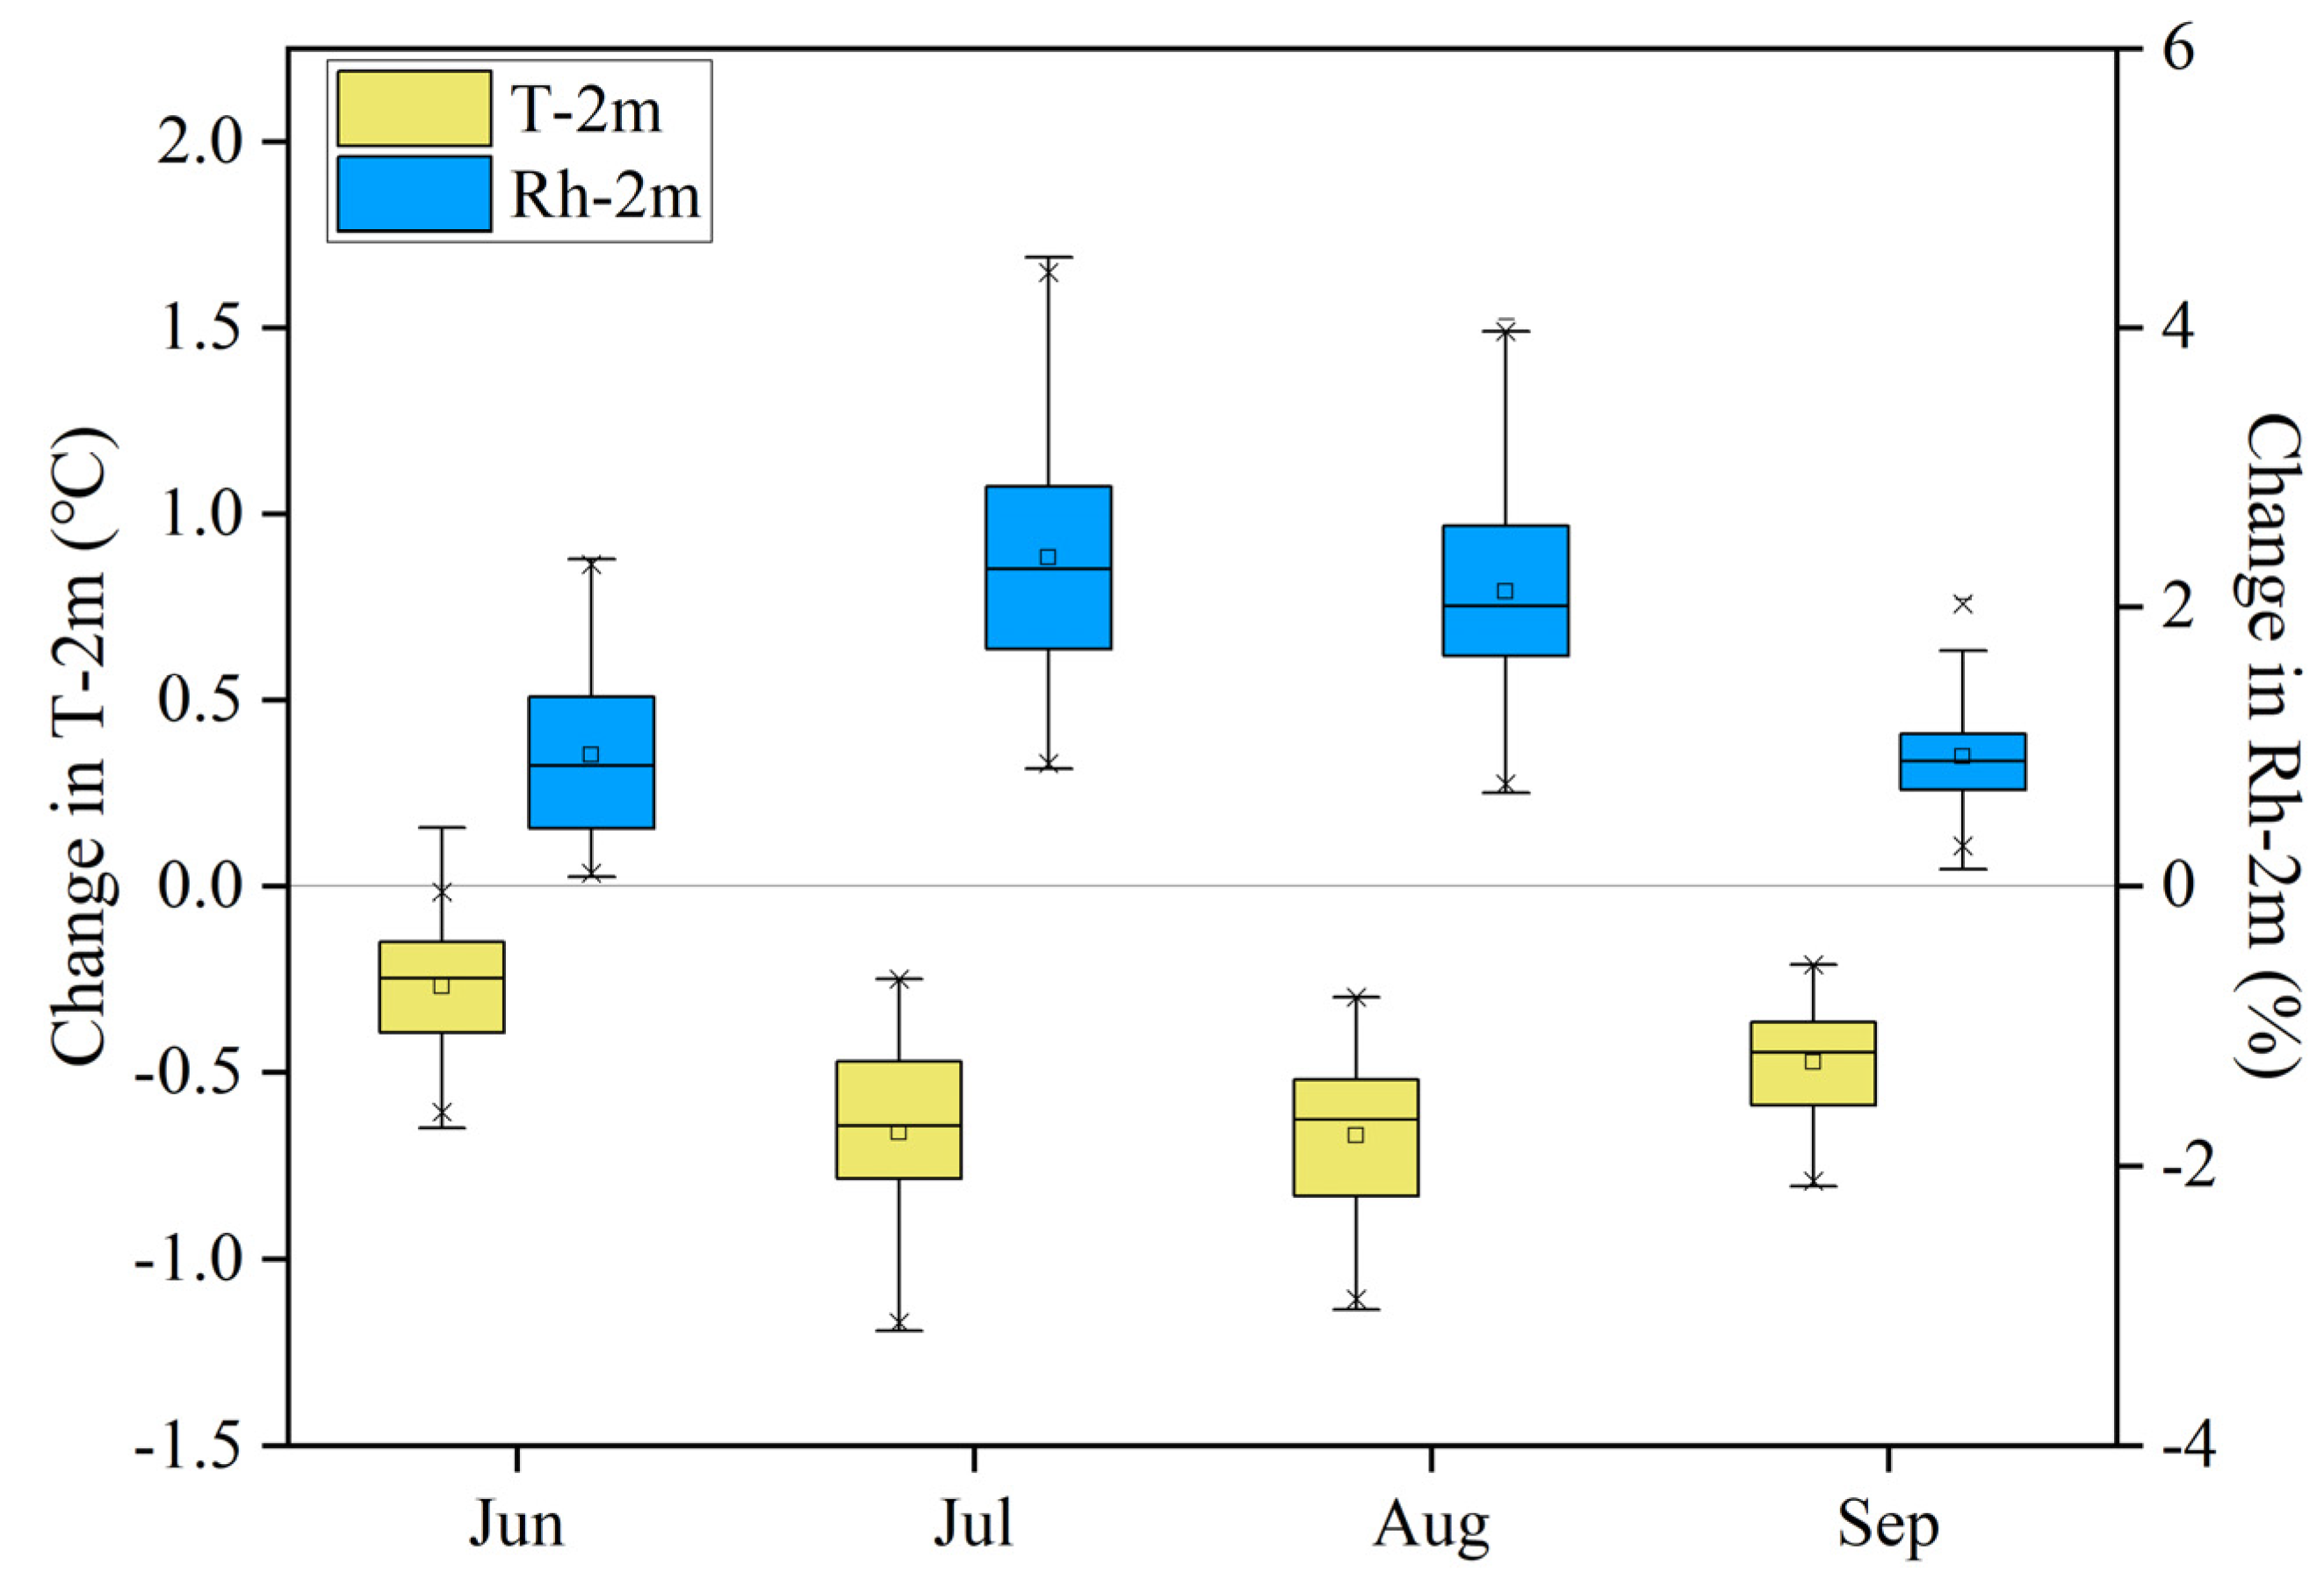
3.3. Impact of Saline-Alkali Land Development to Paddy Fields on Air Temperature and Relative Humidity

Prior to the analysis of climate impacts caused by land use changes, the model-simulated results were first validated by the observed air temperature (T-2 m) and relative humidity (Rh-2 m). Our results showed a cooling bias of 0.21 °C for T-2 m and a drying bias of 2.02% for Rh-2 m in western Jilin, indicating that our model captured the patterns of T-2 m and Rh-2 m well in our experiments.
The differences in T2-m and Rh-2 m between the control and sensitivity experiments showed that local T-2 m and Rh-2 m responded to saline-alkali land improvement, i.e., T-2 m and Rh-2 m mainly changed where saline-alkali land development occurred. At the pixel scale, the relationship between the improved saline-alkali land fraction and changes in T-2 m and Rh-2 m showed a nonlinear relationship (Figure 7a,b).
When the improved saline-alkali land fraction was less than 10%, the changes in T-2 m and Rh-2 m were relatively small. With the increase in the improved saline-alkali land fraction, the temperature-humidity effect became increasingly significant. As the improved saline-alkali land fraction increased by 50%, the T-2 m decreased by 0.65 °C during the growing season. In contrast to T-2 m, a 50% increase in improved saline-alkali land could lead to a 2.16% increase in Rh-2 m.
The land use change from saline-alkali land to paddy fields contributed to varied land surface changes among different months during the growing season, which was shown in Section 3.2. We used the pixels with the dominant type converted from saline-alkali land to paddy fields in our experiments to further investigate the seasonal variations in temperature responses and their biogeophysical mechanisms. Our results showed that the saline-alkali land improvements brought consistent temperature cooling and relative humidity increases during the growing season from June to September (Figure 8). The most significant cooling was observed in July and August with the T-2 m decreasing by 0.66 °C (mean value) and 0.67 °C (mean value), respectively. The temperature cooling effect was also detected in September and June and declined by 0.47 °C and 0.27 °C, respectively. The Rh-2 m increased by 2.35% and 2.11% in July and August, respectively, whereas it increased by 0.94% and 0.93% in June and September, respectively.
From an energy balance perspective (Figure 9), the saline-alkali land improvement decreased the reflected solar radiation by decreasing the albedo, particularly in June and July. The upward shortwave radiation decreased by −13.56 ± 5.18 W/m2 and −4.03 ± 2.72 W/m2 in June and July, respectively, indicating warming effects through the absorption more solar radiation. From an energy redistribution perspective, the increase in LAI enhanced vegetation transpiration, resulting in the latent heat flux increasing by 15.17 ± 5.05 W/m2, 22.82 ± 7.55 W/m2, 17.41 ± 6.35 W/m2, and 6.11 ± 2.84 W/m2 from June to September, which contributed to the cooling effect. The interaction between these two processes explained the variations in the T-2 m and Rh-2 m changes. In June, a large part of the cooling effect caused by evapotranspiration enhancement was counteracted by the warming effect caused by the significant decline in albedo, resulting in a lower magnitude change in T-2 m relative to that in other months. Because both the evapotranspiration (ET) increases and solar radiation increases were larger in July than in August, the offset between the two processes led to similar T-2 m changes. However, with the relatively small decrease in LH in September, the decline in the magnitude of T-2 m is even larger than that in June, which can be attributed to the similar albedo (Figure 6).

4. Discussion

4.1. Saline-Alkali Land Development and Its Impact on Surface Parameters

By using a time series of land use datasets and a spatial overlay analysis, our study evaluated the land use changes from 1975 to 2015 and 2015 to 2019. The results showed that cropland expansion was the dominant land use change in western Jilin from 1975 to 2015, which is consistent with previous studies [18,35,53]. The application of the Three North Shelterbelt Project and Natural Forest Protection Project explained the woodland increase in western Jilin [54]. High-intensity agricultural development also brought increases in grassland degradation, wetland loss and unused saline-alkali land. Driven by economic interest and combined with better irrigation conditions, part of the rain-fed farmland has turned into paddy fields, and this is characteristic not only for western Jilin but also for all of Northeast China [55,56,57,58]. It should be noted that the total increase in paddy field area from 2015 to 2019 was even larger than that from 1975 to 2015, 25% of which was converted from saline-alkali land. As an important reserved cultivated land, unused saline-alkali land has more potential for development in the future. Previous studies have shown that saline-alkali paddy fields produce 1500 kg rice in the first reclamation year and could reach 8000 kg/ha after 5 years [59], implying that the rice yield could increase from 11,140 t to 59,414 t when the saline-alkali land in western Jilin is completely improved to paddy fields after 5 years.
In addition, we found seasonal LAI and albedo variation for both paddy fields and saline-alkali land, which is consistent with previous studies [23,60]. We also detected variable albedo decreases from May to September when saline-alkali land was converted into paddy fields; the largest decrease occurred in May and June. In comparison with albedo, the LAI increase was mainly concentrated in July and August. A lower albedo helps the surface absorb more solar radiation and has a warming effect, whereas a higher LAI enhances evapotranspiration and tends to cool the surface [3,41,61,62,63,64]. The offset between the albedo warming effect and the ET cooling effect determines the final temperature impact due to saline-alkali land improvements, indicating that the albedo and ET changes caused by the conversion from saline-alkali land to paddy fields were similar to those of afforestation [65,66,67].

4.2. Impact of Saline-Alkali Land Development on Regional Climate and Corresponding Mechanisms

Recent studies have reported that vegetation greening or vegetation growth brings significant surface cooling in China [41,48,60,67,68,69]. Cao et al. found that forest restoration attributed to the Grain to Green (GTG) programme lowered the 2-m air temperature of the Loess Plateau in summer [69]. Zhang et al. found that the cropland greenness increases in spring contributed to cooling and wetting effects, whereas the crop greenness decline in summer led to warming and drying effects on the North China Plain [48]. However, Yu et al. found that crop greening in the Northeast China Plain in the first two decades of the 21st century cooled the surface temperature in summer [68]. Our results showed that saline-alkali land improvement could accelerate surface greening and help decrease the air temperature and increase the relative humidity, which is consistent with previous studies.
In ecologically vulnerable regions, numerous studies have focused on land degradation as well as its climate implications [34,70]. They have revealed that land degradation or desertification led to notable warming over northern China. As the opposite trend to land degradation, saline-alkali land improvement brought significant cooling, which can help slow climate warming in this area. This result suggests that the energy redistribution to latent heat and sensible heat dominated the temperature impacts. In addition, our results also found that the cooling effects varied among months during the growing season. Air temperature cooling was most obvious in July and August, followed by September and June, implying that interactions between energy balance and energy partitioning vary during the growing season. Liu et al. found similar surface temperature differences between saline-alkali land and paddy fields using remote sensing observations [37]. It should be noted that their change in magnitude of the surface temperature is greater than our results, which can be explained by the following two observations. One is that the surface temperature response to land use change is usually more sensitive than the air temperature response [68]. The other is that Liu et al. [37] used pure pixels at 1 km to calculate the surface temperature differences between saline-alkali land and paddy fields, whereas our model simulations using a 10 km horizontal resolution involved mixed pixels. For this reason, we used the regression model to reconstruct the relationship between the change in T-2 m/Rh-2 m and the saline-alkali land improvement fraction (Figure 7). Zhang et al. found that the change in T2 was directly correlated with the change in green vegetation fraction (GVF) in cropland [48]. However, our results cannot be fitted by a linear equation. With the increase in the saline-alkali land fraction, T-2 m decreased at an increasing rate, particularly for pixels with a saline-alkali land improvement fraction (SALIF) greater than 10%. When the SALIF reached a threshold, the SALIF changed the dominant land use type to paddy fields and influenced all the surface parameters, including LAI and albedo.

4.3. Uncertainties and Future Works

There are a few points that should be addressed in the future. First, this study used the 24 USGS land use and land cover categories to represent the land use pattern. The saline-alkali land and paddy fields were not included in the list of the 24 types and were characterized by the surface parameters of bare/sparse vegetation and herbaceous wetlands, respectively. Although saline-alkali land is a type of bare/sparse vegetation and paddy fields are a type of herbaceous wetland, some specific properties, including albedo, LAI, soil moisture, etc. for saline-alkali land and paddy fields cannot be fully expressed by this categorization. For this reason, we used the remote sensing observed albedo and LAI to update the original values. Second, in addition to LAI and albedo, the surface parameters, including surface roughness, root depth, green vegetation fraction etc., can influence land/atmosphere interactions [48,71], which should be localized in future studies to help decrease the model uncertainties. Thus, in future works, the land use and land cover categories should be expanded in the land surface model to better represent the land surface processes and their climate effects.
Finally, our work evaluated the climate impact due to saline-alkali land improvement to paddy fields, which helped to slow climate warming and increase the relative humidity. Note that in addition to regulating climate, saline-alkali land improvement can also bring other environmental or ecological benefits by producing more rice, regulating hydrology, improving soil, increasing aesthetics and promoting tourism, all of which should be comprehensively evaluated in our next works.

5. Conclusions

Using satellite-based land use maps for 1975, 2015 and 2019, this study analysed the spatial-temporal changes in land use in western Jilin. From 1975 to 2015, grass degradation (3228 km2) and paddy field expansion (1738 km2) dominated the land use changes, whereas from 2015 to 2019, paddy fields increased by 2031 km2 and became the main land use change characteristic in this region. Interestingly, our results showed that 25% of the paddy field increase in the latter period was reclaimed from saline-alkali land, and that percentage is expected to increase in the future. The saline-alkali land and paddy fields have distinct differences in regard to LAI and albedo during the growing season. We found that saline-alkali land reclamation to paddy fields significantly increased LAI, particularly in July and August, whereas it decreased albedo, mainly in May and June.
By coupling remote sensing measurements and regional climate simulations, we also evaluated the climate impact caused by the potential saline-alkali land improvement in western Jilin. We found that saline-alkali land improvement to paddy fields can help decrease the air temperature and increase the relative humidity. The temperature and humidity effects showed different magnitudes during the growing season, which were the most significant in July and August, followed by September and June. Evapotranspiration (ET), rather than albedo, played a dominant role in regulating the regional climate, and the interaction between ET and albedo determined the temperature and relative humidity response variations during the growing season.

Supplementary Materials

The following are available online at https://www.mdpi.com/article/10.3390/rs13173407/s1, Figure S1: Pure pixels for saline-alkali land (a) and paddy field (b) at a 1 km × 1 km spatial resolution.

Author Contributions

Conceptualization, L.Y.; Investigation, J.Y.; methodology, T.L.; software, K.B.; Visualization, K.B.; validation, Y.J. and G.L.; writing—original draft preparation, L.Y.; writing—review and editing, J.Y., T.L. and L.P.; Resources, S.Z.; project administration, L.Y. All authors have read and agreed to the published version of the manuscript.

Funding

This study was supported by the National Natural Science Foundation of China (42071025), the Science and Technology Basic Resources Investigation Program of China (2017FY101301), a Strategic Priority Research Program (A) of the Chinese Academy of Sciences (XDA2003020301), Natural Science Foundation of Hainan Province (321QN187) and 14th Five-year Network Security and Informatization Plan of Chinese Academy of Sciences (WX145XQ06-07).

Institutional Review Board Statement

The study did not involve humans or animals.

Informed Consent Statement

The study did not involve humans.

Data Availability Statement

The Landsat OLI 8 images are available from GloVis website (https://glovis.usgs.gov/ (accessed on 25 June 2021)). The CCI land cover data in 2015 are available from ESA (http://www.esa-landcover-cci.org/ (accessed on 25 June 2021)). Monthly LAI and FVC data were obtained from product GLASS, which are available from University of Maryland (http://www.glass.umd.edu/ (accessed on 25 June 2021)). The ERA5 and ERA5-Land reanalysis data are obtained from ECMWF (https://cds.climate.copernicus.eu/cdsapp#!/search?type = dataset&text = ERA5 (accessed on 25 June 2021)). The meteorological observation data are obtained from the China Meteorological Data Service Center (CMDC; http://data.cma.cn/en (accessed on 25 June 2021)) and National Climate Data Center of United States (https://gis.ncdc.noaa.gov/ (accessed on 25 June 2021)).

Acknowledgments

In this section, you can acknowledge any support given which is not covered by the author contribution or funding sections. This may include administrative and technical support, or donations in kind (e.g., materials used for experiments).

Conflicts of Interest

The authors declare no conflict of interest.

References

  1. Alter, R.E.; Douglas, H.C.; Winter, J.M.; Eltahir, E.A.B. Twentieth Century Regional Climate Change During the Summer in the Central United States Attributed to Agricultural Intensification. Geophys. Res. Lett. 2018, 45, 1586–1594. [Google Scholar] [CrossRef]
  2. Friedlingstein, P.; Jones, M.W.; O’Sullivan, M.; Andrew, R.M.; Hauck, J.; Peters, G.P.; Peters, W.; Pongratz, J.; Sitch, S.; Le Quere, C.; et al. Global Carbon Budget 2019. Earth Syst. Sci. Data 2019, 11, 1783–1838. [Google Scholar] [CrossRef] [Green Version]
  3. Liang, S.L.; Kustas, W.; Schaepman-Strub, G.; Li, X.W. Impacts of Climate Change and Land Use Changes on Land Surface Radiation and Energy Budgets. IEEE J-STARS 2010, 3, 219–224. [Google Scholar] [CrossRef] [Green Version]
  4. Feddema, J.J.; Oleson, K.W.; Bonan, G.B.; Mearns, L.O.; Buja, L.E.; Meehl, G.A.; Washington, W.M. The importance of land-cover change in simulating future climates. Science 2005, 310, 1674–1678. [Google Scholar] [CrossRef] [Green Version]
  5. Mahmood, R.; Quintanar, A.I.; Conner, G.; Leeper, R.; Dobler, S.; Pielke, R.A.; Beltran-Przekurat, A.; Hubbard, K.G.; Niyogi, D.; Bonan, G.; et al. Impacts of Land Use/Land Cover Change on Climate and Future Research Priorities. Bull. Am. Meteorol. Soc. 2010, 91, 37–46. [Google Scholar] [CrossRef]
  6. Euskirchen, E.S.; McGuire, A.D.; Kicklighter, D.W.; Zhuang, Q.; Clein, J.S.; Dargaville, R.J.; Dye, D.G.; Kimball, J.S.; McDonald, K.C.; Melillo, J.M.; et al. Importance of recent shifts in soil thermal dynamics on growing season length, productivity, and carbon sequestration in terrestrial high-latitude ecosystems. Glob. Chang. Biol. 2006, 12, 731–750. [Google Scholar] [CrossRef] [Green Version]
  7. Kalnay, E.; Cai, M. Impact of urbanization and land-use change on climate. Nature 2003, 423, 528–531. [Google Scholar] [CrossRef]
  8. Pielke, R.A., Sr.; Marland, G.; Betts, R.A.; Chase, T.N.; Eastman, J.L.; Niles, J.O.; Niyogi, D.D.; Running, S.W. The influence of land-use change and landscape dynamics on the climate system: Relevance to climate-change policy beyond the radiative effect of greenhouse gases. Philos. Trans. R. Soc. London. Ser. A Math. Phys. Eng. Sci. 2002, 360, 1705–1719. [Google Scholar] [CrossRef]
  9. Seneviratne, S.I.; Luthi, D.; Litschi, M.; Schar, C. Land-atmosphere coupling and climate change in Europe. Nature 2006, 443, 205–209. [Google Scholar] [CrossRef]
  10. Baldocchi, D. Managing land and climate. Nat. Clim. Chang. 2014, 4, 330–331. [Google Scholar] [CrossRef]
  11. Bright, R.M.; Davin, E.; O’Halloran, T.; Pongratz, J.; Zhao, K.G.; Cescatti, A. Local temperature response to land cover and management change driven by non-radiative processes. Nat. Clim. Chang. 2017, 7, 296–302. [Google Scholar] [CrossRef]
  12. Li, F.; Zhou, M.J.; Shao, J.Q.; Chen, Z.H.; Wei, X.L.; Yang, J.C. Maize, wheat and rice production potential changes in China under the background of climate change. Agric. Syst. 2020, 182, 102853. [Google Scholar] [CrossRef]
  13. Morton, J.F. The impact of climate change on smallholder and subsistence agriculture. Proc. Natl. Acad. Sci. USA 2007, 104, 19680–19685. [Google Scholar] [CrossRef] [Green Version]
  14. Piao, S.L.; Ciais, P.; Huang, Y.; Shen, Z.H.; Peng, S.S.; Li, J.S.; Zhou, L.P.; Liu, H.Y.; Ma, Y.C.; Ding, Y.H.; et al. The impacts of climate change on water resources and agriculture in China. Nature 2010, 467, 43–51. [Google Scholar] [CrossRef] [PubMed]
  15. Webb, N.P.; Marshall, N.A.; Stringer, L.C.; Reed, M.S.; Chappell, A.; Herrick, J.E. Land degradation and climate change: Building climate resilience in agriculture. Front. Ecol. Environ. 2017, 15, 450–459. [Google Scholar] [CrossRef]
  16. Foley, J.A.; DeFries, R.; Asner, G.P.; Barford, C.; Bonan, G.; Carpenter, S.R.; Chapin, F.S.; Coe, M.T.; Daily, G.C.; Gibbs, H.K.; et al. Global consequences of land use. Science 2005, 309, 570–574. [Google Scholar] [CrossRef] [PubMed] [Green Version]
  17. Turner, B.L.; Lambin, E.F.; Reenberg, A. The emergence of land change science for global environmental change and sustainability. Proc. Natl. Acad. Sci. USA 2007, 104, 20666–20671. [Google Scholar] [CrossRef] [Green Version]
  18. Liu, J.Y.; Zhang, Z.X.; Xu, X.L.; Kuang, W.H.; Zhou, W.C.; Zhang, S.W.; Li, R.D.; Yan, C.Z.; Yu, D.S.; Wu, S.X.; et al. Spatial patterns and driving forces of land use change in China during the early 21st century. J. Geogr. Sci. 2010, 20, 483–494. [Google Scholar] [CrossRef]
  19. Kuang, W.; Du, G.; Lu, D.; Dou, Y.; Li, X.; Zhang, S.; Chi, W.; Dong, J.; Chen, G.; Yin, Z.; et al. Global observation of urban expansion and land-cover dynamics using satellite big-data. Sci. Bull. 2021, 66, 297–300. [Google Scholar] [CrossRef]
  20. Macedo, M.N.; DeFries, R.S.; Morton, D.C.; Stickler, C.M.; Galford, G.L.; Shimabukuro, Y.E. Decoupling of deforestation and soy production in the southern Amazon during the late 2000s. Proc. Natl. Acad. Sci. USA 2012, 109, 1341–1346. [Google Scholar] [CrossRef] [PubMed] [Green Version]
  21. Morton, D.C.; DeFries, R.S.; Shimabukuro, Y.E.; Anderson, L.O.; Arai, E.; Espirito-Santo, F.D.; Freitas, R.; Morisette, J. Cropland expansion changes deforestation dynamics in the southern Brazilian Amazon. Proc. Natl. Acad. Sci. USA 2006, 103, 14637–14641. [Google Scholar] [CrossRef] [Green Version]
  22. Chen, C.; Park, T.; Wang, X.; Piao, S.; Xu, B.; Chaturvedi, R.K.; Fuchs, R.; Brovkin, V.; Ciais, P.; Fensholt, R.; et al. China and India lead in greening of the world through land-use management. Nat. Sustain. 2019, 2, 122–129. [Google Scholar] [CrossRef] [PubMed]
  23. Cooley, H.S.; Riley, W.J.; Torn, M.S.; He, Y. Impact of agricultural practice on regional climate in a coupled land surface mesoscale model. J. Geophys. Res.-Atmos 2005, 110. [Google Scholar] [CrossRef] [Green Version]
  24. Sakai, R.K.; Fitzjarrald, D.R.; Moraes, O.L.L.; Staebler, R.M.; Acevedo, O.C.; Czikowsky, M.J.; Da Silva, R.; Brait, E.; Miranda, V. Land-use change effects on local energy, water, and carbon balances in an Amazonian agricultural field. Glob. Chang. Biol. 2004, 10, 895–907. [Google Scholar] [CrossRef]
  25. Bonan, G.B. Effects of land use on the climate of the United States. Clim. Chang. 1997, 37, 449–486. [Google Scholar] [CrossRef]
  26. Diffenbaugh, N.S. Influence of modern land cover on the climate of the United States. Clim. Dyn. 2009, 33, 945–958. [Google Scholar] [CrossRef] [Green Version]
  27. Kueppers, L.M.; Snyder, M.A.; Sloan, L.C. Irrigation cooling effect: Regional climate forcing by land-use change. Geophys. Res. Lett. 2007, 34. [Google Scholar] [CrossRef] [Green Version]
  28. Thiery, W.; Visser, A.J.; Fischer, E.M.; Hauser, M.; Hirsch, A.L.; Lawrence, D.M.; Lejeune, Q.; Davin, E.L.; Seneviratne, S.I. Warming of hot extremes alleviated by expanding irrigation. Nat. Commun. 2020, 11, 1–7. [Google Scholar] [CrossRef] [PubMed] [Green Version]
  29. Mishra, V.; Ambika, A.K.; Asoka, A.; Aadhar, S.; Buzan, J.; Kumar, R.; Huber, M. Moist heat stress extremes in India enhanced by irrigation. Nat. Geosci. 2020, 13, 722–728. [Google Scholar] [CrossRef]
  30. Lamptey, B.L.; Barron, E.J.; Pollard, D. Impacts of agriculture and urbanization on the climate of the Northeastern United States. Glob. Planet Chang. 2005, 49, 203–221. [Google Scholar] [CrossRef]
  31. Liu, T.; Zhang, S.; Yu, L.; Bu, K.; Yang, J.; Chang, L. Simulation of regional temperature change effect of land cover change in agroforestry ecotone of Nenjiang River Basin in China. Theor. Appl. Climatol. 2017, 128, 971–981. [Google Scholar] [CrossRef]
  32. Wang, Z.; Liu, Z.; Song, K.; Zhang, B.; Zhang, S.; Liu, D.; Ren, C.; Yang, F. Land use changes in Northeast China driven by human activities and climatic variation. Chin. Geogr. Sci. 2009, 19, 225–230. [Google Scholar] [CrossRef]
  33. Zhang, S.W.; Zhang, Y.Z.; Li, Y.; Chang, L.P. Temporal and Spatial Characteristics of Land Use/Cover in Northeast China; Science Press: Beijing, China, 2006. [Google Scholar]
  34. Zhang, J.; Dong, W.; Fu, C. Impact of land surface degradation in northern China and southern Mongolia on regional climate. Chin. Sci. Bull. 2005, 50, 75–81. [Google Scholar] [CrossRef]
  35. Li, F.; Shuwen, Z.; Jiuchun, Y.; Kun, B.; Qing, W.; Junmei, T.; Liping, C. The effects of population density changes on ecosystem services value: A case study in Western Jilin, China. Ecol. Indic. 2016, 61, 328–337. [Google Scholar] [CrossRef]
  36. Ma, S.; Liu, W.; Chang, G. Three-Dimensional Improvement Method for Saline-Alkali Land, Involves Planting Saline-Alkali-Tolerant Rice in Saline-Alkali Land, Crushing and Burying Harvested Straw in Saline-Alkali Land, after Harvesting Saline-Alkali-Tolerant Rice. China Patent No CN112189394-A, 8 January 2021. [Google Scholar]
  37. Liu, T.; Yu, L.; Zhang, S. Land Surface Temperature Response to Irrigated Paddy Field Expansion: A Case Study of Semi-arid Western Jilin Province, China. Sci. Rep. 2019, 9, 5278. [Google Scholar] [CrossRef]
  38. Liang, S. Recent algorithm developments in quantitative remote sensing of land surfaces. In Proceedings of the 2003 IEEE International Geoscience and Remote Sensing, Toulouse, France, 21–25 July 2003; pp. 558–560. [Google Scholar]
  39. Yang, J.; Gong, P.; Fu, R.; Zhang, M.; Chen, J.; Liang, S.; Xu, B.; Shi, J.; Dickinson, R. The role of satellite remote sensing in climate change studies. Nat. Clim. Chang. 2013, 3, 875–883. [Google Scholar] [CrossRef]
  40. Song, X.; Hansen, M.C.; Stehman, S.V.; Potapov, P.V.; Tyukavina, A.; Vermote, E.F.; Townshend, J.R. Global land change from 1982 to 2016. Nature 2018, 560, 639–643. [Google Scholar] [CrossRef]
  41. Peng, S.; Piao, S.; Zeng, Z.; Ciais, P.; Zhou, L.; Li, L.; Myneni, R.B.; Yin, Y.; Zeng, H. Afforestation in China cools local land surface temperature. Proc. Natl. Acad. Sci. USA 2014, 111, 2915–2919. [Google Scholar] [CrossRef] [PubMed] [Green Version]
  42. Zhou, D.; Li, D.; Sun, G.; Zhang, L.; Liu, Y.; Hao, L. Contrasting effects of urbanization and agriculture on surface temperature in eastern China. J. Geophys. Res.-Atmos. 2016, 121, 9597–9606. [Google Scholar] [CrossRef] [Green Version]
  43. Davin, E.L.; Maisonnave, E.; Seneviratne, S.I. Is land surface processes representation a possible weak link in current Regional Climate Models? Environ. Res. Lett. 2016, 11, 074027. [Google Scholar] [CrossRef]
  44. Jin, J.M.; Miller, N.L.; Schlegel, N. Sensitivity Study of Four Land Surface Schemes in the WRF Model. Adv. Meteorol. 2010, 2010, 1–11. [Google Scholar] [CrossRef] [Green Version]
  45. Lakshmi, V.; Hong, S.; Small, E.E.; Chen, F. The influence of the land surface on hydrometeorology and ecology: New advances from modeling and satellite remote sensing. Hydrol. Res. 2011, 42, 95–112. [Google Scholar] [CrossRef] [Green Version]
  46. Sellers, P.J.; Dickinson, R.E.; Randall, D.A.; Betts, A.K.; Hall, F.G.; Berry, J.A.; Collatz, G.J.; Denning, A.S.; Mooney, H.A.; Nobre, C.A.; et al. Modeling the exchanges of energy, water, and carbon between continents and the atmosphere. Science 1997, 275, 502–509. [Google Scholar] [CrossRef] [PubMed] [Green Version]
  47. Zhang, X.; Xiong, Z.; Zhang, X.; Shi, Y.; Liu, J.; Shao, Q.; Yan, X. Using multi-model ensembles to improve the simulated effects of land use/cover change on temperature: A case study over northeast China. Clim. Dyn. 2016, 46, 765–778. [Google Scholar] [CrossRef]
  48. Zhang, X.; Tang, Q.; Zheng, J.; Ge, Q. Warming/cooling effects of cropland greenness changes during 1982-2006 in the North China Plain. Environ. Res. Lett. 2013, 8, 024038. [Google Scholar] [CrossRef]
  49. Case, J.L.; Crosson, W.L.; Kumar, S.V.; Lapenta, W.M.; Peters-Lidard, C.D. Impacts of High-Resolution Land Surface Initialization on Regional Sensible Weather Forecasts from the WRF Model. J. Hydrometeorol. 2008, 9, 1249–1266. [Google Scholar] [CrossRef]
  50. Miller, J.; Barlage, M.; Zeng, X.B.; Wei, H.L.; Mitchell, K.; Tarpley, D. Sensitivity of the NCEP/Noah land surface model to the MODIS green vegetation fraction data set. Geophys. Res. Lett. 2006, 33. [Google Scholar] [CrossRef]
  51. Yu, L.; Xue, Y.; Diallo, I. Vegetation greening in China and its effect on summer regional climate. Sci. Bull. 2021, 66, 13–17. [Google Scholar] [CrossRef]
  52. Skamarock, W.C.; Klemp, J.B.; Dudhia, J.; Gill, D.; Barker, D.M.; Duda, M.G.; Huang, X.; Wang, W.; Powers, J.G. A Description of the Advanced Research WRF Version 3. NCAR Technical Note, NCAR/TN-475+STR; National Center for Atmospheric Research: Boulder, CO, USA, 2008. [Google Scholar]
  53. Liu, J.; Kuang, W.; Zhang, Z.; Xu, X.; Qin, Y.; Ning, J.; Zhou, W.; Zhang, S.; Li, R.; Yan, C.; et al. Spatiotemporal characteristics, patterns, and causes of land-use changes in China since the late 1980s. J. Geogr. Sci. 2014, 24, 195–210. [Google Scholar] [CrossRef]
  54. Cai, D.; Ge, Q.; Wang, X.; Liu, B.; Goudie, A.; Hu, S. Contributions of ecological programs to vegetation restoration in arid and semiarid China. Environ. Res. Lett. 2020, 15, 114046. [Google Scholar] [CrossRef]
  55. Yu, L.; Liu, T. The Impact of Artificial Wetland Expansion on Local Temperature in the Growing Season—The Case Study of the Sanjiang Plain, China. Remote Sens. 2019, 11, 2915. [Google Scholar] [CrossRef] [Green Version]
  56. Liu, T.; Yu, L.; Zhang, S. Impacts of Wetland Reclamation and Paddy Field Expansion on Observed Local Temperature Trends in the Sanjiang Plain of China. J. Geophys. Res.-Earth 2019, 124, 414–426. [Google Scholar] [CrossRef]
  57. Ning, J.; Liu, J.; Kuang, W.; Xu, X.; Zhang, S.; Yan, C.; Li, R.; Wu, S.; Hu, Y.; Du, G.; et al. Spatiotemporal patterns and characteristics of land-use change in China during 2010–2015. J. Geogr. Sci. 2018, 28, 547–562. [Google Scholar] [CrossRef] [Green Version]
  58. Yan, F.; Yu, L.; Yang, C.; Zhang, S. Paddy Field Expansion and Aggregation since the Mid-1950s in a Cold Region and Its Possible Causes. Remote Sens. 2016, 10, 384. [Google Scholar] [CrossRef] [Green Version]
  59. Zhang, M. Research on the modified mechanism and key technology by Plangting paddy in soda saline alkali soil in Western Jilin Province. Ph.D. Thesis, Jilin Agricultural University, Changchun, China, 2015. (In Chinese). [Google Scholar]
  60. Yu, L.; Liu, T.; Zhang, S. Temporal and Spatial Changes in Snow Cover and the Corresponding Radiative Forcing Analysis in Siberia from the 1970s to the 2010s. Adv. Meteorol. 2017, 2017, 1–11. [Google Scholar] [CrossRef] [Green Version]
  61. Shen, M.; Piao, S.; Jeong, S.; Zhou, L.; Zeng, Z.; Ciais, P.; Chen, D.; Huang, M.; Jin, C.; Li, L.; et al. Evaporative cooling over the Tibetan Plateau induced by vegetation growth. Proc. Natl. Acad. Sci. USA 2015, 112, 9299–9304. [Google Scholar] [CrossRef] [PubMed] [Green Version]
  62. Zeng, Z.; Piao, S.; Li, L.; Zhou, L.; Ciais, P.; Wang, T.; Li, Y.; Lian, X.; Wood, E.F.; Friedlingstein, P.; et al. Climate mitigation from vegetation biophysical feedbacks during the past three decades. Nat. Clim. Chang. 2017, 7, 432–436. [Google Scholar] [CrossRef]
  63. Barnes, C.A.; Roy, D.P. Radiative forcing over the conterminous United States due to contemporary land cover land use albedo change. Geophys. Res. Lett. 2008, 35. [Google Scholar] [CrossRef] [Green Version]
  64. Bright, R.M.; Zhao, K.; Jackson, R.B.; Cherubini, F. Quantifying surface albedo and other direct biogeophysical climate forcings of forestry activities. Glob. Chang. Biol. 2015, 21, 3246–3266. [Google Scholar] [CrossRef]
  65. Huang, L.; Zhai, J.; Liu, J.; Sun, C. The moderating or amplifying biophysical effects of afforestation on CO2-induced cooling depend on the local background climate regimes in China. Agric. For. Meteorol. 2018, 260, 193–203. [Google Scholar] [CrossRef]
  66. Betts, R.A. Climate Science Afforestation cools more or less. Nat. Geosci. 2011, 4, 504–505. [Google Scholar] [CrossRef]
  67. Li, Y.; Piao, S.L.; Chen, A.P.; Wang, X.H.; Ciais, P.; Li, L.Z.X. Local and teleconnected temperature effects of afforestation and vegetation greening in China. Natl. Sci. Rev. 2020, 7, 897–912. [Google Scholar] [CrossRef] [Green Version]
  68. Yu, L.; Liu, Y.; Liu, T.; Yan, F. Impact of recent vegetation greening on temperature and precipitation over China. Agric. For. Meteorol. 2020, 295, 108197. [Google Scholar] [CrossRef]
  69. Cao, Q.; Wu, J.; Yu, D.; Wang, W. The biophysical effects of the vegetation restoration program on regional climate metrics in the Loess Plateau, China. Agric. For. Meteorol. 2019, 268, 169–180. [Google Scholar] [CrossRef]
  70. Xue, Y. The impact of desertification in the Mongolian and the Inner Mongolian grassland on the regional climate. J. Clim. 1996, 9, 2173–2189. [Google Scholar] [CrossRef]
  71. Liu, Y.; Guo, W.; Huang, H.; Ge, J.; Qiu, B. Estimating global aerodynamic parameters in 1982–2017 using remote-sensing data and a turbulent transfer model. Remote Sens. Environ. 2021, 260, 112428. [Google Scholar] [CrossRef]
Figure 1. Geographic location of west Jilin.
Remotesensing 13 03407 g001
Figure 2. The land cover pattern for domain 1 (D01) and domain 2 (D02) in our experiments.
Remotesensing 13 03407 g002
Figure 3. Land use maps of west Jilin from 1975 (a) and 2015 (b).
Remotesensing 13 03407 g003
Figure 4. The paddy fields increase in western Jilin from 2015 to 2019.
Remotesensing 13 03407 g004
Figure 5. Spatial distribution of albedo (a) and LAI (b) for the growing season (June to September) across western Jilin.
Remotesensing 13 03407 g005
Figure 6. The seasonal variations in albedo (a) and LAI (b) for paddy fields and saline-alkali land in western Jilin.
Remotesensing 13 03407 g006
Figure 7. Scatter plots of cell-based changes (SEN minus CTL) in the improved saline-alkali land fraction and changes in simulated (a) surface air temperature (T-2 m) and (b) relative humidity (Rh-2 m) for JJAS (June-July August-September) over western Jilin.
Remotesensing 13 03407 g007
Figure 8. Differences (SEN-CTL) in simulated regional mean air temperature and relative humidity for the grids with dominant land use types converted from saline-alkali land to wetland for June, July, August, and September in western Jilin.
Remotesensing 13 03407 g008
Figure 9. Differences (SEN-CTL) in simulated regional means of (a) incoming shortwave radiation (SWDOWN), outcoming shortwave radiation (SWUP), incoming longwave radiation (LWDOWN), outcoming longwave radiation (LWUP), (b) net radiation (NetR), latent heat flux (LH), sensible heat flux (SH), and ground heat flux (GRDFLX) for the grids with dominant land use type converted from saline-alkali land to wetland for June, July, August, September of western Jilin. The error bar is the standard deviation of changes in each variable.
Remotesensing 13 03407 g009
Table 1. The regional monthly mean albedo and LAI for paddy fields. (When the saline-alkali land was converted to the paddy field, the albedo and LAI of the saline-alkali land were replaced by the corresponding values shown in this table).
Paddy FieldMayJuneJulyAugustSeptemberOctober
Albedo0.080.090.180.190.200.21
LAI0.171.234.203.201.150.29
Table 2. Transition matrix of land use categories from 1975 to 2015 in western Jilin (km2).
2015
1975WoodlandGrasslandWaterBuilt-up LandBarren LandSaline-Alkali LandWetlandPaddy FieldDry FarmlandTotal
Woodland1309.8256.50.58.36.139.115.26.9819.02461.3
Grassland892.63801.131.632.356.21273.5152.8174.11415.77830.1
Water1.429.11801.213.11.289.9176.215.451.02178.4
Built-up land1.71.10.31316.40.21.70.34.065.21390.8
Barren land4.87.80.10.3181.70.311.50.09.7216.2
Saline-alkali land3.8240.395.555.31.25798.5117.3102.591.16505.5
Wetland12.7155.731.78.60.3150.01982.2573.6198.03112.6
Paddy field0.21.45.313.50.00.10.0763.736.3820.3
Dry farmland551.0109.612.6379.60.873.820.7917.820,316.522,382.3
Total2777.94602.41978.61827.3247.77426.82476.22557.923,002.546,897.3
Publisher’s Note: MDPI stays neutral with regard to jurisdictional claims in published maps and institutional affiliations.

