Technical Note

MARE: Self-Supervised Multi-Attention REsu-Net for Semantic Segmentation in Remote Sensing

by
Valerio Marsocci
1,*,
Simone Scardapane
2 and
Nikos Komodakis
3
1
Department of Computer, Control and Management Engineering Antonio Ruberti (DIAG), Sapienza University of Rome, 00185 Rome, Italy
2
Department of Information Engineering, Electronics and Telecommunication, Sapienza University of Rome, 00184 Rome, Italy
3
Computer Science Department, University of Crete, 70013 Heraklion, Greece
*
Author to whom correspondence should be addressed.
Remote Sens. 2021, 13(16), 3275; https://doi.org/10.3390/rs13163275
Submission received: 5 July 2021 / Revised: 6 August 2021 / Accepted: 14 August 2021 / Published: 19 August 2021
(This article belongs to the Special Issue Big Data Analytics for Secure and Smart Environmental Services)

Abstract

:
Scene understanding of satellite and aerial images is a pivotal task in various remote sensing (RS) practices, such as land cover and urban development monitoring. In recent years, neural networks have become a de-facto standard in many of these applications. However, semantic segmentation still remains a challenging task. With respect to other computer vision (CV) areas, in RS large labeled datasets are not very often available, due to their large cost and to the required manpower. On the other hand, self-supervised learning (SSL) is earning more and more interest in CV, reaching state-of-the-art in several tasks. In spite of this, most SSL models, pretrained on huge datasets like ImageNet, do not perform particularly well on RS data. For this reason, we propose a combination of a SSL algorithm (particularly, Online Bag of Words) and a semantic segmentation algorithm, shaped for aerial images (namely, Multistage Attention ResU-Net), to show new encouraging results (i.e., 81.76% mIoU with ResNet-18 backbone) on the ISPRS Vaihingen dataset.

Graphical Abstract

1. Introduction

In a wide range of real-world applications, varying from urban planning to precision agriculture, including land cover, infrastructure management and so on, semantic segmentation of aerial and remote sensing (RS) imageries is a pivotal task, which continues to attract great interest [1]. Semantic labeling, that consists in assigning a category to every pixel of the image, is particularly challenging in urban applications [2,3]. In fact, the complicated urban structure leads to interactions among objects, causing occlusions, shadows, and other noisy effects, which worsen the radiometric information of the images [4]. Moreover, artificial manufacts have at least two main issues. On the one hand, objects belonging to different classes could retrieve very similar radiometric information (e.g., low vegetation and trees, or roads and pavements). On the other hand, manufacts of the same semantic class can present very different characteristics, such as color, texture, and shape [5]. Eventually, it could be asserted that semantic segmentation in urban scenes is characterized by a strong intra-class variance and a reduced inter-class one [6,7].
In recent years, deep learning (DL) methods reached state-of-the-art, surpassing traditional methods, in several computer vision (CV) tasks. Many of these find large application also in RS, such as object detection, instance segmentation, and semantic labeling. It is unanimously recognized that DL methods have high generalization capabilities, succeeding in extracting robust and efficient features [8,9]. However, supervised training of these models depends on annotations. More than in other fields, for aerial and RS images, it is difficult to rely on a labeled dataset, in light of the high cost and the amount of effort and time that are required, along with a well founded expertise.
The advent of self-supervised learning (SSL) could handle this problem, reducing the amount of annotated data needed [10,11,12]. The goal of SSL is to learn an effective visual representation of the input using a massive quantity of data provided without any label [11,13]. To solve this task in CV, we can see the problem as the need to build a well-structured and relevant set of features, able to represent an object in a fruitful way for several downstream tasks. Thus, intelligent systems need not to be structured a priori, but should instead learn about the conformation of the provided data in an unsupervised way [14]. In particular, the majority of unsupervised approaches can be divided into two classes: generative and discriminative. Generative strategies learn to generate pixels in the input space. However, pixel-level generation can be computationally expensive. Discriminative approaches are based on learning the representation of the unlabeled data to solve downstream tasks. Among these techniques, in contrastive learning the goal is to generate a representation of the input, such that similar instances are near each other and far from dissimilar ones [13,15]. Other approaches fulfill the goal of reconstructing a target image, after perturbing it [16,17]. Essentially, SSL is earning more and more interest in CV, reaching state-of-the-art performances in several tasks.
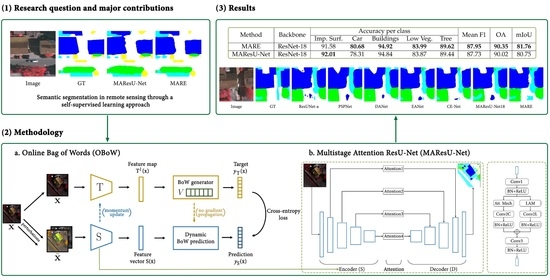
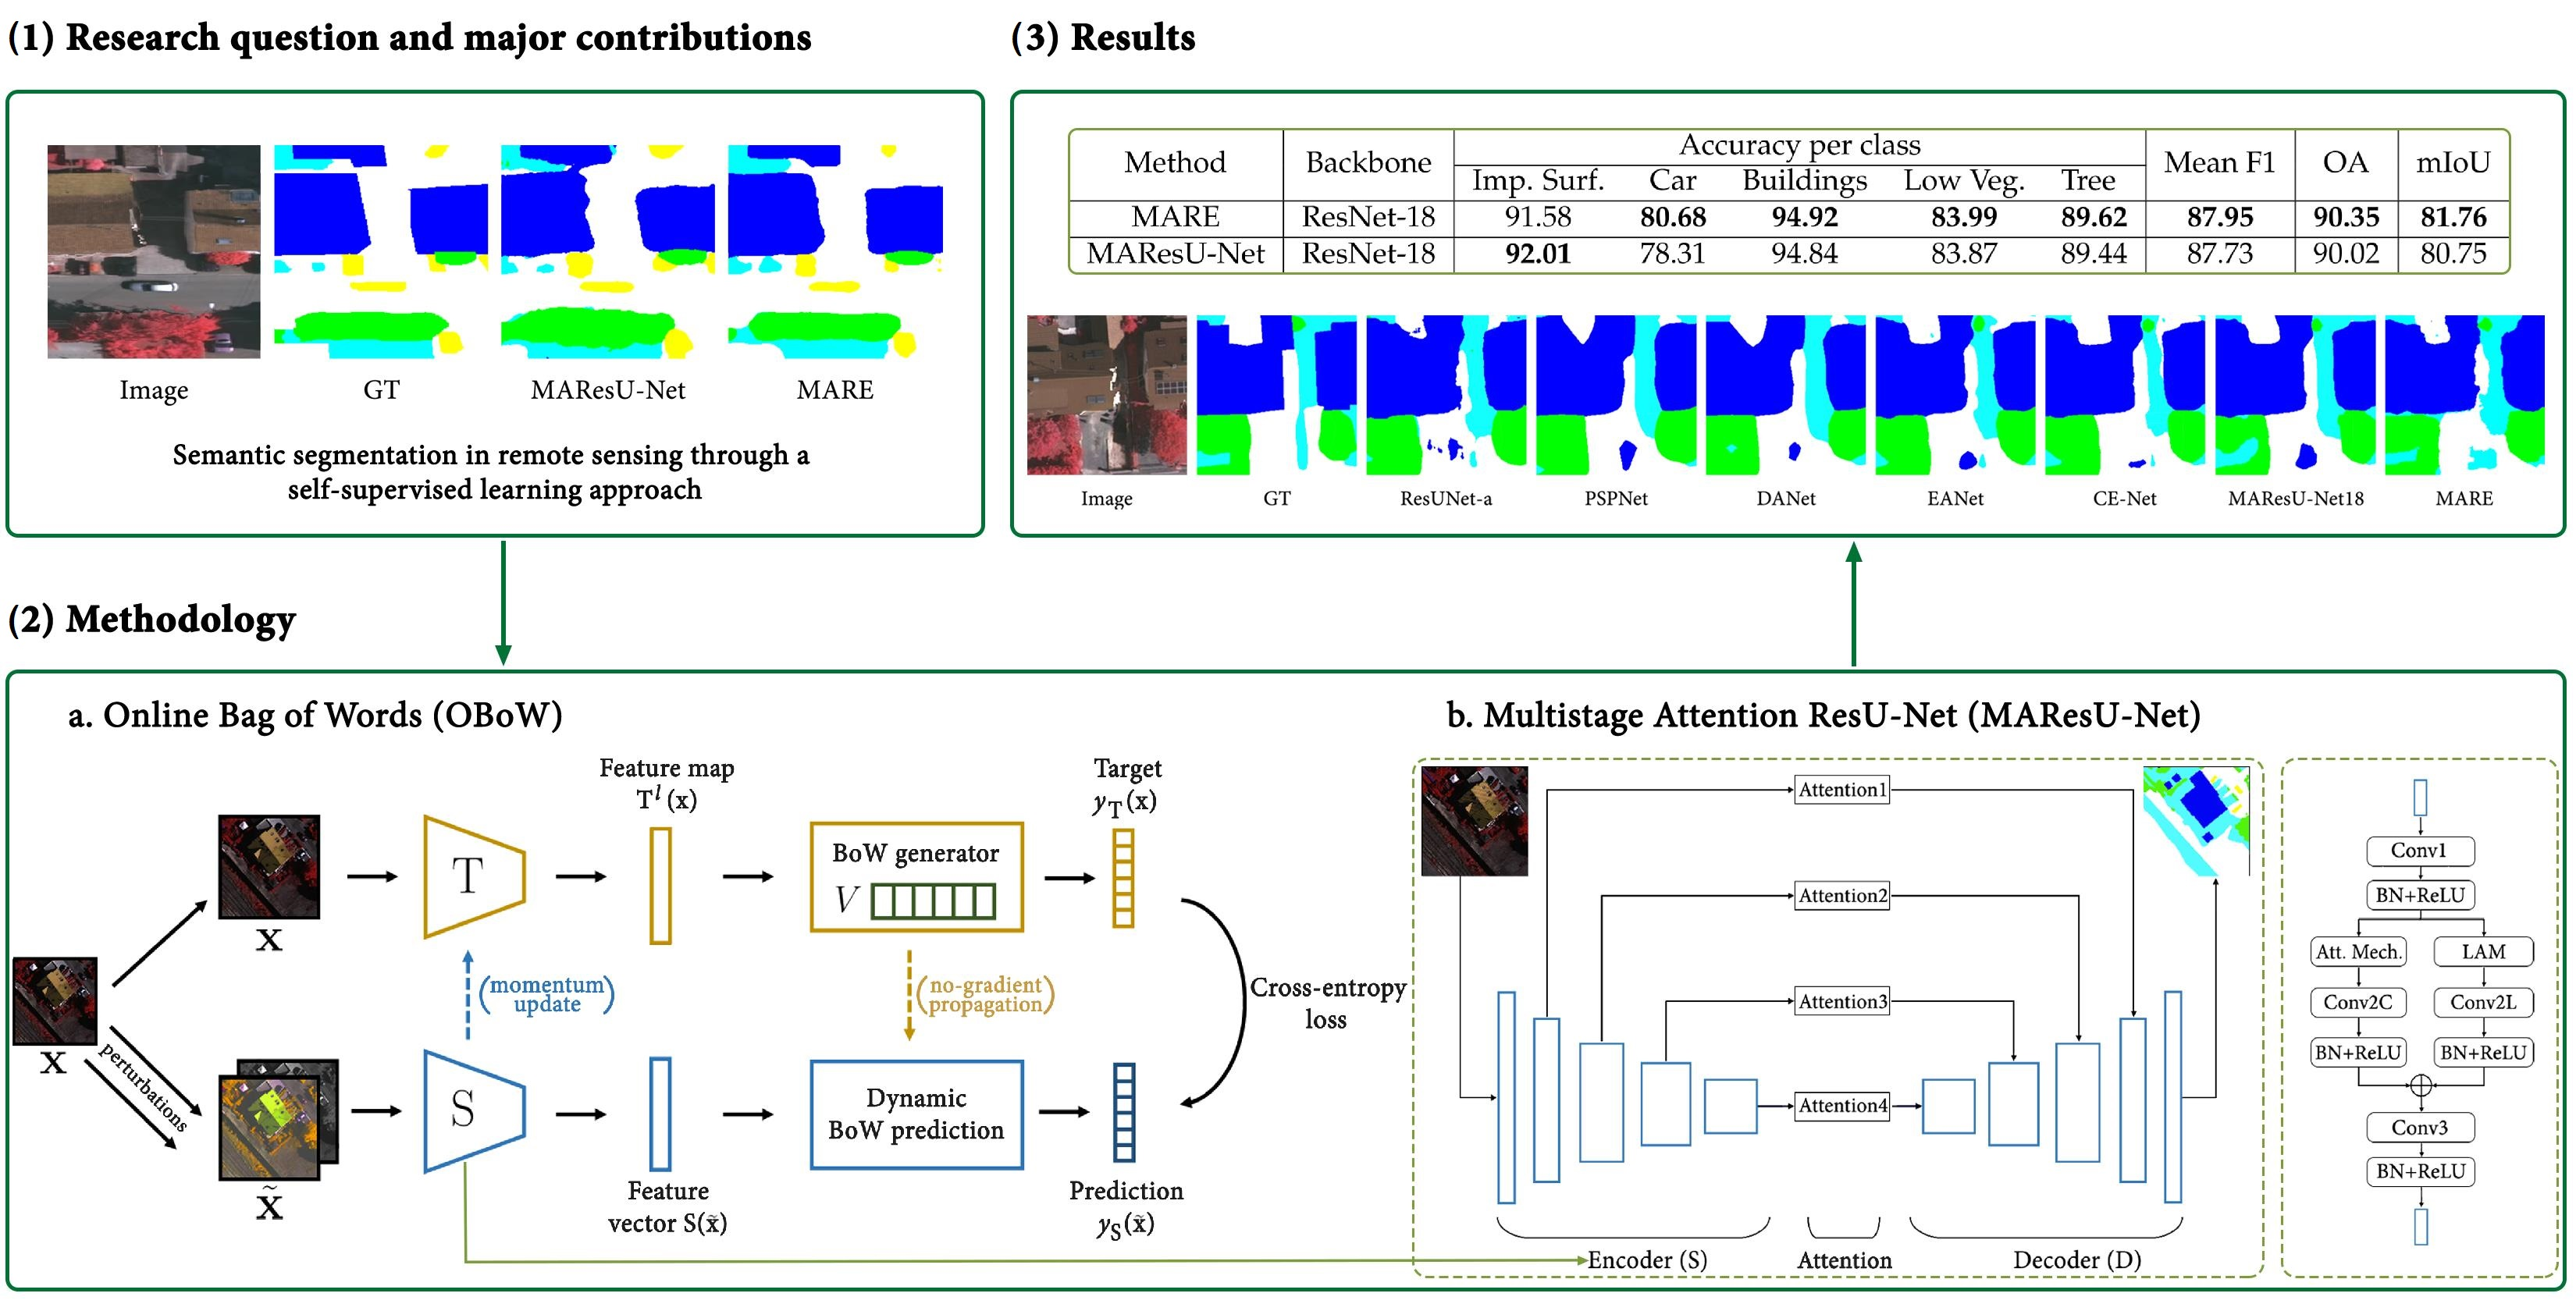
In this technical letter, we propose a new approach, that combines a SSL algorithm (that is, online bag of words [12]) and a semantic segmentation algorithm shaped for aerial images (properly, Multistage Attention ResU-Net [18]), based on a linear attention mechanism (LAM). Particularly, we decided to train the encoder of the Multistage Attention ResU-Net (MAResU-Net), that is a ResNet-18 [19], with the Online Bag of Words (OBoW) method, given its high capability of learning visual representations, that are effective for several downstream task. This characteristic is fundamental, because most of available SSL pretrained models do not perform particularly well on RS data. In fact, due to the problems that we addressed previously, aerial and RS imageries have peculiar characteristics, different from the images taken with close-range cameras. Indeed, unlike, for example, the ImageNet dataset, the RS images present an enormous amount of details to look after, to correctly segment the objects. Moreover, in addition to the aforementioned variance issues, the shapes, the colors and the scale of the objects are crucial in this task [20]. In particular, the edges must have high consideration, as they are changeable and labile much more than in close-range camera images [7].
On the other hand, attention exploits the ability of grasping long-term dependencies of the feature maps, exploring global contextual information of the data. Dot-product attention mechanism, generating response at each pixel by weighting features in the previous layers, expands the receptive field to the whole input feature maps, reaching state-of-the-art performance in many fields [21,22,23]. However, the memory and computational overhead of the dot-product attention mechanism increases quadratically along with the spatio-temporal size of the input. To alleviate the huge computational costs, ref [24] reduced the complexity from O ( N 2 ) to O ( N N ) ; ref [25] to O ( N log N ) ; and [18,26,27] to O ( N ) .
To sum up, the three major contributions offered by the proposed technical letter are the following:
  • we show how the SSL approach, designed for generic CV downstream tasks, performs well even on more sectorial areas of image analysis, such as RS;
  • we highlight that SSL methods are effective to reduce dependence on well-annotated dataset, currently required to reach high performances in RS tasks, since they require high costs and great need of time, effort, and knowledge to be produced;
  • we obtain the best results in literature for the semantic segmentation of the ISPRS Vaihingen benchmark dataset [28] with ResNet-18 as encoder. This confirms an excellent trade-off between the number of parameters and the performance of the model.
The remainder of this technical note is organized as follows: in Section 2 the related works, divided in three subsections, concerning, respectively, semantic segmentation (Section 2.1), semantic segmentation for aerial and RS imageries (Section 2.2) and SSL (Section 2.3), are illustrated; in Section 3 OBoW and MAResU-Net methodologies are briefly explained; in Section 4 the experimental results and the ablation studies are presented. Finally, in Section 5, a discussion of the results, including the limitations of the proposed strategy, and further developments are dispensed.

2. Related Works

2.1. Semantic Segmentation

Fully convolutional network (FCN) methods have experimented huge progresses in semantic segmentation, following mainly two approaches. On the one hand, dilated convolutions [29,30] have established a strong capability to retain the receptive field-of-view and enhance the performance of the backbone. On the other hand, the encoder–decoder architectures utilize an encoder to obtain multi-level feature maps, which are then incorporated into the final prediction through a decoder [31]. These two strategies can also be combined. An effective example is PSPNet [32], which adopts a pyramid parsing module that exploits global context information by different region-based context aggregations. The local and global clues, concatenated together, make the final prediction more performing.
In addition, several architectures, based on the attention mechanism, often combined with what has been described so far, have been proposed. For example, DANet [23] integrates local features with global dependencies, in an adaptive way. Specifically, the architecture provides two types of attention modules on top of traditional dilated FCN, which model the semantic inter-dependencies, respectively, in spatial and channel dimensions, regardless of their distances. The outputs of these two attention modules are finally summed for the prediction. Other examples of this set of architectures are: PSANet [33], OCNet [34], and CFNet [35].

2.2. Semantic Segmentation for Remote Sensing and Aerial Images

In the last few years, several methodologies specifically shaped for RS images have been proposed. These methods succeed in reaching better performance on this specific task, thanks to their capability of taking in account the variable shapes, scale and edges of the represented objects. In fact, in light of the massive quantity of details in a RS image, the CV semantic segmentation methods often fragment one object into pieces, or confuse adjacent objects, thus failing to segment these objects correctly [20].
Particularly, ResUNet-a [7] uses a U-Net encoder-decoder structure, in combination with residual connections, dilated convolutions, pyramid scene parsing pooling and multi-tasking inference. ResUNet-a infers sequentially the boundaries of the objects, the distance transformation of the segmentation mask, the segmentation mask, and a colored reconstruction of the input. In addition, the authors introduce a novel loss function, modifying the dice loss.
EaNet [20] incorporates a large kernel pyramid pooling module to capture multi-scale context with robust continuous feature relations. An edge-aware loss function (EA loss), based on the dice loss, is presented to guide the EaNet to refine both the pixel-level and context-level information directly from the semantic segmentation prediction.
CE-Net [36] mainly consists of three parts: a ResNet encoder, a context extractor and a decoder module. The context extractor module is formed by a novel dense dilated convolution block and a residual multi-kernel pooling block.
A solution conceived through the use of a transformer has also been recently proposed. Ref. [37] proposes the Swin Transformer [38] as the backbone to extract the context information and designs a decoder of densely connected feature aggregation modules to produce the segmentation map, after restoring the resolution of the input.
All the presented architectures are supervised, that means that are in need of labeled data. The only effort in the direction of SSL applied to RS is presented in [39]. Namely shaped for change detection, the authors propose a self-supervised approach capable to capture better representation for semantic understanding of RS images. Specifically, the network, imitating the discriminator of a generative adversarial network (GAN), is asked to identify different sample patches taken from two temporal images.

2.3. Self-Supervised Learning

Initially, most SSL methods were based on pre-text tasks. The strategies were several, such as patch context [40,41], in-painting [42], colorization [43,44], jigsaw puzzles [45], noise [46], generation [47], rotation [16]), and counting [48].
On the other hand, contrastive-based approaches were proposed. In [11], the authors propose a contrastive framework under which several other algorithms (e.g., Augmented Multiscale Deep InfoMax, i.e., AMDIM [49]; Contrastive Predicting Coding, i.e., CPC [50]; and a simple framework for contrastive learning of visual representations, i.e., SimCLR [13]) can be considered special cases. Yet Another Deep InfoMax (YADIM) [11] is characterized by five parts: data augmentation, needed to generate the anchor, the positive and the negative instances; the encoder, generally a ResNet [19]; the representation extractor, to compare two or more representations [13,50,51]; the similarity measure (e.g., dot product [49,50], cosine similarity [13,51], or bi-linear transformation); and the loss function (e.g., negative contrastive estimation (NCE) [52], triplet loss [53], and InfoNCE [14]). Outside the YADIM framework, there are many other effective approaches. For example, ref [15] proposes a momentum contrast (MoCo) architecture. MoCo uses a moving average network to maintain an effective representation of negative samples taken from a memory bank. Another approach is the one proposed in [54]. Contrastive Multiview Coding (CMC) learns a representation that maximizes the mutual information among various views of the same scene. Barlow Twins [10] proposes an objective function that avoids collapses by measuring the cross-correlation between the outputs of two identical networks fed with distorted versions of a sample.
Nevertheless, to address some of the limitations of contrastive-based approaches (e.g., need for large batch sizes [51] or pairwise comparison), most recently teacher-student (e.g., OBoW [12]), as well as clustering-based (e.g., DeepCluster [55]) approaches have been proposed. For example, Bootstrap Your Own Latent (BYOL) [56] uses a moving average network to produce prediction targets as a mean of stabilizing the bootstrap step. SimSiam [57] maximizes the similarity between two augmentations of one image, using a Siamese network. Swapping Assignments between multiple Views (SwAV) [58] predicts the cluster assignment of a view from the representation of another view of the same image.

3. Methodology

To deal with the challenge of limited annotated training data for RS segmentation, we rely on SSL to learn powerful representations, that can tap on the potential of the large amount of unlabeled data, readily available in RS. Particularly, we decided to use OBoW [12], because it exploits the use of visual words, which are visual concepts localized in the spatial domain (as opposed to global concepts as in most other SSL methods). This could be beneficial for dense prediction tasks, such as semantic segmentation. Furthermore, it exhibits very strong empirical performance. On the other hand, we decided to rely on MAResU-Net, for the semantic segmentation task, because of several reasons. U-Net-based architectures have proven to be an excellent choice for image segmentation tasks. Moreover, the use of a self-attention mechanism has shown to provide high-capacity models that can properly take advantage of large scale datasets. Finally, to deal with the high computational cost of self-attention, we extend the solution proposed by MAResU-Net.
In the following subsections, we provide details about the chosen architectures.

3.1. Self-Supervised Learning for Remote Sensing Using Online Bag of Visual Words

In [17], the authors propose BoWNet, which offers the idea of using Bag of Visual Words (BoW) as targets for SSL. This approach, despite its effectiveness and innovativeness, had some limitations, such as a static visual words vocabulary.
These limits were tackled in [12], where the authors propose an improved solution, that is OBoW.
The BoW reconstruction task involves a student convolutional neural network (CNN) S ( · ) that learns image representations, and a teacher CNN T ( · ) that generates BoW targets used for training the student network. The student S ( · ) is parameterized by θ S and the teacher T ( · ) by θ T .
Inspired by [15], the parameters θ T of T ( · ) are an exponential moving average of the student parameters. As a consequence, the teacher has the same architecture as the student, though maintaining different batch-norm statistics.
To generate a BoW representation y T ( x ) out of an image x, the teacher first extracts the feature map T l ( x ) R c l × h l × w l , of spatial size h l × w l with c l channels, from its last layer l. It quantizes the c l -dimensional feature vectors T l ( x ) [ u ] at each location u 1 , , h l × w l of the feature map over a vocabulary V = [ v 1 ; ; v K ] of K visual words of dimension c l . The vocabulary V of visual words is a K-sized queue of random features. At each step, after computing the assignment codes over the vocabulary V, V is updated by selecting one feature vector per image from the current mini-batch, removing the oldest item in the queue if its size exceeds K. The feature selection consists of a local average pooling with a 3 × 3 kernel of the feature map T l ( x ) followed by a uniform random sampling of one of the resulting feature vectors. Thus, assuming that the local features in a 3 × 3 neighborhood belong to one common visual concept, local averaging selects a representative visual-word feature from this neighborhood. This quantization process produces for each location u a K-dimensional code vector q ( x ) [ u ] that encodes the assignment of T ( x ) [ u ] to its closest visual word. Then, the teacher reduces the quantized feature maps q ( x ) to a K-dimensional BoW y ˜ T ( x ) by channel-wise max-pooling. For this step, a soft-assignment is preferable due to the fact that the vocabulary of visual words is continuously evolving. The soft assignment depends on an adaptive parameter δ . Finally, y ˜ T ( x ) is converted into a probability distribution over the visual words by L 1 -normalization, i.e.,
y T ( x ) [ k ] = y ˜ T ( x ) [ k ] k y ˜ T ( x ) k
To learn effective image representations, the student must predict the BoW distribution over V of an image using as input a perturbed version of that same image. In OBoW, the vocabulary is constantly updated. Therefore, a dynamic BoW-prediction head that can adapt to the evolving nature of the vocabulary is proposed. To that end, the authors employ a generation network G ( · ) that takes as input the current vocabulary of visual words V and produces prediction weights for them as G ( V ) = [ G ( v 1 ) ; ; G ( v K ) ] , where G ( · ) : R c l R c consists in a 2-layer multilayer perceptron (MLP) whose input and output vectors are l 2 -normalized and G ( v k ) represents the prediction weight vector for the kth visual word. Therefore, y ˜ S ( x ) is computed as follows:
y S ( x ˜ ) [ k ] = exp κ · G v k S ( x ˜ ) k exp κ · G v k S ( x ˜ )
where κ is a fixed coefficient that equally scales the magnitudes of all the predicted weights G ( V ) . The K-dimensional vector y S ( x ˜ ) [ k ] is the predicted softmax probability of the target y T ( x ) . Hence, the training loss that is minimized for a single image x is the cross entropy between the softmax distribution y S ( x ˜ ) [ k ] predicted by the student from the perturbed image x ˜ , and the BoW distribution y T ( x ) of the unperturbed image x given by the teacher.
The architecture described so far is represented in Figure 1.

3.2. MAResU-Net

MAResU-Net proposes a modified U-Net architecture. In fact, first of all, the encoder S is made up of a ResNet. Moreover, the blocks of the encoder S and the decoder D are not simple skip connections, but are replaced by attention modules. To reduce the computational times, these modules combine a conventional attention mechanism and a linear one, i.e. LAM.
The loss function follows the formula:
L = 1 M c = 1 C m = 1 M w c · y m c · log h θ x m , c
where M is the number of training examples, C the number of classes, y m c the target label for training example m of class c, w c the weight for the class c, x m the input for the training example m and h θ the model with the weights θ .
Particularly, if all the w c are set to 1 and soft assignment is performed, the loss becomes a soft categorical cross entropy (SCE), otherwise it is a weighted categorical cross entropy (WCE).
Eventually, the LAM is presented in the next Section 3.2.1, while the whole architecture is shown in Figure 2.

3.2.1. Linear Attention Mechanism

Providing N and C as the length of input sequences and the number of input channels, where N = H × W , with H and W the height and width of the input, with the input feature X = [ x 1 , , x N ] R N × C , dot-product attention utilizes three projected matrices W q R D x × D q , W k R D x × D k , and W v R D x × D v to generate the corresponding query matrix Q , the key matrix K , and the value matrix V . The attention is, according to [21], computed as follows:
D ( Q , K , V ) = softmax Q K T d k V
where d k is a scale factor. As Q R N × D k and K T R D k × N , the product between Q and K T belongs to R N × N , which leads to O ( N 2 ) memory and computational complexity. Thus, the i t h row of result matrix generated by the dot-product attention module can be written as:
D ( Q , K , V ) i = j = 1 N e q i T k j v j j = 1 N e q i T k j
First generalizing (5), then approximating e q i T k j with first-order Taylor expansion, finally l 2 -normalizing the resulting equation, (5) can be written as:
D ( Q , K , V ) = j V i , j + Q Q 2 T K K 2 T V N + Q Q 2 j K K 2 i , j T
As j = 1 N k j / k j 2 v j T and j = 1 N k j / k j 2 is common to every query, complexity of this linear attention mechanism is O ( N ) . Nevertheless, for the channel dimension dot-product-based attention is computed, considering that the channels of the input C are much less than the pixels. Thus, by taking the ResNet as the backbone, MAResU-Net combines low and high-level feature maps through attention block in multiple stages.

4. Experimental Results

As previously affirmed, we combined OBoW and MAResU-Net, in order to enhance semantic segmentation performances, and validated this intuition on ISPRS Vaihingen benchmark dataset [28]. The general strategy adopted to determine the training process, and summed up in Table 1, is as follows:
  • For the OBoW training, we have followed the procedure presented in [12]. We have, thus, selected the hyperparameters that the authors utilized in the semantic segmentation downstream task;
  • For the MAResU-Net training, we started from the configuration provided in [18]. First of all, we made some considerations on some issues, concerning the activation function and the loss, then, we explored different sets of hyperparameters, following different intuitions, as we discuss in Section 4.3.
After briefly presenting the data in Section 4.1, we go in the deep on the experimental results in Section 4.2. Finally, the ablation studies are presented in Section 4.3.

4.1. Vaihingen Dataset

To evaluate the performances of the presented strategy, we chose the benchmark dataset of Vaihingen, provided by ISPRS [28]. The dataset contains 33 tiles of variable sizes, each consisting of a true orthophoto (TOP). The ground sampling distance of the images is 9 cm. The images are 8 bit TIFF with three bands, corresponding to near infrared (NIR), red (R), and green (G). The corresponding masks are divided into six classes: background, impervious surface, car, building, low vegetation and trees. Following the approach of [7], we cropped each TOP in a variable number of 256 × 256 overlapping patches. We ended up with a dataset of more than 7500 images. Then, we divided it in train and validation, respectively, 85% (∼6500 images) and 15% (∼1000 images) of the total.
Table 1. Summary of the training process. In (a) the principal training hyperparameters of the two methods are shown. Most of them trace the one presented in [12,18]. In (b,c) some details about OBoW configuration are offered. In particular, in (c) we show the augmentation applied for the training. In (d) the training times are shown.
(a) Training hyperparameters
MethodBatch SizeLR (final LR)OptimizerSchedulerAugm.Epochs
OBoW2560.3 (0.003)AdamCosineRadiometric40
MAResU-Net640.003AdamStepNo150
(b) OBoW Configuration
Num. Image CropsCrop SizeNum. PatchesPatch Size1/ δ Num. Words κ
2160 × 1605 of 996 × 961581928
(c) Data Augmentations application probability (p) (d) Training time with Tesla V100-SXM2 32 GB GPU
Transformationp MethodTraining Time (it/s)
Color Jittering0.9 OBoW1.39
Grayscaling0.2 MAResU-Net1.09
Gaussian Blurring0.7

4.2. Experimental Settings

For the training phase, a single Tesla V100-SXM2 32 GB GPU has been used. Thus, we trained, through OBoW, a ResNet-18 feature extractor, used as encoder in the following MAResU-Net. With specific reference to the latter, we fine tuned the ResNet-18 encoder and trained the decoder. The overall accuracy (OA), accuracy per class, mean intersection over union (mIoU), and F1-score (F1) are the selected evaluation indexes. The background class is excluded from the evaluation, except for the OA, as in [18]. The pretrained model that reaches the best performances is available at the following link: https://github.com/VMarsocci/MARE (accessed on 6 July 2021).

4.2.1. OBoW

Among the several experiments we conducted, the best OBoW configuration, in terms of loss, was trained with a batch size of 256. As optimizer, Adam was preferred, with a cosine scheduler, with a first epoch of warmup. The learning rate started from 0.03 and finished to 0.003. Moreover, κ was set to 8 and the number of words of the dictionary is 8192. The net was trained for 40 epochs. The data have been augmented with strong radiometric transformation, consisting in: color jittering, gray-scaling, and Gaussian blurring. The input images of the student network consist in two sets of crops. The first ones are obtained performing two overlapping crops of size 160 × 160 on each augmented image. Finally, the second ones are 5 random patches, selected from 9 overlapping crops of size 96 × 96 of the input image. An example is provided in Figure 3. The training speed time was 1.38 iteration per second.
Moreover, in Figure 4, we provide some examples from the conv4 teacher feature maps of the ResNet-18 OBoW model. Since we use a queue-based vocabulary that is updated online, for the visualizations we used the state of the vocabulary at the end of the training. For the visualization, the patches with the highest assignment score for a specific visual word are retrieved. As it can be noticed, visual words encode high level visual concepts.

4.2.2. MAResU-Net

In the second step, we took the ResNet-18 feature extractor, obtained with OBoW and used it as the encoder of the MAResU-Net. The best performances for the MAResU-net were achieved with the following configuration. A batch size of 64 was set. An Adam optimizer, with starting learning rate of 0.0003 and a step scheduler was selected. The net was trained for 150 epochs, with an early stopping, expected after 20 epochs of patience. Finally, no data augmentation was performed on input data. Moreover, w.r.t. the original paper [18], we introduce a slight modification to the original architecture: ReLU activation function was replaced with a leaky-ReLU, that seems to be more stable, avoiding zero gradient flows for some neurons [59]. The training speed time was 1.09 iteration per second.
In Table 2, the results compared to the one provided by [18] are presented, while, in Figure 5, a segmentation mask comparison is offered.
It looks important to note how MARE obtains the best results w.r.t. all the architectures with a ResNet-18, and all but MAResU-Net with a ResNet-34 as the backbone. This, of course, could be explained by the number of parameters of the model: with a ResNet-18 as backbone, the net has 16.2 M of parameters; with a ResNet-34, it has 26.3 M. In particular, MARE outperforms MAResU-Net18, reaching 87.95% for F1, 90.35% for the OA and 81.76% for the mIoU. This means that, on the one hand, the MAResU-Net architecture can capture refined and detailed features; on the other hand, the representations learned by OBoW feature extractor are effective. These results are more encouraging if we think that, often, state-of-the-art performances are reached thanks to very huge backbone (e.g., ResNet-101 in [20]). Thus, we can consider these results from two points of view:
  • We reached a very important trade-off between high performance (e.g., 81.76% mIoU) and number of parameters (just 16.2 M);
  • We showed the effectiveness of the new approach, that is to find new techniques to exploit the high amount of unlabeled data in RS.
To better assess the performance of the model, we trained on our machine MAResU-Net, with a pretrained on ImageNet ResNet-18 as backbone, using the characteristics provided in [18]. The quantitative and qualitative results can be, respectively, observed in Table 3 and Figure 6.
To better understand the behavior of our strategy, some ablation studies were performed and presented in the following Section 4.3.

4.3. Ablation Studies

4.3.1. OBoW

The results of the performed ablation studies could be observed in Table 4. Only a limited set of hyperparameters were changed to perform these experiments. In fact, for the more proper parameters of the algorithm (e.g., κ , size of dictionary, ecc…) we referred to the values proposed in [12], in light of the best results achieved in several downstream tasks with this configuration, including semantic segmentation.
We could observe that, first of all, although it is widely recognized that robust data augmentation leads to better results, for this type of images, the insertion of geometric deformations (consisting in a random affine and a random perspective transformation) does not lead the network to a better understanding of which are the invariants to the context of the images, without being able to go beyond 0.96 of loss. Thus, only a strong radiometric augmentation was needed to reach the lowest loss (0.59). In addition, regarding the batch size, we can observe how, on the one hand, 256 is the same batch size that leads to the best results in [12], on the other hand that a large enough batch size allows the machine to select the best words to insert in the dictionary, without overburdening the computation. Indeed, batch size of 64 leads to the second best loss, that is 0.77. Further on, we show ablation studies to demonstrate that lower losses of OBoW training correspond to better semantic segmentation performances.

4.3.2. MAResU-Net

Table 5 shows the results of the first set of ablation studies, in which we tried various combinations of training losses, data augmentations, and batch sizes. In Figure 7, the values of the respective mIoUs could be observed.
First of all, we can observe that the presence or not of data augmentation leads to almost the same results with a slight preference for the configuration without augmentation. Indeed, considering the best model, the mIoU (81.76%) exceeds by less than one point the results obtained with the data augmentation (80.98%). This can be explained by the fact that, during the training of the feature extractor, a strong radiometric augmentation was performed on the same data. Therefore, the MARes-UNet encoder weights are already benefiting by this enhancement. Thus, the configuration without augmentation was preferred, also as it is faster.
Concerning the loss, we observed that, due to the unbalanced classes, the WCE performs better than the SCE on the segmentation of the less frequent classes: cars and low vegetation. In particular, the accuracy are, respectively: 85.64% (WCE) vs. 80.68% (SCE) for the cars and 86.12% (WCE) vs. 83.99% (SCE) for the low vegetation. However, it should be noted that the algorithm tends to overestimate these classes, performing worse on the other classes, and, in general, on the overall metrics. For example, we can observe a drop of the accuracy of the easiest class to detect, the buildings: 90.81% (WCE) vs. 94.92% (SCE). The experimental results could be observed in Table 6.
As far as the activation function is concerned, we conducted experiments with the ReLU and the leaky-ReLU, as presented in Table 7. We can observe how the results of the two configurations are very similar: the ReLU overperforms the Leaky-ReLU only in the OA, just of 0.05 (respectively, 90.40% vs. 90.35%). On the other hand, the widest gap among the performances of the two activation functions is 0.32, in the mIoU: 81.44% (ReLU) vs. 81.76% (leaky-ReLU). In light of this and because, as said, the ReLU could lead to the death of some neurons [59], we replaced it with a leaky-ReLU.
Finally, concerning the OBoW feature extractor, we wanted to make sure that lower losses corresponded to lower performance for the downstream task. Particularly, we selected the two best OBoW feature extractors (see Table 4) that, respectively, reach 0.59 (configuration n. 1) and 0.77 (configuration n. 2) as loss value during the OBoW training process. This intuition would seem to find confirmation in the experiments conducted, although the metrics differ slightly (less than 1 point), as shown in Table 8.

5. Conclusions

5.1. Review and Conclusion of the Accomplished Work

Semantic segmentation in RS remains a challenging and pivotal task. On the other hand, cutting-edge methods, such as SSL, and the attention mechanism are gaining increasing interest, finding a wide range of applications in real-world tasks. The application of a SSL model, such as OBoW, can lead to the creation of robust features that can improve the representation of the considered data, tackling, at least partially, the important problem of annotated data scarcity in RS. Furthermore, the attention mechanism allows the net to take into account the long-term dependencies also in specific sub-domains of images, such as RS. Following this intuition, in this letter we successfully combine existing methods in a technically sound manner in order to deliver a segmentation method that is efficient and high-performing.

5.2. Limitations and Outlook of the Proposed Approach

The set of experiments presented here shows how SSL methods are highly effective in RS, making it possible to exploit large amounts of non-annotated data, partially freeing segmentation systems from the need of annotated datasets. Furthermore, the foundations are laid for the validation of the effectiveness of SSL techniques on a wide range of downstream tasks related to different sectors of image analysis. However, the study presents only a first step in this direction. First of all, it would be interesting to extend the range of experiments, showing the behavior of this approach with the modification of some parameters, such as the size of the encoder or the SSL strategy. However, once again it is stated that the trade-off obtained between the number of parameters and excellent performance (the best with a ResNet-18 as an encoder) is very important.

5.3. Further Developments

On the one hand, further developments will be to extend this research, not only to other self-supervised algorithms, but also to assess how SSL affects the performances in other downstream tasks, connected to the RS area, such as object detection or disparity map creation, to further reduce the need of annotated data, exploiting at the maximum the available images. Moreover, it would be interesting to evaluate how such approaches, which exploit information from non-annotated data, behave as the number of labeled data decreases.

Author Contributions

Conceptualization, V.M., S.S. and N.K.; methodology, V.M., S.S. and N.K.; software, V.M., S.S. and N.K.; validation, V.M., S.S. and N.K.; formal analysis, V.M., S.S. and N.K.; investigation, V.M., S.S. and N.K.; resources, V.M., S.S. and N.K.; data curation, V.M., S.S. and N.K.; writing—original draft preparation, V.M., S.S. and N.K.; writing—review and editing, V.M., S.S. and N.K.; visualization, V.M., S.S. and N.K.; supervision, V.M., S.S. and N.K.; project administration, V.M., S.S. and N.K.; funding acquisition, V.M. All authors have read and agreed to the published version of the manuscript.

Funding

This work was funded by the research project “Deep learning and Earth observation: the use of neural networks for the production of thematic maps and digital surface models (DSM)”. This project has received funds from Sapienza University of Rome (protocol number RP120172A95FFED5) and is headed by Professor Mattia Crespi.

Data Availability Statement

The ISPRS Vaihingen dataset is available following this link: https://www2.isprs.org/commissions/comm2/wg4/benchmark/data-request-form/.

Conflicts of Interest

The authors declare no conflict of interest.

References

  1. Cheng, G.; Han, J.; Lu, X. Remote sensing image scene classification: Benchmark and state of the art. Proc. IEEE 2017, 105, 1865–1883. [Google Scholar] [CrossRef] [Green Version]
  2. Zhang, Q.; Seto, K.C. Mapping urbanization dynamics at regional and global scales using multi-temporal DMSP/OLS nighttime light data. Remote Sens. Environ. 2011, 115, 2320–2329. [Google Scholar] [CrossRef]
  3. Matikainen, L.; Karila, K. Segment-based land cover mapping of a suburban area—Comparison of high-resolution remotely sensed datasets using classification trees and test field points. Remote Sens. 2011, 3, 1777–1804. [Google Scholar] [CrossRef] [Green Version]
  4. Goldblatt, R.; Stuhlmacher, M.F.; Tellman, B.; Clinton, N.; Hanson, G.; Georgescu, M.; Wang, C.; Serrano-Candela, F.; Khandelwal, A.K.; Cheng, W.H.; et al. Using Landsat and nighttime lights for supervised pixel-based image classification of urban land cover. Remote Sens. Environ. 2018, 205, 253–275. [Google Scholar] [CrossRef]
  5. Paisitkriangkrai, S.; Sherrah, J.; Janney, P.; Van Den Hengel, A. Semantic labeling of aerial and satellite imagery. IEEE J. Sel. Top. Appl. Earth Obs. Remote. Sens. 2016, 9, 2868–2881. [Google Scholar] [CrossRef]
  6. Chen, G.; Li, S.; Knibbs, L.D.; Hamm, N.A.; Cao, W.; Li, T.; Guo, J.; Ren, H.; Abramson, M.J.; Guo, Y. A machine learning method to estimate PM2.5 concentrations across China with remote sensing, meteorological and land use information. Sci. Total. Environ. 2018, 636, 52–60. [Google Scholar] [CrossRef] [PubMed]
  7. Diakogiannis, F.I.; Waldner, F.; Caccetta, P.; Wu, C. Resunet-a: A deep learning framework for semantic segmentation of remotely sensed data. ISPRS J. Photogramm. Remote Sens. 2020, 162, 94–114. [Google Scholar] [CrossRef] [Green Version]
  8. Längkvist, M.; Kiselev, A.; Alirezaie, M.; Loutfi, A. Classification and segmentation of satellite orthoimagery using convolutional neural networks. Remote Sens. 2016, 8, 329. [Google Scholar] [CrossRef] [Green Version]
  9. Marmanis, D.; Schindler, K.; Wegner, J.D.; Galliani, S.; Datcu, M.; Stilla, U. Classification with an edge: Improving semantic image segmentation with boundary detection. ISPRS J. Photogramm. Remote Sens. 2018, 135, 158–172. [Google Scholar] [CrossRef] [Green Version]
  10. Zbontar, J.; Jing, L.; Misra, I.; LeCun, Y.; Deny, S. Barlow twins: Self-supervised learning via redundancy reduction. arXiv 2021, arXiv:2103.03230. [Google Scholar]
  11. Falcon, W.; Cho, K. A framework for contrastive self-supervised learning and designing a new approach. arXiv 2020, arXiv:2009.00104. [Google Scholar]
  12. Gidaris, S.; Bursuc, A.; Puy, G.; Komodakis, N.; Cord, M.; Perez, P. OBoW: Online Bag-of-Visual-Words Generation for Self-Supervised Learning. In Proceedings of the IEEE/CVF Conference on Computer Vision and Pattern Recognition (CVPR), Nashville, TN, USA, 21–24 June 2021; pp. 6830–6840. [Google Scholar]
  13. Chen, T.; Kornblith, S.; Norouzi, M.; Hinton, G. A simple framework for contrastive learning of visual representations. In Proceedings of the International Conference on Machine Learning PMLR, Virtual, 12–18 July 2020; pp. 1597–1607. [Google Scholar]
  14. Henaff, O. Data-efficient image recognition with contrastive predictive coding. In Proceedings of the International Conference on Machine Learning PMLR, Virtual, 12–18 July 2020; pp. 4182–4192. [Google Scholar]
  15. He, K.; Fan, H.; Wu, Y.; Xie, S.; Girshick, R. Momentum contrast for unsupervised visual representation learning. In Proceedings of the IEEE/CVF Conference on Computer Vision and Pattern Recognition (CVPR), Seattle, WA, USA, 14–19 June 2020; pp. 9729–9738. [Google Scholar]
  16. Gidaris, S.; Singh, P.; Komodakis, N. Unsupervised Representation Learning by Predicting Image Rotations. In Proceedings of the ICLR 2018, Vancouver, BC, Canada, 30 April–3 May 2018. [Google Scholar]
  17. Gidaris, S.; Bursuc, A.; Komodakis, N.; Pérez, P.; Cord, M. Learning representations by predicting bags of visual words. In Proceedings of the IEEE/CVF Conference on Computer Vision and Pattern Recognition (CVPR), Seattle, WA, USA, 14–19 June 2020; pp. 6928–6938. [Google Scholar]
  18. Li, R.; Zheng, S.; Duan, C.; Su, J.; Zhang, C. Multistage Attention ResU-Net for Semantic Segmentation of Fine-Resolution Remote Sensing Images. IEEE Geosci. Remote Sens. 2021, 1–5. [Google Scholar] [CrossRef]
  19. He, K.; Zhang, X.; Ren, S.; Sun, J. Deep residual learning for image recognition. In Proceedings of the IEEE/CVF Conference on Computer Vision and Pattern Recognition (CVPR), Las Vegas, NV, USA, 27–30 June 2016; pp. 770–778. [Google Scholar]
  20. Zheng, X.; Huan, L.; Xia, G.S.; Gong, J. Parsing very high resolution urban scene images by learning deep ConvNets with edge-aware loss. ISPRS J. Photogramm. Remote Sens. 2020, 170, 15–28. [Google Scholar] [CrossRef]
  21. Vaswani, A.; Shazeer, N.; Parmar, N.; Uszkoreit, J.; Jones, L.; Gomez, A.N.; Kaiser, Ł.; Polosukhin, I. Attention is all you need. In Proceedings of the 31st Conference on Neural Information Processing Systems (NIPS 2017), Long Beach, CA, USA, 4–9 December 2017; pp. 5998–6008. [Google Scholar]
  22. Wang, X.; Girshick, R.; Gupta, A.; He, K. Non-local neural networks. In Proceedings of the IEEE/CVF Conference on Computer Vision and Pattern Recognition (CVPR), Salt Lake, UT, USA, 18–22 June 2018; pp. 7794–7803. [Google Scholar]
  23. Fu, J.; Liu, J.; Tian, H.; Li, Y.; Bao, Y.; Fang, Z.; Lu, H. Dual attention network for scene segmentation. In Proceedings of the IEEE/CVF Conference on Computer Vision and Pattern Recognition (CVPR), Long Beach, CA, USA, 15–20 June 2019; pp. 3146–3154. [Google Scholar]
  24. Child, R.; Gray, S.; Radford, A.; Sutskever, I. Generating long sequences with sparse transformers. arXiv 2019, arXiv:1904.10509. [Google Scholar]
  25. Kitaev, N.; Kaiser, L.; Levskaya, A. Reformer: The Efficient Transformer. In Proceedings of the International Conference on Learning Representations, New Orleans, LA, USA, 6–9 May 2019. [Google Scholar]
  26. Katharopoulos, A.; Vyas, A.; Pappas, N.; Fleuret, F. Transformers are rnns: Fast autoregressive transformers with linear attention. In Proceedings of the International Conference on Machine Learning PMLR, Virtual, 12–18 July 2020; pp. 5156–5165. [Google Scholar]
  27. Shen, Z.; Zhang, M.; Zhao, H.; Yi, S.; Li, H. Efficient attention: Attention with linear complexities. In Proceedings of the IEEE/CVF Winter Conference on Applications of Computer Vision, Waikola, HI, USA, 5–9 January 2021; pp. 3531–3539. [Google Scholar]
  28. Rottensteiner, F.; Sohn, G.; Jung, J.; Gerke, M.; Baillard, C.; Benitez, S.; Breitkopf, U. The ISPRS benchmark on urban object classification and 3D building reconstruction. ISPRS Ann. Photogramm. Remote Sens. Spat. Inf. Sci. 2012, 1, 293–298. [Google Scholar] [CrossRef] [Green Version]
  29. Chen, L.C.; Papandreou, G.; Kokkinos, I.; Murphy, K.; Yuille, A.L. Deeplab: Semantic image segmentation with deep convolutional nets, atrous convolution, and fully connected crfs. IEEE Trans. Pattern Anal. Mach. Intell. 2017, 40, 834–848. [Google Scholar] [CrossRef] [PubMed]
  30. Yu, F.; Koltun, V. Multi-scale context aggregation by dilated convolutions. arXiv 2015, arXiv:1511.07122. [Google Scholar]
  31. Ronneberger, O.; Fischer, P.; Brox, T. U-net: Convolutional networks for biomedical image segmentation. In Proceedings of the International Conference on Medical Image Computing and Computer-Assisted Intervention, Munich, Germany, 5–9 October 2015; pp. 234–241. [Google Scholar]
  32. Zhao, H.; Shi, J.; Qi, X.; Wang, X.; Jia, J. Pyramid scene parsing network. In Proceedings of the IEEE/CVF Conference on Computer Vision and Pattern Recognition (CVPR), Honolulu, HI, USA, 21–26 July 2017; pp. 2881–2890. [Google Scholar]
  33. Zhao, H.; Zhang, Y.; Liu, S.; Shi, J.; Loy, C.C.; Lin, D.; Jia, J. Psanet: Point-wise spatial attention network for scene parsing. In Proceedings of the European Conference on Computer Vision (ECCV), Munich, Germany, 4–14 September 2018; pp. 267–283. [Google Scholar]
  34. Yuan, Y.; Huang, L.; Guo, J.; Zhang, C.; Chen, X.; Wang, J. Ocnet: Object context network for scene parsing. arXiv 2018, arXiv:1809.00916. [Google Scholar]
  35. Zhang, H.; Zhang, H.; Wang, C.; Xie, J. Co-occurrent features in semantic segmentation. In Proceedings of the IEEE/CVF Conference on Computer Vision and Pattern Recognition (CVPR), Long Beach, CA, USA, 15–20 June 2019; pp. 548–557. [Google Scholar]
  36. Gu, Z.; Cheng, J.; Fu, H.; Zhou, K.; Hao, H.; Zhao, Y.; Zhang, T.; Gao, S.; Liu, J. Ce-net: Context encoder network for 2d medical image segmentation. IEEE Trans. Med. Imag. 2019, 38, 2281–2292. [Google Scholar] [CrossRef] [PubMed] [Green Version]
  37. Wang, L.; Li, R.; Duan, C.; Fang, S. Transformer Meets DCFAM: A Novel Semantic Segmentation Scheme for Fine-Resolution Remote Sensing Images. arXiv 2021, arXiv:2104.12137. [Google Scholar]
  38. Liu, Z.; Lin, Y.; Cao, Y.; Hu, H.; Wei, Y.; Zhang, Z.; Lin, S.; Guo, B. Swin transformer: Hierarchical vision transformer using shifted windows. arXiv 2021, arXiv:2103.14030. [Google Scholar]
  39. Dong, H.; Ma, W.; Wu, Y.; Zhang, J.; Jiao, L. Self-Supervised Representation Learning for Remote Sensing Image Change Detection Based on Temporal Prediction. Remote Sens. 2020, 12, 1868. [Google Scholar] [CrossRef]
  40. Doersch, C.; Gupta, A.; Efros, A.A. Unsupervised visual representation learning by context prediction. In Proceedings of the IEEE International Conference on Computer Vision, Santiago, Chile, 7–13 December 2015; pp. 1422–1430. [Google Scholar]
  41. Mundhenk, T.N.; Ho, D.; Chen, B.Y. Improvements to context based self-supervised learning. In Proceedings of the IEEE/CVF Conference on Computer Vision and Pattern Recognition (CVPR), Salt Lake, UT, USA, 18–22 June 2018; pp. 9339–9348. [Google Scholar]
  42. Pathak, D.; Krahenbuhl, P.; Donahue, J.; Darrell, T.; Efros, A.A. Context encoders: Feature learning by inpainting. In Proceedings of the IEEE/CVF Conference on Computer Vision and Pattern Recognition (CVPR), Las Vegas, NV, USA, 27–30 June 2016; pp. 2536–2544. [Google Scholar]
  43. Zhang, R.; Isola, P.; Efros, A.A. Colorful image colorization. In Proceedings of the European Conference on Computer Vision, Amsterdam, The Netherlands, 8–16 October 2016; pp. 649–666. [Google Scholar]
  44. Larsson, G.; Maire, M.; Shakhnarovich, G. Colorization as a proxy task for visual understanding. In Proceedings of the IEEE/CVF Conference on Computer Vision and Pattern Recognition (CVPR), Honolulu, HI, USA, 21–26 July 2017; pp. 6874–6883. [Google Scholar]
  45. Noroozi, M.; Favaro, P. Unsupervised learning of visual representations by solving jigsaw puzzles. In Proceedings of the European Conference on Computer Vision, Amsterdam, The Netherlands, 8–16 October 2016; pp. 69–84. [Google Scholar]
  46. Bojanowski, P.; Joulin, A. Unsupervised learning by predicting noise. In Proceedings of the International Conference on Machine Learning PMLR, Sydney, Australia, 6–11 August 2017; pp. 517–526. [Google Scholar]
  47. Ren, Z.; Lee, Y.J. Cross-domain self-supervised multi-task feature learning using synthetic imagery. In Proceedings of the IEEE/CVF Conference on Computer Vision and Pattern Recognition (CVPR), Salt Lake, UT, USA, 18–22 June 2018; pp. 762–771. [Google Scholar]
  48. Noroozi, M.; Pirsiavash, H.; Favaro, P. Representation learning by learning to count. In Proceedings of the IEEE International Conference on Computer Vision, Venice, Italy, 22–29 October 2017; pp. 5898–5906. [Google Scholar]
  49. Hjelm, R.D.; Fedorov, A.; Lavoie-Marchildon, S.; Grewal, K.; Bachman, P.; Trischler, A.; Bengio, Y. Learning deep representations by mutual information estimation and maximization. In Proceedings of the International Conference on Learning Representations, Vancouver, BC, Canada, 30 April–3 May 2018. [Google Scholar]
  50. Oord, A.V.D.; Li, Y.; Vinyals, O. Representation learning with contrastive predictive coding. arXiv 2018, arXiv:1807.03748. [Google Scholar]
  51. Chen, T.; Kornblith, S.; Swersky, K.; Norouzi, M.; Hinton, G.E. Big Self-Supervised Models are Strong Semi-Supervised Learners. In Advances in Neural Information Processing Systems; Larochelle, H., Ranzato, M., Hadsell, R., Balcan, M.F., Lin, H., Eds.; Curran Associates, Inc.: Red Hook, NY, USA, 2020; Volume 33, pp. 22243–22255. [Google Scholar]
  52. Mnih, A.; Kavukcuoglu, K. Learning word embeddings efficiently with noise-contrastive estimation. Adv. Neural Inf. Process. Syst. 2013, 26, 2265–2273. [Google Scholar]
  53. Schroff, F.; Kalenichenko, D.; Philbin, J. Facenet: A unified embedding for face recognition and clustering. In Proceedings of the IEEE/CVF Conference on Computer Vision and Pattern Recognition (CVPR), Boston, MA, USA, 7–12 June 2015; pp. 815–823. [Google Scholar]
  54. Tian, Y.; Krishnan, D.; Isola, P. Contrastive multiview coding. In Part XI 16, Proceedings of the Computer Vision—ECCV 2020: 16th European Conference, Glasgow, UK, 23–28 August 2020; Springer: Cham, Switzerland, 2020; pp. 776–794. [Google Scholar]
  55. Caron, M.; Bojanowski, P.; Joulin, A.; Douze, M. Deep clustering for unsupervised learning of visual features. In Proceedings of the European Conference on Computer Vision (ECCV), Munich, Germany, 8–14 September 2018; pp. 132–149. [Google Scholar]
  56. Grill, J.B.; Strub, F.; Altché, F.; Tallec, C.; Richemond, P.H.; Buchatskaya, E.; Doersch, C.; Pires, B.A.; Guo, Z.D.; Azar, M.G.; et al. Bootstrap your own latent: A new approach to self-supervised learning. arXiv 2020, arXiv:2006.07733. [Google Scholar]
  57. Chen, X.; He, K. Exploring simple siamese representation learning. In Proceedings of the IEEE/CVF Conference on Computer Vision and Pattern Recognition (CVPR), Nashville, TN, USA, 21–24 June 2021; pp. 15750–15758. [Google Scholar]
  58. Caron, M.; Misra, I.; Mairal, J.; Goyal, P.; Bojanowski, P.; Joulin, A. Unsupervised Learning of Visual Features by Contrasting Cluster Assignments. In Proceedings of the Thirty-Fourth Conference on Neural Information Processing Systems (NeurIPS), Vancouver, BC, Canada, 6–12 December 2020. [Google Scholar]
  59. Sharma, S.; Sharma, S. Activation functions in neural networks. Towards Data Sci. 2017, 6, 310–316. [Google Scholar] [CrossRef]
Figure 1. OBoW architecture.
Remotesensing 13 03275 g001
Figure 2. MAResU-Net architecture (left) and MAResU-Net attention block (right).
Remotesensing 13 03275 g002
Figure 3. An example of the input images of the OBoW student network.
Remotesensing 13 03275 g003
Figure 4. Examples of visual-word members from the conv4 layer of ResNet-18.
Remotesensing 13 03275 g004
Figure 5. Visualization of the comparison among the different methods on the Vaihingen dataset [28].
Remotesensing 13 03275 g005
Figure 6. Segmentation masks comparison between MAResU-Net and MARE, both with a ResNet-18 as the backbone.
Remotesensing 13 03275 g006
Figure 7. mIoU values of the experiments performed with different losses, i.e., soft cross entropy (SCE) and weighted cross entropy (WCE); application or not of data augmentations and various batch sizes (16, 64, 256).
Remotesensing 13 03275 g007
Table 2. Experimental results on Vaihingen dataset [28] w.r.t. the results proposed in [18]. We can observe how MARE reaches the best results with a ResNet-18 encoder in all the adopted metrics.
MethodBackboneAccuracy per ClassMean F1OAmIoU
Imp. Surf.CarBuildingLow Veg.Tree
U-Net [31]-84.3340.8286.4873.1383.8973.7382.0261.36
ResUNet-a [7]-86.7157.1088.3276.7985.4378.8784.3567.00
PSPNet [32]ResNet-3490.2751.1094.2282.7688.6181.3988.8271.59
DANet [23]ResNet-3491.1362.9894.8283.4788.9284.2789.5274.73
EaNet [20]ResNet-3492.1780.5695.2082.8189.2588.0089.9980.22
CE-Net [36]ResNet-3492.6881.2495.5383.3689.9488.4690.4081.49
MAResU-Net [18]ResNet-1891.9778.2895.0483.7389.3587.6890.0580.75
MAResU-Net [18]ResNet-3492.9188.3395.2684.9589.9490.2890.8683.30
MAREResNet-1891.5880.6894.9283.9989.6287.9590.3581.76
Table 3. Comparison among MAResU-Net trained with a ResNet-18 backbone and MARE. The SSL pretraining strategy of the ResNet-18 encoder is effective, allowing the architecture to achieve the best results (e.g., 81.76% mIoU) in literature with this type of encoder.
MethodBackboneAccuracy per ClassMean F1OAmIoU
Imp. Surf.CarBuildingsLow Veg.Tree
MAREResNet-1891.5880.6894.9283.9989.6287.9590.3581.76
MAResU-NetResNet-1892.0178.3194.8483.8789.4487.7390.0280.75
Table 4. An overview of the OBoW configuration. We can observe that the best configuration is reached with a strong radiometric augmentation. The other hyperparameters are in line with those proposed in [12].
Obow Config.LRBatch SizeOptimizerAugmentationMin Loss
10.005256adamRad.0.59
20.00564adamRad.0.77
30.005256adamRad./Geom.0.96
40.003256adamRad.0.94
50.005256SGDRad.1.90
Table 5. Ablation studies investigating losses, augmentations, and batch sizes. The best model is highlighted in bold.
LossAugm.BSOAAcc. per ClassMean F1mIoU
SCENo1689.9487.4387.2880.33
6490.3588.1687.9581.76
25689.6787.5187.3480.83
Yes1689.1387.0186.3779.91
6489.9187.2986.4380.98
25689.0287.2886.3980.61
WCENo1689.5287.5186.9380.50
6490.0287.8187.3281.15
25689.6887.4287.0480.67
Yes1688.3186.9985.8179.13
6488.5386.9185.9379.83
25688.0586.9185.9379.43
Table 6. Ablation study about training loss. We can observe how the WCE performs better on the unbalanced classes, i.e., cars and low vegetation, w.r.t. the SCE, but worse on the other ones.
MethodLossAccuracy per ClassMean F1OAmIoU
Imp. Surf.CarBuildingsLow Veg.Tree
MARESCE91.5880.6894.9283.9989.6287.9590.3581.76
MAREWCE88.2085.6490.8186.1688.2387.3290.0281.15
Table 7. Ablation study about activation functions: the leaky-ReLU overperforms by very little the ReLU in all the metrics, but the overall accuracy (OA).
ActivationOAAcc. per ClassMean F1mIoU
ReLU90.4087.9187.8481.44
Leaky-ReLU90.3588.1687.9581.76
Table 8. Ablation study about OBoW configuration: lower losses in the OBoW training process of the ResNet-18 feature extractor correspond to lower performances in the downstream task.
OBoWLoss valueOAAcc. per ClassMean F1mIoU
10.5990.3588.1687.9581.76
20.7789.6487.6387.2780.35
Publisher’s Note: MDPI stays neutral with regard to jurisdictional claims in published maps and institutional affiliations.

