1. Introduction
Snow cover is an important cryosphere component that has strongly influenced the socioeconomic development in the arid region of northwestern China, including water resource management, ecological patterns, and tourism [
1,
2]. Changes in the snow cover owing to climate change and topography have also led to increased flood peaks [
3,
4,
5]. Warming and humidification in northeastern China are projected to continue in the future, which will further impact the snow cover [
6]. An understanding of snow cover variations and their causes at multiple scales is therefore critical, particularly to offset the negative impacts of runoff in arid regions [
7].
Snow cover plays a crucial role in the global water cycle, especially in the mid-latitudes and mid- to low-altitude mountains in the Northern Hemisphere. For example, snowmelt water accounts for 75% of the total runoff in the mountainous Western US [
8], but only approximately 13% of the national annual surface runoff in China. River runoff trends in northwestern China have generally increased over the past 50 years owing to a climatic shift from warm-dry to warm-humid in most areas [
9]. Precipitation is the main factor that affects river runoff in northwestern China, and rising temperatures are the main reason for the reduced amount of snow cover in spring and summer [
10]. The onset time of snowmelt runoff has advanced in response to global warming, the amount of rainfall converted to snowfall has decreased, and winter accumulation may lead to reduced snowmelt runoff in spring [
11,
12,
13]. Similar changes have taken place in snowmelt water recharge basins in western China. For example, the maximum monthly runoff of the Crane River has shifted from June to May and increased by 15% [
14]. Since the 1960s, the onset of snowmelt in the source region of the Yangtze River has become earlier (0.9–3 days/10a), and the end time of snowmelt has also advanced by 0.6–2.3 days 10a
−1 [
15].
The upper stream regions of the Shule River catchment have the most developed cryosphere in the Qilian Mountains, and the climatic and hydrological effects on snow cover change have been significant. To investigate the spatiotemporal variations in the snow cover in the upstream regions of the Shule River catchment and its response to climate change and topography, this study established a snow cover dataset since 2000 based on remote sensing and field monitoring data in the Qilian Mountains. The hydrological effects on the snow cover are also discussed. This work provides basic data and guidance for regional ecological environment changes, as well as a scientific foundation for decision making in ecological environment management.
2. Data and Methods
2.1. Study Region
The Shule River catchment is one of the three major inland river basins in the Hexi Corridor [
16]. The Shule River catchment originates along the northern slope of Shule South Mountain in the hinterland of the Qilian Mountains and has a total length of 670 km. This work mainly focuses on the upstream region of the Shule River catchment, which covers an area of approximately 1.14 × 10
4 km
2. The annual runoff of the Changmaxia section, the main stream of the Shule River, is 10.31 × 10
8 m
3 a
−1, which is mainly precipitation and ice and snowmelt water [
17]. The cryosphere has mainly developed at elevations above 4500 m in the high mountainous region, in which the glacier and permafrost areas are 549 and 9447.16 km
2, respectively, which account for approximately 5% and 83% of the total area [
18] (
Figure 1). The climate of the Shule River catchment is mainly affected by dry and cold westerlies with low precipitation and strong winds. The precipitation distribution shows distinct vertical and horizontal zones in this region. The upstream region of the Shule River catchment is characterized as an alpine and semi-arid area with an annual average precipitation of 294 mm [
19]. The annual average extent of evaporation increases from southeast to northwest with increasing terrain [
20].
2.2. Data Sources
The MODIS/Terra8 daily emerging snow data (MOD10A2) were downloaded from the US National Snow and Ice Data Center (
http://nsidc.org/ (accessed on 1 March 2020)). This work used two MOD10A2 datasets: orbit numbers h25v04 and h25v05. The time series was collected from 26 February 2000 to 27 December 2019, with a spatial resolution of 500 m. Previous studies have demonstrated that the MOD10A2 products from mountainous areas have higher snow recognition rates, which can be applied to a wide range of snow cover conditions, which is especially useful for studying snow cover variation in mountainous areas [
21,
22].
The meteorological data sources were obtained from field observations by the State Key Laboratory of Cryospheric Science, Chinese Academy of Sciences and China Meteorological Science Data Sharing Service Network (
http://cdc.cma.gov.cn/ (accessed on 10 March 2020)). The daily temperature and precipitation data were collected from 10 meteorological stations located in and near the upstream region of the Shule River catchment from 1 January 2000 until 31 December 2019. The national station was treated as a standard to control the meteorological data quality. Data quality control was performed referring to WMO observation, data quality manuals, and the process method of CMA. Specifically, in the first run, erroneous temperature and precipitation data, such as precipitation values below 0 mm or days with Tmax < Tmin, were identified. Additional execution was carried out to identify potential outliers, which have to be manually checked, validated, corrected, or removed. In our case, we chose 3 standard deviations as the threshold for a finer quality control of the data. The automatic weather station in the Laohugou Glacier region is located 2 km from the front region of the glacial snout (
Figure 1, 39°30′N, 96°30′E, elevation: 4260 m). The data were identified and corrected using manual observations and conventional approaches.
The runoff data were obtained from the Gansu Provincial Bureau of Hydrology and Water Resources, which collects daily runoff data from the Changmabu hydrological station in the region. The time series is from1 January 2000 to 31 December 2019. The digital elevation data were downloaded from
http://www.gscloud.cn/ (accessed on 20 March 2021), with a resolution of 30 m.
2.3. Methodology
2.3.1. Remote Sensing
The MOD10A2 products were processed as follows. (1) The image data were processed in terms of the projection, format conversion, and montage and set in a unified longitude–latitude projection. (2) The processed image was edited with the vector boundary of the research area. (3) A statistical analysis of the regional snow cover was performed according to the different pixel values of the snow cover extent and other areas. (4) The snow cover pixels were extracted, and a MODIS snow cover image was created. All of the snow cover pixel values were converted to 1, and others to 0. An image overlay operation was used to obtain the spatial distribution of the snow cover frequency from 2000 to 2013. (5) The snow cover extents at different altitudes were extracted based on the digital elevation data. Step (1) was implemented using MRT, a MODIS software program, and steps (2)–(5) were implemented using the ENVI and IDL software platforms.
2.3.2. Influence of Topography on Snow Cover
The DEM (digital elevation model) data were used to calculate the slope and aspect of the upstream region of the Shule River catchment in ARCGIS10.7. The correlations between snow cover and slope, aspect, runoff, and altitude were analyzed using ENVI5.5.
3. Results and Analysis
3.1. Accuracy Assessment
The AWS (automatic weather station) of the Qilian Shan station was selected to validate the MODIS snow cover data using the relationship between albedo and the snow cover frequency. Considering the large albedo difference between the snow cover and land surface, the relationship between the snow depth and albedo of grassland, sandstone, and other types was generally good and not greater than 0.35. Previous studies that used MODIS data to investigate the snow cover in the Qilian Mountains [
23,
24,
25] reported a threshold snow cover index value of 0.35 to distinguish the snow cover.
The snow cover identification accuracy from the MOD10A2 image in the Laohugou region during 2010–2015 ranged from 45.5% to 87.5% (
Table 1), with an average of 64.6%. The total recognition accuracy ranged from 58.7% to 83.7%, with an average of 71.3%. The multi-score error rate (0–13.1%) of MOD10A2 snow recognition was less than the missed score error rate (11.6–32.6%), and the total recognition accuracy was 83.7% for 2014 and 87.5% for 2011. The overall multi-score error rate was acceptable, and the missed score was found to be the factor that most strongly affected the recognition accuracy, which is consistent with previous studies. The results confirm that the MOD10A2 image data can be used for snow monitoring in the upper reaches of the Shule River Basin [
26].
3.2. Spatial Pattern of Snow Cover
The snow cover frequency represents the number of pixels that appear as snow cover, which is an important indicator of the snow cover range. A grid operation of the snow cover map in 2000–2019 was synthesized into a snow cover frequency map for different seasons (
Figure 2). The results show that the snow cover in spring and autumn mainly concentrates in the edge zone, which is mostly distributed on the southern mountain. The snow cover pattern in autumn is more notable than that in spring. The snow cover in winter and summer is mainly distributed in the southern region, whereas the snow cover frequency in the central section is relatively low. The snow cover frequency and uniformity in winter are more concentrated than in other seasons, and the distribution range is also wider. The annual snow cover frequency pattern is similar to that in spring.
The ratio of snow cover extent and total area in different seasons was also analyzed. The regions with a snow cover ratio of <20% are the largest in summer and the smallest in winter, whereas the regions with a ratio of >20% are the smallest in summer. The largest ratios between the snow cover extent and total area are 20–40%, 40–80%, and >80% in winter, autumn, and spring, respectively.
3.3. Temporal Snow Cover Variation
The maximum, minimum, and average extents of snow cover over an 8-day interval each year were extracted to obtain the long-term snow cover extent from 2000 to 2019 (
Figure 3a). The average snow cover extent continuously increased until 2010, gradually decreased until 2016, and then gradually increased. The maximum snow cover extent continually increased until 2007, decreased until 2012, and then increased. The minimum snow cover extent increased from 2000 to 2009, gradually decreased until 2016, and then increased. Overall, the three indicators increased until 2010 and then decreased at different transition times.
The maximum, minimum, and average extents of snow cover over the 8-day intervals were extracted to obtain the snow cover range data in a given year, and the annual variation characteristics of the snow cover extent were analyzed (
Figure 3b). The variations in the maximum, minimum, and average frequency of snow cover are similar, whereas the largest and smallest fluctuations are found for the maximum snow cover extent and average value, respectively. The duration of the snow cover frequency shows the longest minimum value, followed by the average value, and the maximum value is the shortest. The maximum snow cover frequency was found to occur in January, April, and October; the average value reaches a maximum in May and October; and the minimum values occur in May and December. The maximum, average, and minimum valley values appear in June, July, and July–August, respectively.
Variations in the maximum, minimum, and average cases within the year indicate analogous phases. This means that any valley values under the three conditions occurred in mid-July. The snow cover extent rapidly expanded in July–October and reached a maximum in October–January of the following year. The snow cover melts upon the arrival of spring. The snow cover extent therefore gradually decreases owing to snowmelt in March, and then it rapidly decreases from the middle of April to a minimum in early July.
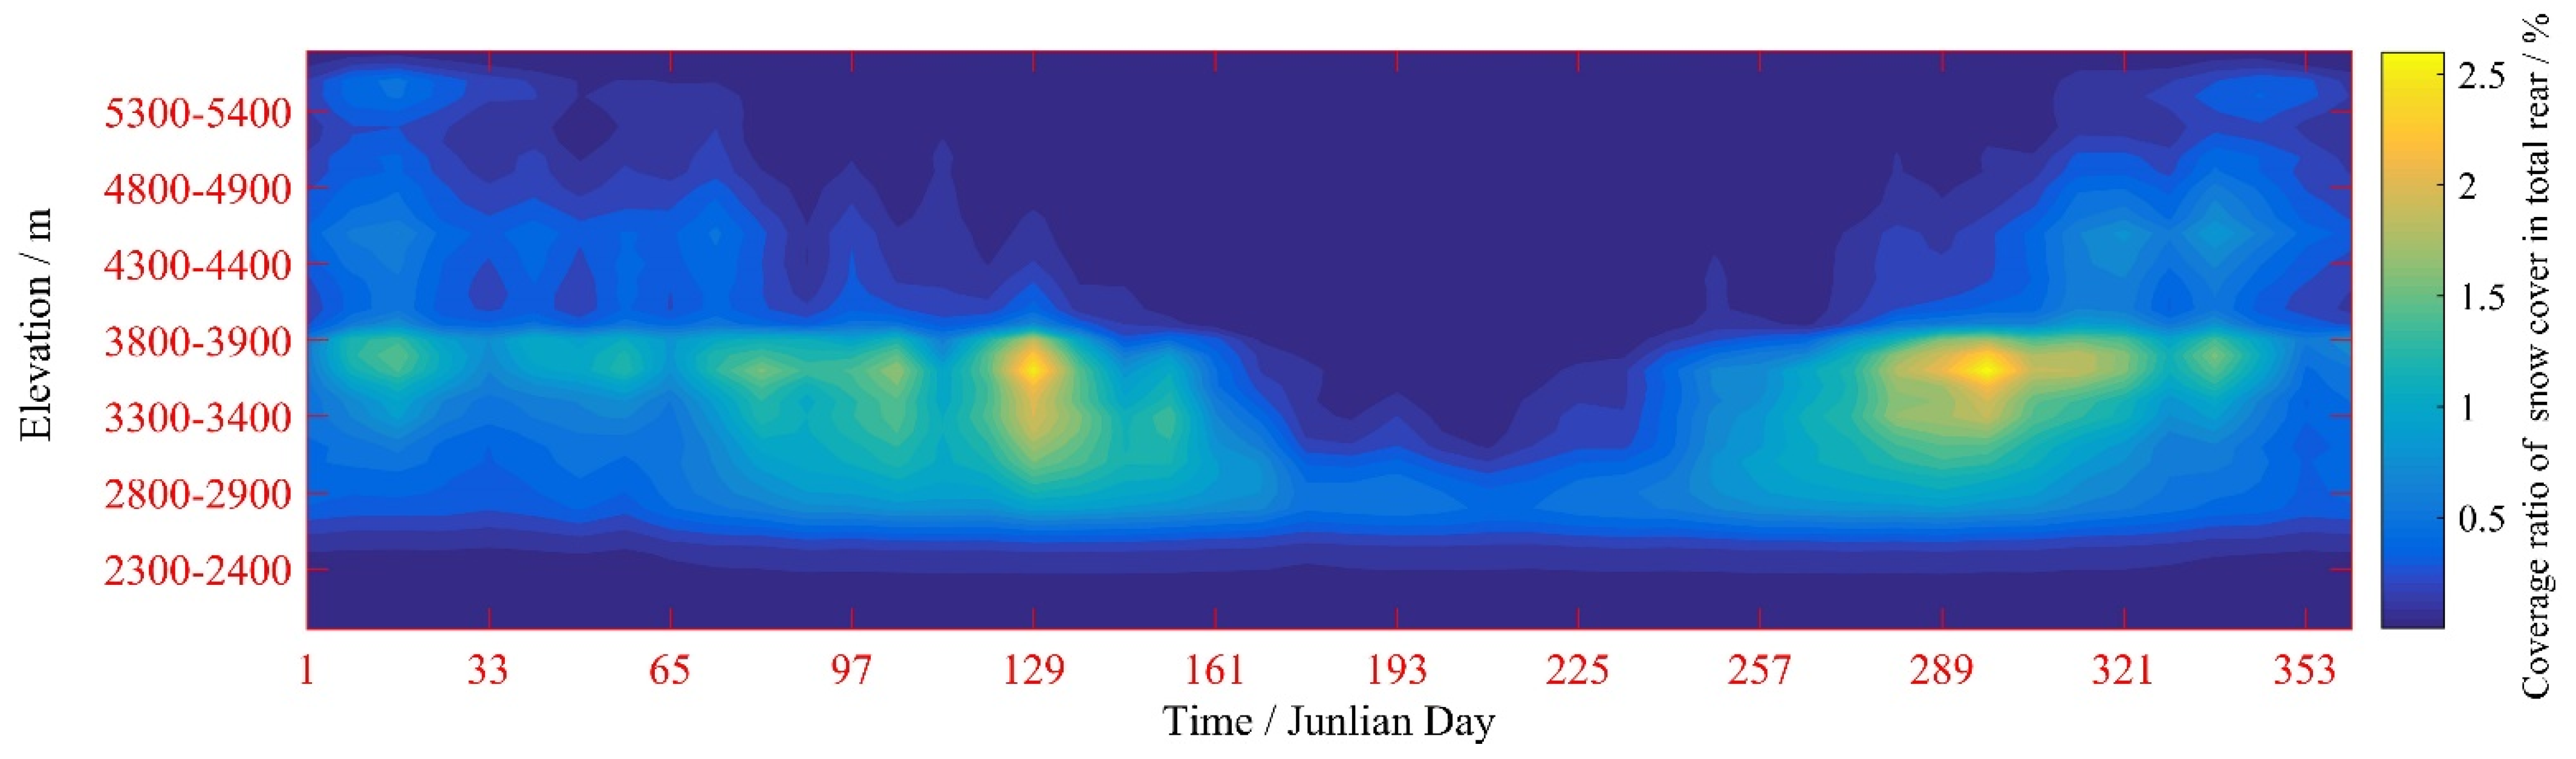
The average snow cover frequency in 2000–2019 was used to analyze the snow pattern cover at different altitudes (
Figure 4). The relatively high snow cover frequency in spring, autumn, and winter was mainly distributed in areas with altitudes of 3200–3900 m. The annual snow cover variations show significant differences with altitude, following a bimodal pattern. There was less snow at altitudes below 2800 m. The snow cover showed an increasing fluctuation pattern in mid-August in areas with an altitude of 2800–3900 m, and then it melted from early March to late May in the following year. The areas located at 3900–4500 m showed an increase in the snow cover extent in mid-October, which then turned to melt in early March in the following year, and melting ended in late April. The snow cover extent in areas above 4500 m was relatively large and varied only slightly from mid-April to mid-September; however, the snow cover rapidly increased in late September owing to reduced temperatures and peaked in late October. The ratio between the snow cover and total area then decreased owing to the low temperature and low precipitation and was less than that in spring and autumn. This is consistent with the annual variations in the snow cover extent at high altitudes in the Qinghai–Tibet Plateau including the West Kunlun Mountains [
27,
28,
29].
3.4. Snow Cover Extent and Hydrological Effects
The snow cover extent and runoff for the 8-day interval results and monthly and average values were compared in March–May (
Figure 5). The results show the strongest correlation in April, followed by March, and a significant decrease in May. A possible explanation is the initial snowmelt in March, at which time the hydrological effect has not yet appreciably formed. In April, significant warming and a slight increase in precipitation highly strengthened the snowmelt and led to the peak contribution of the melted snow cover to runoff. The correlation then decreased and did not clearly reflect the importance of the role of the reduced snow cover extent in runoff owing to the changed form of snowmelt with decreasing thickness, glacier melt, and increasing precipitation.
A comparison of the snow cover extent at different elevations and runoff allows three relationships to be identified (
Figure 6). A negative relation is significant below 3300 m, which can be ascribed to the relationship between the precipitation form and air temperature. Specifically, the precipitation was almost entirely liquid because of the warmer conditions. When the air temperature decreased, the increased amount of solid precipitation resulted in more snow cover, and the snowmelt was suppressed. The low amount of liquid precipitation and snowmelt weakened the contribution to runoff, causing a negative relation. The correlation between the snow cover and runoff prominently increased with increasing altitude. In this height interval, the precipitation amount notably increased, but the temperature was relatively low, which led to a greater snow cover. However, increased temperatures caused more snow and glacier ablation, which strengthened the contribution of the snow cover to runoff. Some contributions of glacial melt to runoff were also regarded, although the contribution of snow and ice cannot be clearly identified. The hydrological contribution was thus noted to increase with elevation. For altitudes higher than 4900 m, the positive correlation between the snow cover extent and runoff gradually decreased and became negative above 5700 m. The precipitation at this height is almost entirely solid precipitation, which is conducive to the formation of the snow cover. Furthermore, owing to the large number of glaciers at this altitude, some glaciers were classified as snow cover because snow and ice are not easily distinguished in remote sensing images, which may cause the snow cover extent to be overestimated. At very low temperatures, the small amount of snow or melt at a given time is mainly preserved in the snow layer and has little influence on runoff; the effect of solid precipitation on runoff is also very small. The positive relationship therefore weakens with increasing altitude and even becomes negative.
Although the glaciated area is only approximately 4% of the upper stream of the Shule River catchment, glacier melt water change is greatly important for the projection of the impact of future climate change on local water resource management [
30]. There is still large uncertainty in remote sensing monitoring for variations in the snow cover extent, but it plays an important role in improving the accuracy of snow/ice melt water runoff [
31,
32]. The contribution of snowmelt water to runoff was approximately ~15% [
33], and the high flow was mainly concentrated from May to September. However, the flow was found to increase in March, which is connected with the primary contribution of raising snowmelt water to runoff under increasing temperature and stable precipitation conditions [
34]. During May–September, the sharp increase in glacier melt water significantly adjusted the runoff variation [
35,
36]. The period from March to May was therefore chosen to investigate the potential relationship between the snow cover and runoff.
3.5. Influence of Terrain and Climate Parameters on Snow Cover
Topography is an important factor that affects the snow cover distribution. In this study, a correlation analysis was conducted between the snow cover extent, altitude, slope, and aspect (
Figure 7). The areas with a higher snow cover frequency were mostly concentrated in high-altitude areas. Higher altitudes were associated with stronger correlations between the snow cover frequency and altitude. The snow cover frequency and slope also showed a distinct relationship. A strong positive correlation was observed in areas with slopes less than 30°, whereas areas with slopes greater than 45° showed that the snow cover frequency decreased with increasing altitude, resulting in a negative correlation, and areas with slopes of 30°–45° showed no variation. The correlation analysis between the snow cover frequency and slope aspect indicated symmetrical changes. The snow cover frequency varied slightly in the southern slope and showed a large correlation with the slope aspect, whereas that in the northern slope varied greatly and showed little correlation with the slope aspect. Greater snow cover was observed on the northern slope than on the southern slope, which may be related to the source of water vapor and influence of solar radiation.
Temperature and precipitation are two important meteorological factors that determine the melting and accumulation of snow cover [
37]. This work analyzed the potential relationship between the snow cover and temperature/precipitation and found a relatively large sensitivity to altitude (
Figure 8). Both temperature and precipitation significantly increased from 2000 to 2019, which is consistent with other results of climate changes in the Shule River catchment [
38,
39]. The monthly precipitation gradually increased in early March to a maximum in late July and then gradually decreased. The temperature was below 0 °C from late October to late February in the following year and gradually increased to above 0 °C in early March to a maximum in late July.
The variations in the snow cover extent were influenced distinctively by the air temperature and precipitation at the different elevation bands [
29,
40,
41]. In areas below 3900 m, the variation in the snow cover extent in different seasons showed a significant negative correlation with the air temperature and a positive correlation with precipitation. Snow melting in this area mainly occurs in spring when increasing temperatures cause the snow to rapidly melt. Snow melting essentially ends at the end of spring and beginning of summer. The temperature is also relatively high in summer, and precipitation mostly exists in liquid form. No significant correlation was found between summer precipitation and the snow cover extent because of the high temperatures and increased amounts of liquid precipitation. For areas above 3900 m, the snow cover extent increased in late September to a maximum in late October because of decreasing temperatures in September, reduced precipitation, and less snowmelt.
4. Conclusions
The spatial distribution of the snow cover of the upper reaches of the Shule River is highly uneven. The snow cover in spring and autumn is mainly concentrated in the edge zone distributed on the southern slope of the mountain. The snow cover in winter and summer is mainly distributed in the southern region, whereas the snow cover frequency in the central region is relatively low. The snow cover frequency and evenness are the highest in winter.
The annual snow cover changes show significant variations with altitude and a bimodal pattern. The snow cover extent begins to be established in mid-July. From July to October, the snow cover extent rapidly expands and accumulates, peaking in October and January of the following year. After spring, the snow cover melts. In March, the snow cover extent gradually decreases with increasing snowmelt. In mid-April, the snow cover extent rapidly decreases to a minimum at the beginning of early July.
The correlation between the snow cover extent and runoff is the most significant in April and tends to vary in different altitude zones. A negative relation is significant below 3300 m. In areas between 3300 and 4800 m, the correlation between the snow cover and runoff prominently increases with altitude, but this correlation weakens at altitudes above 4900 m.
The areas with a higher snow cover frequency are mostly concentrated in high-altitude areas. There is a strong correlation with the snow cover frequency in areas with slopes less than 30°, whereas areas with slopes between 30° and 45° show little change, and the snow cover frequency decreases with an increasing slope above 45°, with a gradually worsening correlation. Correlation analysis indicates symmetrical changes in the snow cover frequency and slope aspect. The results presented here provide important information regarding the spatiotemporal variations in the snow cover over a relatively long time duration in the upper reaches of the Shule River, and similar methods can be applied to investigate snow cover changes in other regions.
Author Contributions
W.D. and Y.J. conceived the idea and designed the research framework. J.C. and Y.J. carried out data collection and preprocessing. W.S. and W.D. undertook data analysis and manuscript preparation. J.C. and W.S. contributed to manuscript refinement. All authors have read and agreed to the published version of the manuscript.
Funding
This work is jointly supported by the following research projects: Supported by National Natural Science Foundation of China (42071018), CAS “Light of West China” Program, Natural Science Foundation of Gansu Province (20JR10RA453); State Key Laboratory of Cryosphere Science, Northwest Institute of Eco-Environment and Resources, Chinese Academy Sciences (Grant Number: SKLCS-ZZ-2021); General Project of Gansu Meteorological Bureau (Ms2021-14), State Key Laboratory of Frozen Soil Engineering (State Key Laboratory of Frozen Soil Engineering SKLFSE202006); and Opening Foundation of Key Laboratory of Desert and Desertification (KLDD-2020-010).
Institutional Review Board Statement
Not applicable for studies not involving humans or animals.
Informed Consent Statement
Informed consent was obtained from all subjects involved in the study.
Data Availability Statement
The data that support the findings of this study are available from the corresponding author upon reasonable request.
Acknowledgments
We thank Leonie Seabrook from Liwen Bianji, Edanz Editing China (
www.liwenbianji.cn/ac (accessed on 23 April 2021)), for editing the English text of a draft of this manuscript.
Conflicts of Interest
The authors declare no conflict of interest.
References
- Qin, D.; Yao, T.; Ding, Y.; Ren, J. An Introduction to Cryosphere Science; China Science Publishing & Media Ltd.: Beijing, China, 2017; pp. 13–26. [Google Scholar]
- Kong, Y.; Wang, C. Responses and changes in the permafrost and snow water equivalent in the Northern Hemisphere under a scenario of 1.5 °C warming. Adv. Clim. Chang. Res. 2017, 4, 235–244. [Google Scholar] [CrossRef]
- Yang, Z.; Da, W.; Chu, D. Spatiotemporal Variations of Snow Cover on the Tibetan Plateau over the Last 15 Years. Remote. Sens. Technol. Appl. 2017, 32, 27–36. [Google Scholar]
- Mu, Z.; Jiang, H. Spatial and temporal characteristics of snow cover in the Kunmalike River Basin. Resour. Sci. 2013, 35, 148–156. [Google Scholar]
- Lou, M.; Liu, Z.; Lou, S.; Dai, R. Temporal and spatial distribution of snow cover in Xinjiang from 2002–2011. J. Glaciol. Geocryol. 2013, 35, 1095–1102. [Google Scholar]
- Qin, Y.; Ding, J.; Zhao, Q.; Liu, Y.; Ma, Y.; Mu, S. Spatial temporal variation of snow cover in the Tianshan Mountains from 2001 to 2015, and its relation to temperature and precipitation. J. Glaciol. Geocryol. 2018, 40, 249–260. [Google Scholar]
- Field, C.B.; Barros, V.R.; Mastrandrea, M.D.; Mach, K.J.; Abdrabo, M.K.; Adger, N.; Anokhin, Y.A.; Anisimov, O.A.; Arent, D.J.; Barnett, J.; et al. Summary for policymakers. In Climate Change 2014: Impacts, Adaptation, and Vulnerability. Part A: Global and Sectoral Aspects. Contribution of Working Group II to the Fifth Assessment Report of the Intergovernmental Panel on Climate Change; Cambridge University Press: Cambridge, UK, 2014; pp. 1–32. [Google Scholar]
- Winstral, A.; Elder, K.; Davis, R.E. Spatial Snow Modeling of Wind-Redistributed Snow Using Terrain-Based Parameters. J. Hydrometeorol. 2001, 3, 524–538. [Google Scholar] [CrossRef]
- Shi, Y.; Shen, Y.; Li, D.; Zhang, G.; Ding, Y.; Hu, R.; Kang, E. Discussion on the present climate change from warm dry to warm wet in northwest china. Quat. Sci. 2003, 23, 152–164. [Google Scholar]
- Ye, B.; Ding, Y.; Yang, D.; Han, T.; Shen, Y. Regional Parttens of Climate Change in Northwest China during the Last 50 Years Viewed from Annual Discharge Change. J. Glaciol. Geocryol. 2006, 28, 307–311. [Google Scholar]
- Berghuijs, W.R.; Woods, R.A.; Hrachowitz, M. A precipitation shift from snow towards rain leads to a decrease in streamflow. Nat. Clim. Chang. 2014, 4, 583–586. [Google Scholar] [CrossRef] [Green Version]
- Li, X.; Cheng, G.; Ge, Y.; Li, H.; Han, F.; Yingchun, G.; Tian, W.; Tian, Y.; Pan, X.; Nian, Y.; et al. Hydrological Cycle in the Heihe River Basin and Its Implication for Water Resource Management in Endorheic Basins. J. Geophys. Res. Atmos. 2018, 123, 890–914. [Google Scholar] [CrossRef]
- Weng, B.; Yang, Y.; Yan, D.; Wang, J.; Dong, G.; Wang, K.; Qin, T.; Dorjsuren, B. Shift in plankton diversity and structure: Influence of runoff composition in the Nagqu River on the Qinghai-Tibet Plateau. Ecol. Indic. 2020, 109, 105818. [Google Scholar] [CrossRef]
- Shen, Y.; Wang, G.; Su, H.; Han, P.; Gao, Q.; Wang, S. Hydrological Processes Responding to Climate Warming in the Upper Reaches of Kelan River Basin with Snow-dominated of the Altay Mountains Region, Xinjiang, China. J. Glaciol. Geocryol. 2007, 29, 845–854. [Google Scholar]
- Wang, R.; Yao, Z.; Liu, Z.; Wu, S.; Jiang, L.; Wang, L. Snow cover variability and snowmelt in a high-altitude ungauged catchment. Hydrol. Process. 2015, 29, 3665–3676. [Google Scholar] [CrossRef]
- Wang, J.; Ye, B.; Zhang, S.; Li, J.; Wu, J.; Zhou, Z. Changing feature of CO2 fluxes in alpine meadow in the upper reaches of Shule River, Qilianshan. J. Glaciol. Geocryol. 2011, 33, 646–653. [Google Scholar]
- Gao, M.; Han, T.; Wang, J.; Qin, J.; Wu, H. Variations of the components of radiation in permafrost region of the upstream of Shule River. Plateau Meteorol. 2013, 32, 411–422. [Google Scholar]
- Gao, M. The Analyzing and Simulating of Hydrologic Processes in the Upstream of the Shule River Basin. Master’s Thesis, Chinese Academy of Science, Beijing, China, 2012. [Google Scholar]
- Lan, Y.; Liu, J.; Ding, H.; Lu, C.; Shen, Y.; Hu, X.; La, C.; Song, J.; Gao, L. Changes of precipitation in mountainous areas of the three large inland river basins in the Hexi Corridor and their regional differences during 1960–2012. J. Glaciol. Geocryol. 2013, 35, 1475–1480. [Google Scholar]
- Dong, W.; Ding, Y.; Wei, X. Variation of the base flow and its causes in the upper reaches of the Shule River in the Qilian Mountains. J. Glaciol. Geocryol. 2014, 36, 661–669. [Google Scholar]
- Tahir, A.A.; Chevallier, P.; Arnaud, Y.; Ahmad, B. Snow cover dynamics and hydrological regime of the Hunza River Basin, Karakoram Range, Northern Pakistan. Hydrol. Earth Syst. Sci. 2011, 8, 2275–2290. [Google Scholar] [CrossRef] [Green Version]
- Jiang, Y.; Ming, J.; Ma, P.; Wang, P.; Du, Z. Variation in the snow cover on the Qilian Mountains and its causes in the early 21st century. Geomat. Nat. Hazards Risk 2016, 7, 1824–1834. [Google Scholar] [CrossRef] [Green Version]
- Hao, X.; Wang, J.; Li, H. Evaluation of the NDSI Threshold Value in Mapping Snow Cover of MODIS—A case study of snow in the middle Qilian Mountains. J. Glaciol. Geocryol. 2008, 30, 132–138. [Google Scholar]
- Jiang, Y.; Du, W.; Han, T.; Huang, J.; Hao, X.; Liu, W. Analysis of NDSI threshold in mapping snow cover based on HJ-1B data—A case study of snow cover in the Qilian Mountains. J. Glaciol. Geocryol. 2013, 35, 648–655. [Google Scholar]
- Cai, F.; Zhu, Q.; He, H.; Liu, X.; Yu, G. Estimation and Spatio-Temporal Distribution of Monthly Mean Surface Albedo in China. Resour. Sci. 2005, 27, 114–120. [Google Scholar]
- Wan, X.; Kang, S.; Li, Y.; Chen, F.; Cong, Z.; Zhang, G. Temporal and spatial variations of snow cover and its effect factors in the Nam Co basin, Tibetan Plateau, 2007–2011. J. Glaciol. Geocryol. 2013, 6, 1400–1409. [Google Scholar]
- Pu, Z.; Xu, L.; Salomonson, V.V. MODIS/Terra observed seasonal variations of snow cover over the Tibetan Plateau. Geophys. Res. Lett. 2007, 34, L06706. [Google Scholar] [CrossRef] [Green Version]
- Dang, S.; Liu, C.; Wang, Z.; Wu, M. Spatio-Temporal Distribution Characteristics of Snow Cover in the Upper Reaches of Heihe River Basin over the Past 10 Years and the Variation Trend. Resour. Sci. 2012, 34, 1574–1581. [Google Scholar]
- Yan, W.; Liu, J.; Luo, G.; Dong, K.; Lu, W.; Du, X. Snow cover area changes in the Yurungkax River Basin of West Kunlun Mountains during 2000–2013 using MODIS data. Prog. Geogr. 2014, 33, 315–325. [Google Scholar]
- Zhang, Z.; Deng, S.; Zhao, Q.; Zhang, S.; Zhang, X. Projected glacier meltwater and river run-off changes in the upper reach of the Shule River basin, northeastern edge of the Tibetan Plateau. Hydrol. Process. 2019, 33, 1059–1074. [Google Scholar] [CrossRef]
- Guo, J.; Li, Z.; Li, F.; Zhang, S. Evaluation on snow coverage and snow depth simulated by VIC-CAS model based on multi-source remote sensing data in mountainous upper reach of the Shule River basin. J. Glaciol. Geocryol. 2021, 43, 650–661. [Google Scholar]
- Yan, Y.; Che, T.; Li, H.; Qin, Y. Using snow remote sensing data to improve the simulation accuracy of spring snow-melt runoff: Take Babao River basin as an example. J. Glaciol. Geocryol. 2016, 38, 211–221. [Google Scholar]
- Li, H.Y.; Zhao, Q.D.; Wu, J.K. Quantitative simulation of the runoff components and its variation characteristics in the upstream of the Shule River. J. Glaciol. Geocryol. 2019, 41, 907–917. [Google Scholar]
- Zhang, G.; Xie, H.; Yao, T.; Li, H.; Duan, S. Quantitative water resources assessment of Qinghai Lake basin using Snowmelt Runoff Model (SRM). J. Hydrol. 2014, 519, 976–987. [Google Scholar] [CrossRef]
- Qin, J.; Ding, Y.J.; Yang, G.J. The hydrological linkage of mountains and plains in the arid region of northwest China. Chin. Sci. Bull. 2013, 58, 3140–3147. [Google Scholar] [CrossRef] [Green Version]
- Han, T.D.; Gao, M.J.; Ye, B.S.; Jiao, K.Q. Characteristic of runoff process of the glacier and permafrost in the headwaters of the Urumqi river. J. Glaciol. Geocryol. 2010, 32, 573–579. [Google Scholar]
- Wei, Z.; Wen, J.; Lu, S.; Chen, S.; Ao, Y.; Liang, L. A Primary Field Experiment of Land-Atmosphere Interaction over the Loess Plateau and Its Ground Surface Energy in Clear Day. Plateau Meteorol. 2005, 36, 545–555. [Google Scholar]
- Yao, J.; Yang, Q.; Chen, Y.; Hu, W.; Zhao, L. Climate change in arid areas of northwest china in past 50 years and its effects on the local ecological environment. Chin. J. Ecol. 2013, 32, 1283–1291. [Google Scholar]
- Xu, H.; Yang, T.; Zhang, X. Climate change in upstream area of shule river and its effects on runoff-yield in last 50 years. Bull. Soil Water Conserv. 2014, 34, 39–46. [Google Scholar]
- He, Y.; Pang, H.; Lu, A.; Zhang, D.; Zhang, Z.; Ning, B.; Song, B.; Zhao, J.; Yuan, L. Spatial and temporal variations of the stable isotopes in snow packs and glacial runoff in different types of glacier areas in China. J. Glaciol. Geocryol. 2006, 28, 22–28. [Google Scholar]
- Rou, A.; Yu, S.R. Analysis of snow cover distribution and its changes in the Ili River Valley. Sci. Surv. Mapp. 2020, 45, 157–164. [Google Scholar]
| Publisher’s Note: MDPI stays neutral with regard to jurisdictional claims in published maps and institutional affiliations. |
© 2021 by the authors. Licensee MDPI, Basel, Switzerland. This article is an open access article distributed under the terms and conditions of the Creative Commons Attribution (CC BY) license (https://creativecommons.org/licenses/by/4.0/).


