Article

Water Quality Variability and Related Factors along the Yangtze River Using Landsat-8

1
School of Mechatronic Engineering and Automation, Shanghai University, Shanghai 200444, China
2
Shanghai Astronomical Observatory, Chinese Academy of Sciences, Shanghai 200030, China
3
College of Sciences, Shanghai University, Shanghai 200444, China
*
Author to whom correspondence should be addressed.
Remote Sens. 2021, 13(12), 2241; https://doi.org/10.3390/rs13122241
Submission received: 16 April 2021 / Revised: 2 June 2021 / Accepted: 7 June 2021 / Published: 8 June 2021

Abstract

:
Chlorophyll-a (Chl-a), total nitrogen (TN), and total phosphorus (TP) are important indicators to evaluate water environmental quality. Monitoring water quality and its variability can help control water pollution. However, traditional monitoring techniques of water quality are time-consuming and laborious, and can mostly conduct with sample point-to-point at the edge of lakes and rivers. In this study, an empirical (regression-based) model is proposed to retrieve Chl-a, TN, and TP concentrations in the Yangtze River by Landsat-8 images from 2014 to 2020. The spatial-temporal distribution and variability of water quality in the whole Yangtze River are analyzed in detail. Furthermore, the driving forces of water quality variations are explored. The results show that the mean absolute percentage error (MAPE) of the water quality parameters are 25.88%, 4.3%, and 8.37% for Chl-a, TN, and TP concentrations, respectively, and the root mean square errors (RMSE) are 0.475 μg/L, 0.110 mg/L, and 0.01 mg/L, respectively. The concentrations of Chl-a, TN, and TP in the upstream of the Yangtze River are lower than those in the midstream and downstream. These water quality parameters have a seasonal cycle with a maximum in summer and minimum in winter. The hydrological and meteorological factors such as water level, flow, temperature, and precipitation are positively correlated with Chl-a, TN, and TP concentrations. The larger the impervious surface and cropland area, the greater the cargo handling capacity (CHC), higher ratio of TP to TN will further pollute the water. The methods and results provide essential information to evaluate and control water pollution in the Yangtze River.

1. Introduction

The Yangtze River is the mother river of China, which originates from the Qinghai-Tibet Plateau. Its mainstream flows through 11 provincial administrative regions and spans the three major economic regions of eastern, central, and western China. The basin covers a total area of 1.8 million square kilometers and contains abundant resources. However, in the past two decades, due to the continuous increase in the total amount of sewage discharge in the river basin, some ecological conditions of rivers have gradually deteriorated, and the ecological balance of the Yangtze River has been destroyed [1]. The ecological environment of the Yangtze River basin and the residents around the Yangtze River have been severely affected [2]. According to the Bulletin of the Water Resources of the Yangtze River Basin and Southwestern Rivers in 2018, the main pollution items are ammonia nitrogen, TP, etc. Therefore, it is of great significance to monitor river water quality and explore the mechanism of eutrophication for the management, control, and treatment of water bodies. The conventional water quality monitoring approach generally collects water samples on the spot and carries them to the laboratory for analysis. Although this approach has high accuracy, it is time-consuming and labor-intensive. It can only sample point-to-point at the edge of lakes and rivers and cannot monitor the water quality of the entire water surface. Meanwhile, it is challenging to meet the requirements of long-term, large-scale monitoring of river and lake dynamics. Remote sensing monitoring has the advantages of long duration, large scale, short monitoring period, and low cost, making up for the shortcomings of traditional monitoring methods [3]. In water pollution monitoring, remote sensing technology can quickly monitor the ins and outs of pollutants and provide reliable solutions rapidly.
For the past 50 years, remote sensing has shown strong capabilities to monitor and evaluate the quality of water [4]. Current remote sensing is primarily used to retrieve water quality parameters by empirical models. The common method is to extract the most relevant variables from the spectral band values and fit a standard linear regression model with the time-consistent in-situ water quality measurement values [5]. For instance, Li et al. used the reflectance of four bands of Landsat 8 OLI to construct an empirical retrieval model for TN and TP retrieval [6]. Lim estimated the concentrations of TN, phosphorus, and Chl-a in the Nakdong River using a multiple linear regression (MLR) model based on Landsat-8 [7]. Nazeer et al. divided water bodies into 5 categories by clustering and then established a local artificial neural network model for each type of water body to retrieve Chl-a and suspended soild (SS) [8]. Mohsen applied stepwise multi-linear regression technique to retrieve water quality parameters (Chl-a, TSS, PH, Fe, Zn, Cr, and N H 4 ) with reasonable accuracy [9].
Climate changes have a significant impact on the water environment. Many scholars analyzed the spatial and temporal variations of water quality parameters based on the retrieval results. Le et al. estimated Chl-a concentration in the Chesapeake Bay which had strong spatial gradients, seasonality, and climate-driven inter-annual changes [10]. Kahru et al. used empirical algorithms to create a 15-year time series of Chl-a concentration in the California Current region and analyzed the trend and distribution of Chl-a [11]. Moradi used MODIS data to evaluate the spatial and temporal variations and trends of SST and Chl-a in the Persian Gulf and found that the Chl-a pattern was heterogeneous in both time and spatial scale [12]. Gao investigated the long-term trend of Chl-a in the Pearl River Plume and found decreasing trends for all percentiles of the Chl-a in the PRP, suggesting a decrease in productivity in the past two decades [13].
In this paper, the water quality parameters and related factors along the Yangtze River are investigated by Landsat-8. Firstly, a suitable model is established to retrieve Chl-a, TN, and TP concentrations in the Yangtze River. Secondly, the spatial and temporal variations of water quality parameters are analyzed in the Yangtze River. Finally, the mechanism and driving forces of water quality variation in the Yangtze River are discussed, and suggestions on the control of water quality are put forward.

2. Study Area and Data

2.1. Study Area

The study area is shown in Figure 1. Moreover, there have been many studies and analyses on the water environment and water quality of the Yangtze River. The water quality in the Yangtze River source area has been good in recent years, and most of the regional water quality indicators have reached Class 1 and 2 water standards. The inter-annual difference in water quality is slight and fluctuates within the same range [14]. From 1992 to 2016, the chemical oxygen demand (COD) and TP in the mainstream of the Three Gorges Dam were reduced by 40.9% ± 9.9% and 22.2% ± 9.7%, respectively. From 2003 to 2016, TN and ammonia nitrogen increased by 1.3% ± 2.4% and 8.2% ± 2.6% [15]. Due to the rapid water exchange in the mainstream, the river has moderate nutrient concentrations, and there has never been a bloom. The TN and TP concentrations in the tributaries have been rising since 2006 [16]. In recent years, the government has continuously strengthened the comprehensive monitoring and management of the water environment and water ecology in the Yangtze River and continued to apply water source protection special rectification and waterbody management. Therefore, it is essential to monitor the long-term water quality of the whole Yangtze River’s mainstream and provide primary data for water quality management such as nitrogen and phosphorus control.

2.2. Data

2.2.1. Remote Sensing Data

The precomputed surface reflectance (SR) Landsat collections from January 2014 to December 2020 were used in this study (LANDSAT/LC08/C01/T1_SR). This dataset was the atmospherically corrected surface reflectance from the Landsat 8 OLI/TIRS sensors. These images contain 5 visible and near-infrared (VNIR) bands and 2 short-wave infrared (SWIR) bands, and two thermal infrared (TIR) bands of brightness temperature with a resolution of 30 m.

2.2.2. Data Preprocessing

In order to remove the influence of clouds, a pixel QA band was used to mask clouds in surface reflectance (SR) data. Before establishing a model between water quality parameters and surface reflectance, we obtained the surface reflectance at the location within 5 days before or after based on the date of in-situ data collection. When retrieving the water quality of each month, we used the median value of the month on each pixel as the surface reflectance.

2.2.3. In-Situ Observations

From 10 September to 30 September 2020, we carried out in-situ measurements at 5 locations, as shown in Figure 2, and 28 samples were taken at each location, including Nanjing (Jiangsu) on the 10th, Chizhou (Anhui) on the 12th, Jiujiang (Jiangxi) on the 14th, Yueyang (Hunan) on the 27th, and Yichang (Hubei) on the 30 September 2020. A total of 140 points of Chl-a, TN, and TP concentrations in-situ observation data were collected. The Chl-a measuring instrument was EXO1 by American company YSI), and the effective measuring range was 0–400 μg/L. The TN and TP measuring instrument were CM-05 by the Beijing Shuanghui Jingcheng Electronic Products Ltd. The effective measuring range of TP was 0.02–2.5 mg/L, and the effective measuring range of TN was 0.5–25 mg/L. Every sampling operation was in compliance with the water quality sampling technical regulations issued by the Ministry of Water Resources of the People’s Republic of China.

2.2.4. Meteorological Data

The water flow, water level, temperature, and precipitation data in Yichang was from July 2016 to December 2020, and the frequency was once a day. The flow and water level data were officially released by Changjiang Water Resources Committee, and the temperature and precipitation data were from the ERA5-Land reanalysis dataset (ECMWF/ERA5_LAND/HOURLY), which had been produced by replaying the land component of the ECMWF ERA5 climate reanalysis. The reanalysis products combined model data with observations from across the world into a globally complete and consistent dataset using the laws of physics. Reanalysis produces data went several decades back in time and provided an accurate description of the climate of the past.

2.2.5. Other Data

Chongqing’s wastewater discharge, including chemical oxygen demand (COD), ammonia nitrogen, TN, and TP from 2014 to 2018, were taken from the China Environmental Statistics Yearbook, which was compiled by the National Bureau of Statistics, the Ministry of Ecology and Environment, and other relevant ministries. The data of harbor handling capacity of Yichang and Chongqing port from 2018 to 2020 were from the Ministry of Transport of the People’s Republic of China.

2.3. Methods

2.3.1. Characteristics for Water Quality Retrieval

Before constructing the empirical model, it was important to extract informative characteristics from the spectral bands. Therefore, based on the study of Niroumand-Jadidi et al. [17], 4 characteristic types were proposed from the spectral bands.
(A)
Common standard characteristics
In many water quality retrieval studies, band ratio ( F T 1 ) is the most common spectral-derived characteristic. Kim et al. used band 2, band 5, and Band 2/Band 4 of Landsat-8 to retrieve Chl-a concentration [18]. Wu et al. used a combination of TM1, TM3/TM2, and TM1/TM3 data to correlate Chl-a concentration and SD measurements with TP concentration [19]. Normalized difference indices ( F T 2 ) had also been widely used for estimating water quality parameters. M Vassiliki combined a variety of normalized indexes with band ratio to establish a multiple regression equation to retrieve Chl-a [20]. Spectral derivative ( F T 3 ) was not common, but in some experiments, it performed well. Based on the in situ hyperspectral reflectance, Cheng et al. found that the first-order derivative model after spectral smoothing could be used for Chl-a estimation [21]. Equations (1)–(3) can be applied to any possible band combination:
F T 1 = b i b j ,   i = 1 , , N 1 ,   j = i + 1 , , N
F T 2 = b i b j λ i λ j ,   i = 1 , , N 1 ,   j = i + 1
F T 3 = b i b j b i + b j ,   i = 1 , , N 1 , j = i + 1 , , N
where b i and b j are spectral bands, λ i and λ j are the central wavelengths of b i and b j .
(B)
Characteristics based on color space transformation
The characteristics were derived from a transformation of spectral characteristic space to hue-saturation-intensity (HSI)-inspired characteristic space. HSI space can describe the information contained in water bodies well, and, therefore, the retrieval of water quality parameters can be potentially enhanced [17]. In remote sensing applications, the HIS space transformation process can be used for shadow detection [22] and the retrieval of fluvial bathymetry [23]. Equations (4)–(6) can be applied to any possible band combination:
F T 4 = ω   i f   b i b i 360 ω   i f   b i > b i   ,   ω = c o s 1 0.5 b k b j + b k b i b k b j 2 + b k b j b j b i 2
F T 5 = 1 3 b i + b j + b k min b i , b j , b k
F T 6 = b i + b j + b k 3
where i = 1 , , N 2 ,   j = i + 1 , , N 1 , k = j + 1 , , N , where b i and b j are spectral bands, λ i and λ j are the central wavelengths of b i and b j .
(C)
Characteristics based on coordinate system transformation
The characteristics were derived from the coordinate system transformation of spectral characteristic space. The coordinate system transformation in characteristic space had been applied to change detection analysis [24]. Here it was used in the field of remote sensing water quality retrieval and the characteristics azimuth ( F T 7 ), elevation ( F T 8 ), and radius ( F T 9 ) can be applied to any possible band combination:
F T 7 = t a n 1 b i b j
F T 8 = t a n 1 b k b i 2 + b j 2
F T 9 = b i 2 + b j 2 + b k 2
where i = 1 , , N 2 ,   j = i + 1 , , N 1 , k = j + 1 , , N , where b i and b j are spectral bands, λ i and λ j are the central wavelengths of b i and b j .
(D)
Characteristics based on directional cosines
The characteristics were based on directional cosines that characterize directional properties in spectral characteristic space and can be applied to the separation of topographic expression of land use classification [25] and calculation of spectral direction change [26]. This study applied it to remote sensing water quality retrieval. Equations (10)–(12) can be applied to any possible band combination:
F T 10 = b i b i 2 + b j 2 + b k 2
F T 11 = b j b i 2 + b j 2 + b k 2
F T 12 = b k b i 2 + b j 2 + b k 2
where i = 1 , , N 2 ,   j = i + 1 , , N 1 , k = j + 1 , , N , where b i and b j are spectral bands, λ i and λ j are the central wavelengths of b i and b j .

2.3.2. Regression Modeling Validation

According to previous studies, the linear function, quadratic function and exponential function were common fitting functions for the retrieval of water quality parameters [5]. After the comparison, the quadratic function performed the best. For a given characteristic F , the water quality parameter C was estimated by the following regression model:
y = a F 2 + b F + c
where y is the interesting water quality parameter to be estimated, a, b, and c are the unknown parameters to be estimated, and F is a given characteristic.
The collected samples were divided into 2 groups, which were used to train and verify the regression model. The training samples were used to estimate the parameters (a, b, c) of the regression model, and then independent verification samples were used to evaluate the regression model. Estimations are y ^ = y 1 ^ , y 2 ^ , , y n ^ , and known values are y = y 1 , y 2 , , y n . RMSE and MAPE are used as the evaluation indicators of the model.

2.3.3. Regression Modeling Validation

Threshold segmentation was applied to extract the water body of the mainstream in the Yangtze River. In this study, the normalized difference water index (NDWI) was calculated to enhance the water body and suppressed other feature information. Then, the Otsu algorithm was used to obtain an appropriate threshold and extract the water body information of the mainstream of the Yangtze River. The NDWI can be calculated as follows:
N D W I = ρ G r e e n ρ N I R ρ G r e e n + ρ N I R
where ρ G r e e n is the green band and ρ N I R is the near-infrared band.

2.4. Fitting Function of the Water Quality Parameters Times Series

The pattern of Chl-a concentration fluctuation was dominantly seasonal [27]. To fit the water quality parameters time series in the Yangtze River from January 2014 to December 2020, a fitting equation of the periodic variation of precipitable water vapors (PWV) was used as [28]:
WQP = k 0 + k 1 · cos M c 1 12 · 2 π + k 2 · cos M c 2 12 · 4 π + ε
where k 0 is a constant term; k 1 , k 2 ,   c 1 and c 2   are the amplitude and phase at the period (1 year and 0.5 years); M is the month of the year and ε is the residual. The least-square method was used to determine the unknown parameters in Equation (15) with the water quality parameters time series.

3. Results and Analysis

3.1. Regression Analysis

B1–B7 bands of Landsat-8 were chosen, and the approach in 2.3.1 was used to create characteristics. The band combinations of each characteristic were regression with the water quality parameters. There were 55 Chl-a points and 86 TN/TP points, which were divided into training sets and verification sets. And we obtained the coefficients of the regression equation from the training set. Then the MAPE and RMSE were calculated from the validation set. RMSE and MAPE of all models were compared to filter out the best model with the highest accuracy.
The regression analysis of water quality parameter concentrations is shown in Table 1. Figure 3 shows the different characteristics in comparison to accuracy when retrieving water quality parameters. For the retrieval of Chl-a, the best characteristic was F T 11 , referred to as Equation (11), the model MAPE was 26.89%, the RMSE was 0.529 μ g / L , and R 2 was 0.95. For the retrieval of TN, the best characteristic was F T 2 , referred to as Equation (2), the model MAPE was 4.52%, the RMSE was 0.092 mg/L, and R 2 was 0.80. For the retrieval of TP, the best characteristic was F T 6 , referred to as Equation (6), the model MAPE was 6.13%, the RMSE was 0.008 mg/L, and R 2 was 0.87. Furthermore, when comparing the retrieval performance of different characteristics, Chl-a and TN were relatively less sensitive to different characteristics, while TP was relatively higher, thus choosing a suitable characteristic can effectively improve the accuracy of the retrieval. In Figure 4, the residual analysis verified that these three models were acceptable and valid. For the retrieval of these three water quality parameters, TP had the highest accuracy, second TN, and finally Chl-a.

3.2. Spatial-Temporal Variations of Water Quality Parameters

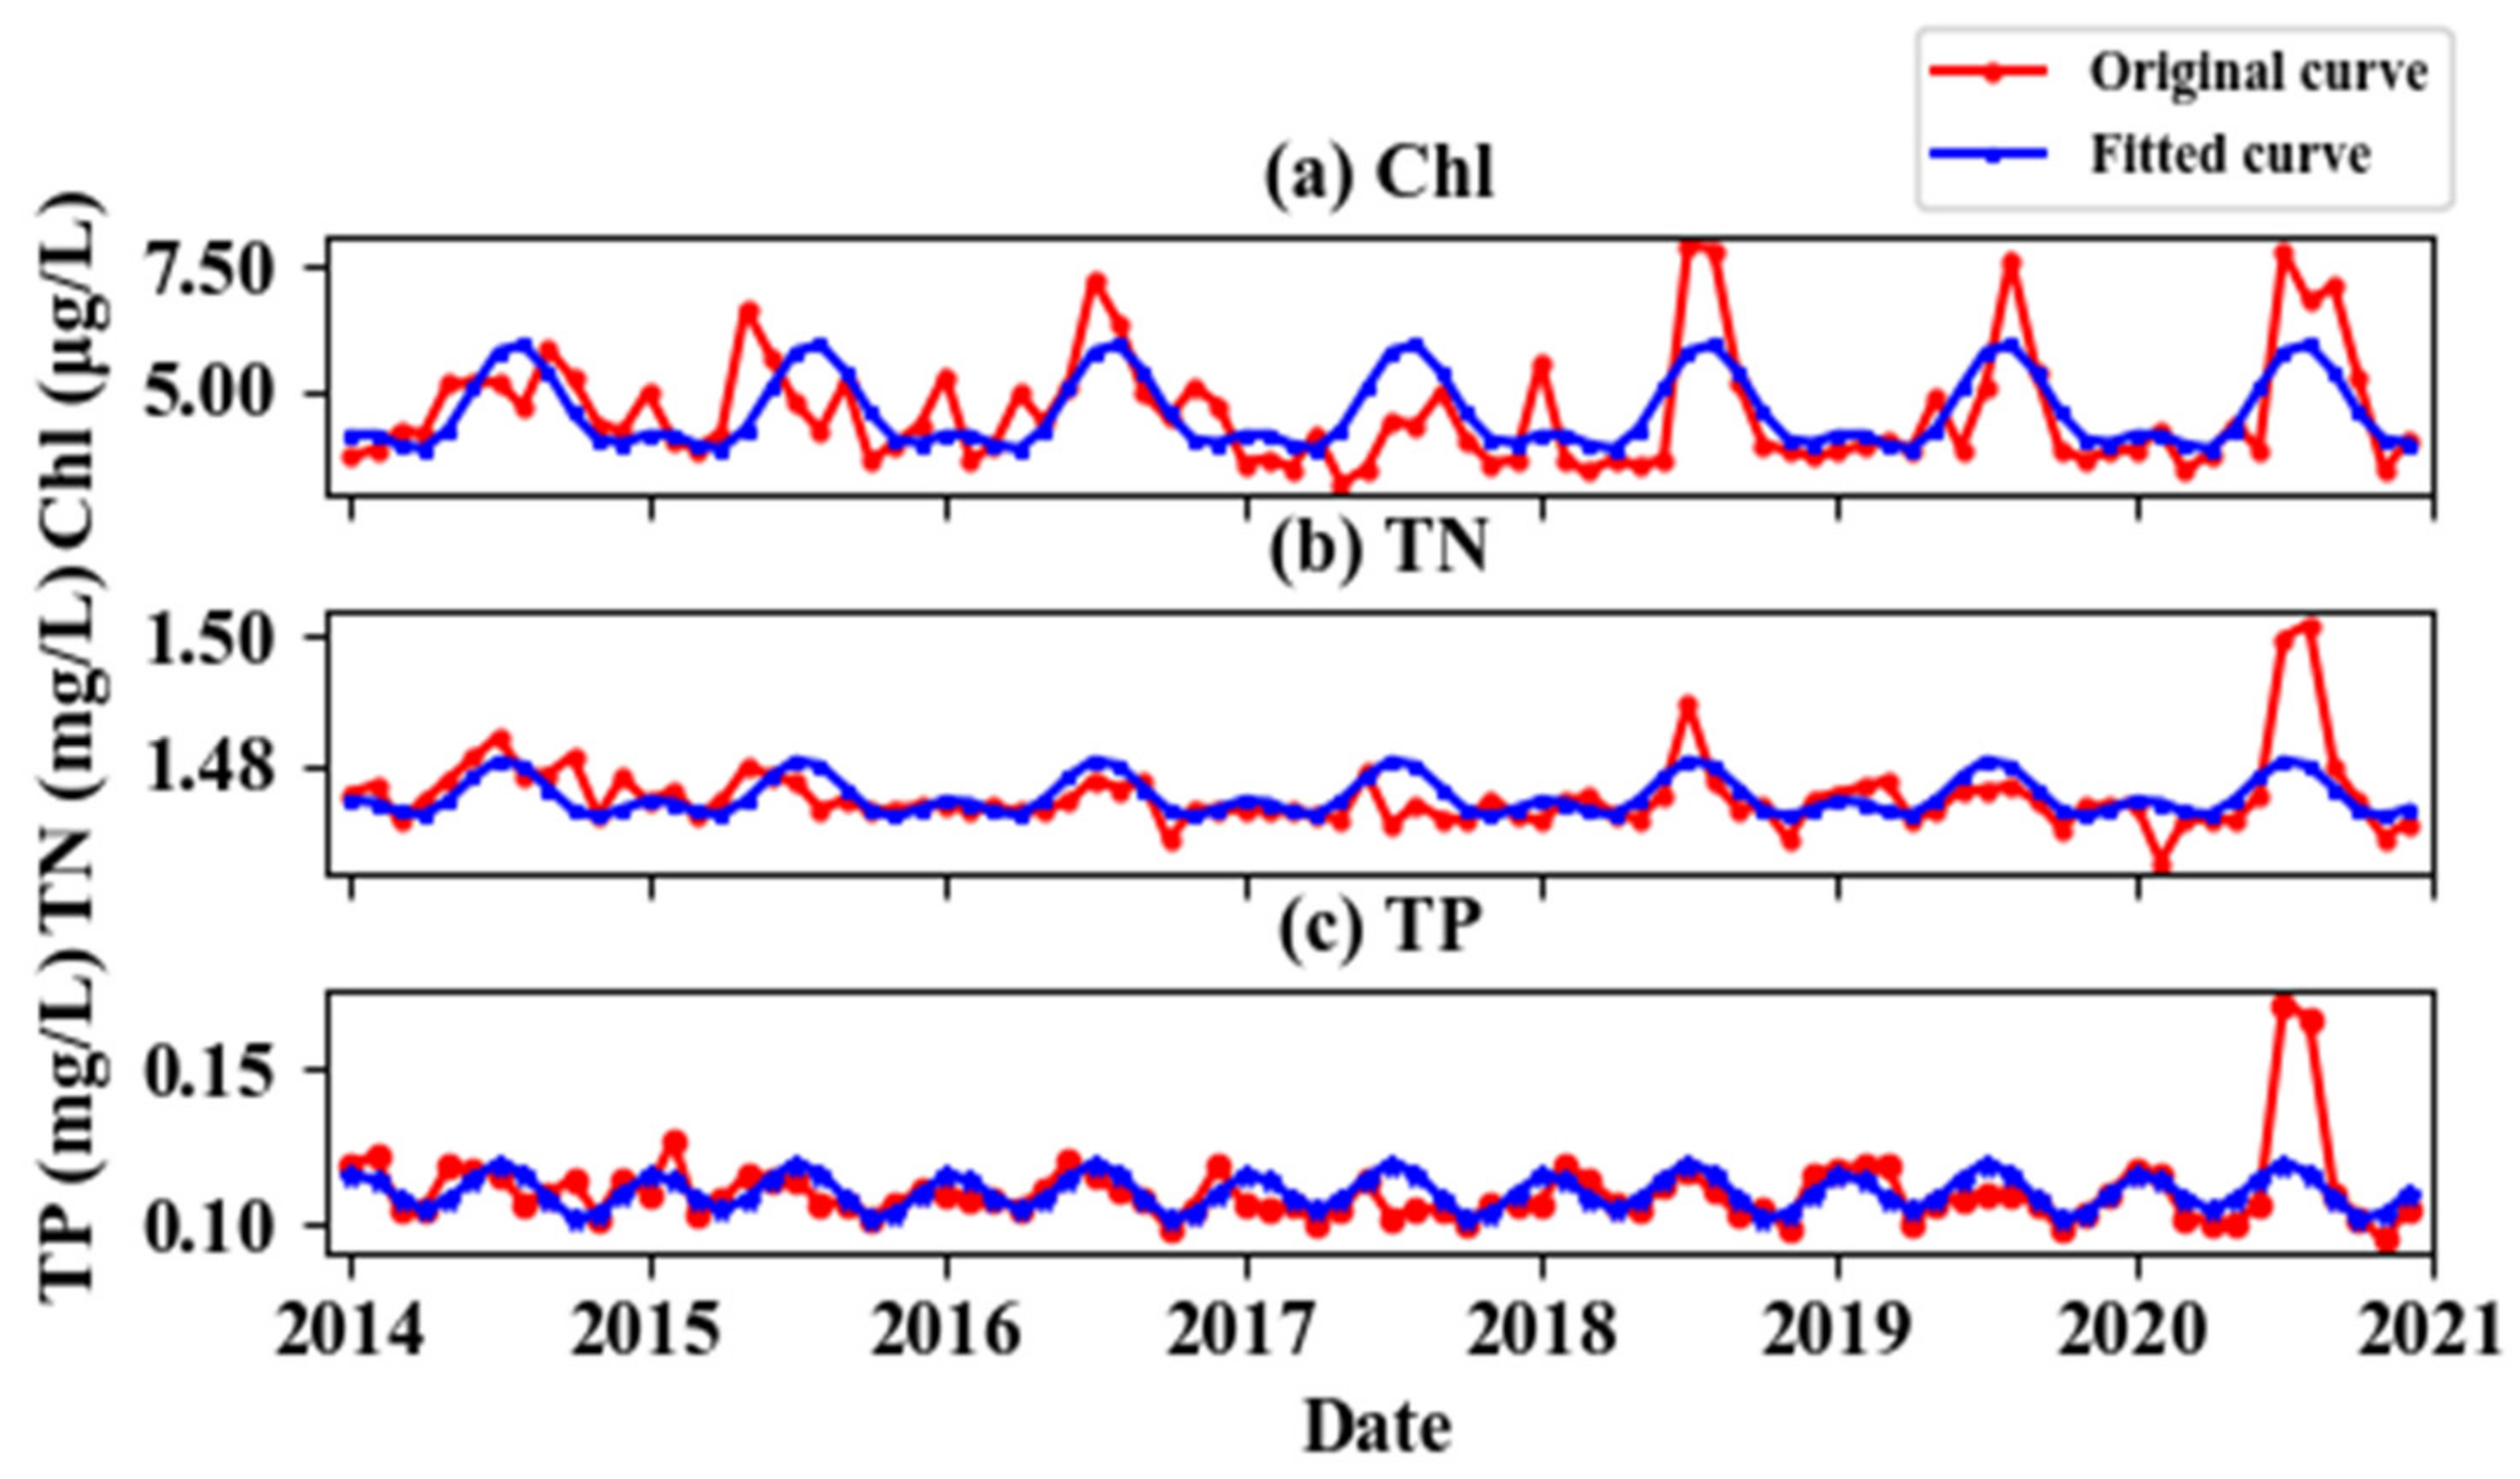
3.2.1. Monthly and Annual Variations

Since the Landsat-8 images have a high temporal and spatial resolution, we can obtain monthly Landsat-8 images coverage of the Yangtze River. NDVI was used from Landsat-8, and the regression equations were used to retrieve water quality parameters along the Yangtze River mainstream.
The water quality parameters in the Yangtze River were retrieved from January 2014 to December 2020, and the variations of water quality parameters were analyzed during the year. Figure 5 shows the monthly variations of water quality parameters. The Chl-a, TN, and TP concentrations have similar variation characteristics every year. The Chl-a concentration rose in the first and second quarter of each year and declined in the third and fourth quarter. Generally, the Chl-a concentration reached the highest value in summer and reached the lowest value in winter. As for the concentrations of TN and TP, both have the same trend of change and reached the highest value in the first or third quarter. However, they had no obvious trend in other quarters. As shown in Figure 5d, the average Chl-a, TN, and TP concentrations were relatively stable for the past 7 years, with only a slight decrease.
In addition, we used the method in (2.3.4) to analyze the monthly and annual variations of the water quality parameters from 2014 to 2020, and the curve fitting results are shown in Figure 6. The annual and semi-annual variation amplitudes were −0.91 μ g / L and 0.48 μ g / L for Chl-a, −0.0039 mg / L and 0.0032 mg / L for TN, and −0.0024 mg / L and 0.0022 mg / L for TP. It can be seen that the annual variations in the water quality of the Yangtze River were the most obvious, followed by half a year. The Chl-a and TN reached their maximum values in July and the minimum in January. TP reached its maximum value in June and the minimum in December.
In terms of the spatial distribution of water quality parameters concentrations, the average value of upstream (Chongqing-Yichang), midstream (Yichang-Jiujiang), and downstream (Jiujiang-Shanghai) were counted separately in Figure 7. The Chl-a, TN, and TP concentrations in upstream were lower than those in midstream and downstream. Chl-a, TN, and TP concentrations were similar in midstream and downstream, and there was little difference between them.

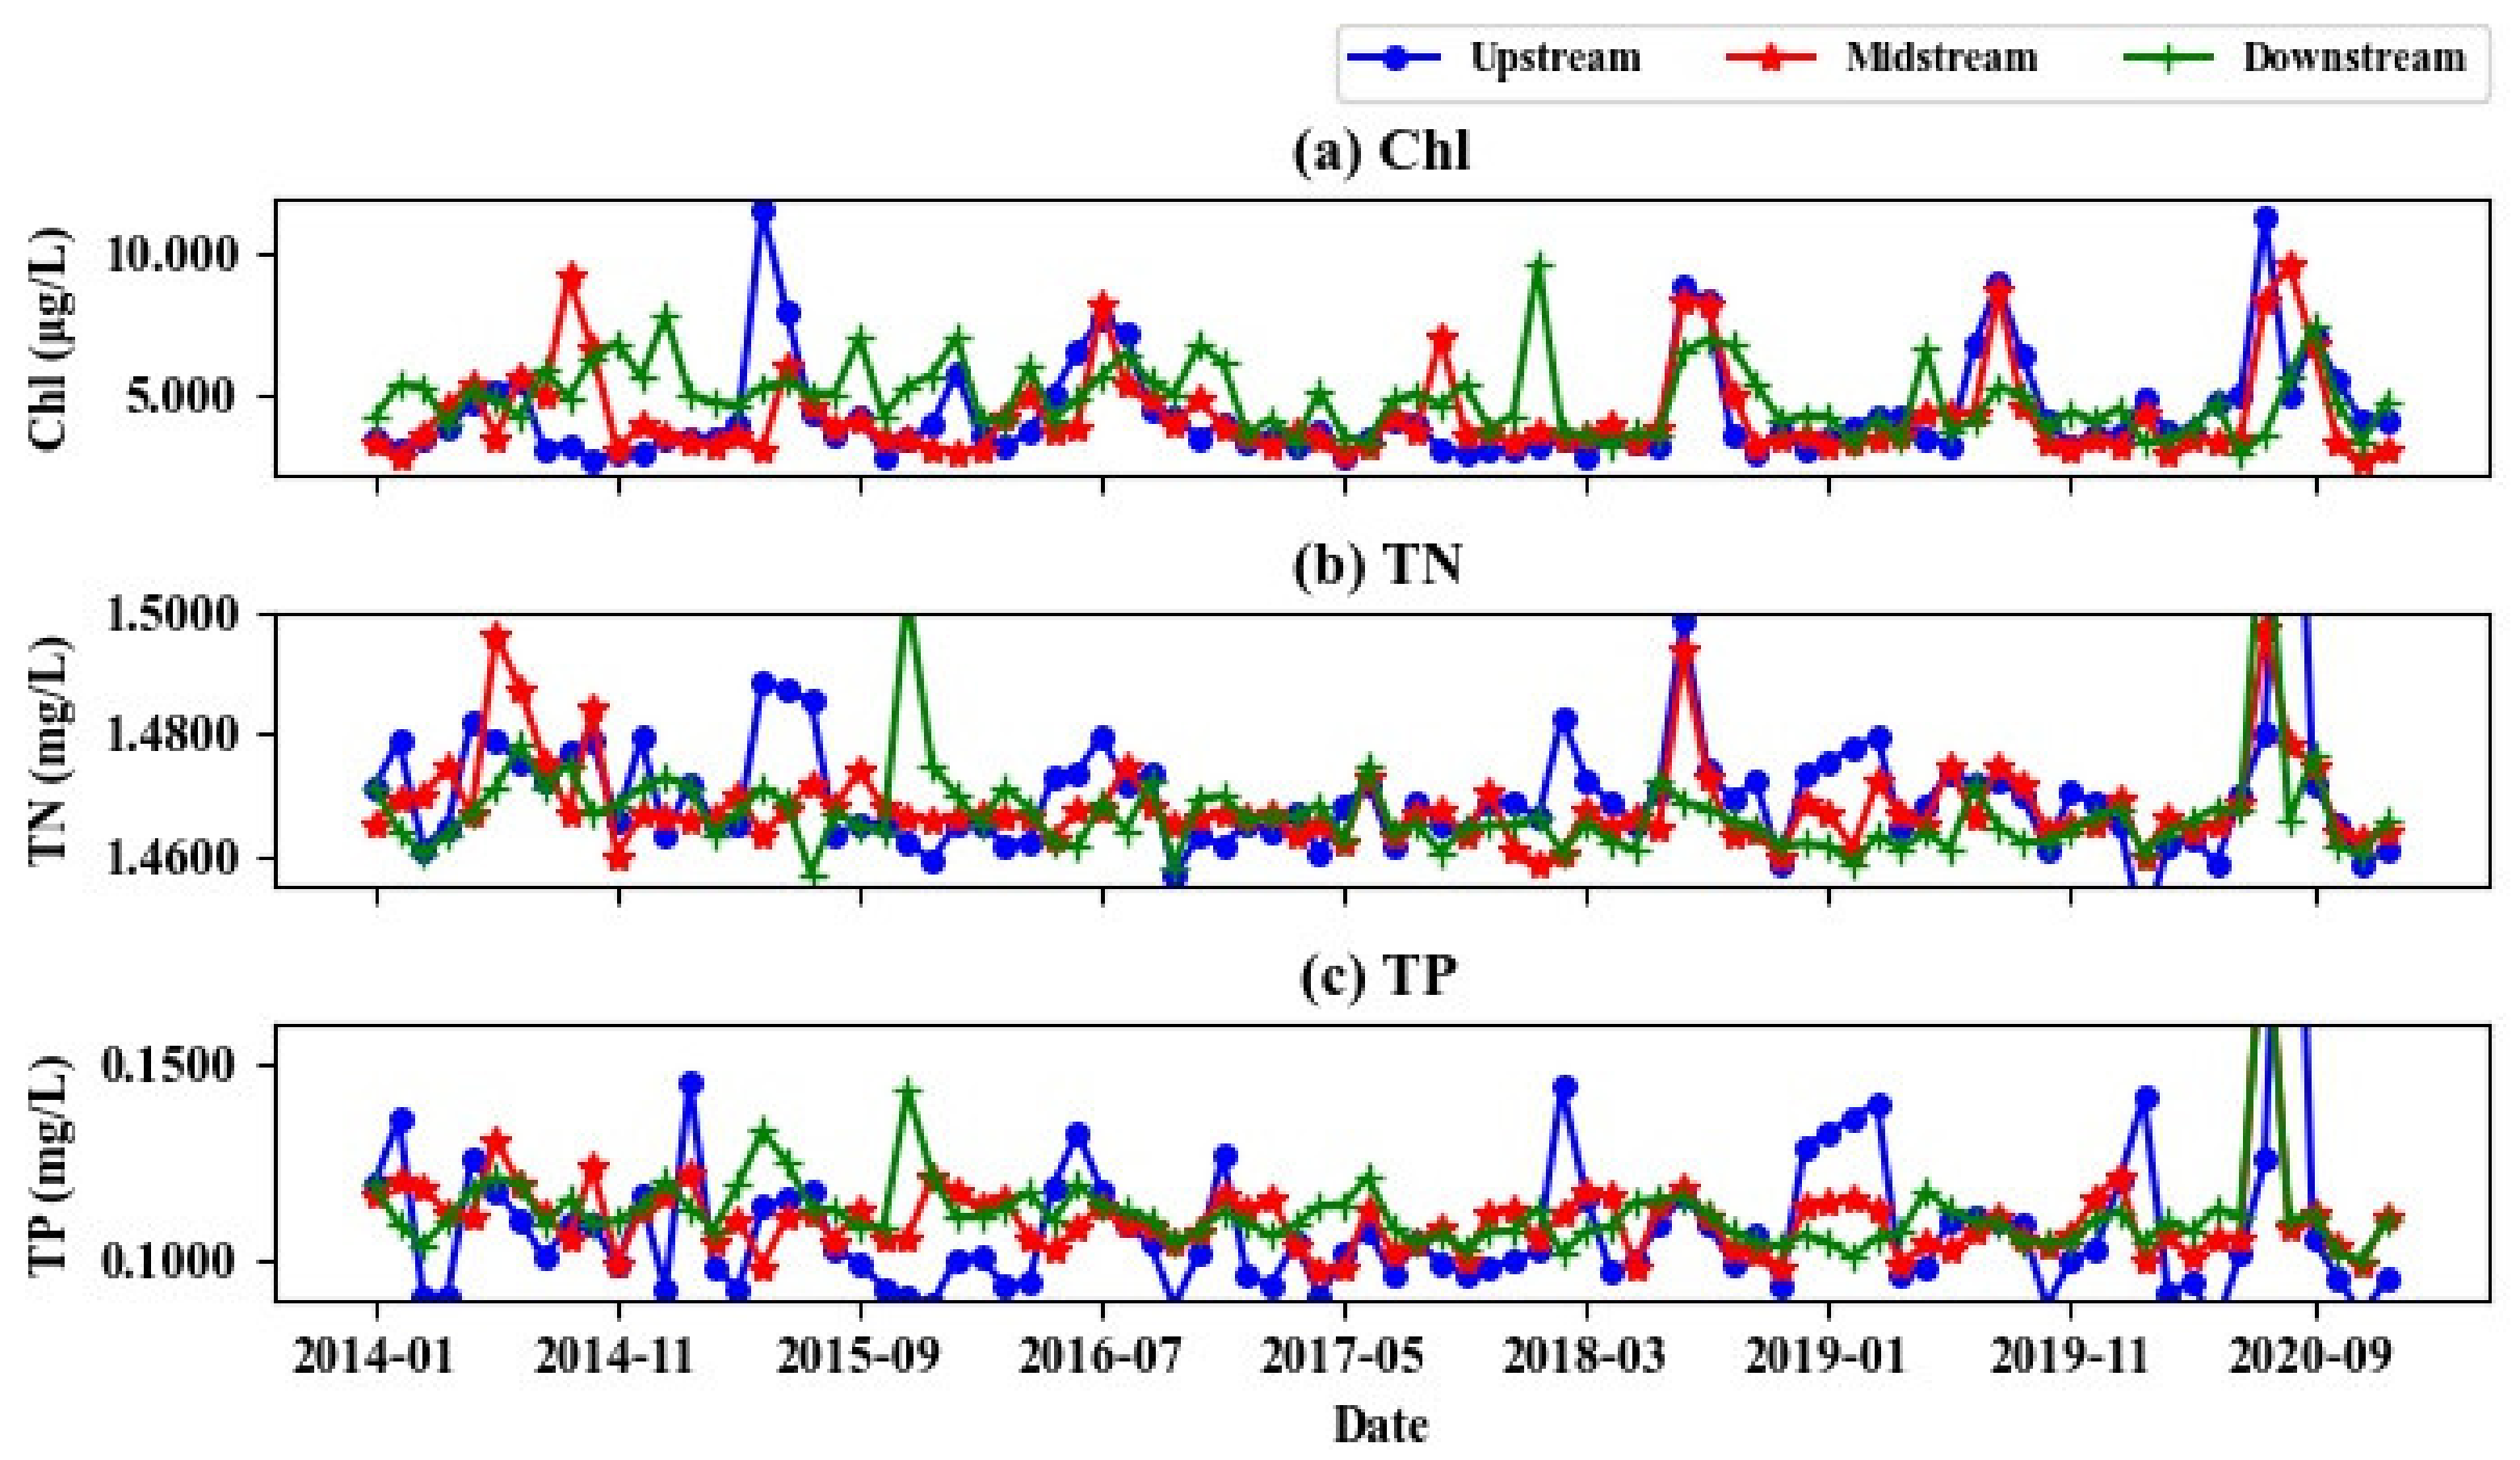
3.2.2. Seasonal Variations of Water Quality Parameters for the Yangtze River Sections

Four important sections in the Yangtze River were selected for analyzing seasonal variations of water quality parameters, including Yichang, Hubei, Chenglingji, Hunan, Chizhou, Anhui, and Wuhan, Hubei. The Chl-a, TN, and TP concentrations of the sections in the past 7 years were calculated using the retrieval model and the results of curve fitting are shown in Figure 8. The result showed that the water quality variations had annual cycles, and the fitted coefficients were shown in Table 2.

3.3. Relationship Between Water Quality and Other Factors

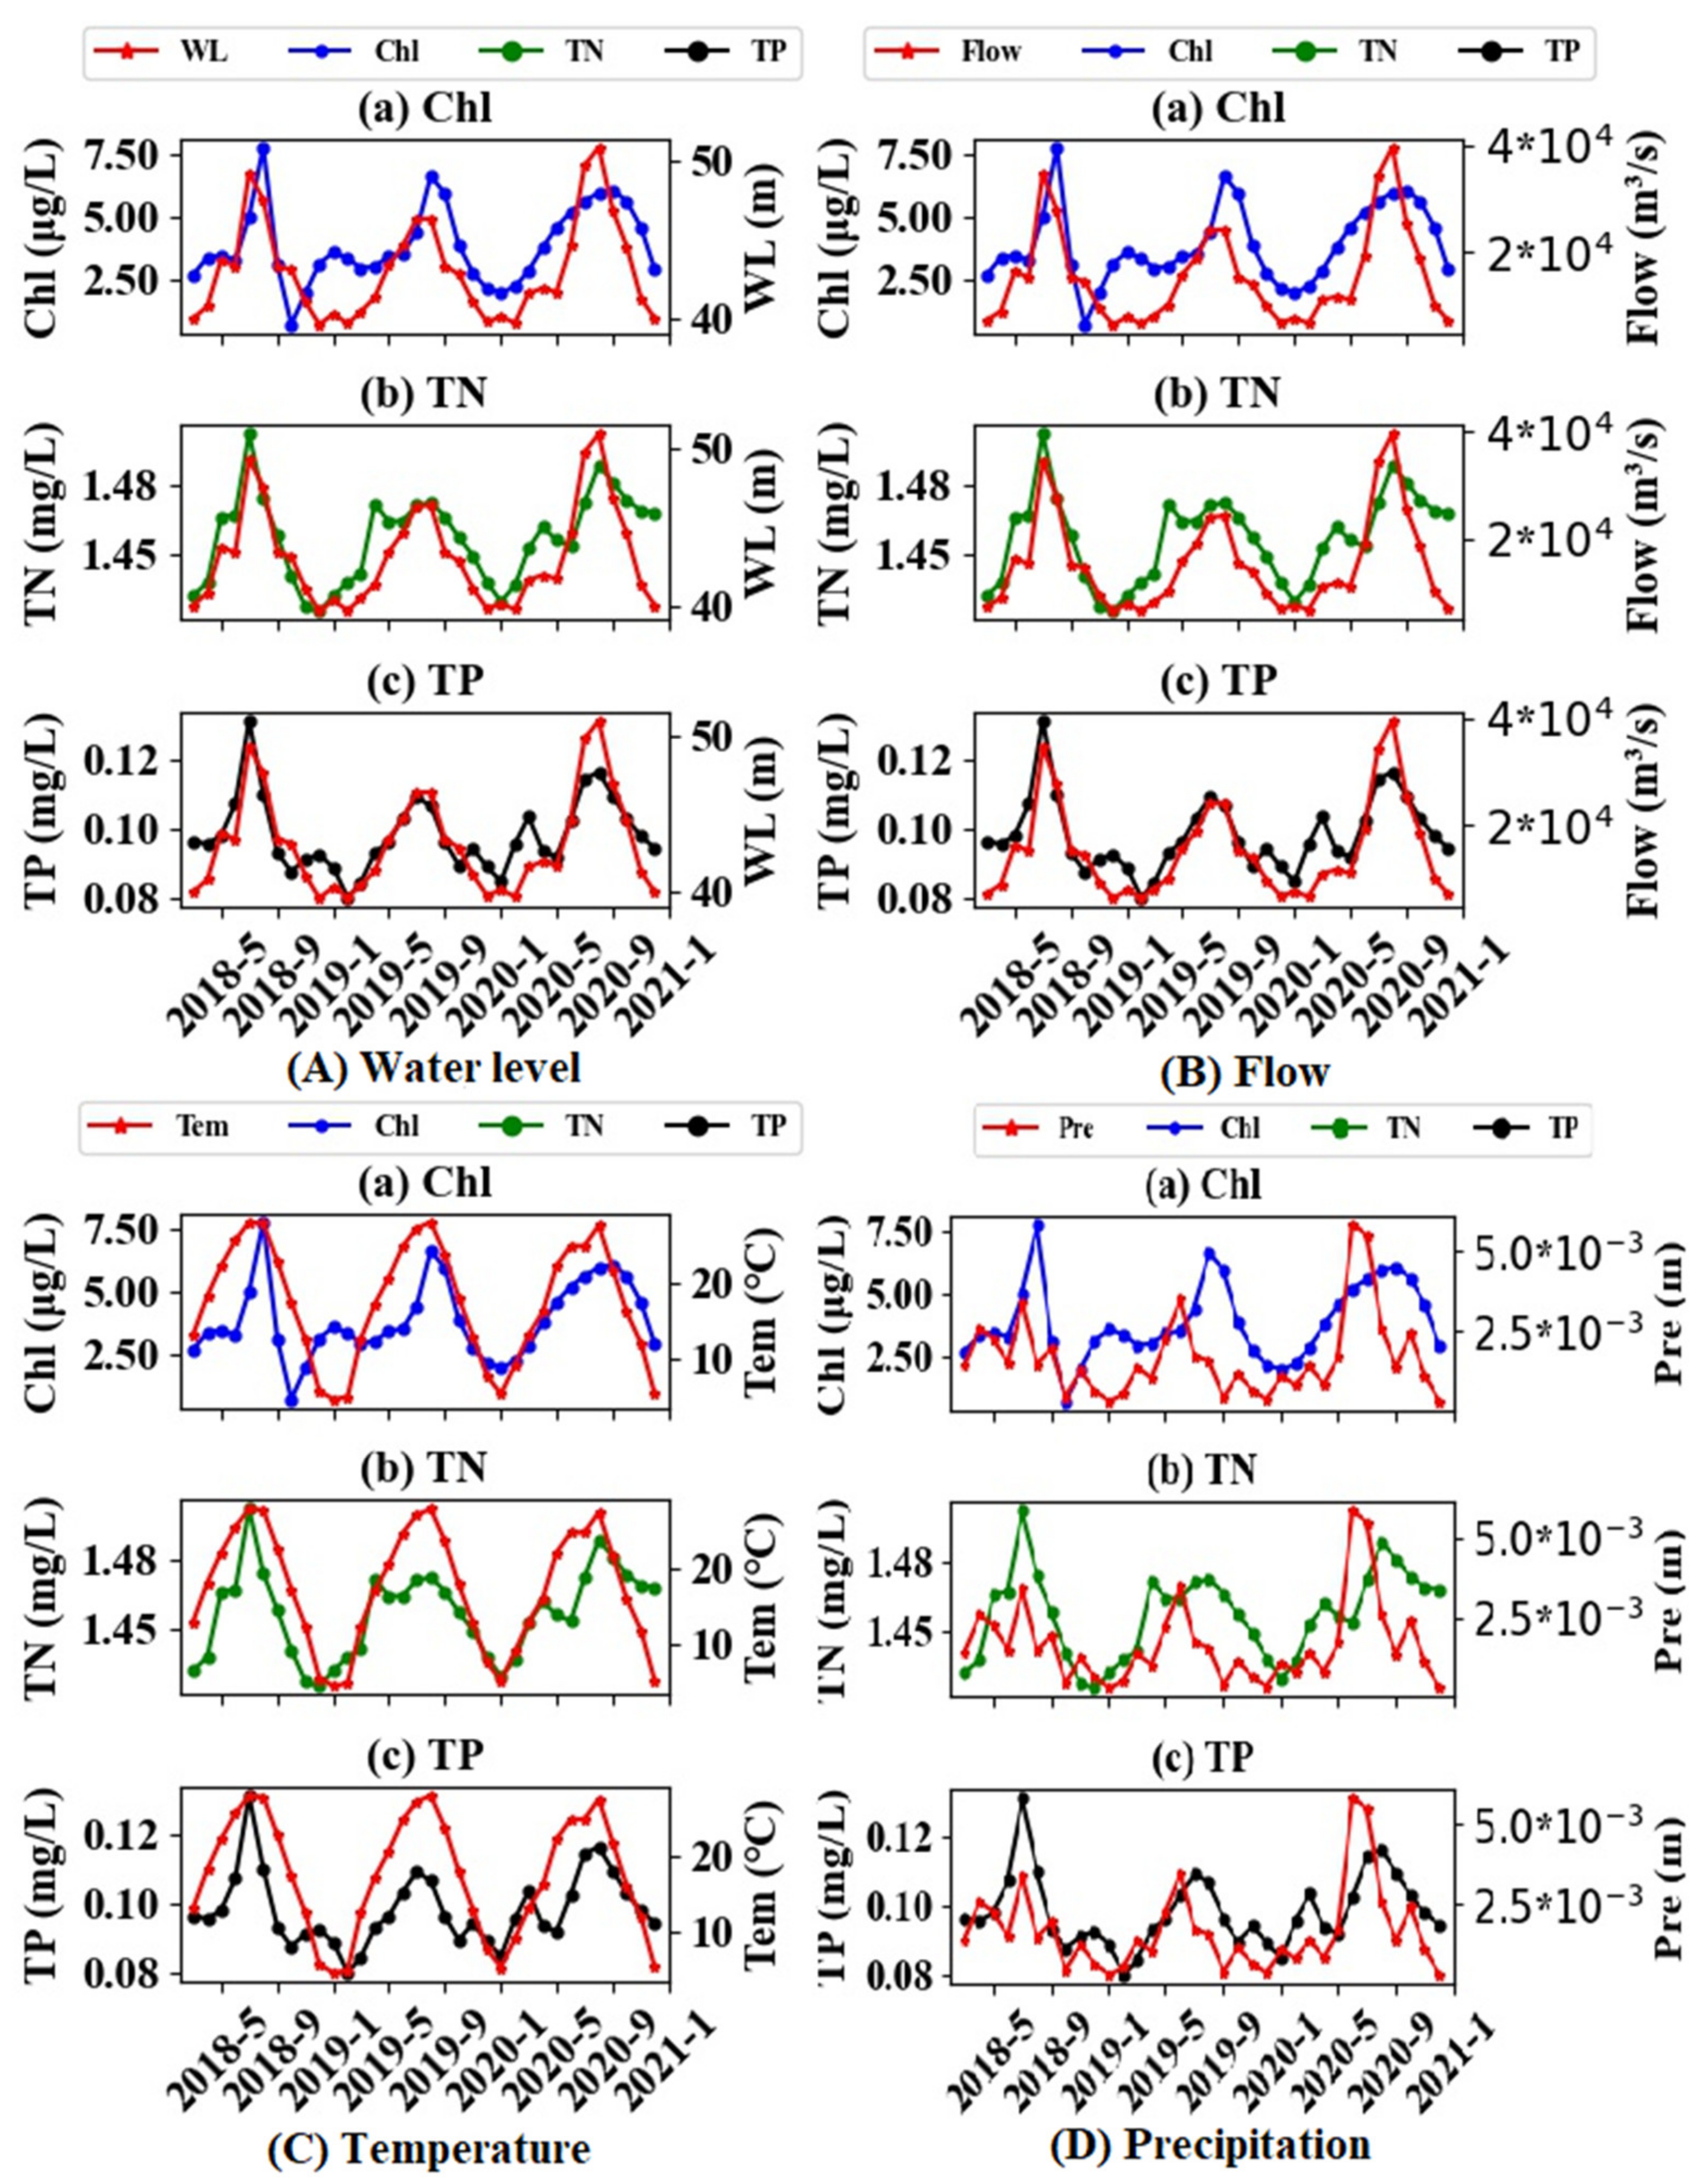
3.3.1. Hydrological and Meteorological Factors

The monthly variations of Chl-a, TN, and TP concentrations in Yichang with the water level, flow, temperature, and precipitation are shown in Figure 9. The Chl-a, TN and TP concentrations reach their maximum in July, and their minimum in January. Water level and flow have the strongest correlation with Chl-a, TN and TP concentration, followed by temperature and finally precipitation. The correlation coefficients between the two variables are shown in Table 3.

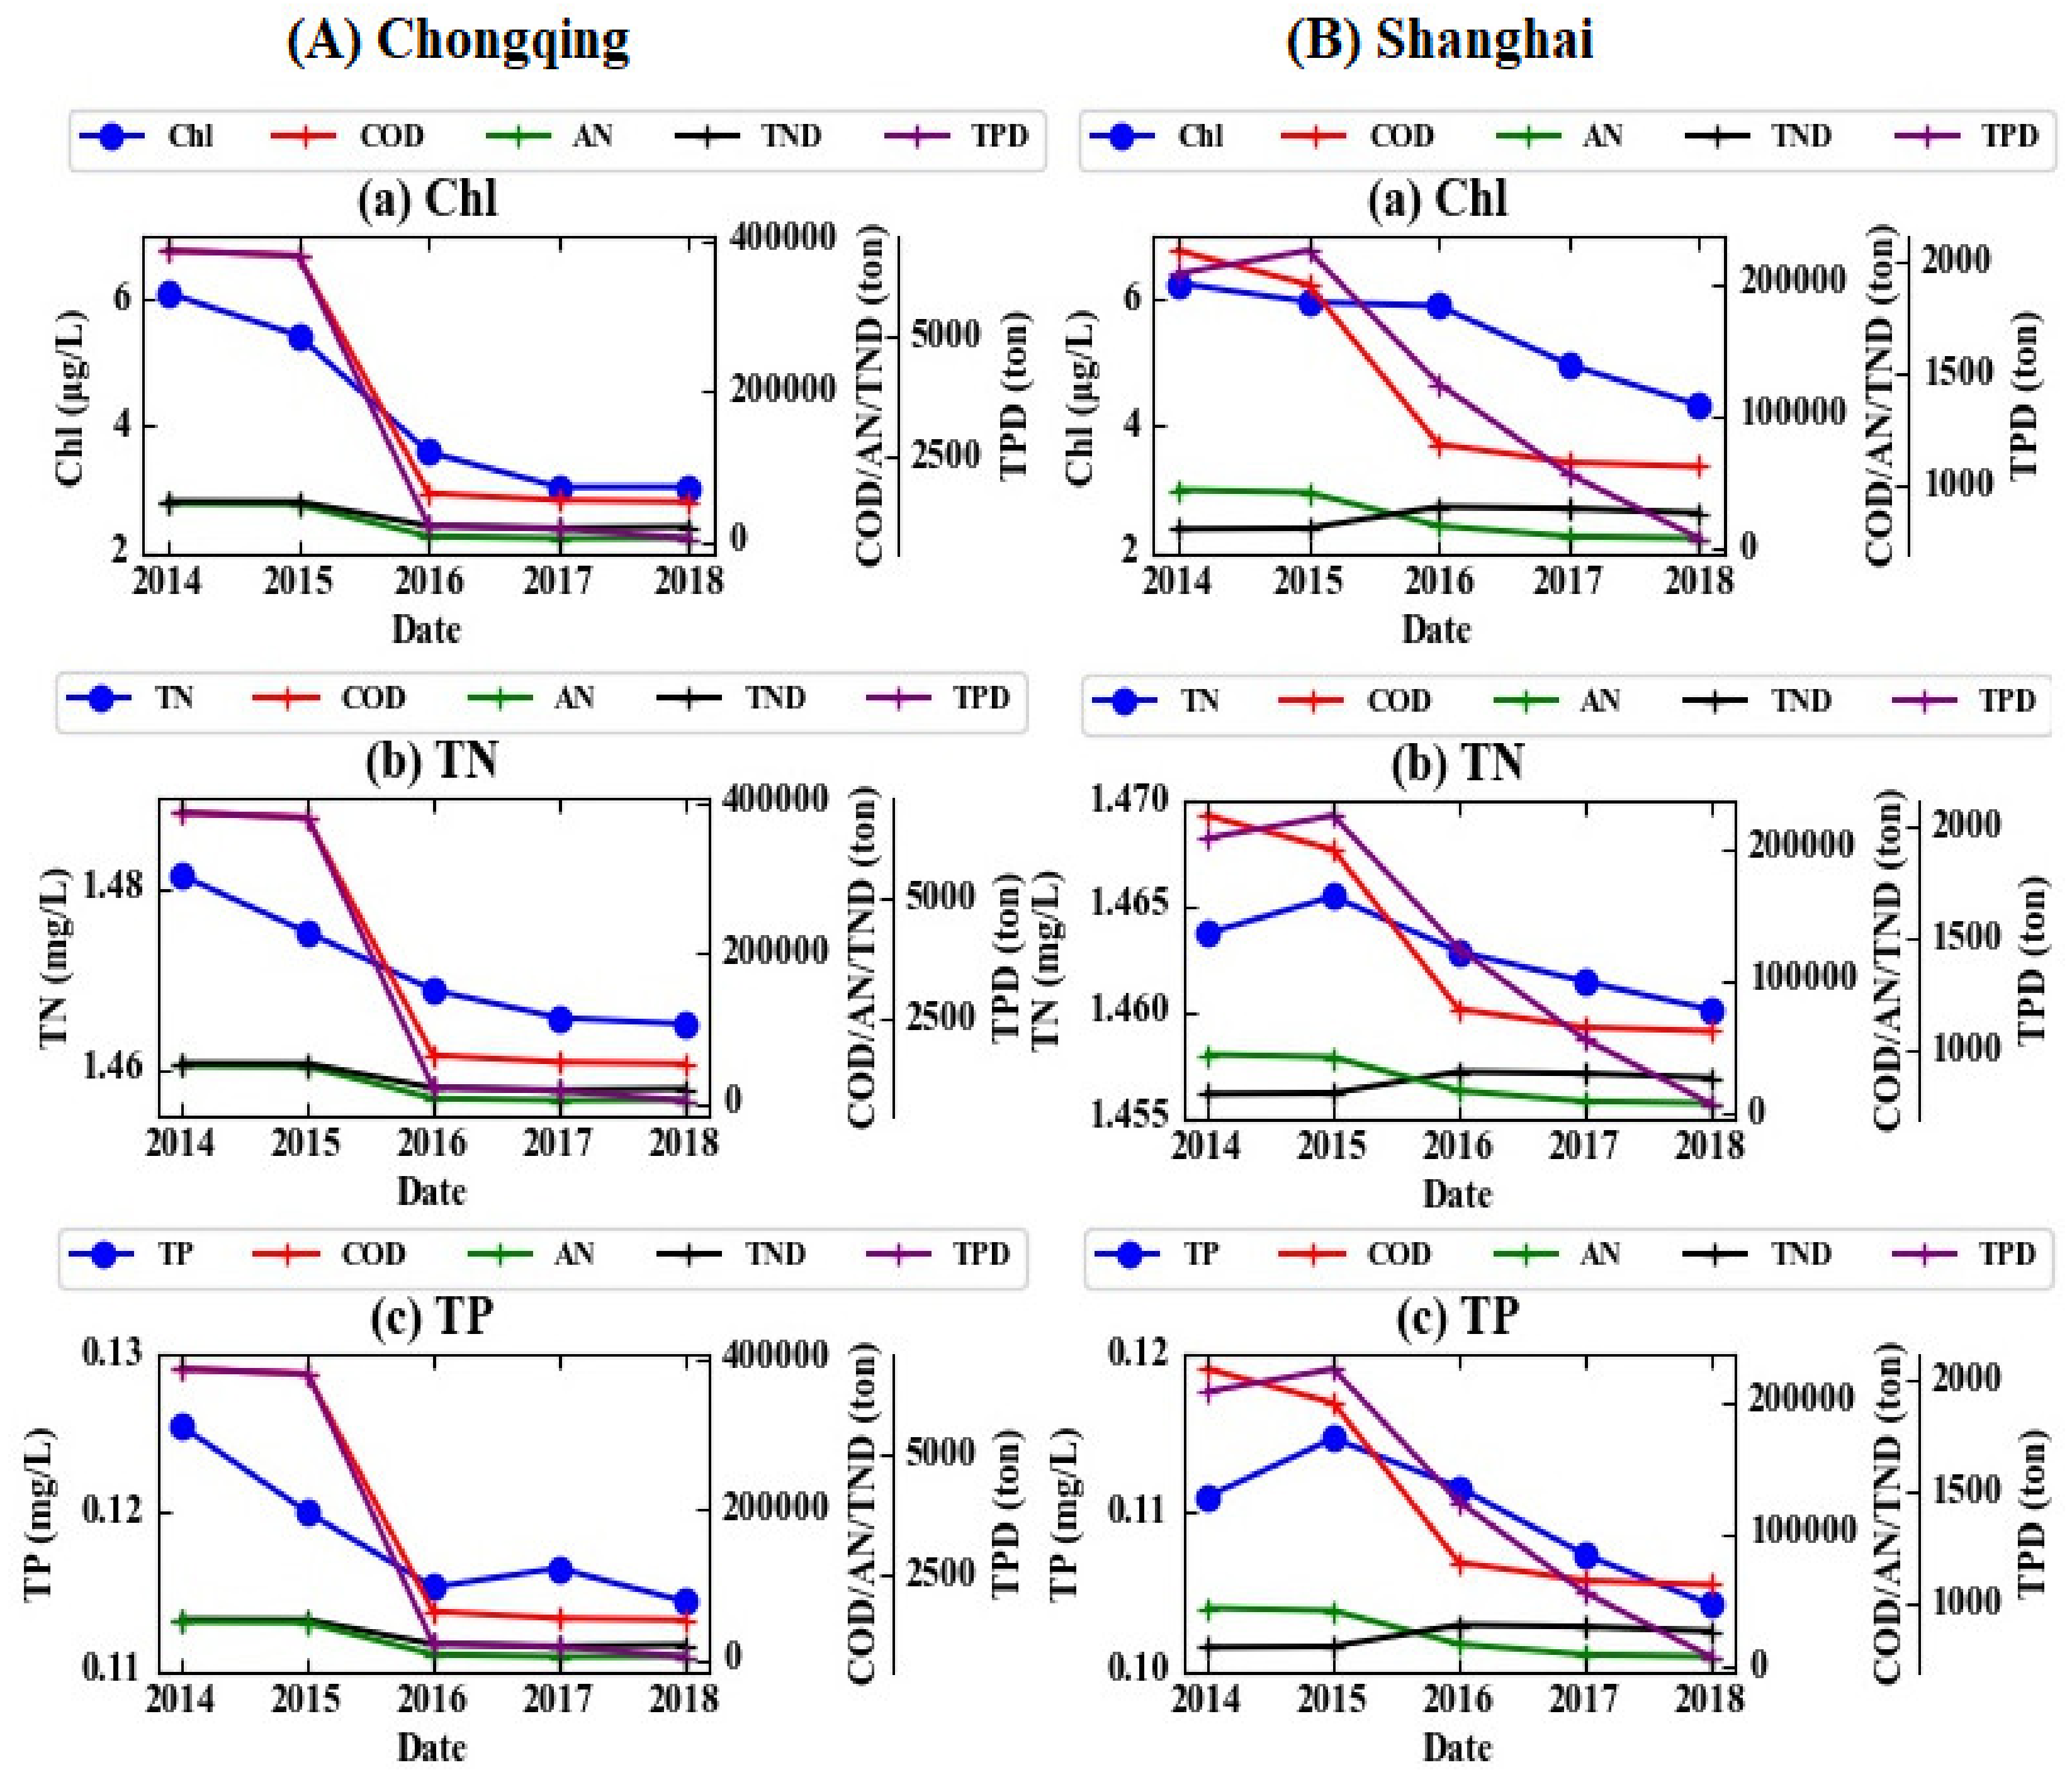
3.3.2. Human Factors

(A)
Land use
Land use along rivers has an impact on river water quality. Tong et al. [29] found that agricultural and impervious urban lands produced a much higher level of nitrogen and phosphorus than other land use. In this study, we have counted the riverbank land use with a buffer zone of 3 km in the Yichang section of the Yangtze River, and selected the river section where forests, impervious surfaces, and cropland account for the majority. The water quality of these three parts in the past 7 years is retrieved, combined with land use, and the result is shown in Figure 10. The result shows that Chl-a, TN, and TP concentrations are the highest along the banks where the main land use was cropland, followed by impervious surface, and finally forest.
(B)
Sewage Discharge
The wastewater discharged from cities contains different pollutants, mainly including chemical oxygen demand (COD), ammonia nitrogen, TN, TP, and other metal elements. This study counts the discharge of various wastewater pollutants in Chongqing and Shanghai from 2014 to 2018, and the concentrations of Chl-a, TN, and TP in Chongqing and Shanghai. The results are shown in Figure 11. In Chongqing, the overall variation trend of the four pollutants discharged from sewage from 2014 to 2018 was the same with a downward trend. The concentrations of Chl-a, TN, and TP were also consistent with their changing trends with a downward trend. In Shanghai, COD and ammonia nitrogen decreased year by year, while the discharge of TN and phosphorus first increased and then decreased. In addition, as shown in Figure 12, the proportion of nitrogen and phosphorus in the discharged wastewater was negatively correlated with the Chl-a concentration, and the negative correlation coefficient is −0.94.
(C)
Cargo handling capacity
Ship pollution has the characteristics of mobility, wide area, long lines, and dispersion. It is an important source of pollution to rivers, including oily sewage, domestic sewage, ship garbage, ship noise, and ship exhaust [30]. In order to explore the relationship between ship volume and water quality, this study counts the cargo throughput of Chongqing and Yichang Port from March 2018 to December 2020. As shown in Figure 13, cargo handling capacity was positively correlated with Chl-a, TN, and TP concentrations, and the Spearman correlation coefficients were 0.39, 0.49, and 0.22 in Yichang, respectively and 0.10, 0.49 and 0.22 in Chongqing, respectively.

4. Discussion

4.1. Water Quality Retrieval

Most studies used the visible and near-infrared bands of the solar spectrum (mostly from blue to near-infrared region) to retrieve water quality indicators [31,32]. Optically active substances such as Chl-a, total suspended solids (TSS), and turbidity can impact the optical properties of water and change the energy spectrum of solar radiation reflected by water [33]. Thus, they can be measured directly by remote sensing technology. Although the optical properties of the TN and TP are weak, they can also achieve a good correlation with the multispectral data. It was confirmed by our study and previous studies [34,35]. Palaciosd et al. thought that the sampling stations located in areas where these parameters were extremely high enough to color the water, or these water quality parameters were highly correlated with one or more of water quality parameters that could affect the spectral properties of water, such as Chl-a, TSS, turbidity, etc. [36]. Therefore, it is feasible to directly use spectral information to retrieve TN and TP in water, and multispectral image data has been widely used to monitor and map the TN and TP spatial and temporal patterns in different regions [7,37].
The goal of this study is to retrieve Chl-a, TN, and TP concentrations in the Yangtze River by satellite remote sensing images. We apply four characteristics based upon common standard characteristic ( F T 1 , F T 2 , F T 3 ), RGB to HSI transformation of the color space ( F T 4 , F T 5 , F T 6 ), Cartesian to the spherical transformation of the coordinate system ( F T 7 , F T 8 , F T 9 ), and directional cosines ( F T 10 , F T 11 , F T 12 ) for empirical retrieval of river constituents. Compared to the common standard characteristics, F T 11 has a significant improvement in Chl-a retrieval, and F T 2 still has the best performance in TN retrieval. Both F T 6 and F T 9 have greater improvements in TP retrieval. This proves that complex characteristics derived from spectral space may have a stronger correlation in water quality retrieval. The results reveal that empirical models have accurate retrieval results for Chl-a, TN, and TP concentrations, which demonstrates that the Landsat-8 has adequate potential to retrieve Chl-a, TN, and TP concentrations in the river at a big scale.

4.2. Factors Related to Water Quality

Previous studies have shown many factors that affect river water quality, including temperature, water level, flow, precipitation, pH, total dissolved solids, and so on [38,39]. Periodically hydrologic alterations strongly modify physicochemical properties and Chl-a and their interactions in water bodies [40]. In addition, human activities such as sewage discharge, coastal land use, shipping, and other factors also cannot be ignored [41,42,43]. This study investigates the influence of the above factors on water quality in the Yangtze River and provides essential information for effectively controlling water pollution and managing water resources.

4.2.1. Hydrological and Meteorological Factors

As for water level, the water level has a robust influence on water quality [44,45]. High water levels can reduce Chl-a concentration directly by a dilution effect [46]. In addition, the high water level will reduce the light intensity that the algae at the bottom of the river can receive and affect the vertical distribution of the algae in the water body [47]. The flow rate of the river also affects the growth of algae. Studies have shown that different algae have different ranges of optimal growth rates. After analyzing the result, it is speculated that at the Yichang section, when the flow rate increases, the Chl-a content increases, which means that the flow rate is in the range that can be suitable for algae growth.
The temperature has a regulating effect on the metabolic process of algae cells to varying degrees [48]. Furthermore, the temperature can affect the size of algae [49] and temperature also affect the distribution and quantity of algae in the water body. The stratification of water bodies will accelerate the growth of algae [50]. In Yichang, the optimal air temperature for algae reproduction should be about 20 °C. When the temperature rises, the life cycle of algae accelerates and multiplies in large numbers.
Precipitation is an important factor in river flow. In the months when the precipitation is greater, the river flow is also greater. Therefore, the influence of precipitation on total Chl-a, TN, and TP is similar to that of flow, and both have the regularity of seasonal variations. In addition, precipitation makes it easier to transfer pollutants to rivers, which directly increases the TN and TP concentrations in the river [51].

4.2.2. Human Factors

Human activities at all spatial scales affect both water quality and quantity [52]. Although some general correlations between land use and water quality can be observed, in general, the relationship is complex, with correlations in individual watersheds likely to be site or regionally specific [53]. When compared to the forest land, the impervious surfaces can pollute water quality, which is consistent with Yu’s conclusions [30,54]. In addition, the cropland can also increase the Chl-a, TN, and TP concentrations in the river, which may be that the farmland directly transports nitrogen and phosphorus elements into the river and causes the nourished water body.
The influence of wastewater discharge on water quality cannot be underestimated [55]. We have counted the COD, ammonia nitrogen, TN, and TP concentrations in wastewater discharge and found that the trend of the four pollutant emissions is positively correlated with the content of Chl-a, TN, and TP, while the ratio of TN to TP is negatively correlated with it, with a negative correlation coefficient of −0.94. This means that adjusting the ratio of TN to TP in urban wastewater discharge can help control the degree of eutrophication of water bodies.
The pollution of shipping to rivers mainly has the following aspects. First, exhaust gas from burning diesel [56,57]. According to data from the Ministry of Environmental Protection, 60% of inland river vessels are distributed in the middle and lower reaches of the Yangtze River Basin, and most of the vessels use marine fuel oil, which makes gas as an important source of pollution in cities along the river. Second, the domestic sewage dumped by ships [58]. There are about 200,000 ships operating on the Yangtze River year-round, producing 360 million tons of oily wastewater, domestic sewage, and 75,000 tons of domestic garbage each year, posing a serious threat to the water environment. Third, the heavy metal mud is stirred by the ship. Many reaches of the main and tributaries of the Yangtze River basin are polluted by heavy metals, including mercury, lead, and arsenic [59]. The pollution caused by the agitation of the ship’s propellers in the bottom mud with heavy metals will severely disrupt the water ecological balance.

4.3. Wider Implications

The theories and methods of this study are also useful in other rivers or lakes. Gao applied quantile regression analysis on 21-year (1998–2018) near-surface Chl-a data from satellite observations and investigated the long-term trend of Chl-a in the Pearl River Plume [13]. Duan et al. characterized the spatial-temporal distribution, long-term trend, and seasonal variations of water quality in the Yangtze River basin using statistical methods and time-series decomposition [41]. Minaudo et al. carried out the trend and seasonal analysis of Chl-a, nitrate, and phosphate in the eutrophic Loire River and found that the influence of phytoplankton on seasonal variations of nitrate was small [60]. Based on our analysis, the area of cropland and impervious surface along the Yangtze River were reduced, and the area of woods and grassland were increased. The ratio of TN to TP in urban wastewater discharge increased. In addition, the number of cargo ships on the river should be reasonably regulated, and the discharge of wastewater should be restricted.

5. Conclusions

This paper proposes empirical regression models to retrieve Chl-a, TN, and TP concentrations in the Yangtze River from Landsat-8 remote sensing imagery and in situ water samples. A total of 4 types of characteristics are used for constructing the empirical model, including common standard characteristics, characteristics based on color space transformation, characteristics based on coordinate system transformation, and characteristics based on directional cosines. The full search approach was used to select the best characteristics to construct the empirical regression model and obtain reliable retrieval results. The spatial-temporal distribution, long-term trend, and seasonal variability of water quality in the Yangtze River were obtained and analyzed. The upstream has the best water quality, followed by the midstream, and finally the downstream. The Chl-a, TN, and TP concentrations reach the highest in about July and the lowest in about January. Furthermore, the influence of natural and human factors on water quality is further analyzed. The hydrological and meteorological factors such as water level, flow, temperature, and precipitation are positively correlated with Chl-a, TN, and TP concentrations in the Yangtze River. In addition, the larger the impervious surface and cropland area are, the greater CHC is. The higher ratio of TP to TN is, the more serious the water pollution is. Future studies will be dedicated to exploring the coupling relationship between water quality, environmental factors, and human factors, as well as short-term predictions of water quality.

Author Contributions

Conceptualization, S.J., Y.H. and W.S.; methodology, Y.H. and W.S.; software, Y.H.; validation, S.J., Y.H. and W.S.; formal analysis, Y.H.; investigation, S.J. and Y.H.; data curation, Y.H. and W.S.; writing—original draft preparation, S.J. and Y.H.; writing—review and editing, S.J.; visualization, S.J.; supervision, S.J.; project administration, S.J.; funding acquisition, S.J. All authors have read and agreed to the published version of the manuscript.

Funding

This work was funded by the Strategic Priority Research Program Project of the Chinese Academy of Sciences (grant number XDA23040100).

Institutional Review Board Statement

Not applicable.

Informed Consent Statement

Not applicable.

Data Availability Statement

The data presented in this study are available from the corresponding website.

Acknowledgments

The authors would like to acknowledge the data provided by Copernicus, the European Centre for Medium-Range Weather Forecasts (ECMWF) and Changjiang Water Resources Commission of the Ministry of Water Resources.

Conflicts of Interest

The authors declare no conflict of interest.

References

  1. Mueller, B.; Berg, M.; Zhi, P.Y.; Xian, F.Z.; Ding, W.; Pfluger, A. How polluted is the Yangtze river? Water quality downstream from the Three Gorges Dam. Sci. Total Environ. 2005, 402, 232–247. [Google Scholar] [CrossRef] [PubMed]
  2. Chen, Z.; Xu, S.; Xu, Q.; Hu, X.; Yu, L.; Chen, Z.; Xu, S.; Xu, Q.; Hu, X.; Yu, X. Surface water pollution in the Yangtze River Delta: Patterns and countermeasures. Pedosphere 2002, 12, 111–120. [Google Scholar]
  3. Li, J.; Pei, Y.; Zhao, S.; Xiao, R.; Sang, X.; Zhang, C. A review of remote sensing for environmental monitoring in China. Remote Sens. 2020, 12, 1130. [Google Scholar] [CrossRef] [Green Version]
  4. Topp, S.N.; Pavelsky, T.M.; Jensen, D.; Simard, M.; Ross, M.R. Research trends in the use of remote sensing for inland water quality science: Moving towards multidisciplinary applications. Water 2020, 12, 169. [Google Scholar] [CrossRef] [Green Version]
  5. Gholizadeh, M.H.; Melesse, A.M.; Reddi, L. A Comprehensive Review on Water Quality Parameters Estimation Using Remote Sensing Techniques. Sensors 2016, 16, 1298. [Google Scholar] [CrossRef] [Green Version]
  6. Li, Y.; Zhang, Y.; Shi, K.; Zhu, G.; Zhou, Y.; Zhang, Y.; Guo, Y. Monitoring spatiotemporal variations in nutrients in a large drinking water reservoir and their relationships with hydrological and meteorological conditions based on Landsat 8 imagery. Sci. Total Environ. 2017, 599, 1705–1717. [Google Scholar] [CrossRef]
  7. Lim, J.; Choi, M. Assessment of water quality based on Landsat 8 operational land imager associated with human activities in Korea. Environ. Monit. Assess. 2015, 187, 384. [Google Scholar] [CrossRef] [PubMed]
  8. Nazeer, M.; Nichol, J.E. Improved water quality retrieval by identifying optically unique water classes. J. Hydrol. 2016, 541, 1119–1132. [Google Scholar] [CrossRef]
  9. Mohsen, A.; Elshemy, M.; Zeidan, B. Water quality monitoring of Lake Burullus (Egypt) using Landsat satellite imageries. Environ. Sci. Pollut. Res. 2020, 28, 15687–15700. [Google Scholar] [CrossRef]
  10. Le, C.; Hu, C.; Cannizzaro, J.; Duan, H. Long-term distribution patterns of remotely sensed water quality parameters in Chesapeake Bay. Estuar. Coast. Shelf Sci. 2013, 128, 93–103. [Google Scholar] [CrossRef]
  11. Kahru, M.; Kudela, R.M.; Manzano-Sarabia, M.; Mitchell, B.G. Trends in the surface chlorophyll of the California Current: Merging data from multiple ocean color satellites. Deep-sea research, Part II. Top. Stud. Oceanogr. 2012, 77, 89–98. [Google Scholar] [CrossRef]
  12. Moradi, M. Trend analysis and variations of sea surface temperature and chlorophyll-a in the Persian Gulf. Mar. Pollut. Bull. 2020, 156, 111267. [Google Scholar] [CrossRef] [PubMed]
  13. Gao, N.; Ma, Y.; Zhao, M.; Zhang, L.; He, Q. Quantile Analysis of Long-Term Trends of Near-Surface Chlorophyll-a in the Pearl River Plume. Water 2020, 12, 1662. [Google Scholar] [CrossRef]
  14. Huang, Z.; Liu, Y.; Zhao, W.; Zhao, L. Discussion on recent spatial-temporal distribution of water quality in Changjiang River source area. J. Yangtze River Sci. Res. Inst. 2016, 33, 46–50. [Google Scholar]
  15. Li, Z.; Ma, J.; Guo, J.; Paerl, H.W.; Brookes, J.D.; Xiao, Y.; Fang, F.; Ouyang, W.; Lunhui, L. Water quality trends in the Three Gorges Reservoir region before and after impoundment (1992–2016). Ecohydrol. Hydrobiol. 2019, 19, 317–327. [Google Scholar] [CrossRef]
  16. Peng, F.; He, L.; Yu, Y.; Wei, F. Studies on the total nitrogen, total phosphorus and chlorophyll a variations in the mainstream and main tributaries of the Yangtze River before and after the impoundment in the Three Gorges Project area. Sci. Sin. Technol. 2017, 47, 845–855. [Google Scholar]
  17. Niroumand-Jadidi, M.; Bovolo, F.; Bruzzone, L. Novel spectra-derived features for empirical retrieval of water quality parameters: Demonstrations for OLI, MSI, and OLCI Sensors. IEEE Trans. Geosci. Remote Sens. 2019, 57, 10285–10300. [Google Scholar] [CrossRef]
  18. Kim, S.I.; Kim, H.C.; Hyun, C.U. High Resolution Ocean Color Products Estimation in Fjord of Svalbard, Arctic Sea using Landsat-8 OLI. J. Aesthet. Art Crit. 2014, 30, 809–816. [Google Scholar]
  19. Chunfa, W.U.; Jiaping, W.U.; Jiaguo, Q.I.; Zhang, L.; Huang, H.; Lou, L.; Chen, Y. Empirical estimation of total phosphorus concentration in the mainstream of the Qiantang River in China using Landsat TM data. Int. J. Remote Sens. 2010, 31, 2309–2324. [Google Scholar]
  20. Vassiliki, M.; Dionissios, K.; George, P.; Elias, D. An Appraisal of the Potential of Landsat 8 in Estimating Chlorophyll-a, Ammonium Concentrations and Other Water Quality Indicators. Remote Sens. 2018, 10, 1018. [Google Scholar]
  21. Cheng, C.; Wei, Y.; Sun, X.; Zhou, Y. Estimation of Chlorophyll-a Concentration in Turbid Lake Using Spectral Smoothing and Derivative Analysis. Int. J. Environ. Res. Public Health 2013, 10, 2979–2994. [Google Scholar] [CrossRef] [PubMed] [Green Version]
  22. Xu, X.; Wei, L.; Ran, Q.; Qian, D.; Bing, Z. Multisource Remote Sensing Data Classification Based on Convolutional Neural Network. IEEE Trans. Geosci. Remote Sens. 2018, 56, 937–949. [Google Scholar] [CrossRef]
  23. Niroumand-Jadidi, M.; Vitti, A.; Lyzenga, D.R. Multiple Optimal Depth Predictors Analysis (MODPA) for river bathymetry: Findings from spectroradiometry, simulations, and satellite imagery. Remote Sens. Environ. 2018, 218, 132–147. [Google Scholar] [CrossRef]
  24. Bovolo, F. A Framework for Automatic and Unsupervised Detection of Multiple Changes in Multitemporal Images. IEEE Trans. Geosci. Remote Sens. 2012, 50, 2196–2212. [Google Scholar] [CrossRef]
  25. Nirala, M.; Venkatachalam, G. Hyperspherical direction cosine transformation of remotely sensed data for separation of topographic expression of land use classification. Int. J. Remote Sens. 2000, 21, 2203–2211. [Google Scholar] [CrossRef]
  26. Carvalho Júnior, O.A.; Guimarães, R.F.; Gillespie, A.R.; Silva, N.C.; Gomes, R.A. A new approach to change vector analysis using distance and similarity measures. Remote Sens. 2011, 3, 2473–2493. [Google Scholar] [CrossRef] [Green Version]
  27. Nezlin, N.P.; Polikarpov, I.G.; Al-Yamani, F.Y.; Rao, D.S.; Ignatov, A.M. Satellite monitoring of climatic factors regulating phytoplankton variability in the Arabian (Persian) Gulf. J. Mar. Syst. 2010, 82, 47–60. [Google Scholar] [CrossRef]
  28. Jin, S.; Luo, O.F. Variability and Climatology of PWV from Global 13-Year GPS Observations. IEEE Trans. Geosci. Remote Sens. 2009, 47, 1918–1924. [Google Scholar]
  29. Tong, S.T.; Chen, W. Modeling the relationship between land use and surface water quality. J. Environ. Manag. 2002, 66, 377–393. [Google Scholar] [CrossRef] [PubMed]
  30. Biao, W. Shipping pollution in three gorges and research on comprehensive pollution disposal countermeasure. Resour. Enuironment Yangtza Basin 2000, 9, 488–490. [Google Scholar]
  31. El-Din, M.S.; Gaber, A.; Koch, M.; Ahmed, R.S.; Bahgat, I. Remote Sensing Application for Water Quality Assessment in Lake Timsah, Suez Canal, Egypt. J. Remote Sens. Technol. 2013, 1, 61–74. [Google Scholar] [CrossRef]
  32. Gitelson, A.A.; Dall’Olmo, G.; Moses, W.; Rundquist, D.C.; Barrow, T.; Fisher, T.R.; Gurlin, D.; Holz, J. A simple semi-analytical model for remote estimation of chlorophyll-a in turbid waters: Validation. Remote Sens. Environ. 2008, 112, 3582–3593. [Google Scholar] [CrossRef]
  33. Ritchie, J.C.; Zimba, P.V.; Everitt, J.H. Remote Sensing Techniques to Assess Water Quality. Photogramm. Eng. Remote Sens. 2003, 69, 695–704. [Google Scholar] [CrossRef] [Green Version]
  34. El Saadi, A.M.; Yousry, M.M.; Jahin, H.S. Statistical estimation of Rosetta branch water quality using multi-spectral data. Water Sci. 2014, 28, 18–30. [Google Scholar] [CrossRef] [Green Version]
  35. Theologou, I.; Patelaki, M.; Karantzalos, K. Can single empirical algorithms accurately predict inland shallow water quality status from high resolution, multi-sensor, multi-temporal satellite data? Int. Arch. Photogramm. Remote Sens. Spat. Inf. Sci. 2015, 40, 1511. [Google Scholar] [CrossRef] [Green Version]
  36. Fernndez, A.; Moreira, J.M.; Snchez, E.; Ojeda, J. Evaluation of different methodological aproaches for monitoring water quality parameters in the coastal waters of Andalusia (Spain). EARSeL Adv. Remote Sens. 1995, 4, 67–75. [Google Scholar]
  37. Lu, S.; Deng, R.; Liang, Y.; Xiong, L.; Ai, X.; Qin, Y. Remote Sensing Retrieval of Total Phosphorus in the Pearl River Channels Based on the GF-1 Remote Sensing Data. Remote Sens. 2020, 12, 1420. [Google Scholar] [CrossRef]
  38. Das, J.; Acharya, B.C. Hydrology and Assessment of Lotic Water Quality in Cuttack City, India. Water Air Soil Pollut. 2003, 150, 163–175. [Google Scholar] [CrossRef]
  39. Gasim, M.B.; Toriman, M.E.; Rahim, S.A.; Islam, M.S.; Hafizan, J. Hydrology and Water Quality and Land-use Assessment of Tasik Chini’s Feeder Rivers, Pahang Malaysia. Geografia 2006, 3, 1–16. [Google Scholar]
  40. Li, T.; Zhang, Y.; He, B.; Yang, B.; Huang, Q. Periodically hydrologic alterations decouple the relationships between physicochemical variables and chlorophyll- a in a dam-induced urban lake. J. Environ. Sci. 2020, 99, 187–195. [Google Scholar] [CrossRef] [PubMed]
  41. Duan, W.; He, B.; Chen, Y.; Shan, Z.; Yang, G. Identification of long-term trends and seasonality in high-frequency water quality data from the Yangtze River basin, China. PLoS ONE 2018, 13, e0188889. [Google Scholar] [CrossRef] [PubMed]
  42. Tasdighi, A.; Arabi, M.; Osmond, D.L. The Relationship between Land Use and Vulnerability to Nitrogen and Phosphorus Pollution in an Urban Watershed. J. Environ. Qual. 2017, 46, 1137. [Google Scholar] [CrossRef] [PubMed]
  43. Turner, D.R.; Hassellöv, I.; Ytreberg, E.; Rutgersson, A. Shipping and the environment: Smokestack emissions, scrubbers and unregulated oceanic consequences. Elem. Sci. Anth. 2017, 5, 45. [Google Scholar] [CrossRef] [Green Version]
  44. Wang, F.; Wang, X.; Zhao, Y.; Yang, Z. Long-term changes of water level associated with chlorophyll a concentration in Lake Baiyangdian, North China. Procedia Environ. Sci. 2012, 13, 1227–1237. [Google Scholar] [CrossRef] [Green Version]
  45. Cruz-Ramírez, A.; Salcedo, M.; Sánchez, A.; Macías, E.B.; Palacios, J.M. Relationship among physicochemical conditions, chlorophyll-a concentration, and water level in a tropical river–floodplain system. Int. J. Environ. Sci. Technol. 2019, 16, 3869–3876. [Google Scholar] [CrossRef]
  46. Fuentes, E.V.; Petrucio, M.M. Water level decrease and increased water stability promotes phytoplankton growth in a mesotrophic subtropical lake. Mar. Freshw. Res. 2015, 66, 711–718. [Google Scholar] [CrossRef]
  47. Hamilton, D.P.; O’Brien, K.R.; Burford, M.A.; Brookes, J.D.; McBride, C.G. Vertical distributions of chlorophyll in deep, warm monomictic lakes. Aquat. Sci. 2010, 72, 295–307. [Google Scholar] [CrossRef] [Green Version]
  48. Tilman, D. Resource competition between plankton algae: An experimental and theoretical approach. Ecology 1977, 58, 338–348. [Google Scholar] [CrossRef]
  49. Semina, H. The size of phytoplankton cells in the Pacific Ocean. Int. Rev. Gesamten Hydrobiol. Hydrogr. 1972, 57, 177–205. [Google Scholar] [CrossRef]
  50. Fu, L.; Zhang, L.; Yu, J.; Zhou, C.; Haffner, D. Water stratification and its relevance to growth of algal community at backwater area in Three Gorges Reservoir. Chin. J. Environ. Eng. 2015, 9, 2265–2271. [Google Scholar]
  51. Xu, G.; Li, P.; Lu, K.; Tantai, Z.; Zhang, J.; Ren, Z.; Wang, X.; Yu, K.; Shi, P.; Cheng, Y. Seasonal changes in water quality and its main influencing factors in the Dan River basin. Catena 2019, 173, 131–140. [Google Scholar] [CrossRef]
  52. Peters, N.E.; Meybeck, M. Water quality degradation effects on freshwater availability: Impacts of human activities. Water Int. 2000, 25, 185–193. [Google Scholar] [CrossRef]
  53. Baker, A. Land use and water quality. Hydrol. Process. 2003, 17, 2499–2501. [Google Scholar] [CrossRef]
  54. Yu, D.; Shi, P.; Liu, Y.; Xun, B. Detecting land use-water quality relationships from the viewpoint of ecological restoration in an urban area. Ecol. Eng. 2013, 53, 205–216. [Google Scholar] [CrossRef]
  55. Parnell, P.E. The effects of sewage discharge on water quality and phytoplankton of Hawai’ian coastal waters. Mar. Environ. Res. 2003, 55, 293–311. [Google Scholar] [CrossRef]
  56. Weng, J.; Shi, K.; Gan, X.; Li, G.; Huang, Z. Ship emission estimation with high spatial-temporal resolution in the Yangtze River estuary using AIS data. J. Clean. Prod. 2020, 248, 119297. [Google Scholar] [CrossRef]
  57. Zhao, J.; Zhang, Y.; Patton, A.P.; Ma, W.; Kan, H.; Wu, L.; Fung, F.; Wang, S.; Ding, D.; Walker, K.J.E.P. Projection of ship emissions and their impact on air quality in 2030 in Yangtze River delta, China. Environ. Pollut. 2020, 263, 114643. [Google Scholar] [CrossRef]
  58. Fan, Q.; Zhang, Y.; Ma, W.; Ma, H.; Feng, J.; Yu, Q.; Yang, X.; Ng, S.K.; Fu, Q.; Chen, L. Spatial and Seasonal Dynamics of Ship Emissions over the Yangtze River Delta and East China Sea and Their Potential Environmental Influence. Environ. Sci. Technol. 2016, 50, 1322–1329. [Google Scholar] [CrossRef]
  59. Ali, M.M.; Murphy, K.J.; Langendorff, J. Interrelations of river ship traffic with aquatic plants in the River Nile, Upper Egypt. Hydrobiologia 1999, 415, 93–100. [Google Scholar] [CrossRef]
  60. Minaudo, C.; Meybeck, M.; Moatar, F.; Gassama, N.; Curie, F.J.B. Eutrophication mitigation in rivers: 30 years of trends in spatial and seasonal patterns of biogeochemistry of the Loire River (1980–2012). Biogeosciences 2015, 12, 2549–2563. [Google Scholar] [CrossRef] [Green Version]
Figure 1. The study area of the Yangtze River Basin.
Remotesensing 13 02241 g001
Figure 2. Location of the in-situ measurement sampling points.
Remotesensing 13 02241 g002
Figure 3. Validation statistics (RMSE, MAPE, and R square) of different spectral characteristics with optimal band combinations in (a) Chl-a, (b) TN, and (c) TP concentrations.
Remotesensing 13 02241 g003
Figure 4. Comparison of retrieved concentrations and the measured concentrations of (a) Chl-a, (b) TN, and (c) TP, respectively.
Remotesensing 13 02241 g004
Figure 5. Water quality parameters variations of the Yangtze River from January 2014 to December 2020. (ac) are the monthly variations of Chl-a, TN, and TP concentration, respectively, and (d) is the annual trend.
Remotesensing 13 02241 g005
Figure 6. Fitting results of the monthly variations trend of the water quality parameters from 2014 to 2020. (ac) are the monthly variations of Chl-a, TN, and TP concentration, respectively.
Remotesensing 13 02241 g006
Figure 7. Comparison of (a) Chl-a, (b) TN, and (c) TP concentrations in upstream, midstream, and downstream of the Yangtze River.
Remotesensing 13 02241 g007
Figure 8. Fitting results of the monthly variations trend of the water quality parameters of the sections in the Yangtze River from 2014 to 2020. (AD) are the sections of Yichang, Hubei, Chenglingji, Hunan, Chizhou, Anhui, and Wuhan, Hubei, respectively.
Remotesensing 13 02241 g008
Figure 9. Comparison of Chl-a, TN, and TP concentrations and the variations of different factors. (A) is water level, (B) is flow, (C) is temperature, and (D) is precipitation.
Remotesensing 13 02241 g009
Figure 10. Comparison of (a) Chl-a, (b) TN, and (c) TP concentration under different land use along the coast.
Remotesensing 13 02241 g010
Figure 11. Variations in emissions of four pollutants and variations in (a) Chl-a, (b) TN, and (c) TP concentrations in Chongqing and Shanghai from 2014 to 2018.
Remotesensing 13 02241 g011
Figure 12. Variations in the ratio of TN and TP in discharged sewage and the Chl-a concentrations in Chongqing and Shanghai from 2014 to 2018.
Remotesensing 13 02241 g012
Figure 13. Variations in the Cargo handling capacity and the Chl-a concentrations of rivers from 2018 to 2020 in (A) Chongqing and (B) Yichang.
Remotesensing 13 02241 g013
Table 1. Regression analysis of Chl-a, TN, and TP.
Water Quality ParametersCharacteristicRegression EquationsMAPERMSE R 2
Chl-a F T 11 = b 2 b 1 2 + b 2 2 + b 4 2   y = 2.17 X 2 23.28 X + 18.51 26.89%0.529 μ g / L 0.95
TN F T 2 = b 5 b 7 λ 5 λ 7 y = 0.1 X 2 0.66 X + 1.45 4.52%0.092 mg/L0.80
TP F T 6 = b 4 + b 6 + b 7 3   y = 0.0577 X 2 + 0.707 X + 0.0735 6.13%0.008 mg/L0.87
Table 2. Variation amplitudes and phases of Chl, TN and TP in Yichang, Chenglingji, Chizhou, and Hankou section.
SectionWater Quality Parameters Annual Variation Amplitude ( m g / L ) and Phase Half-Year Variation Amplitude ( m g / L ) and Phase Constant Term Maximum/Minimum Month in a Year
YichangChl−7.5 × 10 4 , 1.471.7 × 10 4 , 1.493.61July, January
TN 1.1 × 10 2 ,   1.46 1.1 × 10 4 ,   1.0 1.46 July, January
TP 8.6 × 10 3 ,   1.29 3.0 × 10 3 , 1.0 0.10 July, January
ChenglingjiChl −1.01 × 10 3 , 1.96.7 × 10 4 , 1.93.71August, February
TN 1.9 × 10 3 , 1.5 2.3 × 10 3 ,   1.4 1.47 August, February
TP 1.2 × 10 3 , 1.38 5.1 × 10 3 ,   1.1 0.11 July, January
ChizhouChl−7.3 × 10 4 , 1.93.7 × 10 4 , 2.24.5August, February
TN 4.1 × 10 3 , −0.19 2.7 × 10 3 ,   0.11 1.47 June, December
TP 5.6 × 10 3 , −0.18 5.9 × 10 3 ,   0.47 0.11 June, December
HankouChl −1.6 × 10 3 , 1.224.1 × 10 4 , 1.84.9August, February
TN 4.2 × 10 3 , 0.8 1.7 × 10 3 ,   0.86 1.47 May, November
TP 6.3 × 10 3 , −0.67 1.8 × 10 3 ,   0.39 0.11 May, November
Table 3. Correlation analysis Chl-a, TN, TP, water level, flow, temperature, and precipitation.
ChlTPTNWater LevelFlowTemperaturePrecipitation
Chl1.000.670.670.680.680.550.43
TP0.671.000.790.840.840.720.66
TN0.670.791.000.770.750.710.47
Water level0.680.840.771.000.950.790.67
Flow0.680.840.750.951.000.790.65
Temperature0.550.720.710.830.791.000.64
Precipitation0.430.660.470.670.650.641.00
Publisher’s Note: MDPI stays neutral with regard to jurisdictional claims in published maps and institutional affiliations.

