1. Introduction
Today, global navigation satellite systems (GNSSs) are widely used for their capabilities within positioning, navigation, and timing (PNT) for civilian and commercial as well as military purposes. This includes many critical purposes such as search and rescue (SAR), aviation, and autonomous vehicles. Especially with more and more autonomous systems relying on GNSS-based PNT, the consequences of an outage or denial of GNSS data will also become more severe.
Furthermore, it was estimated by London Economics (in 2017 and 2019, respectively) that a five-day outage in GNSS would amount to losses of £5.2 bn (~
$7.2 bn) in the United Kingdom [
1] and 4.9 bn DKR (~
$0.8 bn) in Denmark [
2].
Therefore, GNSS availability should in general be a major concern, especially because GNSS signals arriving at the surface of the earth are weak, and thus easily susceptible to interference and jamming. During the last decade, small jammers, often referred to as personal privacy devices (PPDs), have received increased focus. They appear to be widely used [
3], and while meant to only block reception of the users’ own personal GNSS equipment, their range is often far longer than the users realize. PPDs of various kinds have been extensively analyzed in both [
4,
5]. These extensive surveys have looked at signal characteristics in both the time and frequency domain, as well as transmit power and an estimation of the range of denial of GNSS service.
Several incidents have already shown how vulnerable GNSSs may be in the presence of such PPDs. Incidents at Newark airport following the implementation of a local area augmentation system (LAAS) in 2009 are well described in [
6], but similar incidents are also seen elsewhere, for instance, in Norway, where the ambulance helicopter, “luftambulansen”, has seen several GNSS outages due to PPDs [
7].
Many other studies [
8,
9,
10,
11] suggest that these incidents are not unique or coincidental. All of these studies confirm that, in areas with human activity and especially near major roads, a lot of interference may be detected.
Similar events have also been seen in harbors. An international measurement campaign studied radio frequency interference (RFI) in both the L1/E1 and the L5/E5a bands from aboard a container ship travelling between Europe and Asia [
12,
13]. They recorded several incidents of jamming and interference in both ports and heavily trafficked sea routes all around the world.
The impact of jamming on GNSS receivers has previously been investigated by several authors. Most use actual PPD jammers or a similar synthesized signal. In [
14], a lab setup was used in order to investigate the impact of both single- and dual-frequency PPDs on the code-based positioning accuracy of a consumer-grade GNSS receiver. In [
15], a similar setup was used in order to evaluate the performance of a multi-constellation, multi-frequency receiver in the presence of a GPS L1 jammer. Both papers reported large positioning errors during heavy jamming and a decreased position availability.
Lab tests were also done by [
16], where real-world jamming data registered on monitoring stations as part of the STRIKE3 project (
www.gnss-strike3.eu) were used in evaluating code-based receiver performance in a standardized test. This showed some difference between mass-market and professional grade receivers, especially in the prioritization of accuracy versus availability.
Several real-world tests have also been conducted to demonstrate the possible impact of GNSS jamming. Investigations into the marine environment have been conducted by [
17], in which a setup with a GPS jammer at a lighthouse made passing vessels report their position as much as 22 km off the true position. The authors of [
18] further examined marine navigation. An L1/E1 PPD was used in a test setup off the north coast of Germany, and it was found that a tightly coupled GNSS/INS system could be used to mitigate the impact of jamming—mainly when jamming resulted in the receiver tracking too few satellites (<4) to determine a position.
Further real-world tests have been conducted by [
19,
20,
21,
22], but mostly with a focus on detection or localization of RFI, rather than the actual impact of jamming.
A common theme for these investigations of jamming is the focus on code-based GNSS positioning. Carrier phase-based positioning has been investigated by [
23] in a real-world experiment where several geodetic receivers were subjected to both static and kinematic L1/E1 band jamming. Positioning accuracy of the receivers in a real-time kinematic (RTK) positioning scenario was examined, and it was shown that, with sufficient jamming power, all receivers would eventually lose the ability to determine a position.
In this paper, jamming incidents registered in the reference stations of the Danish TAPAS real-time kinematic (RTK) network are investigated. The purpose is to characterize the impact on current RTK/GNSS infrastructure, and thus carrier phase-based positioning accuracy of post-processed kinematic (PPK) solutions are examined. As in [
8], this setup will use the jammed reference station as the base.
In [
8], a single GPS L1 jamming incident was evaluated on a short baseline. Now, this paper will further explore how jamming affects positioning based on carrier phase observations, and look into both single-baseline and network RTK positioning. PPK solutions will be evaluated for different baselines, using different constellations and frequencies to determine how positioning is affected in the various scenarios during jamming.
Finally, code-based positioning will be compared to carrier phase-based positioning to evaluate which type of approach is most robust to jamming.
The paper is structured in the following way.
In
Section 2, the background for the analyses is presented. The TAPAS network is introduced, and it is explained how data from the network may be used in order to assess carrier phase-based positioning during real world jamming events.
In
Section 3, the sum-of-squares (SoS) detector is briefly described. This algorithm is used to detect jamming incidents in archived RINEX observation files. Three selected jamming incidents found in the archived data are presented.
Section 4 introduces six analyses performed for this paper. These analyses are based on PPK solutions made from data collected during the three previously introduced jamming incidents. The six following subsections contain comprehensive results and summaries for each of the analyses.
In
Section 5, the results of the analyses are discussed, and future work within this field is proposed.
Finally, conclusions are presented in
Section 6.
2. Background
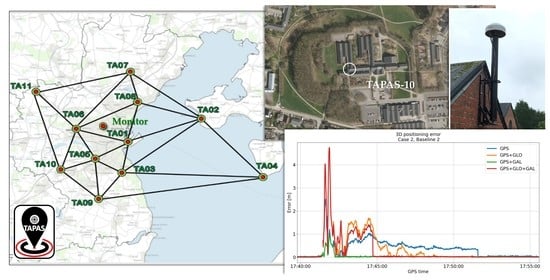
The Testbed in Aarhus for Precision Positioning and Autonomous Systems (TAPAS), is a dense network of GNSS reference stations (see
Figure 1) that allows for precise network RTK (NRTK) positioning in the city of Aarhus in Denmark [
24] (The TAPAS RTK service is freely available through the Danish Agency for Data Supply and Efficiency, SDFE. For more information, visit
www.tapasweb.dk). Distances between stations are as low as 4.1 km (TA03-TA05) and up to just 22.3 km across the bay of Aarhus (TA04-TA09).
The TAPAS stations all have a similar setup and use Septentrio PolaRx5S reference station receivers with Leica AR20 antennas. The stations deliver continuous GNSS observation data from the four major constellations (GPS, GLONASS, Galileo, and BeiDou) using the signals shown in
Table 1. The GNSMART software from Geo++ is used to generate a virtual reference station (VRS) solution [
25].
Besides the reference stations, the network also includes a monitoring station. This station is a permanent static rover connected to the VRS solution from the network, and it has been established in order to assess the performance at all hours of the day. It uses a consumer-grade multi frequency, quad constellation receiver, and antenna.
Owing to the density of the network, archived GNSS data can be used for processing several different PPK solutions between any of the stations within the network.
Investigations into jamming on the TAPAS network have previously been reported [
8], and these showed a total of 1934 jamming incidents on the 11 TAPAS stations during 2019. As with the STRIKE3 report [
10], this study suggests that stations placed in areas with human activity (major roads, harbor, and so on) see the majority of the jamming, and that the incidents in general are of short duration and low power. Although we have no further knowledge on the actual interference sources, the low power and short duration could be due to interferers being small personal privacy devices (PPDs) found in vehicles passing nearby the stations.
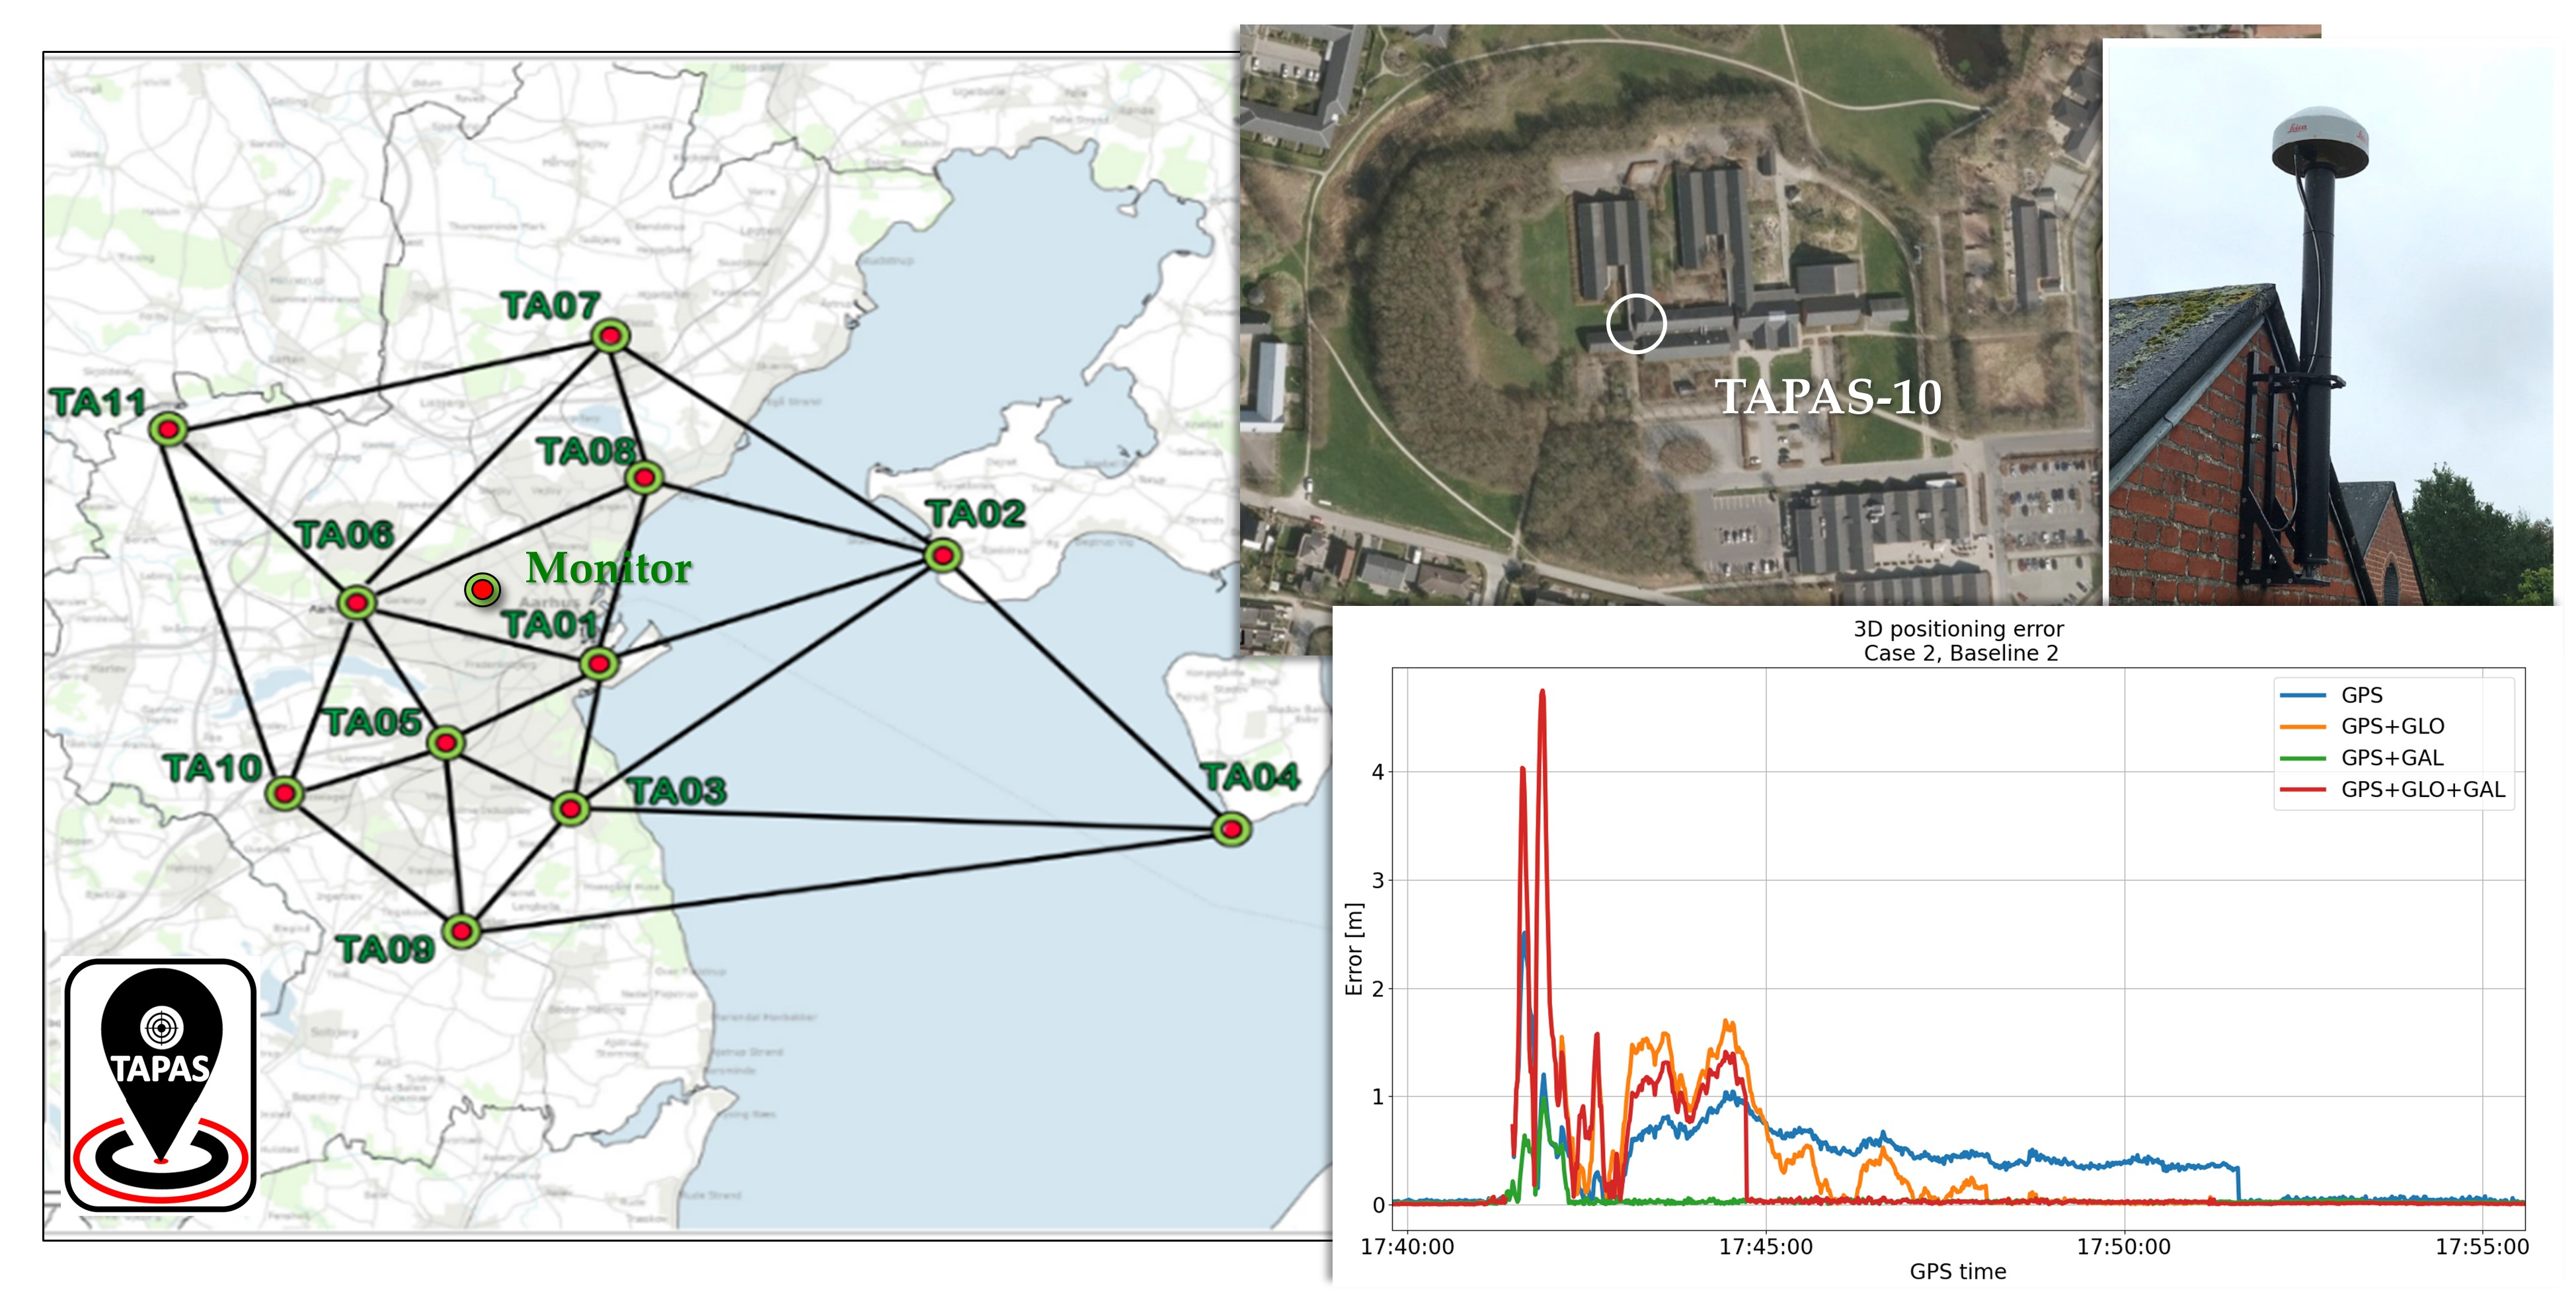
This investigation will focus on jamming incidents detected at stations TA03 and TA10. Information about the placement of these stations, as well as the monitoring station, is shown with a map overview of TAPAS in
Figure 1.
Both stations are placed at public schools, and, with TA03 being closest to a major road, this station also sees more jamming than TA10. Antennas are naturally placed on the roofs of the schools a few meters above ground. Thus, with an antenna gain pattern that highly attenuates signals coming from below, the impact of signals from jammers would be reduced compared with the impact on a consumer-grade GNSS receiver at street level.
4. Analysis and Results
The purpose of the following analyses is to characterize the performance that can be obtained using a jammed reference station receiver for an RTK solution. Thus, the following six analyses (as listed in
Table 2) will be used to determine how the best PPK positioning accuracy is achieved for the three selected cases.
All analyses, except number 6, will be based on single-baseline PPK solutions with the jammed receiver as the base. The reference stations used as rover receivers are free from jamming. For all analyses, forward, kinematic processing is used, in order to have the results resemble actual RTK as much as possible.
The various baselines used in the analyses are presented in
Table 3. The fourth baseline of Case 2 is a baseline to a permanent reference station outside the TAPAS network, which is used as an extreme case for baseline solutions.
In all cases, an elevation mask of 10 degrees is used, while the receivers themselves (as previously mentioned) use a 20 dBHz C/N0 mask. Ionospheric processing and tropospheric error states are disabled, and broadcast orbits are used for all relevant analyses because baselines are generally short.
Finally, Analysis 6 will focus on the impact to the TAPAS network solution by assessing network performance during the incidents. This is possible by using TAPAS network logs, network post processing, as well as the positioning solution of the network monitoring station previously mentioned (and as shown in
Figure 1).
RTKlib (version 2.4.3demo5 b33e) is used for Analyses 1 and 2 thanks to its ease of use and the fact that it provided plot options otherwise unavailable to us.
Commercial postprocessing software, Inertial Explorer (IE) version 8.70.8722, is used for PPK solutions in Analyses 3, 4, and 5. This ensures coherency in positioning solutions, and IE is well-renowned for its accurate solutions.
The network evaluation in Analysis 6 is done with the GNSMART 2.70 software by Geo++, which also processes the TAPAS network solution.
Owing to processing issues with four-constellation solutions in IE, it was chosen not to include BeiDou in this particular investigation. Instead, as will be clear, the results are based on GPS, GLONASS, and Galileo constellations. While there are reasons to believe that the inclusion of BeiDou would improve positioning performance (namely BeiDou B1I center frequency, 1561.098 MHz, is slightly offset from GPS L1, which sees the majority of the jamming [
8]), there is no reason to believe that it would affect the general conclusions of this paper.
Further, it should be noted that Inertial Explorer must include GPS in its PPK solution and, as such, solutions without GPS were not evaluated.
4.1. Analysis 1: Performance of Receiver Tracking
The purpose of this analysis is to assess the performance of receiver tracking during jamming. Cycle slips identified during the three jamming cases are shown in
Figure 7, in order to quickly assess carrier phase tracking performance. As seen in the figure, Case 2 is most severe with TA10 registering several cycle slips, but in general, these cycle slips (with a few rare exceptions) occur following a loss of tracking owing to the C/N
0 value dropping below the receiver tracking threshold of 20 dBHz. It should be noted that, in all three cases, there are actually satellites not affected by a single cycle slip throughout the entire event—even though jamming is severe.
In other words, carrier phase tracking is stable as long as tracking is possible. This suggests that RTK positioning is robust against jamming, and it should be possible to perform reliable RTK positioning during most real-world jamming events, as long as satellite signals are not completely repressed. This is in line with [
18], who noted that pseudo-range error statistics were only slightly affected by jamming, and that the main impact was the decreased number of available satellites.
In Cases 1 and 3, a position can be determined for all epochs; however, in Case 2, there are eight epochs where jamming is so severe that it is impossible to actually obtain a baseline solution owing to a lack of data.
Summary: Cycle slips occur when tracking of a satellite is completely lost due to very low C/N0. As such, it should be possible to use tracked satellites for reliable RTK carrier phase-based positioning.
4.2. Analysis 2: Code versus Carrier Phase Positioning Performance
The purpose of this analysis is to evaluate the performance of code versus carrier phase-based positioning. Following up on the first analysis, this is a comparison of the reliability of code and phase positioning solutions during jamming. For this analysis, only jamming Case 3 is used because it is a relatively light incident. This is the only case where a sufficient number of interference-affected satellites are tracked throughout the incident.
Thus, for Case 3, a differential GPS (DGPS) and a kinematic PPK float solution are determined using SVs G07, G10, G16, G20, G21, G26, and G27—all satellites that are affected by jamming while the tracking is not lost. As Case 3 is a single-frequency case, only L1 data are used for the solutions. To avoid initialization obscuring the PPK solution (and because of the fact that hourly files are used), the positioning solution is calculated for the entire two hour period, 19:00–21:00.
Baseline 1 of
Table 3 is used. This is a 4.1 km baseline with the jammed station TA03 as a base, and in this specific analysis, the RTKLIB software is used for the calculations.
Figure 8 and
Figure 9 show residuals and horizontal baseline components for both the DGPS and PPK float solutions.
Table 4 shows standard deviations (std) of those solutions both during the jamming incident and during a similar clean period.
From
Figure 8, it is seen that both code and carrier phase residuals are affected by jamming, and it is not immediately clear that the carrier phase-based solution would be less affected by jamming.
However, as shown in both
Table 4 and
Figure 9, jamming has very little impact on the carrier phase-based PPK float solution, while the DGPS solution is affected by noise. This may be because of the fact that a float solution in general is much more precise than a code-based DGPS solution, and that a small amount of noise, therefore, could result in a much larger impact on the DGPS solution. Looking at the y-axis of
Figure 8, for instance, it is seen that the jamming only increases the carrier phase residuals by a few mm, while it translates into decimeters/meters on the code.
In general, this indicates that positioning solutions based on the carrier phase is the more robust and safer option during jamming.
The standard deviation of the float solution is actually better during jamming than during the clean period. As seen in
Figure 8, this is a matter of circumstances, as two low elevation satellites (G07, G10) are the primary reason for increasing the standard deviation (std) of the float solution in the period leading up to the jamming incident.
These results support the conclusions of Analysis 1—that if a satellite is tracked by the receivers, it may be used in a reliable carrier phase positioning solution.
Summary: Observations affected by jamming have almost zero influence on carrier phase-based positioning precision. This again indicates that the precision of carrier phase-based positioning will primarily degrade when there are not enough satellites available to determine a position. The performance of code positioning, on the other hand, will be noticeably degraded during jamming incidents.
4.3. Analysis 3: Effects of Using Multiple Constellations
The purpose of this analysis is to evaluate the benefits of using more GNSS constellations. With some general observations made in the first two analyses, for the remainder of the article, the focus will be exclusively on carrier phase-based positioning in order to investigate how the best PPK solutions are achieved during jamming incidents.
To determine how to achieve the best PPK positioning solution, we first look at the significance of including several GNSS constellations. The following three analyses (3, 4, and 5) make use of the Inertial Explorer (IE) software. In IE, the GPS constellation is mandatory, thus only the impact of adding more constellations to a GPS solution is examined. Clearly, the best robustness would be achieved by determining a solution using only constellations unaffected by jamming.
Table 5 and
Table 6 show position standard deviations using different combinations of constellations for jamming Cases 1 and 2.
Interestingly, it is seen in both cases that including more constellations does not always result in a better solution. This is seen in both Cases 1 and 2. In Case 1, the addition of Galileo to the GPS + GLO solution leads to a worse result, while in Case 2, the same is true for the inclusion of GLONASS satellites.
Looking at
Figure 10 and
Figure 11, however, gives a fuller picture of the consequences of including additional constellations.
Figure 10 shows that there are benefits of using multiple constellations, as including GLONASS almost completely negates the impact of jamming, owing to the fact that this constellation is not affected by the jamming incident.
Including the heavily jammed Galileo constellation to a solution using only GPS also improves the result; it makes a solution possible in the period around 11:20–11:40, which otherwise was prevented using only GPS, and a clear improvement is further seen up until 11:49.
Now we turn to how, in both Case 1 and Case 2, two-constellation solutions (2CS) seem to perform better than a full three-constellation (3CS) solution. One could suspect that this is simply because of the fact that adding noisy observations to the processing might very well lead to a worse solution.
However, it was shown in Analyses 1 and 2 that carrier phase tracking is stable during these incidents, and that a carrier phase-based solution sees very little noise. It is, in other words, not the observations themselves that are the issue.
The increased std of the 3CS stems from the processing, and two issues can be identified:
These issues are not general to carrier phase-based positioning. They are specific to this particular setup, and are caused by the unique combination of processing software and the sudden decrease in the number of observations caused by jamming. The issues occur because IE, naturally, is not built for this purpose. For any ordinary (jamming free) case of post processing, these issues should be non-existent.
It is also important to note, though, that in both Case 1 and Case 2, the increased stds of the 3CS are due to short periods (~2 min) with large errors (see
Figure 10 and
Figure 11), primarily caused by the above two issues.
While these issues are specific to the setup, they are still relevant, as there are more general conclusions to be drawn from an investigation of them.
Looking at the first issue, IE is proprietary software, and we do not know for certain that constellations are in fact prioritized, but the results here suggest that this is the case. This is most clearly seen in
Figure 11 in the period 17:41–17:42, as emphasized by the zoom.
Here, following the start of the HIP, the number of satellites on all solutions drops to zero—except the GPS + Galileo solution. This indicates that the full 3CS is prioritizing a GPS + GLO fix, which is not possible at the time, over a GPS + Galileo fix, which is possible.
The results from Case 1 also suggest that IE favors a GPS + GLO solution. Following the start of the jamming incident at 11:17, the 3CS reverts to a GPS + GLO solution. This is clearly shown in the bottom of
Figure 10, as the number of satellites in the 3CS and GPS + GLO solutions is exactly the same in the period of (approximately) 11:18–11:30.
Thus, IE seems to prioritize constellations in the following way: 1. GPS, 2. GLONASS, 3. Galileo. This is not an issue in Case 1, where GLONASS is the better choice, but in Case 2, it leads to markedly worse results in the period 17:40–17:45.
The second issue, inclusion of additional constellations, is visible in both
Figure 10 and
Figure 11. When Galileo is reintroduced, the 3D positioning error spikes.
Interestingly, in Case 1, as shown in the top zoom of
Figure 10, reintroducing Galileo to the 3CS makes it worse than the RFI heavy GPS + Galileo solution, although the only change to the 3CS is the addition of the interference-free GLONASS constellation.
The inclusion of additional constellations may temporarily increase errors in a way that technically does not make sense. If a GPS + GLO and a GPS + Galileo solution both have small errors, why would the 3CS have 3D errors up to 1.8 m? It should be possible to handle the additional constellation in a way that does not increase the error so dramatically.
The same is seen in Case 2, where the reintroduction of Galileo at 17:42 makes the 3CS worse than both 2CS for a short time.
The two issues presented here are basically artifacts of the PPK processing, and not direct consequences of the jamming incident. Disregarding the specific results, however, what is seen in this analysis is that the processing method may actually produce unnecessary errors in the positioning solution, if the data are not handled carefully.
Summary: In general, using more constellations will naturally provide better positioning results during jamming, due to an increased number of satellites available.
It is also clear that, while jamming may cause large errors, a solution using several frequencies and constellations will be very robust. Only in the short period at approximately 17:41 in Case 2, will all solutions have a significant error. Otherwise, it is possible at all times to stay within RTK accuracy despite jamming at the reference station.
It was further shown that the processing method matters. If RTK accuracy is to be achieved, then care must be taken when doing carrier phase-based positioning during jamming incidents.
For this specific setup, it was noted that, during heavy jamming, any additional constellations included in a GPS solution should be prioritized by satellite availability and C/N0 values in order to select the least affected constellation first.
Further, when introducing jamming-affected constellations to the solution (after a complete loss of integer fix), a weighting scheme or a hold-out/initialization period should be used in order to minimize (or negate) a negative impact on the positioning solution.
As a final note, the most robust solution would probably be achieved by using only observations from constellations free of jamming (like GLONASS in jamming Case 1). A similar conclusion is made by [
15]
using a code-based receiver. For this paper, it is not possible to document the benefits of using only jamming-free constellations, as the capabilities of the current processing software are limited. 4.4. Analysis 4: Significance of the Baseline
The purpose of this analysis is to examine the effect of baseline length on the positioning solution. In this analysis, only dual-frequency solutions to Case 2 are considered. In order to investigate the influence of the baseline, we chose to look at GPS + Galileo solutions only, as the previous analysis showed that this solution had the best positioning accuracy.
Table 7 shows the standard deviations during the jamming incident for PPK solutions on all of the baselines used in Case 2.
Table 7 shows clearly that, even during the multifrequency jamming incident, good positioning accuracy may still be achieved with carrier phase-based positioning.
Figure 12 and
Figure 13 provide a more in-depth look at the four PPK solutions, focusing solely on the first 25 min of the jamming incident. It is clear that all solutions are very similar, having almost entirely the same number of satellites, and (except for the very long baseline) a similar performance for the entire period.
All solutions see a complete loss of fix at the beginning of the incident, and then experience severe positioning errors during the HIP, although only for about 1 min.
Only the very long 61 km baseline stands out. Not only is it clear that the solution recovers more slowly during the HIP, but, as seen in
Figure 13, it actually never really recovers from the first loss of fix at 17:31, even though the number of satellites in the solution is exactly the same as for the shorter baselines.
This indicates that the lack of recovery is not singularly due to jamming, but more a consequence of the long baseline, which in general will lead to reduced positioning performance. This is also backed by
Figure 14, showing that, besides the HIP, a fixed solution is achieved for the very long baseline throughout almost the entire jamming incident.
The ambiguity resolution (AR) status levels of
Figure 14 are explained in [
38].
Another observation is that the sudden degradation in data when the HIP starts leads to a large positioning error for all baselines, but they quickly recover and are not that heavily affected during the rest of the HIP. This could indicate that the sudden change in jamming power has a larger effect on the positioning performance than simply having a strong steady source, leaving only a few satellites available. As discussed at the end of this paper, it would be interesting to further investigate if a moving jammer, or a jammer constantly switched on and off, would affect the PPK solutions more severely than a constant static jamming source.
Both
Figure 12 and
Figure 13 show that positioning solutions are very similar as long as the baseline is shorter than 30 km. The very long baseline actually also performs at the same level up until jamming starts, but then does not achieve the same accuracy again.
Summary: Baseline length shows no significant improvements in the positioning solution during jamming. Very short baselines will not provide a more robust solution, and a difference is only observed at long baselines, where positioning (i.e., ambiguity resolution) will be slightly more vulnerable to jamming.
4.5. Analysis 5: Impacts of a Dual-Frequency Solution
The purpose of this analysis is to evaluate the benefits of using dual-frequency GNSS data during jamming as compared with using a single-frequency only. In this analysis, there will be a clear distinction between jamming Cases 1 and 2 owing the single-frequency versus multi-frequency nature of the jamming incidents.
Looking first at Case 1,
Table 8 shows the effect of including GPS L2 observations in the single-frequency jamming case. It is clear that, during jamming, it makes almost no difference to include the extra frequency. The major reason for this is most likely the lack of L1 data. In IE, a dual-frequency solution utilizes a combination of L1 and L2 data, thus if observations on one frequency are missing, a solution is impossible.
Furthermore, IE in this setup uses the L2W observations. These observations are based on codeless tracking, and thus depend on the L1 observations, so naturally, when GPS L1 is jammed, so is GPS L2W. For Case 1, L2C observations are jamming-free, thus using L2C could have led to improved accuracy in all dual-frequency solutions.
In this analysis, the GPS solutions are identical, except at the very end of the incident where the L1 + L2 solution is faster in re-acquiring a fix, leading to slightly smaller deviations.
Looking at solutions using both of the heavily affected constellations, GPS and Galileo, some of the same tendencies are apparent. In
Table 8, it is seen that including a second frequency makes little difference. However,
Figure 15 provides a further look into these solutions, with plots of 2D and 3D positioning error, and it is clear from
Figure 15 that using two frequencies in this case actually makes a considerable difference. While precision and std are almost the same in both the single- and dual-frequency case, accuracy is clearly improved in the dual-frequency solution.
It is also clear that there are still large gaps where a position has not been calculated. A dual-frequency solution is simply not possible owing to the lack of L1 observations.
As previously mentioned, it does make sense that single-frequency solutions based only on L2 are not possible, given that the PPK software is not meant to handle jamming. However, if GNSS positioning in general is handled this way, it introduces a major vulnerability to L1 jamming, which is unfortunate as L1 jamming happens quite often [
8].
As GLONASS is basically unaffected by jamming in Case 1, including this constellation has a huge effect on positioning accuracy compared with using GPS only. Looking at
Table 8, it is clear that hardly anything is gained by including carrier phase observations from an additional frequency, though this is mostly because the L1 solution is already very good.
Summary: To conclude on the single-frequency case, having more frequencies available may improve accuracy of the solution. In this setup, however, it actually makes little difference. This is partially due to the fact that the processing software must include the jammed L1 frequency, which, in this case, may result in having only very few observations available. Being able to make solutions based solely on unaffected frequencies would most likely be a huge benefit.
Turning now to Case 2, it is not possible to do a solution based only on clean observations because all constellations and frequencies are affected. As Analysis 2 showed that a GPS + Gal solution had the best accuracy, this analysis will be based on these two constellations.
Table 9 shows the deviation from the known rover position for baseline 2 in jamming Case 2, and the numbers show that including a second frequency does make a significant difference.
Looking at
Figure 16, though, it is clear that the difference between the single- and dual-frequency solutions is mostly noticeable following the start of the HIP.
As with jamming Case 1, it is clear that using two frequencies mostly provides two benefits for PPK/RTK positioning:
In periods with heavy jamming, and only a few available satellites, a dual-frequency solution performs better than a single-frequency solution.
Following a heavy jamming incident, a dual-frequency solution quickly recovers, while the single-frequency solution seems to take a while in reacquiring a solid position fix.
Summary: It makes sense to use two (or more) frequencies in RTK positioning solutions during jamming incidents. However, with the processing software used for these analyses, benefits are few and limited to some specific circumstances.
4.6. Analysis 6: The Network Solution
The purpose of this analysis is to investigate how jamming of a single reference station impacts end user positioning performance in a network RTK solution. In order to evaluate RTK network performance during jamming, both network fixing ratios (the ratio of integer fixed satellites to the number of tracked satellites) and rover positioning may be investigated. What is of interest is whether the network as a whole (or a group of neighboring stations) will be affected, when one reference station suddenly succumbs to jamming.
As previously mentioned, a permanent rover, known as the monitor station, has been established in the TAPAS network, thus it is straight forward to determine the impact on rover positioning during a jamming incident using positioning data from this station.
The monitor station, however, was only established in May 2020 and, therefore, of the three cases used here, only jamming Case 1 was observed by the monitor station. For jamming Case 2, no real-time positioning data are available, but the network performance from the incident is logged on the server for evaluation.
Owing to the rather light nature of jamming Case 3, and the similarities with Case 1 (in that it is GPS and Galileo L1 jamming), it will be disregarded in this analysis.
The monitor station consists of a Septentrio Mosaic multi-constellation, multi-frequency RTK receiver coupled with a Septentrio PolaNt-x MF antenna. The receiver is constantly connected to the TAPAS virtual reference station (VRS) solution, which is transmitting triple frequency GPS, Galileo, and BeiDou data, as well as dual-frequency GLONASS data.
The monitor station is located roughly 3.2 km from the nearest reference station (TA06) and, as seen in
Figure 1, neither TA03 or TA10 are among the nearest stations.
In the positioning solution from the monitor station during Case 1, no discernible impact is seen on the accuracy or precision of the solution. The standard deviation of the relative positioning solution during the Case 1 jamming incident is shown in
Table 10 for the three coordinate components, and these are clearly within RTK standards.
Unsurprisingly, there is no clear impact, as this solution is a full four constellation and three frequency solution during a single-frequency jamming incident—and it is not even affecting any of the nearest reference stations (only TA03 is affected in Case 1).
Despite this,
Figure 17 shows that the number of satellites in the positioning solution seemingly drops during the jamming incident, even though jamming affects just 1 reference station in a network of 11. Looking into the network fixing ratio, it is clear that the entire network’s ability to fix ambiguities for the Galileo satellites is somehow affected in this period.
The beginning of the incident, however, does not fully correlate with the drop-out of Galileo, and neither does a post-processed network solution show any problems on the fixing ratios (except for the jamming-affected station, TA03). Thus, it may be concluded that the drop-out of Galileo satellites was not due to jamming, but rather the previous configurations or the old version of the processing software employed at that time.
While jamming Case 2 happened before the monitor station was established, it is still possible to refer to the network fixing rates from the incident. Network fixing rates are continuously logged in real time on the processing server.
The fixing rate of the network during jamming Case 2 is shown in
Figure 18. It should be noted that the fixing rate becomes heavily affected after 18:30, but this is unrelated to the jamming incident, which ends at 18:18, and thus was not investigated further. In
Figure 18, the jamming incident is discernible by small dents at 17:27, 18:07, and again at 18:18. These dents appear as a result of satellites at TA10 loosing fix at the beginning of the jamming incident, and being reintroduced in the solution near the end of the jamming incident (which ends at 18:18, but a few satellites already reappear at 18:07).
In other words, the jamming incident is registered by the network, but does not seem to impact the performance of the network besides the affected station itself—just like what was seen in Case 1.
While for this paper, a VRS solution was used for NRTK positioning, there are different methods for network processing that were not investigated. A Flächen korrektur parameter (FKP) [
39] relies heavily on (typically linear) interpolation of observations from the three nearest reference stations, in combination with the original observations from the nearest of them. Therefore, such a solution may be more vulnerable to jamming in any of these three stations, while completely unaffected by the remaining network.
Several other NRTK methods exist, such as pseudo-reference station (PRS) and master auxiliary concept (MAC). A good description of the relationship between these methods is provided by [
40]. Moreover, for future work, the more recently introduced PPP-RTK (also referred to as SSR or PPP-AR) [
41,
42] method would also be interesting to evaluate.
This also highlights that there are still a lot of scenarios to be investigated with regards to jamming on NRTK. Apart from the processing method, investigations into the impact of network density and the position of the jammed reference station relative to the rover are also important in evaluating the robustness of NRTK. It has been shown that using dense networks has benefits to accuracy [
43], and it is very possible that dense networks would also be more robust to the jamming of a single station.
Summary: The TAPAS network solution is unaffected by the jamming incidents, except for the station being jammed. No impact is seen on the rover positioning performance during the incidents.
It should, however, be noted that this concludes nothing about network RTK in general. The impact of the processing method has not been investigated. It is also very possible that a sparse network would be more affected due to longer baselines between reference stations. Furthermore, in a sparse network it is possible that there will be larger consequences for rover positioning, if especially the nearest reference station is affected by jamming.
5. Discussion
In this work, the impact of jamming on carrier phase-based PPK and NRTK solutions was studied. The purpose of this is to evaluate the robustness of existing RTK solutions to RFI.
It is shown that jamming in reference stations may cause positioning errors of up to several meters in the rover receiver when a single-baseline PPK solution is analyzed. This however, is only the case with once-in-a-year incidents and, as shown in [
8], most jamming incidents in GNSS reference stations will have little to no impact on RTK positioning.
It is noted that the analyses in this paper build on data collected by stationary geodetic grade receivers and choke ring antennae, mounted in locations that will in general be distanced and elevated above the interference sources. Furthermore, the receivers (which are Septentrio PolaRx5s scintillation receivers) use an even more accurate clock than most reference station receivers. It is very possible that lower grade receivers using smaller antennas at street level would experience a more significant impact during similar jamming incidents.
What is clear from the analyses is also that the processing methodology matters, and as such, the positioning results presented here would most likely be different if another processing software was used. Several results indicate that being able to use only unaffected GNSS constellations and frequencies in a positioning solution could lead to improved positioning, and that the way in which GNSS constellations are included in a positioning solution should be considered carefully.
Especially, because most jammers target GPS L1/Galileo E1 [
4,
5,
8], being able to do a solution not dependent on L1 (i.e., an L2 only or L2 + L5 solution) would in most cases completely negate the effects of jamming.
It should be noted that, while using other frequencies bands than L1/E1 might currently pose a solution to the jamming problem, this may very well be temporary. As multi-frequency receivers become more and more common, most likely so will multi-frequency jammers as well.
Thus, the results and some of the conclusions presented in this paper only apply to this specific setup, and one should be careful about stating anything about the general severity of the jamming incidents.
It should be emphasized that, while jamming is not a big issue in the cases analyzed herein, interference and PPD jamming may well be an issue for other receivers. For instance, even if the reference station is not affected, a jammer on the rover side might severely impact the positioning solution, as was also shown in [
23]. Several authors, including [
14,
15], also showed that this was the case for code-based receivers.
Furthermore, it was seen that, in a dense network such as TAPAS, the network solution is not severely impacted by a single station being jammed. It would, however, be interesting to investigate NRTK solutions more in-depth, and study the impact of jamming on the following:
A sparse reference station network;
The reference station nearest to the rover;
Various NRTK solutions like FKP, PRS, MAC, or PPP-RTK.
Thus, this contribution only provides a part of what is needed in order to fully evaluate the robustness of an NRTK solution.
A final observation is that a sudden degradation of data, such as is seen in jamming Case 2, seems to cause a larger positioning error than steady continuous jamming. This could indicate that the sudden change in jamming power has a larger effect on the positioning performance than simply having strong steady RFI. Therefore, it should be investigated whether a moving jammer, or a jammer constantly being switched on and off, would have a larger impact on RTK positioning than a constant static jamming source.
6. Conclusions
In this paper, three of the most severe incidents of jamming registered by the TAPAS network are analyzed. While no exact metric exists for determining the severity of a jamming incident, based on both duration and jamming strength, the three selected cases are once-in-a-year incidents.
It was shown that single-baseline solutions based on a jamming-affected reference station may be severely affected, with errors up to several meters. Solutions based entirely on the affected frequencies and constellations are especially vulnerable.
However, for positioning solutions based on several frequencies and constellations, errors outside the RTK norm (±5 cm) only occurred for a period of 1–2 min in just one of the three selected cases. Baseline length was shown to be irrelevant except for the extreme case of 61 km. Thus, multifrequency, multi-constellation solutions based on the TAPAS network are robust towards real-world jamming.
It was further shown that carrier phase tracking in the reference station receivers is very reliable, and as long as the receiver tracks a satellite, it may be used for precise carrier phase-based positioning. In other words, only in severe cases, where C/N
0 ratio of a satellite is suppressed below the tracking threshold of 20 dBHz, will a satellite not provide reliable observation data. This supports observations made by [
18].
A similar conclusion may be made from the results of Analysis 2, which showed that the standard deviation of the carrier phase-based solution was basically unaffected by jamming (while a DGPS solution based on the same data was clearly degraded).
Furthermore, none of the investigated incidents had any perceivable impact on the TAPAS network performance, nor the NTRK positioning solution.
Thus, the conclusion is that a carrier phase-based solution using multi-frequency, multi-constellation observations from the TAPAS network is robust to jamming, and as an end user, one should only worry about interference on the rover end. This is, at least in part, due to the hardware and positioning of the reference receivers.
Finally, while many of the results presented in Analyses 3, 4, and 5 are specific to this setup, and thus not reproduceable with other PPK software, it is clear that the processing method is important. If maximum robustness is the goal, the solution should not by default prefer some GNSS constellations or frequency bands over others. Instead, the solution should strive to dynamically select (or at least heavily emphasize) only the interference-free observations.


