Article

Recommendations for HCHO and SO2 Retrieval Settings from MAX-DOAS Observations under Different Meteorological Conditions

1
Collaborative Innovation Center of Atmospheric Environment and Equipment Technology, Jiangsu Key Laboratory of Atmospheric Environment Monitoring and Pollution Control, School of Environmental Science and Engineering, Nanjing University of Information Science and Technology, Nanjing 210044, China
2
Shanghai Key Laboratory of Atmospheric Particle Pollution and Prevention (LAP3), Department of Environmental Science and Engineering, Fudan University, Shanghai 200433, China
3
School of Marine Sciences, Nanjing University of Information Science and Technology, Nanjing 210044, China
4
Department of Environmental Science and Engineering, University of Science and Technology of China, Hefei 230026, China
5
School of Earth and Space Sciences, University of Science and Technology of China, Hefei 230026, China
6
Pakistan Meteorological Department, Islamabad 44000, Pakistan
7
Key Lab of Environmental Optics & Technology, Anhui Institute of Optics and Fine Mechanics, Hefei Institutes of Physical Sciences, Chinese Academy of Sciences, Hefei 230031, China
8
School of Environmental Science and Optoelectronic Technology, University of Science and Technology of China, Hefei 230026, China
9
Key Laboratory of Precision Scientific Instrumentation of Anhui Higher Education Institutes, University of Science and Technology of China, Hefei 230026, China
10
Center for Excellence in Regional Atmospheric Environment, Institute of Urban Environment, Chinese Academy of Sciences, Xiamen 361021, China
11
Anhui Province Key Laboratory of Polar Environment and Global Change, University of Science and Technology of China, Hefei 230026, China
12
School of Earth and Atmospheric Sciences, Georgia Institute of Technology, Atlanta, GA 30332, USA
*
Author to whom correspondence should be addressed.
Remote Sens. 2021, 13(12), 2244; https://doi.org/10.3390/rs13122244
Submission received: 19 May 2021 / Revised: 3 June 2021 / Accepted: 7 June 2021 / Published: 8 June 2021

Abstract

:
Recently, the occurrence of fog and haze over China has increased. The retrieval of trace gases from the multi-axis differential optical absorption spectroscopy (MAX-DOAS) is challenging under these conditions. In this study, various reported retrieval settings for formaldehyde (HCHO) and sulfur dioxide (SO2) are compared to evaluate the performance of these settings under different meteorological conditions (clear day, haze, and fog). The dataset from 1st December 2019 to 31st March 2020 over Nanjing, China, is used in this study. The results indicated that for HCHO, the optimal settings were in the 324.5–359 nm wavelength window with a polynomial order of five. At these settings, the fitting and root mean squared (RMS) errors for column density were considerably improved for haze and fog conditions, and the differential slant column densities (DSCDs) showed more accurate values compared to the DSCDs between 336.5 and 359 nm. For SO2, the optimal settings for retrieval were found to be at 307–328 nm with a polynomial order of five. Here, root mean square (RMS) and fitting errors were significantly lower under all conditions. The observed HCHO and SO2 vertical column densities were significantly lower on fog days compared to clear days, reflecting a decreased chemical production of HCHO and aqueous phase oxidation of SO2 in fog droplets.
Keywords:
MAX-DOAS; fog; haze; HCHO; SO2

Graphical Abstract

1. Introduction

During the past two decades, remote sensing has been developed as a powerful tool for atmospheric monitoring and mapping. Initially, air crafts and satellites were used to study cloud patterns and dynamics. The improvements in remote sensing techniques and their application to the atmosphere have made a breakthrough in measuring gaseous content along with their spatial and temporal distributions. Remote sensing can be done either through satellite-based sensors or ground-based instruments. The basic principle of atmospheric monitoring lies in the fact that every pollutant entering the atmosphere will somehow impact electromagnetic radiation at different wavelengths through absorption and scattering. The solar radiance is reduced by the absorption and scattering of atmospheric trace gases in specific wavelength intervals [1].
Multi-axis differential optical absorption spectroscopy (MAX-DOAS) provides valuable information on tropospheric trace gases and aerosols [2]. Molecular absorption in the visible (VIS) and ultraviolet (UV) wavelength range provides information on tropospheric trace gas species at various elevation viewing angles (EVAs). The DOAS technique was pioneered in 1973 and has been used since then to measure atmospheric trace gases with narrowband structures of absorption in different wavelength regions [3,4,5,6,7].
The air quality of most cities in China has been deteriorating in the past due to increased urbanization and industrialization. The frequency of haze days in China has increased intensely, with impacts on public health and has adverse impacts on transportation systems and other activities. In the eastern part of China, haze normally occurs each year during the autumn and winter months, which can be related to the crop burning practices during these months [8,9,10,11,12]. The MAX-DOAS instrument largely depends on the sunlight intensity for measurements in the visible and ultraviolet spectrum. The quality of the DOAS fit is described by the structure of residual fit after several absorbers are subtracted, using the least square fitting method expressed using root mean square (RMS). However, the actual state of the atmosphere, including the scattering processes and the aerosol distribution, holds some constraints subjecting RMS to certain limitations [13]. Owing to the presence of a higher amount of light scattering and absorbing aerosols in the atmosphere, the DOAS fit quality is affected during haze days. At different wavelength bands, sunlight has a varying ability to pass through the atmosphere. Therefore, it has a diverse path length at different wavelength bands that may alter the corresponding trace gas absorption. Hence, it is crucial to choose the appropriate retrieval settings for trace gases for foggy and hazy days [14].
Formaldehyde (HCHO) and sulfur dioxide (SO2) are crucial constituents of the atmosphere that can be strong influencers in determining air quality and regional climate. The oxidation of volatile organic compounds (VOCs) generates HCHO as an intermediate product making this species a suitable indicator for non-methane volatile organic compounds (NMVOCs) in the lower atmosphere [15]. The hydroxyl (OH) radicals that act as key oxidants in the troposphere are significantly impacted by the existence of VOCs. HCHO comes mainly from the oxidation of the VOCs from plant sources, industrial discharge, traffic emissions, and biomass burning. SO2 as an anthropogenic air pollutant is found as the most abundant sulfur-containing compound. About 75% of SO2 in the atmosphere comes from the combustion of fossil fuels rich in sulfur for domestic heating and power generation [16]. Environmental problems linked to the atmospheric SO2 are similar to that of NO2, including the formation of secondary aerosols, acidification of aquatic ecosystems, and negative impacts on human health [17].
The main objective of this study is to optimize retrieval settings for the two crucial trace gases under different meteorological conditions. Meteorological conditions are categorized into clear, haze, and foggy conditions by using a dataset of relative humidity, visibility, and PM2.5. Furthermore, the effect of these meteorological conditions on HCHO and SO2 column densities is also discussed. To the best of our knowledge, this is the first study to report optimal settings for HCHO and SO2 retrieval from MAX-DOAS during haze days.

2. Materials and Methods

2.1. Instrument

The MAX-DOAS instrument is used to make observations for various trace gases in the atmosphere. The instrument works based on the DOAS technique. The MAX-DOAS instrument consists of various components, including a spectrometer (2 Avaspec-UL2048L-USB2 UV: 300–405 nm and VIS: 407–540 nm), which has a spectral resolution of 0.6 nm, a 2D charge-coupled device (CCD) detector with 2048 individual pixels (Sony ILX511), and a telescope unit with stepping motor and multimode quartz glass fiber [18]. The instrument has been designed by the workers from “Key Lab of Environmental Optics & Technology, Anhui Institute of Optics and Fine Mechanics”, while some mechanical parts were imported from Airyx Gmbh (Eppelheim, Germany).

2.2. Observation Site

The instrument (Figure 1) is mounted atop a building at the Nanjing University of Information Science and Technology (NUIST) (32.20° N, 118.72° E Pukou District, Nanjing, Jiangsu province). The Yangtze River separates Pukou from the rest of the city. Nanjing is one of the biggest and oldest cities of China, with a population of more than 8.5 million.

2.3. DOAS Analysis

The MAX-DOAS instrument can measure scattered sunlight at various altitudes in the atmosphere, called the elevation viewing angles (EVA), making it ideal for accurate column measurements of trace gas species. The EVA of the instrument ranges from 1° to 90°. The QDOAS software (version 3.2) developed by BIRA-IASB was used to analyze the observed spectra [19]. Table 1 describes the retrieval settings, including the absorption cross-section used for the DOAS fitting algorithm. Wavelength calibration was performed by a high-resolution solar spectrum [20]. The measured spectrum is the sum of sunlight intensity and electronic offset by the spectrometer. Before analysis, the measured spectra were corrected by subtracting offset. Differential slant column densities (DSCDs) were obtained by choosing 90° as Fraunhofer reference spectrum, which was used to fit the recorded spectra at various elevation angles for each scanning series. The atmospheric scattering processes have an impact on the quality of the spectrum recorded. Therefore, the dataset with a root mean square (RMS) greater than 0.002 and a solar zenith angle greater than 75 were filtered out because the spectrum at solar zenith angle greater than 75 and RMS greater than 0.002 is significantly impacted by the scattering process.
Differential air mass factor (dAMF) is used to calculate Vertical Column Density (VCD) by geometric approximation approach [18,26,27,28]. The hourly average values are used for the calculations of VCD.

2.4. Ancillary Data

The daily mean concentration data for PM2.5 was downloaded from https://www.aqistudy.cn/. The hourly mean relative humidity (RH) and visibility were obtained by an automatic weather station installed in the meteorological observation base of NUIST. The DNQ1 forward scatter visibility sensor is used for the measurements of visibility. The visibility sensor is used to measure light return, by which the scattering coefficient is calculated. The hourly records for visibility and RH are obtained from the meteorological station.

2.5. Error Estimation

The VCD fitting error is derived by using geometric approximation from the DOAS fitting error. Equation (1) shows VCD fitting error.
VCD fitting   error = VCD error VCD = 2 ( DSCD α 90 °   2 + DSCD α = 90 ° 2 2 1 sin α 1 × VCD
The mean error for HCHO VCDs varies from 7% to 28%, with an average of 16%, whereas the average SO2 VCDs error varies from 11% to 34% with an average of 19%.

2.6. TROPOMI Satellite Observations

The Tropospheric Monitoring Instrument (TROPOMI) is onboard the Sentinel-5 Precursor (S5P) satellite. The satellite orbits at an altitude of about 824 km in a sun-synchronous orbit. The satellite overpassing time is 13:30 local solar time on the ascending node. HCHO VCDs are retrieved using an improved USTC (University of Science and Technology of China) TROPOMI retrieval approach [29].

2.7. EMI satellite Observations

Environmental Trace Gases Monitoring Instrument (EMI) is onboard the GeoFen-5 satellite. The GeoFen-5 satellite was launched by China in a sun-synchronous orbit on 9 May 2018. Its equator passing time is similar to TROPOMI. SO2 VCDs are directly retrieved by using optimal estimation technique [30].

3. Results

Based on the meteorological conditions, the period of study (i.e., December 2019–March 2020) has been divided into three categories: (a) clear days with visibility greater than 10 km, relative humidity less than 80%, and PM2.5 concentration less than 40 µg/m3; (b) haze days with visibility between 5 and 10 km, PM2.5 concentration greater than 40 µg/m3, and relative humidity less than 80%; and (c) fog days, where visibility is less than 5 km, and relative humidity is greater than 80% [13,14,31]. Table 2 shows a summary of different meteorological parameters in specific conditions. It is important to mention that the days are categorized into three categories fog, haze, and clear days if the condition prevails throughout the day from sunrise to sunset. Based on this criterion, we have found 25 clear days, 33 haze days, and 20 foggy days.
The time series of PM2.5 concentrations and the corresponding meteorological data, including RH and visibility, is shown in Figure 2.

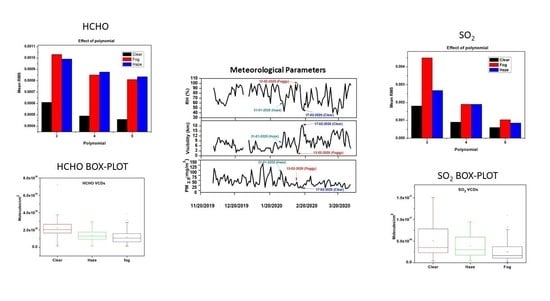
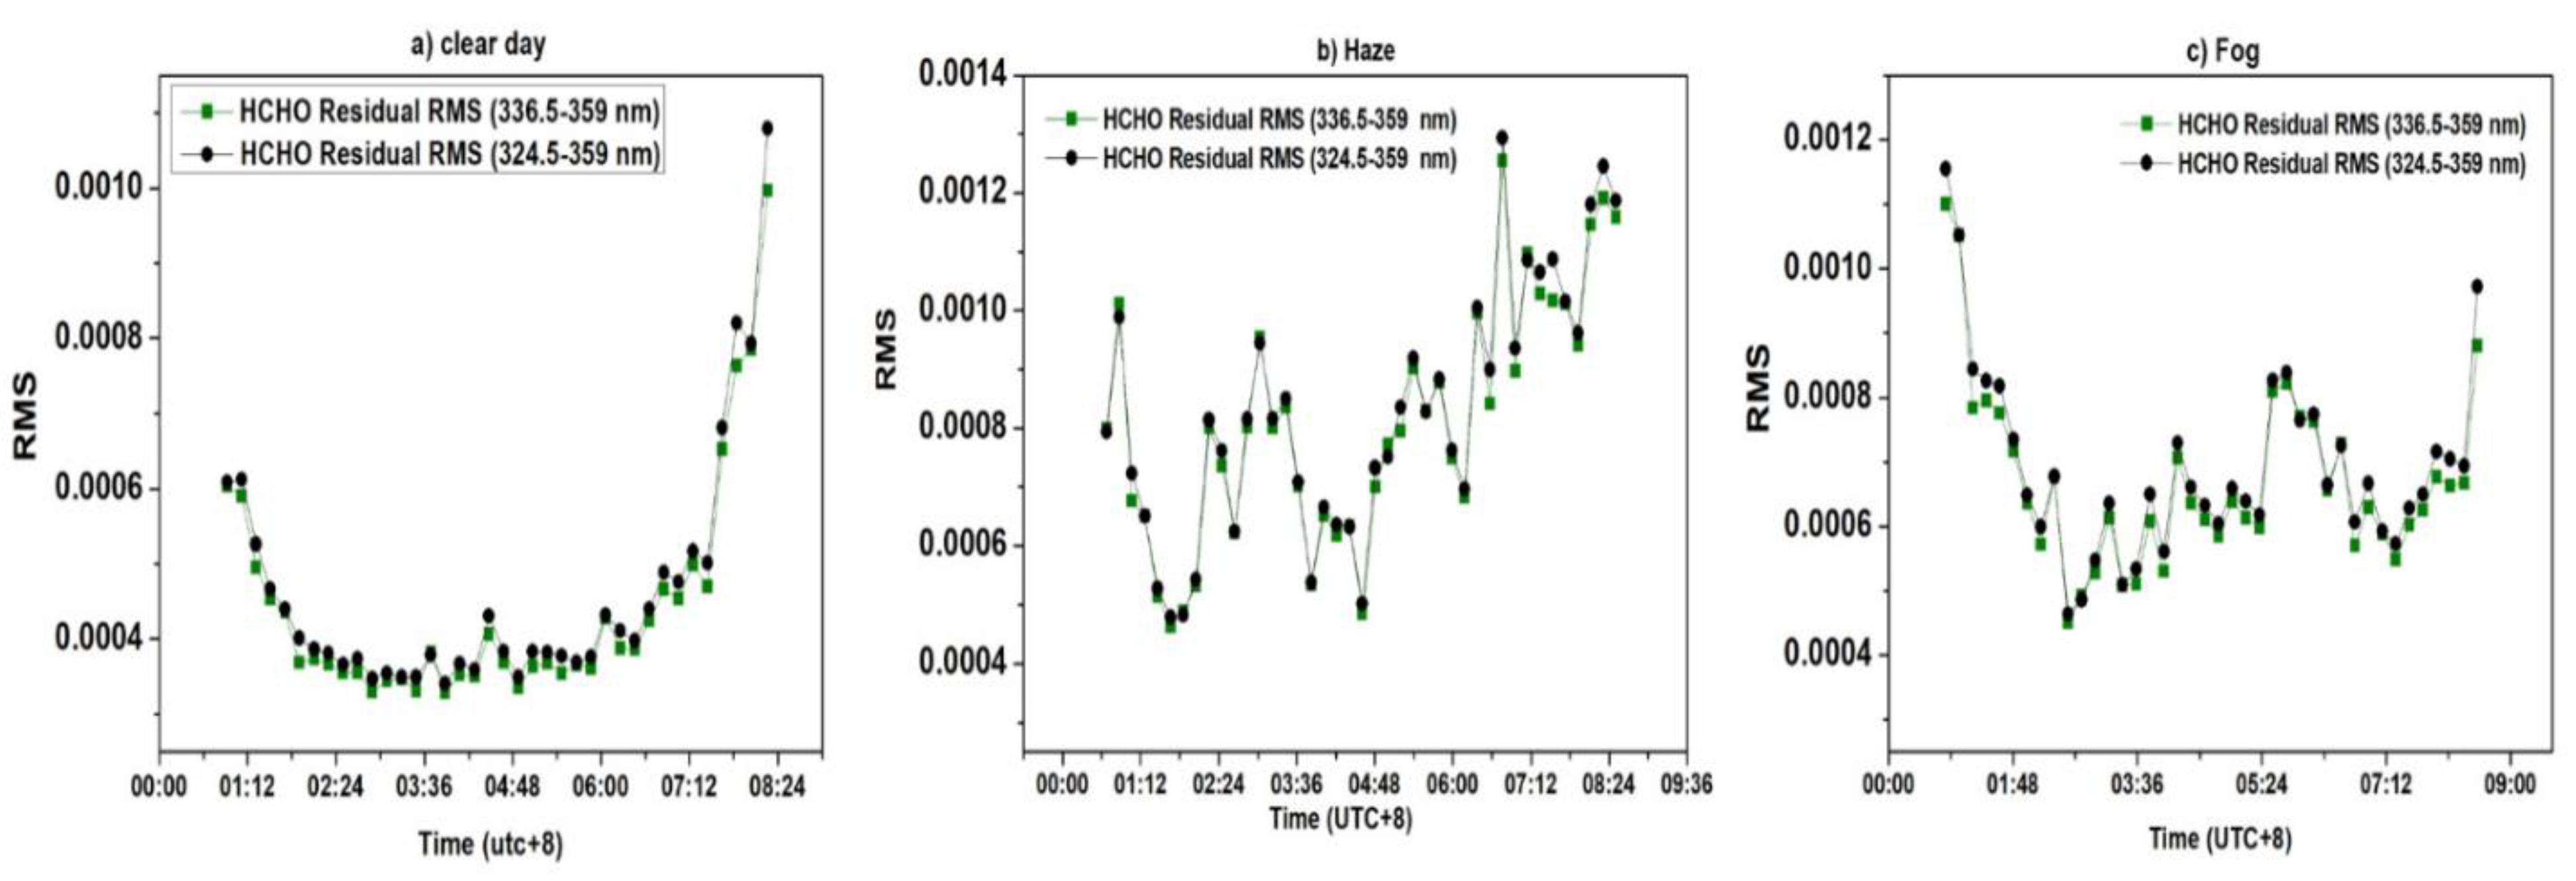
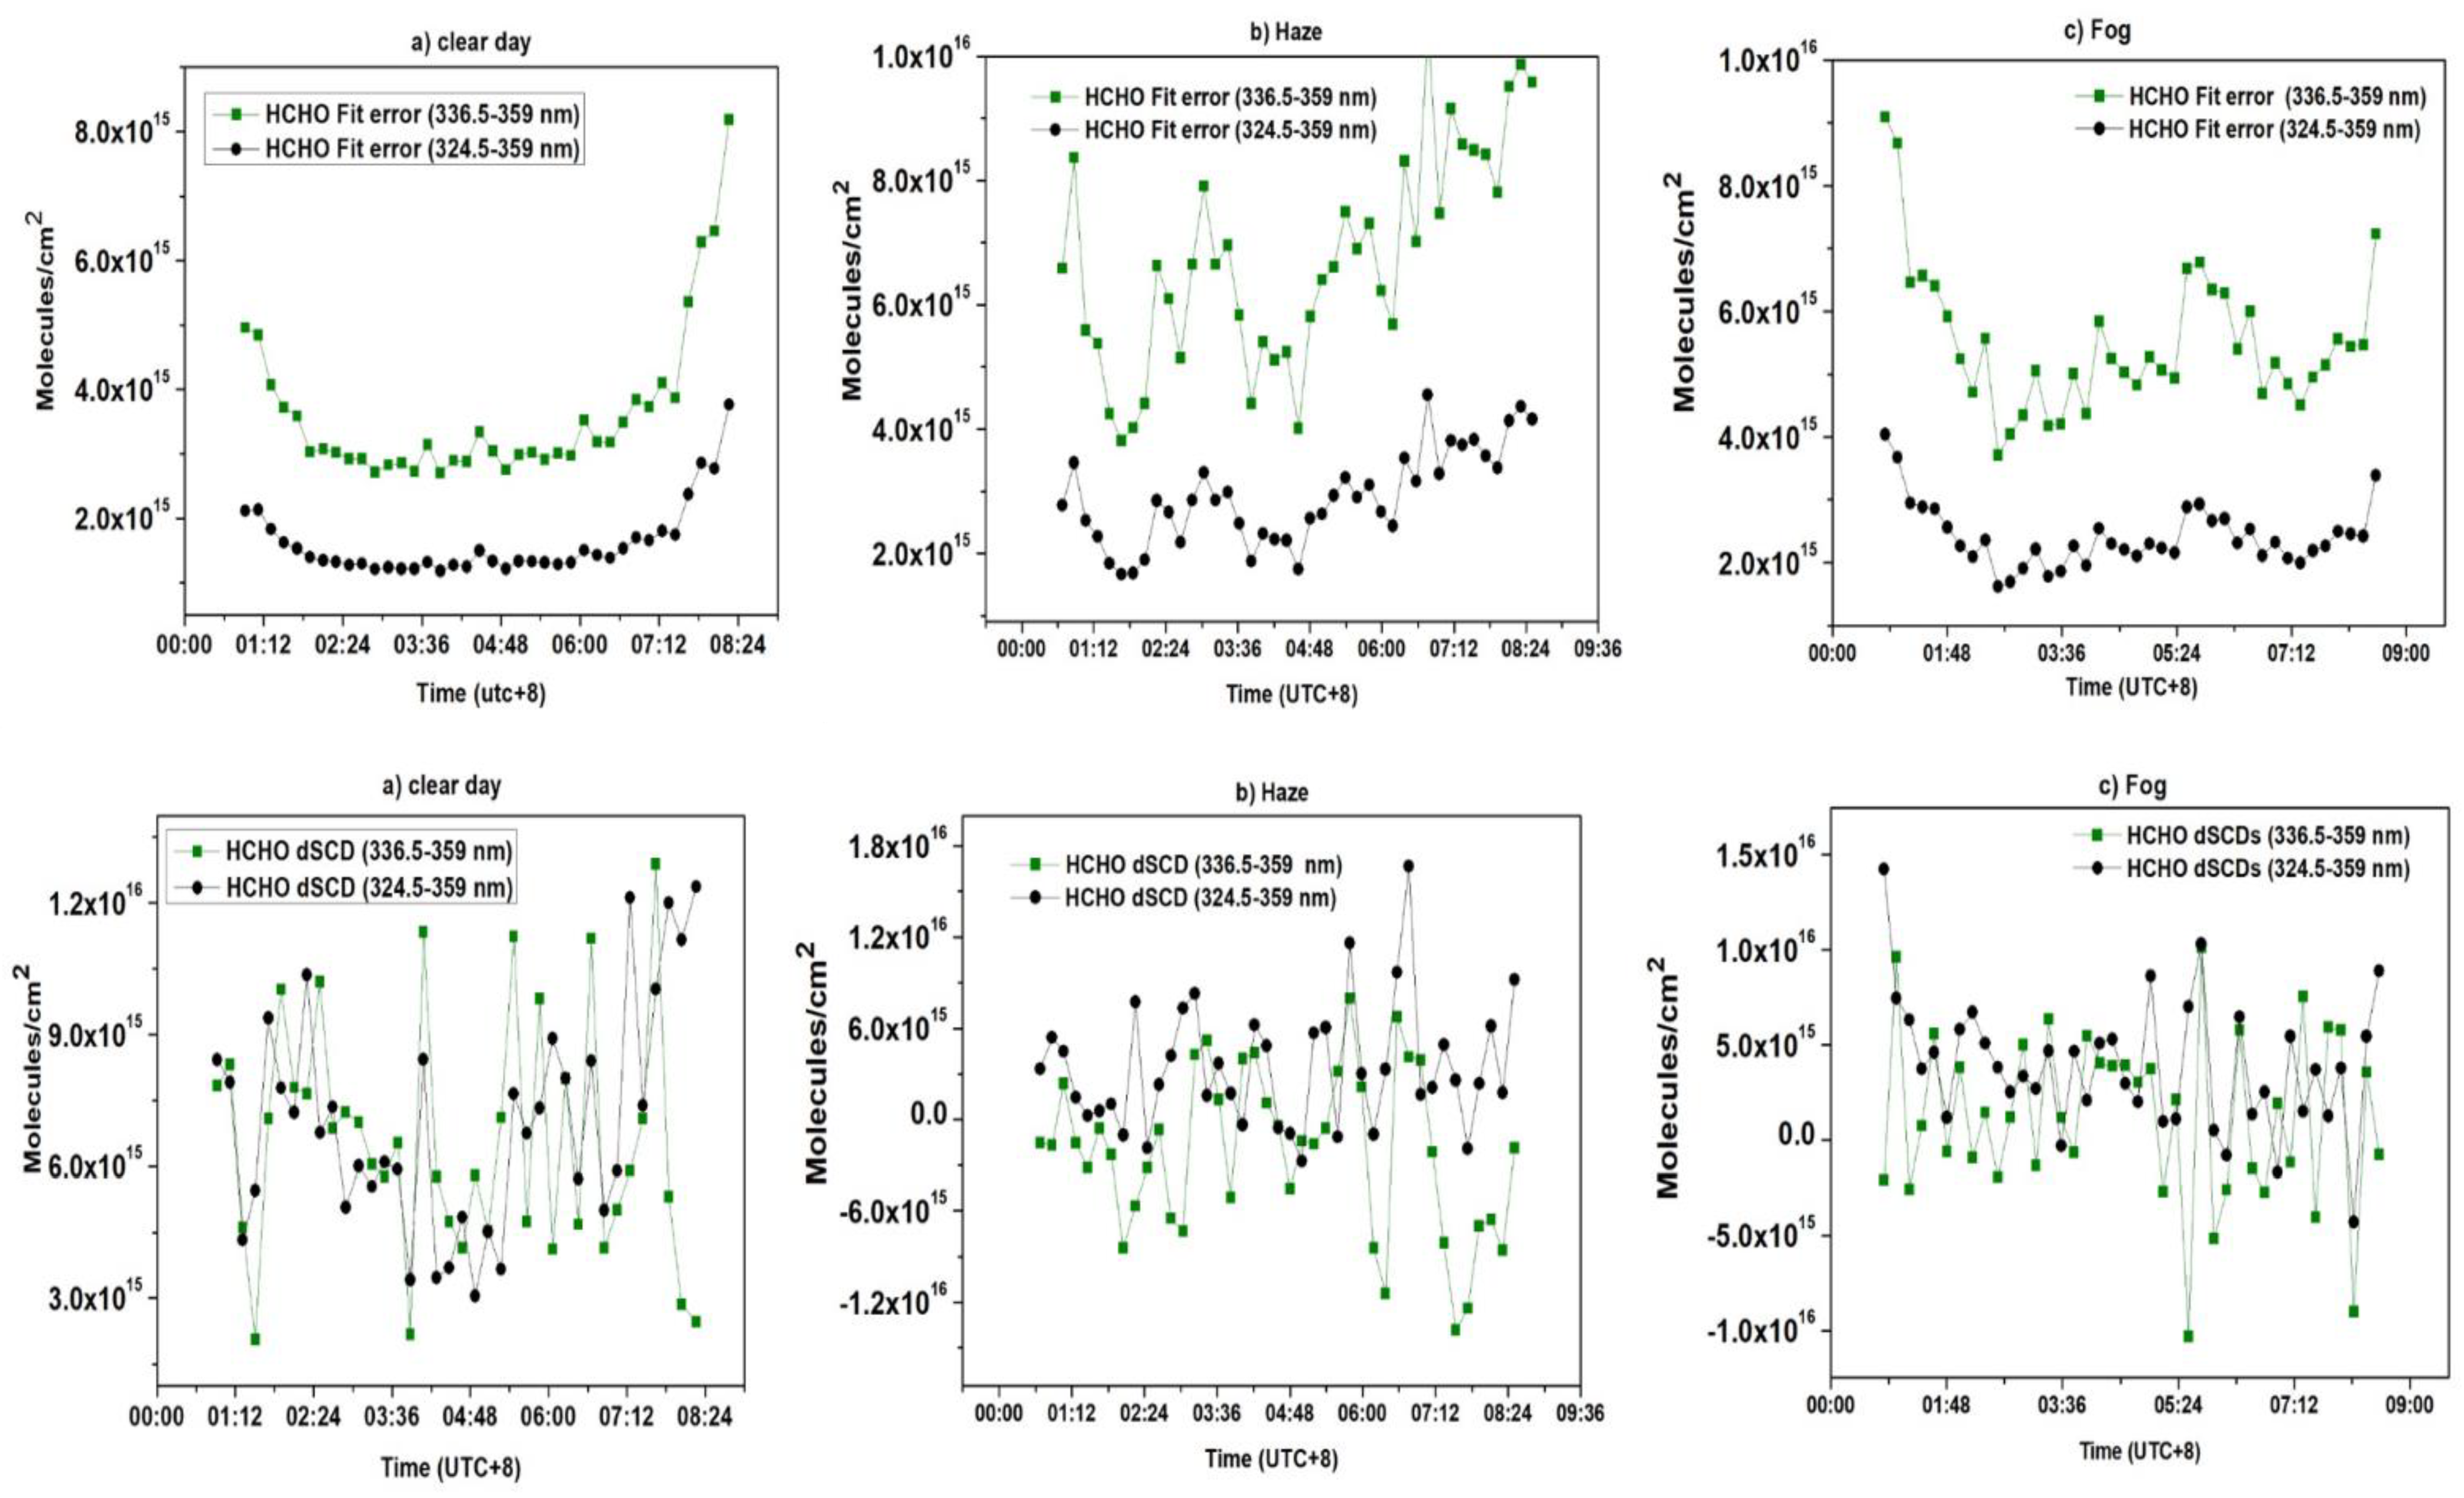
3.1. HCHO Retrieval Settings

Two wavelength ranges were commonly reported in previous studies: 324.5–359 nm [32,33,34] and 336.5–359 nm [35,36]. An example of HCHO spectral DOAS fit for different fitting windows is shown in Figure 3.
Here, we have compared the impact of these two wavelengths ranges on HCHO retrieval during a clear day (17 February 2020), with visibility around 18 km and PM2.5 concentration of 13 µg/m3, a hazy day (31 January 2020), with a visibility of about 8.4 km and PM2.5 concentration of 80 µg/m3, and a foggy day (13 February 2020), with a visibility of about 2.9 km and PM2.5 concentration of 41 µg/m3. It is worth noting here that wavelength-dependent parameters, such as linear fit parameters, the residuals, and the information content of the retrieval, impact the calculation of fit error in QDOAS. For clear sky conditions, no significant impact of wavelength interval was observed in terms of RMS, whereas an improvement in fit error was observed using 324.5 to 359 nm. However, DSCDs values obtained from both wavelength ranges are quite comparable.
In the case of fog and haze conditions, the RMS obtained from both wavelength ranges is similar. The fit error is improved by using wavelength intervals 324.5–359 nm. However, DSCDs values obtained from wavelength intervals 336.5–359 nm during fog and haze conditions are mostly negative when compared to DSCDs obtained at 324.5–359 nm. Therefore, the correct choice of wavelength interval is crucial for HCHO retrieval during fog and haze conditions. Figure 4 shows the comparison of fit error, RMS, and DSCDs during different meteorological conditions for different fitting windows.
Table 3 shows the mean RMS and mean fit error in different conditions throughout the observation period. A low mean fit error (2.18 × 10¹⁵ molecules/cm2) and mean RMS (0.00065) were observed using the 324.5–359 nm fitting window throughout the observation period. The maximum RMS was 0.0015 and minimum was 0.0003, while the maxima for fit error was 5.6 × 10¹⁵ molecules/cm2 and minima was 1.2 × 10¹⁵ molecules/cm2 at the 324.5–359 nm fitting window.
During DOAS analysis, another significant parameter is the degree of the polynomial. This is used for the smooth part of the attenuation spectrum. The degree of polynomial also accounts for the Rayleigh and Mie scattering caused by aerosols. We also investigated the effect of the polynomial order on RMS. Figure 5 shows that the minimum RMS is obtained at a polynomial order of five with a mean RMS below 0.0009 under different meteorological conditions. Therefore, based on a stable DOAS Fit, DSCDs, fit error, and RMS, the fitting window 324.5 to 359 nm and polynomial order five is recommended and is used for further investigation in this study particularly under haze and fog conditions.

3.2. SO2 Retrieval Settings

There is a lack of a common analysis approach for SO2 retrieval. Various fitting windows have been used previously for the retrieval of MAX-DOAS SO2 SCDs despite the importance of an optimal fitting. The three most used fitting windows are 305–317 [37,38,39], 307–328 [40], and 312–326 nm [41]. Figure 6 shows an example of SO2 DOAS fit for selected measurements at different fitting windows.
In this study, these three commonly used fitting windows were evaluated for SO2 retrieval during a clear day, a hazy day, and a foggy day. It is evident from Figure 7 that the RMS and fit error are higher for the fitting windows 305–317 and 312–326 nm during different meteorological conditions, while the observed DSCDs are underestimated, particularly in haze and fog conditions. Low fit error and RMS were observed using the 307–328 nm fitting window during all the conditions. The DSCDs obtained at the 307–328 nm fitting window are more accurate when compared to 305–317 and 312–326 nm.
Table 4 shows the mean RMS and mean fit error in different conditions throughout the observation period. Low mean fit error (2.63 × 10¹⁵ molecules/cm2) and mean RMS (0.0009) were observed using the 307–328 nm fitting window throughout the observation period. The maximum RMS was 0.005 and minimum was 0.0006, while maxima for fit error was 1.2 × 10¹⁶ molecules/cm2 and minima was 1.3 × 10¹⁵ molecules/cm2 at the 324.5–359 nm fitting window.
Moreover, we also studied the effect of polynomial order on RMS. Figure 8 shows that the lowest RMS is attained on polynomial order of five with the mean RMS below 0.001 under different meteorological conditions. Therefore, based on a stable DOAS Fit, DSCDs, fit error, and RMS, fitting window 307–328 nm and polynomial order five is recommended and is used for further investigation in this study, particularly under haze and fog conditions.

3.3. HCHO and SO2 Column Densities over NUIST Nanjing

In the troposphere, a significant driving aspect of trace gases dispersal in terms of chemical behavior and residence period is the climatological state of the area. Hence, the impact of the meteorological conditions on these trace gases is discussed. Figure 9 shows a boxplot for HCHO VCDs during clear, haze, and fog conditions. It is evident from the plot that HCHO VCDs are higher during clear days. During haze and fog conditions, the HCHO VCDs are significantly reduced. It can be ascribed to the fact that HCHO is primarily produced from photo-oxidation of VOCs [42]. It can also be linked to the fact that HCHO VCDs are underestimated to some extent by MAX-DOAS observations during fog and haze conditions due to the low signal-to-noise ratio.
Figure 10 shows a boxplot for SO2 VCDs during different conditions. SO2 VCDs are significantly reduced during fog and haze conditions. It can be linked to the fact that during fog and haze conditions, relative humidity is on the higher side, which aids in the oxidation of SO2, resulting in sulfate formation [43].

3.4. Satellite Validation

3.4.1. Comparison of HCHO Columns

The HCHO VCDs retrieved from MAX-DOAS are compared with observations from TROPOMI over Nanjing. The MAX-DOAS VCDs are averaged around overpass time 12:30 to 14:30 LST, While the TROPOMI data is spatially averaged over a 10 km area of the research site. Figure 11 shows the scatter plot between TROPOMI HCHO VCDs and MAX-DOAS HCHO VCDs. The ground and satellite-based observations show a good correlation (R = 0.84). However, HCHO VCDs measured from TROPOMI are underestimated as compared to MAX-DOAS observations.
The slope and intercept are calculated from reduced major axis (RMA) regression, which includes errors in both variables [44].
β = σ T σ M
α =   T ¯ σ T σ M ×   T ¯
where β, α, σT, and σM represents slope, intercept, standard deviation from Tropomi, and standard deviation from MAX-DOAS, respectively. The slope of the regression line is 0.76.

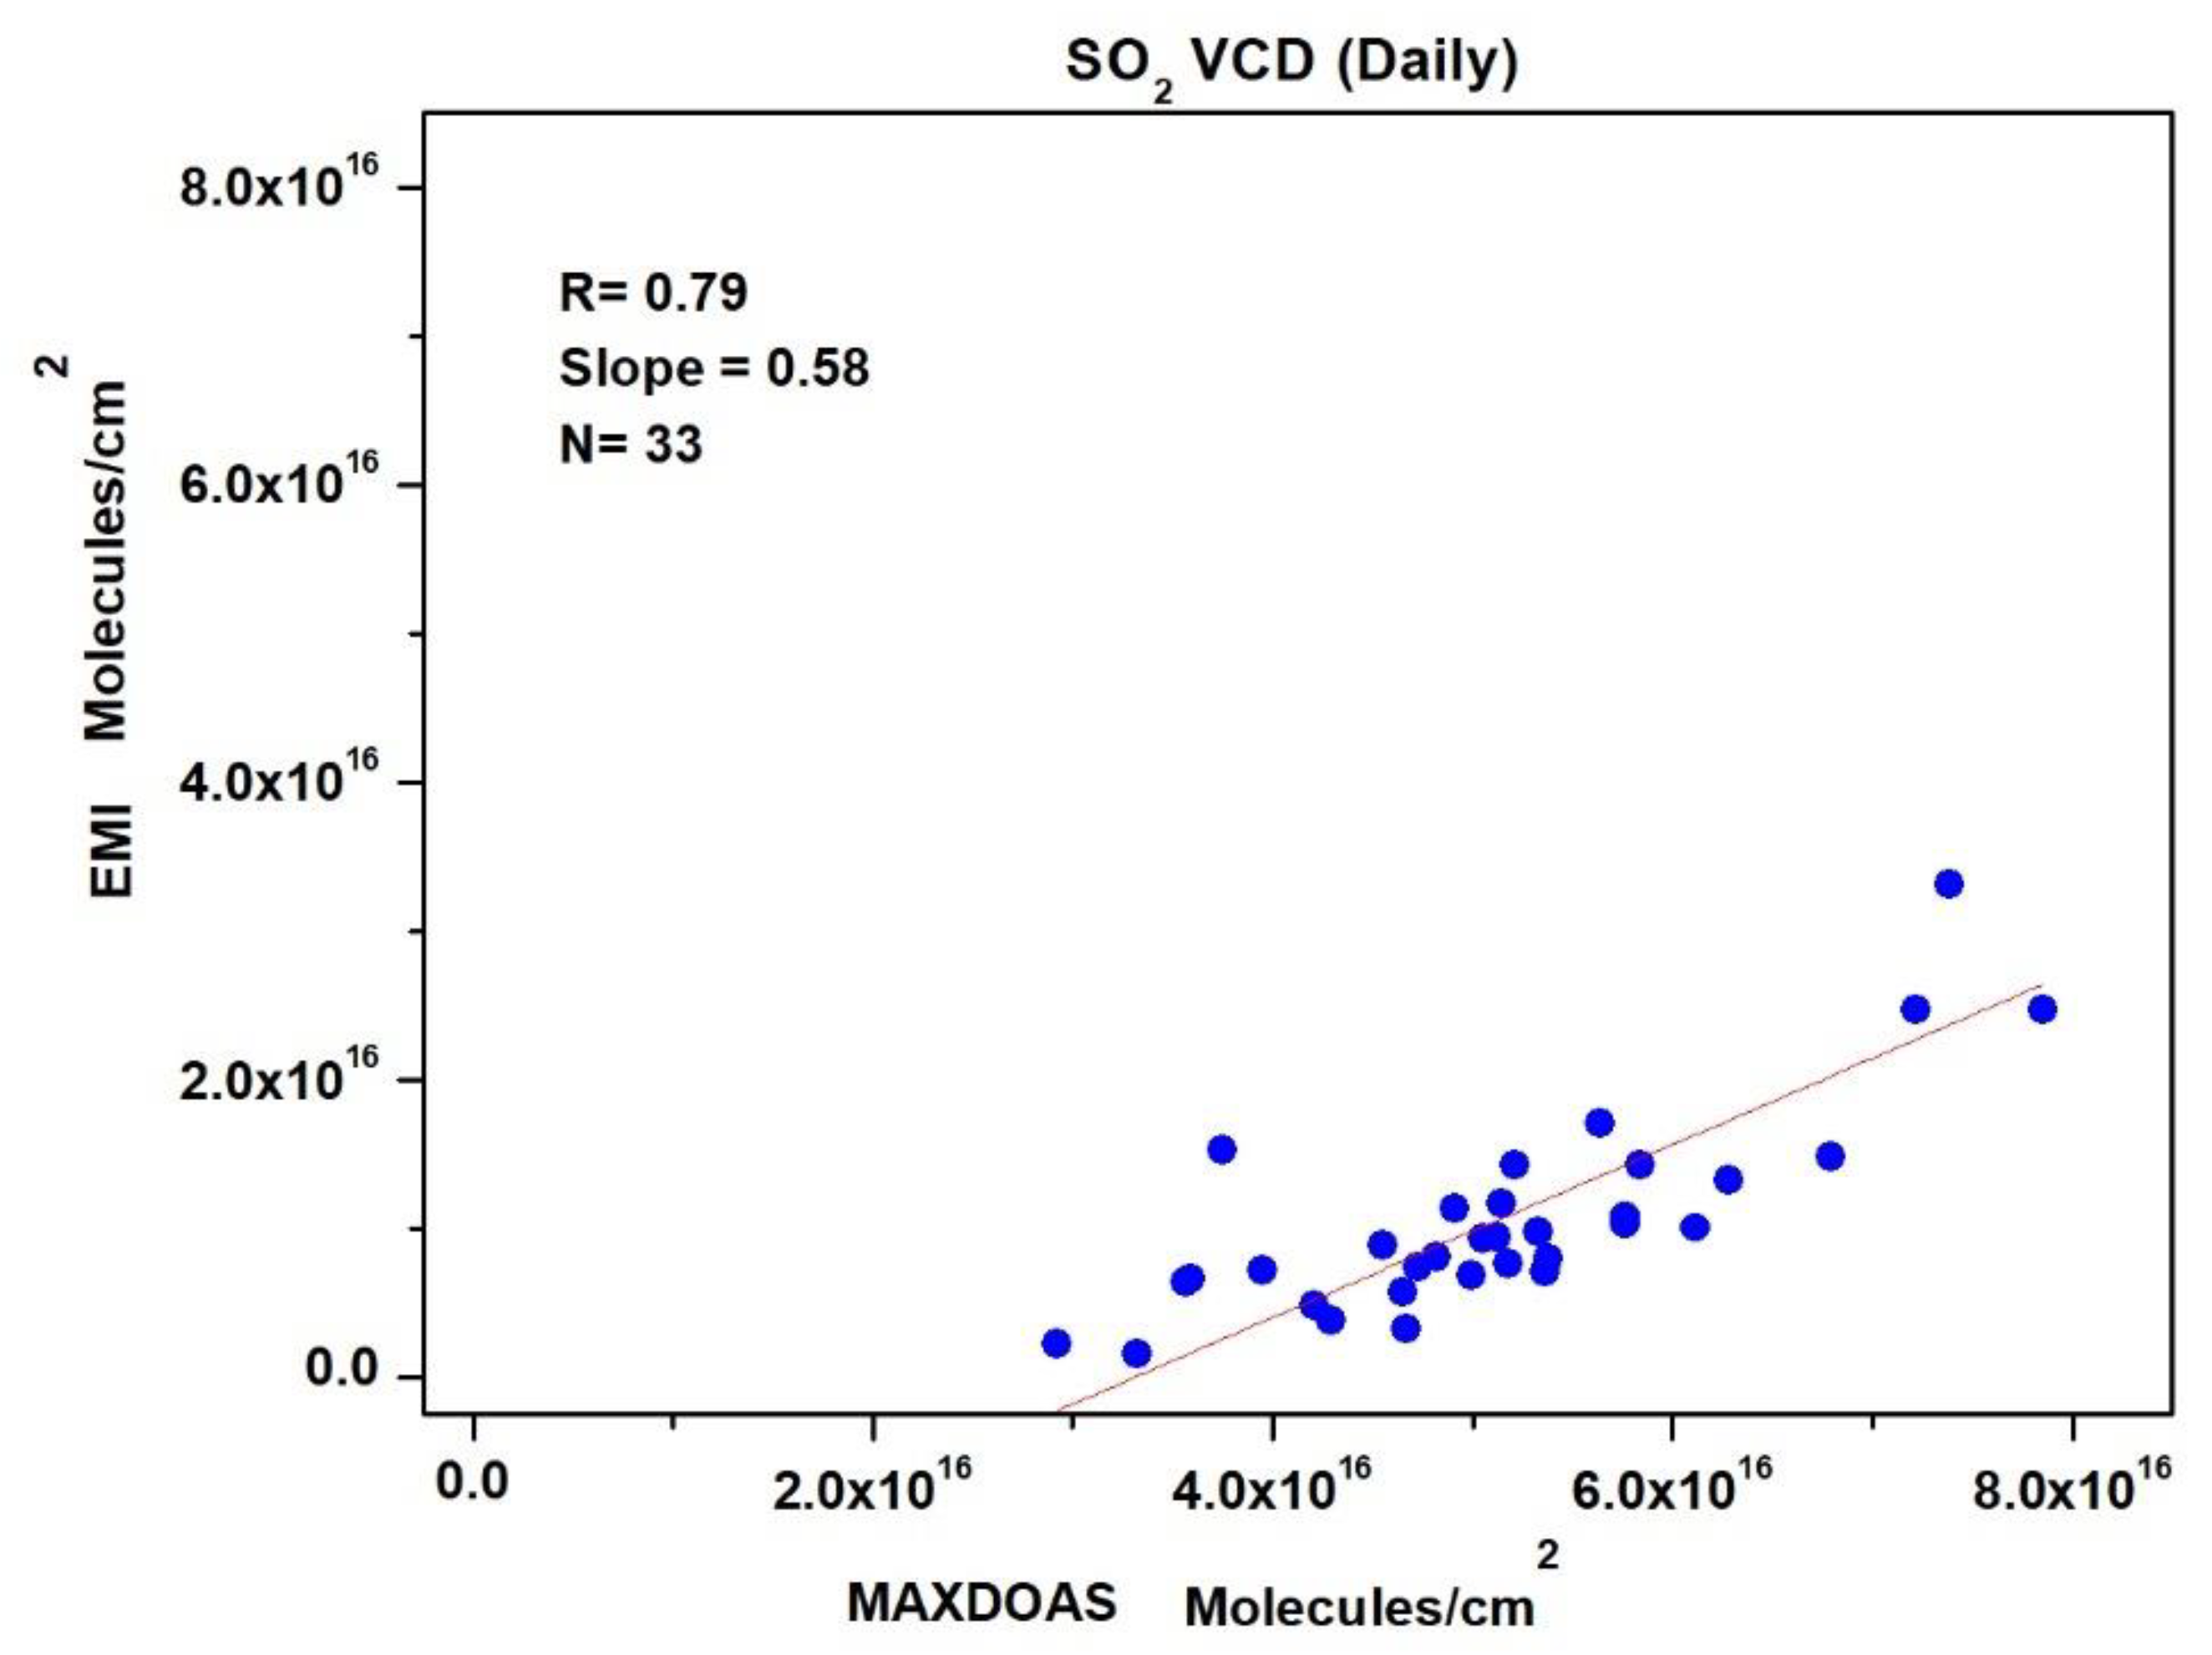
3.4.2. Comparison of SO2 Columns

The SO2 VCDs retrieved from MAX-DOAS are compared with observations from EMI over Nanjing. The SO2 VCDs retrieved from MAX-DOAS are temporally averaged during satellite overpass time 12:30 to 14:30 LST, while SO2 columns from the EMI satellite are spatially averaged around a sampling area of 20 km. Figure 12 shows the scatter plot between EMI SO2 VCDs and MAX-DOAS SO2 VCDs. The ground and satellite-based observations showed a moderate correlation (R = 0.79). However, SO2 VCDs measured from EMI are lower than the MAX-DOAS observations.
The slope and intercept are calculated from reduced major axis (RMA) regression, which includes errors in both variables. The slope of the regression line is 0.58.

4. Discussion

The wavelength interval during spectral fitting is usually optimized to maximize the sensitivity to trace gases, minimalize the residual of fitting and the scatter of trace gases retrieved, and lessen the interferences with other species. Theoretically, the absorption band for formaldehyde as measured by the MAX-DOAS UV spectrometer starts from as low as 300nm. However, fitting below 320nm is usually avoided owing to strong ozone absorption at a lower wavelength [15]. The highest UV absorption features for HCHO are encompassed at a fitting range of 336.5 to 359 nm, which is commonly used with the three highest UV HCHO absorption features [18,45]. The absorption structures of BrO interfere to some degree in this wavelength interval [46]. An additional absorption band has been reported in some studies where the absorption band is extended to 324.5 to 359 nm [35,36]. The results indicated that for HCHO, the fit error and RMS improved significantly at wavelength 324.5–359 nm compared to 336.5–359 nm for fog and haze conditions. The improvement in the DOAS fit error and accurate DSCDs at wavelength intervals for 324.5 to 359 nm can be attributed to the increased information content of the retrieval. To evade oscillations that might interfere with trace gas absorption structures, the polynomial used is usually less than or equal to five [31,46]. The best-fitting results at five degrees of the polynomial can be linked to the fact that the ring effect interferes with HCHO features at a degree of the polynomial that is less than five [46].
The retrieval of SO2 from MAX-DOAS is quite challenging as well, due to the number of factors. The absorption structures of O3 may interfere with SO2 due to similar absorption features between the 315–325 nm range [47]. While selecting the lower wavelength for optimal fitting of SO2 retrieval from MAX-DOAS, it must be considered that it must be small enough to include strong features of SO2 absorption and, at the same time, large enough to guarantee adequate solar signal while preventing substantial stray light effects. The upper wavelength should ensure multiple SO2 absorption structures while eliminating SO2 absorption features with a weak degree of freedom (DOF), which increases uncertainty in the fit. An exceedingly wide fit window is prone to uncertainty risks as it may include strong absorption features from other gases [48]. The best results for SO2 were obtained at 307–328 nm when compared to other wavelength regions because a very narrow fitting window may cause cross-correlation between reference absorption cross-sections [7].
Photochemistry plays a vital part in the sources and sinks of various gases in the atmosphere. HCHO shows a strong positive correlation between sunlight intensity and temperature [42]. Therefore, HCHO VCDs are lower in fog and haze conditions when compared to clear days, reflecting a decrease in the chemical production of HCHO from the photo-oxidation of VOCs on fog and haze days. The SO2 VCDs are also significantly lower on fog days than haze or clear days. It is most likely due to the heterogeneous oxidation of SO2 in fog droplets by H2O2 or O3 [49].
The results show an underestimation in the satellite retrievals against the ground-based MAX-DOAS data but with a good correlation coefficient. The SO2 retrieval from EMI has a few limitations that are due to low signal-to-noise ratio, instrumental instability, and spectral quality [30]. The SO2 retrieval is difficult because of its low concentration and fitting window that is close to the edge. Owing to the aforementioned reasons, the SO2 levels from EMI are underestimated. The underestimation in SO2 retrieved from EMI was also observed over India compared to the ground-based station data [30].
HCHO is mostly confined near to the ground’s surface because its residence time is very short [42]. TROPOMI measurements are less sensitive to HCHO in the lower troposphere, where its concentration is higher. This results in the overestimation of AMF and underestimation of HCHO VCDs. The underestimation in HCHO retrievals from the satellite data was also reported in several previously published studies [29,50].

5. Conclusions

The optimization of the retrieval parameters is the foremost challenge for the accurate retrieval of trace gases using the DOAS analysis. These retrieval parameters rely mainly on the composition of the atmosphere and meteorological conditions of measurements. Therefore, with frequent haze and fog days in the cold season in polluted regions of China, it had become increasingly important to come up with optimal retrieval settings for the trace gas retrievals during haze and fog days. Commonly reported retrieval settings for HCHO and SO2 were compared in this study to find out the optimal settings for haze and fog days over Nanjing. The results indicated that for HCHO, the fit error and RMS for column density are improved significantly at wavelength 324.5–359 nm compared to 336.5–359 nm for fog and haze conditions. The observed DSCDs for haze and fog days were mostly negative at 336.5–359 nm compared to the values at 324.5–359 nm. The effect of the polynomial order on RMS was also significant, giving the lowest RMS at the polynomial order of five. For SO2, the RMS and fit error for column density was higher at 305–317 nm, while the DSCDs were underestimated at this spectral window. At 307–328 nm, the RMS and fit error significantly improved for all conditions. The effect of a polynomial on the RMS was also significant being lowest at the polynomial order of five. Observed HCHO and SO2 vertical column densities were significantly lower in fog days when compared to clear days.

Author Contributions

Conceptualization, Z.J., Y.W. and C.L.; methodology, A.T., C.X. (Chengzhi Xing) and Z.J.; software, C.X. (Chengzhi Xing) and Z.J.; validation, Y.Z., O.S. and A.R.; formal analysis, Z.J. and A.T.; investigation, Z.J; resources, Y.W. and M.X.; data curation, W.S., Z.J. and A.T.; writing—original draft preparation, Z.J., A.T. and A.R.; writing—review and editing, M.B., C.X. (Congzi Xia), X.J. and C.L.; visualization, Y.W.; supervision, C.L. and Y.W.; project administration, M.X. and Y.W. All authors have read and agreed to the published version of the manuscript.

Funding

This work was supported by the National Natural Science Foundation of China (NSFC, 41701551, 41605117, 41771291). Y.W. was supported by the National Science Foundation.

Institutional Review Board Statement

Not applicable.

Informed Consent Statement

Not applicable.

Data Availability Statement

The data presented in this study are available on request from the corresponding author.

Acknowledgments

The authors would also like to thank the Nanjing University of Information Science and Technology (NUIST) Meteorological observation station for the provision of meteorology data.

Conflicts of Interest

The authors declare no conflict of interest.

References

  1. Almqvist, E. Remote sensing of gaseous air pollution. Ambio 1974, 3, 168–176. [Google Scholar]
  2. Platt, U.; Stutz, J. Differential Optical Absorption Spectroscopy. In Physics of Earth and Space Environments; Springer: Berlin/Heidelberg, Germany, 2008. [Google Scholar]
  3. Brewer, A.W.; McElroy, C.T.; Kerr, J.B. Nitrogen dioxide concentration in the atmosphere. Nature 1973, 246, 129–133. [Google Scholar] [CrossRef]
  4. Noxon, J.F. Nitrogen dioxide in the stratosphere and troposphere measured by ground-based absorption spectroscopy. Science 1975, 189, 547–549. [Google Scholar] [CrossRef]
  5. Perner, D.; Ehhalt, D.H.; Pätz, H.W.; Platt, U.; Röth, E.P.; Volz, A. OH–Radicals in the lower troposphere. Geophys. Res. Lett. 1976, 3, 466–468. [Google Scholar] [CrossRef]
  6. Platt, U.; Perner, D.; Pätz, H.W. Simultaneous measurement of atmospheric CH2O, O3, and NO2by differential optical absorption. J. Geophys. Res. Space Phys. 1979, 84, 6329–6335. [Google Scholar] [CrossRef]
  7. Vogel, L.; Sihler, H.; Lampel, J.; Wagner, T.; Platt, U. Retrieval interval mapping: A tool to visualize the impact of the spectral retrieval range on differential optical absorption spectroscopy evaluations. Atmos. Meas. Tech. 2013, 6, 275–299. [Google Scholar] [CrossRef] [Green Version]
  8. Guo, B.; Wang, Y.; Zhang, X.; Che, H.; Zhong, J.; Chu, Y.; Cheng, L. Temporal and spatial variations of haze and fog and the characteristics of PM2.5 during heavy pollution episodes in China from 2013 to 2018. Atmos. Pollut. Res. 2020, 11, 1847–1856. [Google Scholar] [CrossRef]
  9. Kang, N.; Kumar, K.R.; Yu, X.; Yin, Y. Column-integrated aerosol optical properties and direct radiative forcing over the urban-industrial megacity Nanjing in the Yangtze River Delta, China. Environ. Sci. Pollut. Res. 2016, 23, 17532–17552. [Google Scholar] [CrossRef] [PubMed]
  10. Yu, X.; Ma, J.; An, J.; Yuan, L.; Zhu, B.; Liu, D.; Wang, J.; Yang, Y.; Cui, H. Impacts of meteorological condition and aerosol chemical compositions on visibility impairment in Nanjing, China. J. Clean. Prod. 2016, 131, 112–120. [Google Scholar]
  11. Meng, Q.; Fan, S.; He, J.; Zhang, J.; Sun, Y.; Zhang, Y.; Zu, F. Particle size distribution and characteristics of polycyclic aromatic hydrocarbons during a heavy haze episode in Nanjing, China. Particuology 2015, 18, 127–134. [Google Scholar] [CrossRef]
  12. Kong, S.; Li, X.; Li, L.; Yin, Y.; Chen, K.; Yuan, L.; Zhang, Y.; Shan, Y.; Ji, Y. Variation of polycyclic aromatic hydrocarbons in atmospheric PM2.5 during winter haze period around 2014 Chinese Spring Festival at Nanjing: Insights of source changes, air mass direction and firework particle injection. Sci. Total. Environ. 2015, 520, 59–72. [Google Scholar] [CrossRef] [PubMed]
  13. Javed, Z.; Liu, C.; Ullah, K.; Tan, W.; Xing, C.; Liu, H. Investigating the Effect of Different Meteorological Conditions on MAX-DOAS Observations of NO2 and CHOCHO in Hefei, China. Atmosphere 2019, 10, 353. [Google Scholar] [CrossRef] [Green Version]
  14. Xing, C.; Liu, C.; Wang, S.; Hu, Q.; Liu, H.; Tan, W.; Zhang, W.; Li, B.; Liu, J. A new method to determine the aerosol optical properties from multiple-wavelength O4 absorptions by MAX-DOAS observation. Atmos. Meas. Tech. 2019, 12, 3289–3302. [Google Scholar] [CrossRef] [Green Version]
  15. Ryan, R.G.; Silver, J.D.; Querel, R.; Smale, D.; Rhodes, S.; Tully, M.; Jones, N.; Schofield, R. Comparison of formaldehyde tropospheric columns in Australia and New Zealand using MAX-DOAS, FTIR and TROPOMI. Atmos. Meas. Tech. 2020, 13, 6501–6519. [Google Scholar] [CrossRef]
  16. Chin, M.; Rood, R.; Lin, S.-J.; Müller, J.-F.; Thompson, A.M. Atmospheric sulfur cycle simulated in the global model GOCART: Model description and global properties. J. Geophys. Res. Space Phys. 2000, 105, 24671–24687. [Google Scholar] [CrossRef]
  17. Chiang, T.-Y.; Yuan, T.-H.; Shie, R.-H.; Chen, C.-F.; Chan, C.-C. Increased incidence of allergic rhinitis, bronchitis and asthma, in children living near a petrochemical complex with SO2pollution. Environ. Int. 2016, 96, 1–7. [Google Scholar] [CrossRef] [PubMed]
  18. aved, Z.; Wang, Y.; Xie, M.; Tanvir, A.; Rehman, A.; Ji, X.; Xing, C.; Shakoor, A.; Liu, C. Investigating the Impacts of the COVID-19 Lockdown on Trace Gases Using Ground-Based MAX-DOAS Observations in Nanjing, China. Remote Sens. 2020, 12, 3939. [Google Scholar]
  19. Danckaert, T.; Fayt, C.; Van Roozendael, M.; De Smedt, I.; Letocart, V.; Merlaud, A.; Pinardi, G. QDOAS Software User Manual; Belgian Institute for Space Aeronomy: Brussels, Belgium, 2013. [Google Scholar]
  20. Chance, K.; Kurucz, R. An improved high-resolution solar reference spectrum for earth’s atmosphere measurements in the ultraviolet, visible, and near infrared. J. Quant. Spectrosc. Radiat. Transf. 2010, 111, 1289–1295. [Google Scholar] [CrossRef]
  21. Meller, R.; Moortgat, G.K. Temperature dependence of the absorption cross sections of formaldehyde between 223 and 323 K in the wavelength range 225-375 nm. J. Geophys. Res. Space Phys. 2000, 105, 7089–7101. [Google Scholar] [CrossRef]
  22. Vandaele, A.C.; Hermans, C.; Simon, P.C.; Carleer, M.; Colin, R.; Fally, S.; Merienne, M.-F.; Jenouvrier, A.; Coquart, B. Measurements of the NO2 absorption cross-section from 42000 cm−1 to 10000 cm−1 (238–1000 nm) at 220 K and 294 K. J. Quant. Spectrosc. Radiat. Transf. 1998, 59, 171–184. [Google Scholar] [CrossRef] [Green Version]
  23. Serdyuchenko, A.; Gorshelev, V.; Weber, M.; Chehade, W.; Burrows, J.P. High spectral resolution ozone absorption cross-sections–Part 2: Temperature dependence. Atmos. Meas. Tech. 2014, 7, 625–636. [Google Scholar] [CrossRef] [Green Version]
  24. Thalman, R.; Volkamer, R. Temperature dependent absorption cross-sections of O2–O2 collision pairs between 340 and 630 nm and at atmospherically relevant pressure. Phys. Chem. Chem. Phys. 2013, 15, 15371–15381. [Google Scholar] [CrossRef] [PubMed]
  25. Fleischmann, O.C.; Hartmann, M.; Burrows, J.P.; Orphal, J. New ultraviolet absorption cross-sections of BrO at atmospheric temperatures measured by time-windowing Fourier transform spectroscopy. J. Photochem. Photobiol. A Chem. 2004, 168, 117–132. [Google Scholar] [CrossRef]
  26. Solomon, S.; Schmeltekopf, A.L.; Sanders, R.W. On the interpretation of zenith sky absorption measurements. J. Geophys. Res. Atmos. 1987, 92, 8311–8319. [Google Scholar] [CrossRef]
  27. Wagner, T.; Ibrahim, O.; Shaiganfar, R.; Platt, U. Mobile MAX-DOAS observations of tropospheric trace gases. Atmos. Meas. Tech. 2010, 3, 129–140. [Google Scholar] [CrossRef] [Green Version]
  28. Celarier, E.A.; Brinksma, E.J.; Gleason, J.F.; Veefkind, J.P.; Cede, A.; Herman, J.R.; Ionov, D.; Goutail, F.; Pommereau, J.-P.; Lambert, J.-C.; et al. Validation of Ozone Monitoring Instrument nitrogen dioxide columns. J. Geophys. Res. Space Phys. 2008, 113. [Google Scholar] [CrossRef] [Green Version]
  29. Su, W.; Liu, C.; Chan, K.L.; Hu, Q.; Liu, H.; Ji, X.; Zhu, Y.; Liu, T.; Zhang, C.; Chen, Y.; et al. An improved TROPOMI tropospheric HCHO retrieval over China. Atmos. Meas. Tech. 2020, 13, 6271–6292. [Google Scholar] [CrossRef]
  30. Xia, C.; Liu, C.; Cai, Z.; Zhao, F.; Su, W.; Zhang, C.; Liu, Y. First sulfur dioxide observations from the environmental trace gases monitoring instrument (EMI) onboard the GeoFen-5 satellite. Sci. Bull. 2021. [Google Scholar] [CrossRef]
  31. Javed, Z.; Liu, C.; Khokhar, M.F.; Xing, C.; Tan, W.; Subhani, M.A.; Rehman, A.; Tanvir, A. Investigating the impact of Glyoxal retrieval from MAX-DOAS observations during haze and non-haze conditions in Beijing. J. Environ. Sci. 2019, 80, 296–305. [Google Scholar] [CrossRef]
  32. Schreier, S.F.; Richter, A.; Peters, E.; Ostendorf, M.; Schmalwieser, A.W.; Weihs, P.; Burrows, J.P. Dual ground-based MAX-DOAS observations in Vienna, Austria: Evaluation of horizontal and temporal NO2, HCHO, and CHOCHO distributions and comparison with independent data sets. Atmos. Environ. X 2020, 5, 100059. [Google Scholar] [CrossRef]
  33. Kreher, K.; Van Roozendael, M.; Hendrick, F.; Apituley, A.; Dimitropoulou, E.; Frieß, U.; Richter, A.; Wagner, T.; Lampel, J.; Abuhassan, N.; et al. Intercomparison of NO2, O4, O3 and HCHO slant column measurements by MAX-DOAS and zenith-sky UV–visible spectrometers during CINDI-2. Atmos. Meas. Tech. 2020, 13, 2169–2208. [Google Scholar] [CrossRef]
  34. Luo, Y.; Dou, K.; Fan, G.; Huang, S.; Si, F.; Zhou, H.; Wang, Y.; Pei, C.; Tang, F.; Yang, D.; et al. Vertical distributions of tropospheric formaldehyde, nitrogen dioxide, ozone and aerosol in southern China by ground-based MAX-DOAS and LIDAR measurements during PRIDE-GBA 2018 campaign. Atmos. Environ. 2020, 226, 117384. [Google Scholar] [CrossRef]
  35. Chan, K.L.; Wang, Z.; Ding, A.; Heue, K.-P.; Shen, Y.; Wang, J.; Zhang, F.; Shi, Y.; Hao, N.; Wenig, M. MAX-DOAS measurements of tropospheric NO2 and HCHO in Nanjing and a comparison to ozone monitoring instrument observations. Atmos. Chem. Phys. Discuss. 2019, 19, 10051–10071. [Google Scholar] [CrossRef] [Green Version]
  36. Chan, K.L.; Wiegner, M.; van Geffen, J.; De Smedt, I.; Alberti, C.; Cheng, Z.; Ye, S.; Wenig, M. MAX-DOAS measurements of tropospheric NO2 and HCHO in Munich and the comparison to OMI and TROPOMI satellite observations. Atmos. Meas. Tech. 2020, 13, 4499–4520. [Google Scholar] [CrossRef]
  37. Tan, W.; Liu, C.; Wang, S.; Xing, C.; Su, W.; Zhang, C.; Xia, C.; Liu, H.; Cai, Z.; Liu, J. Tropospheric NO2, SO2, and HCHO over the East China Sea, using ship-based MAX-DOAS observations and comparison with OMI and OMPS satellite data. Atmos. Chem. Phys. Discuss. 2018, 18, 15387–15402. [Google Scholar] [CrossRef] [Green Version]
  38. Tian, X.; Xie, P.; Xu, J.; Li, A.; Wang, Y.; Qin, M.; Hu, Z. Long-term observations of tropospheric NO2, SO2 and HCHO by MAX-DOAS in Yangtze River Delta area, China. J. Environ. Sci. 2018, 71, 207–221. [Google Scholar] [CrossRef]
  39. Wang, T.; Hendrick, F.; Wang, P.; Tang, G.; Clémer, K.; Yu, H.; Fayt, C.; Hermans, C.; Gielen, C.; Muller, J.-F.; et al. Evaluation of tropospheric SO2 retrieved from MAX-DOAS measurements in Xianghe, China. Atmos. Chem. Phys. Discuss. 2014, 14, 11149–11164. [Google Scholar] [CrossRef] [Green Version]
  40. Schreier, S.; Peters, E.; Richter, A.; Lampel, J.; Wittrock, F.; Burrows, J. Ship-based MAX-DOAS measurements of tropospheric NO2 and SO2 in the South China and Sulu Sea. Atmos. Environ. 2015, 102, 331–343. [Google Scholar] [CrossRef]
  41. Tan, W.; Liu, C.; Wang, S.; Liu, H.; Zhu, Y.; Su, W.; Hu, Q.; Liu, J. Long-distance mobile MAX-DOAS observations of NO2 and SO2 over the North China Plain and identification of regional transport and power plant emissions. Atmos. Res. 2020, 245, 105037. [Google Scholar] [CrossRef]
  42. Javed, Z.; Liu, C.; Khokhar, M.F.; Tan, W.; Liu, H.; Xing, C.; Ji, X.; Tanvir, A.; Hong, Q.; Sandhu, O.; et al. Ground-Based MAX-DOAS Observations of CHOCHO and HCHO in Beijing and Baoding, China. Remote Sens. 2019, 11, 1524. [Google Scholar] [CrossRef] [Green Version]
  43. Guo, Z.; Guo, Q.; Chen, S.; Zhu, B.; Zhang, Y.; Yu, J.; Guo, Z. Study on pollution behavior and sulfate formation during the typical haze event in Nanjing with water soluble inorganic ions and sulfur isotopes. Atmos. Res. 2019, 217, 198–207. [Google Scholar] [CrossRef]
  44. Bilal, M.; Nazeer, M.; Nichol, J.E.; Bleiweiss, M.P.; Qiu, Z.; Jäkel, E.; Campbell, J.R.; Atique, L.; Huang, X.; Lolli, S. A Simplified and robust surface reflectance estimation method (SREM) for use over diverse land surfaces using multi-sensor data. Remote Sens. 2019, 11, 1344. [Google Scholar] [CrossRef] [Green Version]
  45. Tanvir, A.; Javed, Z.; Jian, Z.; Zhang, S.; Bilal, M.; Xue, R.; Wang, S.; Bin, Z. Ground-based MAX-DOAS observations of tropospheric NO2 and HCHO during COVID-19 lockdown and spring festival over Shanghai, China. Remote Sens. 2021, 13, 488. [Google Scholar] [CrossRef]
  46. Pinardi, G.; Van Roozendael, M.; Abuhassan, N.; Adams, C.; Cede, A.; Clémer, K.; Fayt, C.; Frieß, U.; Gil, M.; Herman, J.; et al. MAX-DOAS formaldehyde slant column measurements during CINDI: Intercomparison and analysis improvement. Atmos. Meas. Tech. 2012, 6, 167–185. [Google Scholar] [CrossRef] [Green Version]
  47. Rix, M.; Valks, P.; Hao, N.; Loyola, D.; Schlager, H.; Huntrieser, H.; Flemming, J.; Koehler, U.; Schumann, U.; Inness, A. Volcanic SO2, BrO and plume height estimations using GOME-2 satellite measurements during the eruption of Eyjafjallajökull in May 2010. J. Geophys. Res. Atmos. 2012, 117. [Google Scholar] [CrossRef] [Green Version]
  48. Davis, Z.Y.; McLaren, R. Recommendations for spectral fitting of SO2 from MAX-DOAS measurements. Atmos. Meas. Tech. Discuss. 2020, 1–23. [Google Scholar] [CrossRef]
  49. Luo, C.; Wang, Y.; Mueller, S.; Knipping, E. Diagnosis of an underestimation of summertime sulfate using the Community Multiscale Air Quality model. Atmos. Environ. 2011, 45, 5119–5130. [Google Scholar] [CrossRef]
  50. Vigouroux, C.; Langerock, B.; Bauer Aquino, C.A.; Blumenstock, T.; Cheng, Z.; De Mazière, M.; De Smedt, I.; Grutter, M.; Hannigan, J.W.; Jones, N.; et al. TROPOMI–Sentinel-5 Precursor formaldehyde validation using an extensive network of ground-based Fourier-transform infrared stations. Atmos. Meas. Tech. 2020, 13, 3751–3767. [Google Scholar] [CrossRef]
Figure 1. The observation site at Nanjing University of Information Science and Technology, Pukou, Nanjing, China.
Remotesensing 13 02244 g001
Figure 2. Time series for relative humidity (RH%), visibility, and PM2.5.
Remotesensing 13 02244 g002
Figure 3. HCHO DOAS fit for fitting window (a) 324.5–359 nm and (b) 336.5–359 nm at 2° elevation angle. The red lines represent the fitted optical density, while measured densities are shown by the black lines.
Remotesensing 13 02244 g003
Figure 4. Intercomparison of different retrieval settings by parameters like DOAS fit error, RMS, and HCHO DSCDs for a (a) clear day (17 February 2020), (b) hazy day (31 January 2020), and (c) foggy day (13 February 2020).
Remotesensing 13 02244 g004aRemotesensing 13 02244 g004b
Figure 5. Effect of polynomial order on mean RMS of HCHO measured under different meteorological conditions.
Remotesensing 13 02244 g005
Figure 6. SO2 DOAS Fit for fitting windows (a) 312–326, (b) 307–328, and (c) 305–317 nm at 2° elevation angle. The red lines represent the fitted optical density, while measured densities are shown by black lines.
Remotesensing 13 02244 g006
Figure 7. Intercomparison of different retrieval settings by parameters such as DOAS fit error, RMS, and SO2 DSCDs on a (a) clear day (17 February 2020), (b) hazy day (31 January 2020), and (c) foggy day (13 February 2020).
Remotesensing 13 02244 g007
Figure 8. Effect of polynomial order on the mean RMS of SO2 measured under different meteorological conditions.
Remotesensing 13 02244 g008
Figure 9. Boxplot for HCHO VCDs during different conditions.
Remotesensing 13 02244 g009
Figure 10. Boxplot for SO2 VCDs during different conditions.
Remotesensing 13 02244 g010
Figure 11. Scatter plot between MAX-DOAS and TROPOMI HCHO VCDs.
Remotesensing 13 02244 g011
Figure 12. Scatter plot between MAX-DOAS and EMI SO2 VCDs.
Remotesensing 13 02244 g012
Table 1. Retrieval Settings for the spectral analysis of HCHO and SO2 using DOAS.
ParametersData SourceTrace Gases
SO2HCHO
HCHO297 K, [21]
NO2220 K, [22]
SO2298 K, [22]X
O3243 K, [23]
O3223 K, [23]
O4293 K, [24]X
BrO223 K, [25]
RingCalculated with QDOAS
Polynomial degree 55
Table 2. Statistics of meteorological parameters in different conditions.
Meteorological ConditionVisibilityPM 2.5Relative Humidity
Clear days>10 km<40 µg/m3<80%
Haze days>5 km and <10 km>40 µg/m3<80%
Fog days<5 km>40 µg/m3>80%
Table 3. Mean RMS and mean fit error at different fitting windows during different meteorological conditions.
Fitting WindowClear DaysFoggy DaysHaze Days
Mean RMSMean Fit ErrorMean RMSMean Fit ErrorMean RMSMean Fit Error
336.5–359 nm0.00053.87 × 10150.000725.93 × 10150.000635.27 × 1015
324.5–359 nm0.000491.70 × 10150.000702.73 × 10150.000612.12 × 1015
Table 4. Mean RMS and mean fit error at different fitting windows during different meteorological conditions.
Fitting WindowClear DaysFoggy DaysHaze Days
Mean RMSMean Fit ErrorMean RMSMean Fit ErrorMean RMSMean Fit Error
305–317 nm0.00193.93 × 10150.00428.93 × 10150.00265.59 × 1015
307–328 nm0.00081.77 × 10150.00133.87 × 10150.00092.27 × 1015
312–326 nm0.00102.36 × 10150.00207.34 × 10150.00114.51 × 1015
Publisher’s Note: MDPI stays neutral with regard to jurisdictional claims in published maps and institutional affiliations.

