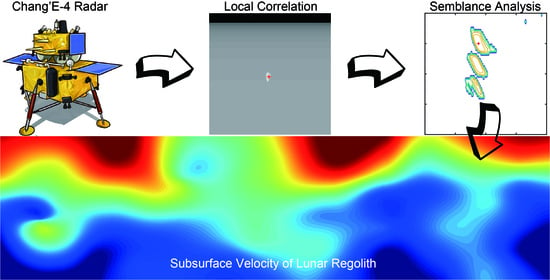
Rock Location and Property Analysis of Lunar Regolith at Chang’E-4 Landing Site Based on Local Correlation and Semblance Analysis


Abstract
:
1. Introduction
2. Materials and Methods
2.1. LPR Data Processing
2.2. Local Correlation
2.3. Semblance Analysis
2.4. Property Calculation
3. Results
3.1. Simulation Data Results
3.2. LPR Data Results
4. Discussion
5. Conclusions
Author Contributions
Funding
Acknowledgments
Conflicts of Interest
References
- McKay, D.S.; Heiken, G.; Basu, A.; Blanford, G.; Simon, S.; Reedy, R.; French, B.M.; Papike, J. The lunar regolith. In Lunar Source-Book: A User’s Guide to the Moon; Heiken, G., Ed.; Cambridge University Press: New York, NY, USA, 1991; Volume 7, pp. 285–357. [Google Scholar]
- Nakamura, Y.; Latham, G.V.; Dorman, H.J. Apollo Lunar Seismic Experiment—Final summary. J. Geophys. Res. Space Phys. 1982, 87, A117–A123. [Google Scholar] [CrossRef]
- Fa, W.; Jin, Y. A primary analysis of microwave brightness temperature of lunar surface from Chang-E 1 multi-channel radiometer observation and inversion of regolith layer thickness. Icarus 2010, 207, 605–615. [Google Scholar] [CrossRef]
- Neish, C.D.; Barnes, J.W.; Sotin, C.; MacKenzie, S.; Soderblom, J.M.; Le Mouélic, S.; Kirk, R.L.; Stiles, B.W.; Malaska, M.J.; Le Gall, A.; et al. Spectral properties of titan’s impact craters imply chemical weathering of its surface. Geophys. Res. Lett. 2015, 42, 3746–3754. [Google Scholar] [CrossRef] [PubMed] [Green Version]
- Porcello, L.; Jordan, R.; Zelenka, J.; Adams, G.; Phillips, R.; Brown, W.; Ward, S.; Jackson, P. The Apollo lunar sounder radar system. Proc. IEEE 1974, 62, 769–783. [Google Scholar] [CrossRef]
- Ono, T.; Kumamoto, A.; Kasahara, Y.; Yamaguchi, Y.; Yamaji, A.; Kobayashi, T.; Oshigami, S.; Nakagawa, H.; Goto, Y.; Hashimoto, K.; et al. The Lunar Radar Sounder (LRS) Onboard the KAGUYA (SELENE) Spacecraft. Space Sci. Rev. 2010, 154, 145–192. [Google Scholar] [CrossRef]
- Xiao, L.; Zhu, P.; Fang, G.; Xiao, Z.; Zou, Y.; Zhao, J.; Zhao, N.; Yuan, Y.; Qiao, L.; Zhang, X.; et al. A young multilayered terrane of the northern Mare Imbrium revealed by Chang’E-3 mission. Science 2015, 347, 1226–1229. [Google Scholar] [CrossRef]
- Zhang, J.; Yang, W.; Hu, S.; Lin, Y.; Fang, G.; Li, C.; Peng, W.; Zhu, S.; He, Z.; Zhou, B.; et al. Volcanic history of the Imbrium basin: A close-up view from the lunar rover Yutu. Proc. Natl. Acad. Sci. USA 2015, 112, 5342–5347. [Google Scholar] [CrossRef] [Green Version]
- Li, C.; Su, Y.; Pettinelli, E.; Xing, S.; Ding, C.; Liu, J.; Ren, X.; Lauro, S.E.; Soldovieri, F.; Zeng, X.; et al. The Moon’s farside shallow subsurface structure unveiled by Chang’E-4 Lunar Penetrating Radar. Sci. Adv. 2020, 6, eaay6898. [Google Scholar] [CrossRef] [Green Version]
- Zhang, J.; Zhou, B.; Lin, Y.; Zhu, M.; Song, H.; Dong, Z.; Gao, Y.; Di, K.; Yang, W.; Lin, H.; et al. Lunar regolith and substructure at Chang’E-4 landing site in South Pole-Aitken basin. Nat. Astron. 2020, 1–6. [Google Scholar] [CrossRef]
- Fang, G.; Zhou, B.; Ji, Y.; Zhang, Q.; Shen, S.; Li, Y.; Guan, H.; Tang, C.; Gao, Y.; Lu, W.; et al. Lunar Penetrating Radar onboard the Chang’e-3 mission. Res. Astron. Astrophys. 2014, 14, 1607–1622. [Google Scholar] [CrossRef]
- Feng, J.; Su, Y.; Ding, C.; Xing, S.; Dai, S.; Zou, Y. Dielectric properties estimation of the lunar regolith at CE-3 landing site using lunar penetrating radar data. Icarus 2017, 284, 424–430. [Google Scholar] [CrossRef]
- Dong, Z.; Fang, G.; Ji, Y.; Gao, Y.; Wu, C.; Zhang, X. Parameters and structure of lunar regolith in Chang’E-3 landing area from lunar penetrating radar (LPR) data. Icarus 2017, 282, 40–46. [Google Scholar] [CrossRef]
- Lai, J.; Xu, Y.; Zhang, X.; Tang, Z. Structural analysis of lunar subsurface with Chang׳E-3 lunar penetrating radar. Planet. Space Sci. 2016, 120, 96–102. [Google Scholar] [CrossRef]
- Hu, B.; Wang, D.; Zhang, L.; Zeng, Z. Rock Location and Quantitative Analysis of Regolith at the Chang’e 3 Landing Site Based on Local Similarity Constraint. Remote Sens. 2019, 11, 530. [Google Scholar] [CrossRef] [Green Version]
- Dong, Z.; Feng, X.; Zhou, H.; Liu, C.; Zeng, Z.; Li, J.; Liang, W. Properties Analysis of Lunar Regolith at Chang’E-4 Landing Site Based on 3D Velocity Spectrum of Lunar Penetrating Radar. Remote Sens. 2020, 12, 629. [Google Scholar] [CrossRef] [Green Version]
- Zhang, L.; Zeng, Z.; Li, J.; Huo, Z.; Wang, K.; Zhang, J.; Huang, L. Parameter Estimation of Lunar Regolith from Lunar Penetrating Radar Data. Sensors 2018, 18, 2907. [Google Scholar] [CrossRef] [Green Version]
- Fomel, S. Local seismic attributes. Geophysics 2007, 72, 29–33. [Google Scholar] [CrossRef]
- Liu, G.; Fomel, S.; Jin, L.; Chen, X. Stacking seismic data using local correlation. Geophysics 2009, 74, V43–V48. [Google Scholar] [CrossRef]
- Fisher, E.; McMechan, G.A.; Annan, A.P. Acquisition and processing of wide-aperture ground-penetrating radar data. Geophysics 1992, 57, 495–504. [Google Scholar] [CrossRef]
- Su, Y.; Fang, G.; Feng, J.; Xing, S.; Ji, Y.; Zhou, B.; Gao, Y.; Li, H.; Dai, S.; Xiao, Y.; et al. Data processing and initial results of Chang’e-3 lunar penetrating radar. Res. Astron. Astrophys. 2014, 14, 1623–1632. [Google Scholar] [CrossRef]
- Lin, H.; Lin, Y.; Yang, W.; He, Z.; Hu, S.; Wei, Y.; Xu, R.; Zhang, J.; Liu, X.; Yang, J.; et al. New Insight Into Lunar Regolith-Forming Processes by the Lunar Rover Yutu-2. Geophys. Res. Lett. 2020, 47, e2020GL087949. [Google Scholar] [CrossRef]
- Angelopoulos, M.; Redman, D.; Pollard, W.H.; Haltigin, T.W.; Dietrich, P. Lunar ground penetrating radar: Minimizing po-tential data artifacts caused by signal interaction with a rover body. Adv. Space Res. 2014, 54, 2059–2072. [Google Scholar] [CrossRef]
- Lv, W.; Li, C.; Song, H.; Zhang, J.; Lin, Y. Comparative analysis of reflection characteristics of lunar penetrating radar data using nu-merical simulations. Icarus 2020, 350, 113896. [Google Scholar] [CrossRef]
- Ristic, A.V.; Petrovački, D.; Govedarica, M. A new method to simultaneously estimate the radius of a cylindrical object and the wave propagation velocity from GPR data. Comput. Geosci. 2009, 35, 1620–1630. [Google Scholar] [CrossRef]
- Dix, C.H. Seismic velocities from surface measurements. Geophysics 1955, 20, 68–86. [Google Scholar] [CrossRef]
- Neidell, N.S.; Taner, M.T. Sembalnce and other coherency measures for multichannel data. Geophysics 1971, 34, 859–891. [Google Scholar] [CrossRef]
- Carrier, W.D.; Olhoeft, G.R.; Mendell, W. Physical properties of the lunar surface. In Lunar Source-Book: A User’s Guide to the Moon; Heiken, G., Ed.; Cambridge University Press: New York, NY, USA, 1991; Volume 9, pp. 475–594. [Google Scholar]
- Irving, J.; Knight, R. Numerical modeling of ground-penetrating radar in 2-D using MATLAB. Comput. Geosci. 2006, 32, 1247–1258. [Google Scholar] [CrossRef]
- Ebrahimi, S.; Kahoo, A.R.; Chen, Y.; Porsani, M. A high-resolution weighted AB semblance for dealing with ampli-tude-variation-with-offset phenomenon. Geophysics 2017, 82, V85–V93. [Google Scholar] [CrossRef]
- Sun, H.; Gao, C.; Zhang, Z.; Liao, X.; Wang, X.; Yang, J. High-Resolution Anisotropic Prestack Kirchhoff Dynamic Focused Beam Migration. IEEE Sens. J. 2019, 20, 11753–11760. [Google Scholar] [CrossRef]
- Pei, Z.; Liu, J.; Wang, Q.; Kang, Y.; Zou, Y.; Zhang, H.; Zhang, Y.; He, H.; Wang, Q.; Yang, R. Overview of lunar exploration and International Lunar Research Station. Chin. Sci. Bull. 2020, 65, 2577–2586. (In Chinese) [Google Scholar] [CrossRef]


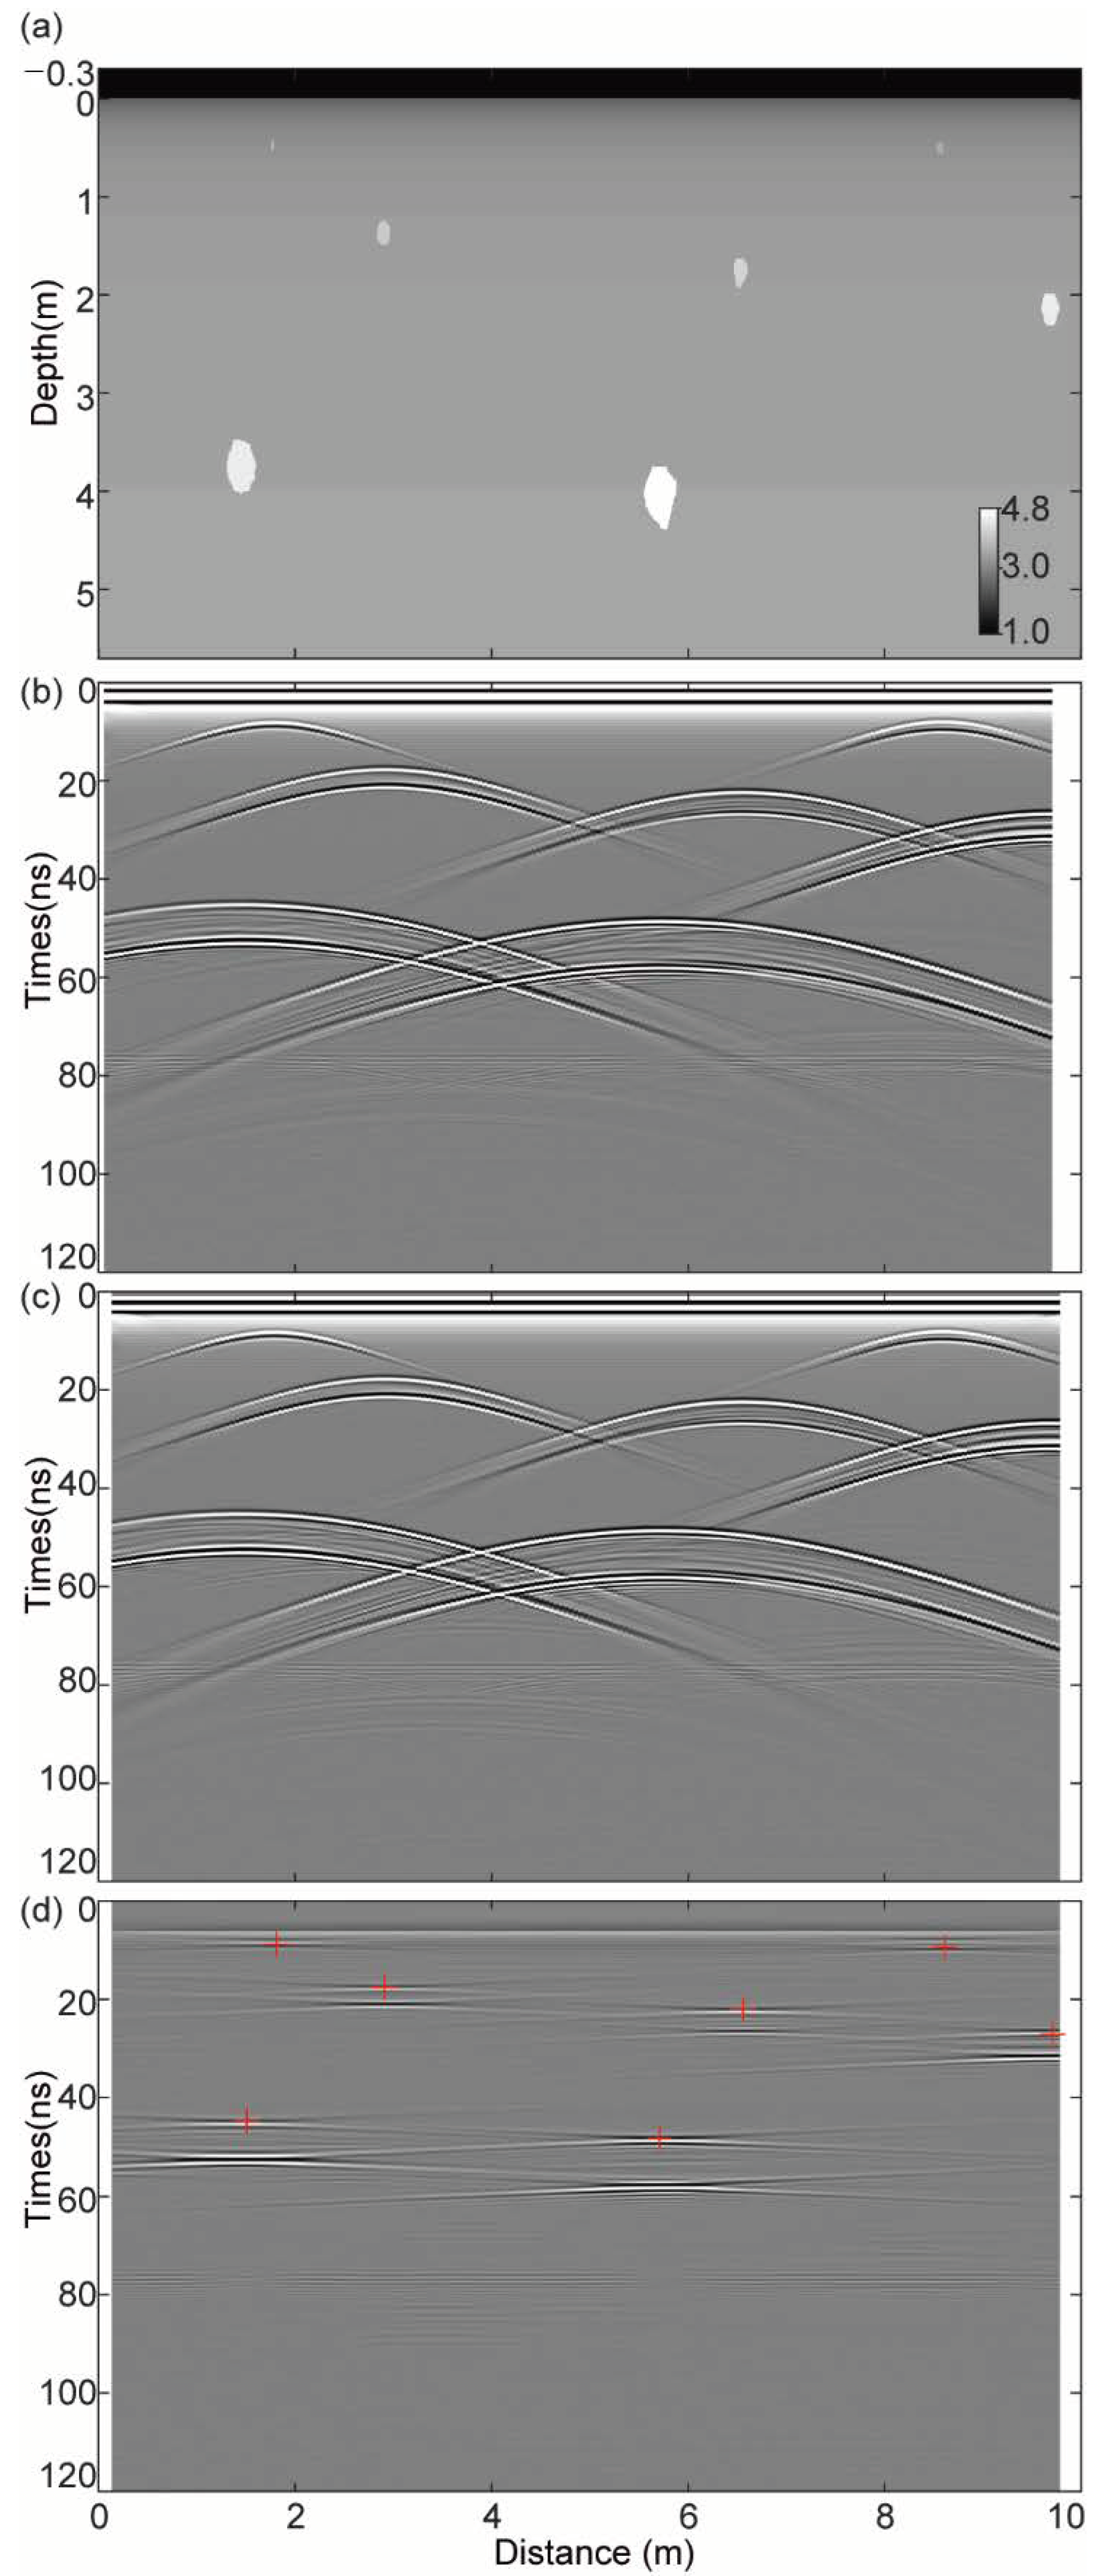
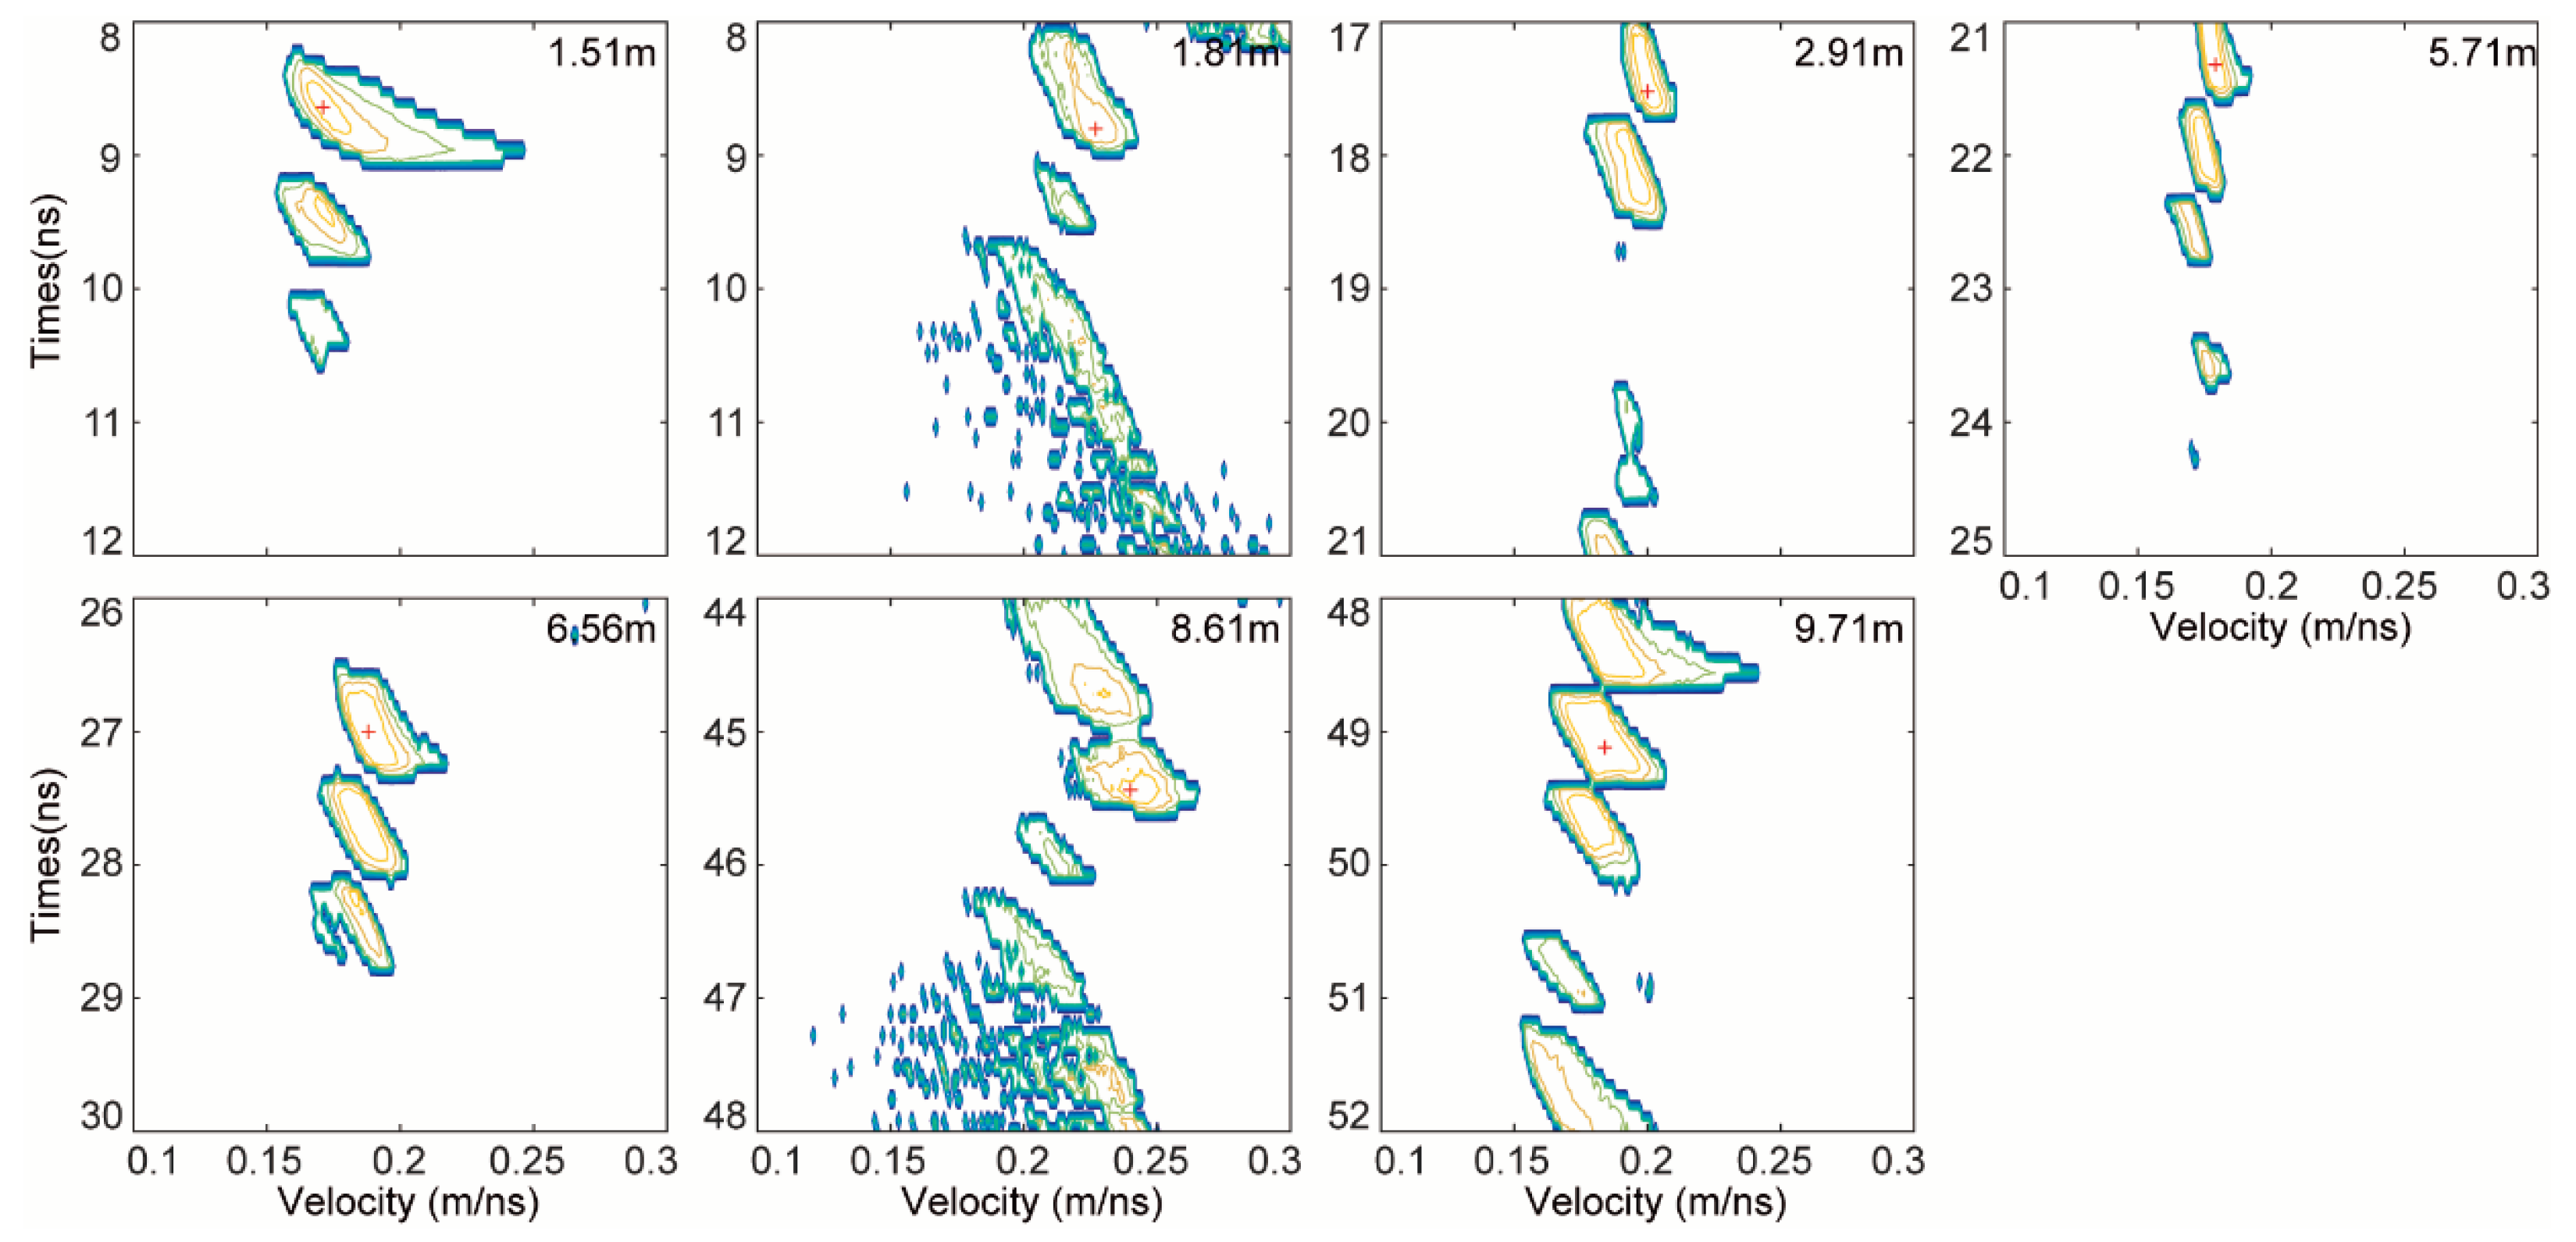
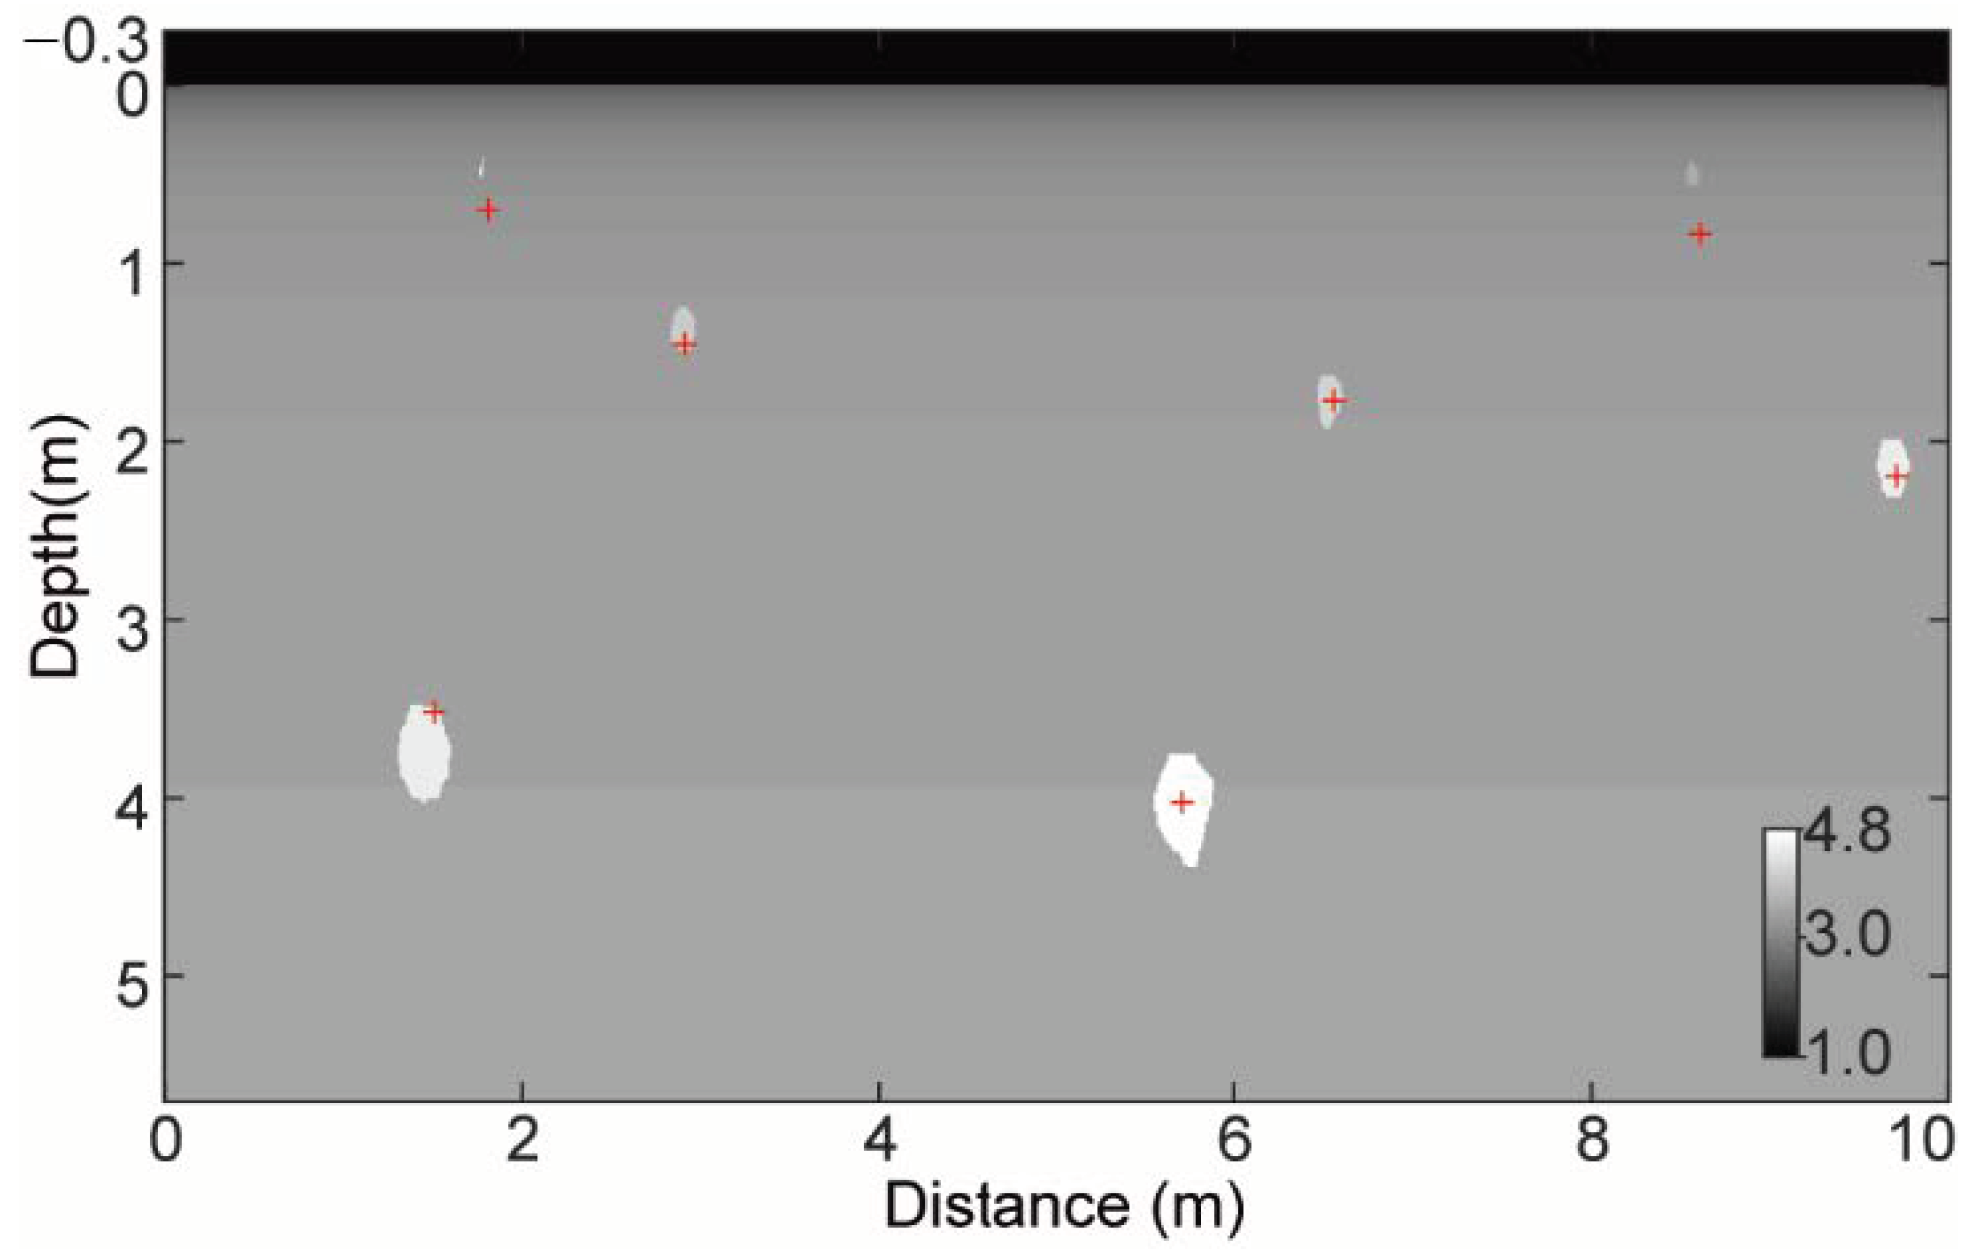
| Rocks | Distance (m) | Relative Permittivity | Time (ns) | Stacking Velocity (m/ns) | Depth (m) |
|---|---|---|---|---|---|
| 1 | 1.51 | 4.5 | 44.64 | 0.171 | 3.517 |
| 2 | 1.81 | 3.5 | 8.80 | 0.227 | 0.699 |
| 3 | 2.91 | 4.0 | 17.52 | 0.200 | 1.452 |
| 4 | 5.71 | 4.1 | 48.32 | 0.179 | 4.025 |
| 5 | 6.56 | 4.5 | 22.00 | 0.188 | 1.768 |
| 6 | 8.61 | 4.5 | 9.44 | 0.240 | 0.833 |
| 7 | 9.71 | 4.8 | 27.12 | 0.184 | 2.195 |
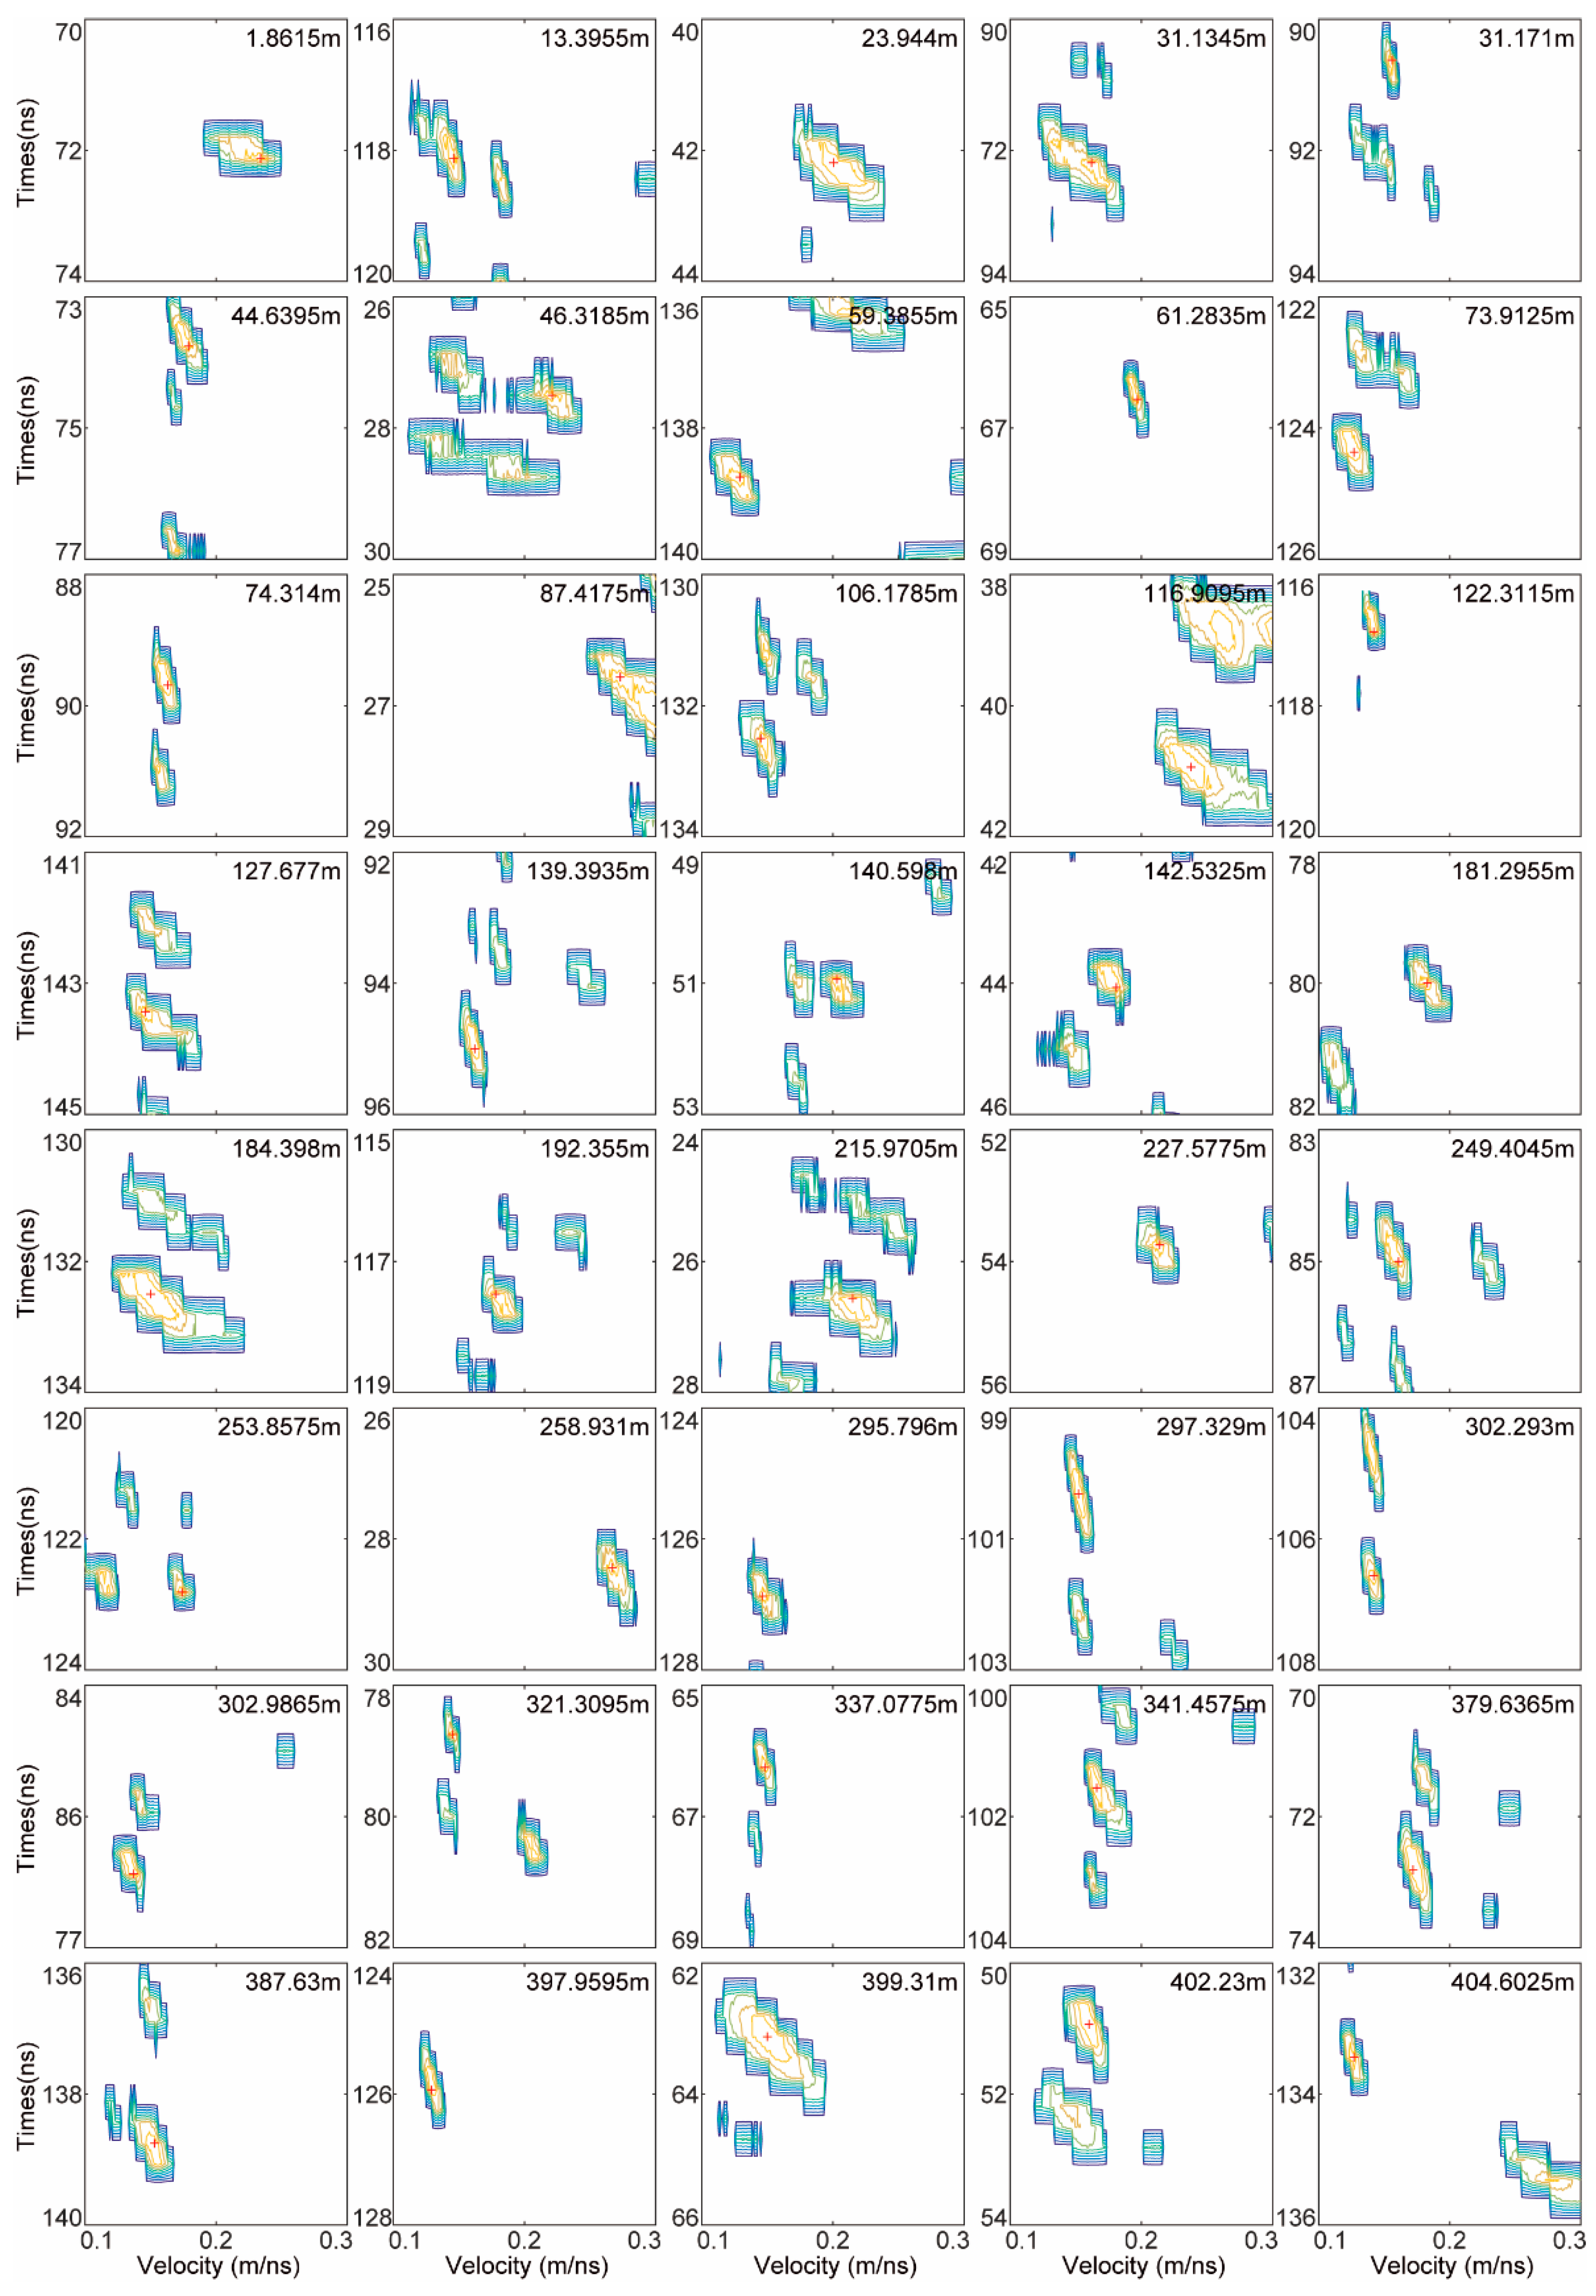
| Rocks | Distance(m) | Time(ns) | Stacking Velocity(m/ns) | Depth(m) |
|---|---|---|---|---|
| 1 | 1.8615 | 38.1250 | 0.234 | 4.461 |
| 2 | 13.3955 | 118.1250 | 0.146 | 8.623 |
| 3 | 23.9440 | 42.8125 | 0.206 | 4.410 |
| 4 | 31.1345 | 92.5000 | 0.180 | 8.325 |
| 5 | 31.1710 | 90.6250 | 0.156 | 7.069 |
| 6 | 44.6395 | 73.7500 | 0.179 | 6.601 |
| 7 | 46.3185 | 27.5000 | 0.221 | 3.039 |
| 8 | 59.3855 | 138.7500 | 0.129 | 8.949 |
| 9 | 61.2835 | 66.5625 | 0.197 | 6.556 |
| 10 | 73.9125 | 124.375 | 0.127 | 7.898 |
| 11 | 74.3140 | 89.6875 | 0.163 | 7.310 |
| 12 | 87.4175 | 26.5625 | 0.273 | 3.626 |
| 13 | 106.1785 | 142.5000 | 0.145 | 10.331 |
| 14 | 116.9095 | 40.9375 | 0.238 | 4.872 |
| 15 | 122.3115 | 116.875 | 0.142 | 8.298 |
| 16 | 127.6770 | 143.4375 | 0.146 | 10.471 |
| 17 | 139.3935 | 95.0000 | 0.162 | 7.695 |
| 18 | 140.5980 | 50.9375 | 0.203 | 5.170 |
| 19 | 142.5325 | 44.0625 | 0.181 | 3.988 |
| 20 | 181.2955 | 80.0000 | 0.183 | 7.320 |
| 21 | 184.3980 | 132.5000 | 0.150 | 9.938 |
| 22 | 192.355 | 117.5000 | 0.178 | 10.458 |
| 23 | 215.9705 | 26.5625 | 0.215 | 2.855 |
| 24 | 227.5775 | 53.7500 | 0.214 | 5.751 |
| 25 | 249.4045 | 85.0000 | 0.161 | 6.843 |
| 26 | 253.8575 | 122.8125 | 0.174 | 10.685 |
| 27 | 258.9310 | 28.7500 | 0.276 | 3.968 |
| 28 | 295.7960 | 126.8750 | 0.123 | 7.803 |
| 29 | 297.3290 | 100.3125 | 0.152 | 7.624 |
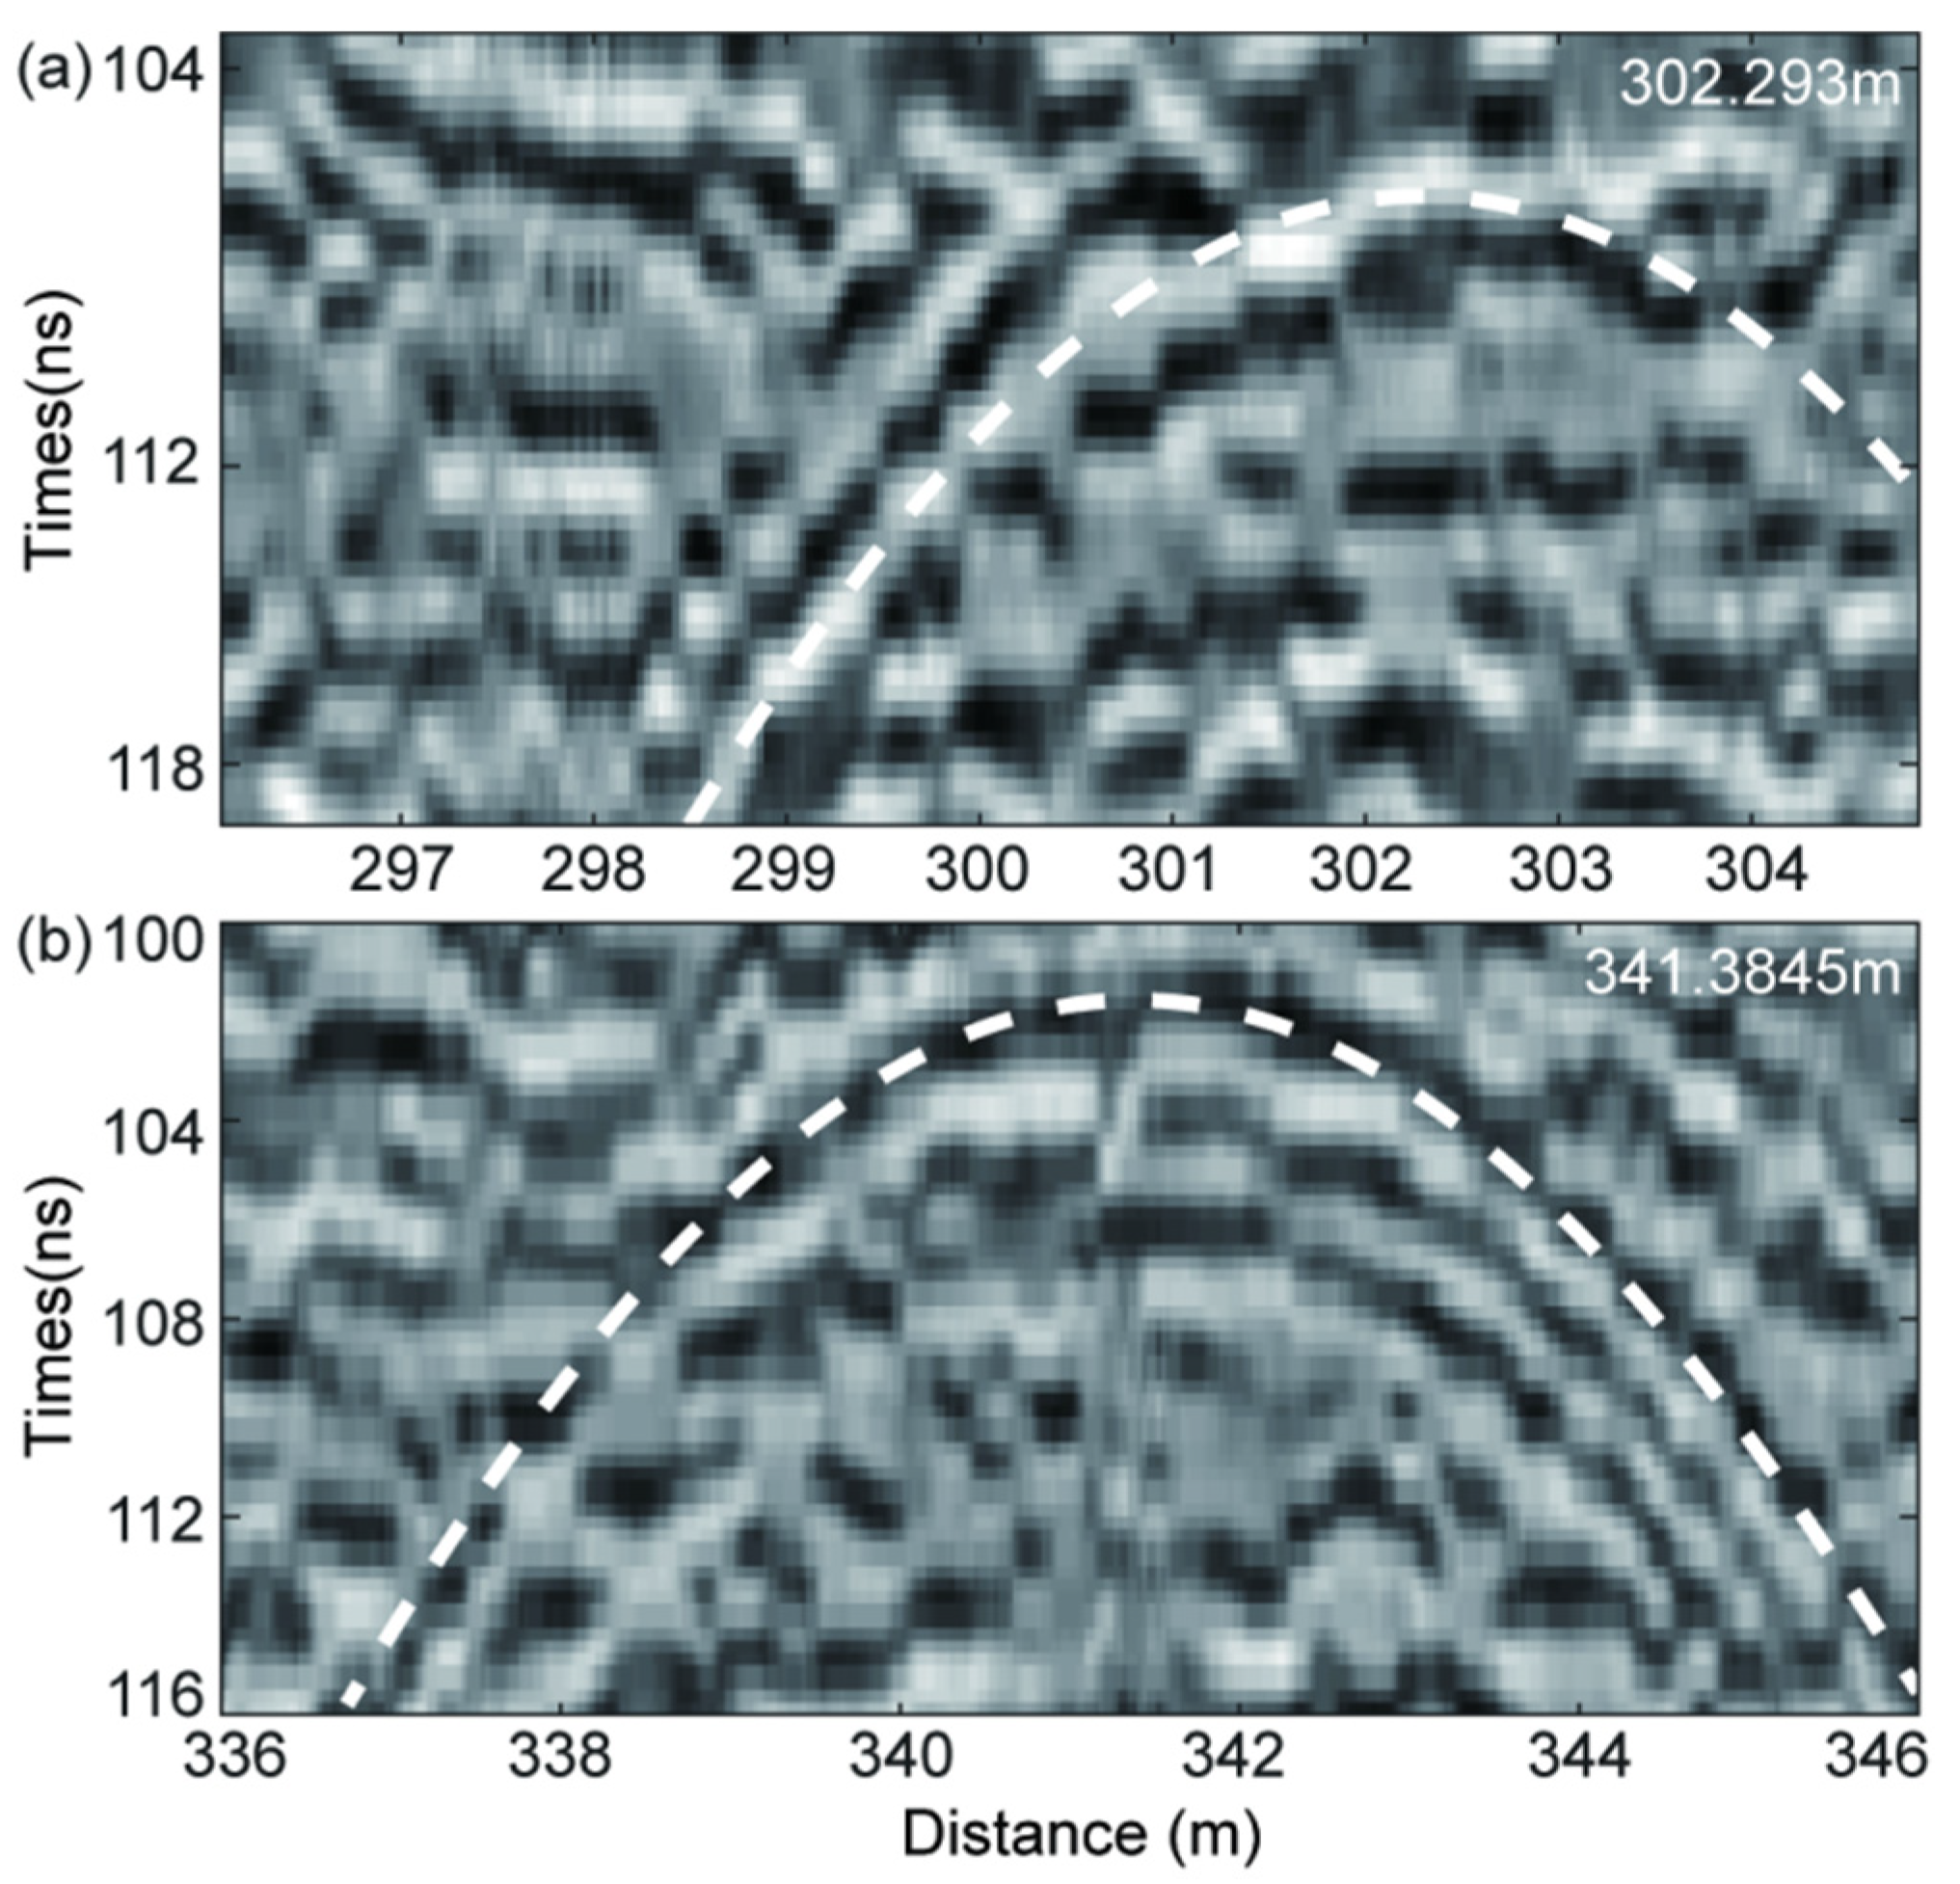
| 30 | 302.2930 | 106.5625 | 0.142 | 7.566 |
| 31 | 302.9865 | 86.8750 | 0.137 | 5.951 |
| 32 | 321.3095 | 78.7500 | 0.145 | 5.709 |
| 33 | 337.0775 | 66.2500 | 0.148 | 4.903 |
| 34 | 341.4575 | 101.5625 | 0.164 | 8.328 |
| 35 | 379.6365 | 72.8125 | 0.172 | 6.262 |
| 36 | 387.6300 | 138.7500 | 0.153 | 10.614 |
| 37 | 397.9595 | 125.9375 | 0.129 | 8.123 |
| 38 | 399.3100 | 63.1250 | 0.150 | 4.734 |
| 39 | 402.2300 | 50.9375 | 0.160 | 4.075 |
| 40 | 404.6025 | 133.4375 | 0.127 | 8.473 |
Publisher’s Note: MDPI stays neutral with regard to jurisdictional claims in published maps and institutional affiliations. |
© 2020 by the authors. Licensee MDPI, Basel, Switzerland. This article is an open access article distributed under the terms and conditions of the Creative Commons Attribution (CC BY) license (http://creativecommons.org/licenses/by/4.0/).
Share and Cite
Song, H.; Li, C.; Zhang, J.; Wu, X.; Liu, Y.; Zou, Y. Rock Location and Property Analysis of Lunar Regolith at Chang’E-4 Landing Site Based on Local Correlation and Semblance Analysis. Remote Sens. 2021, 13, 48. https://doi.org/10.3390/rs13010048
Song H, Li C, Zhang J, Wu X, Liu Y, Zou Y. Rock Location and Property Analysis of Lunar Regolith at Chang’E-4 Landing Site Based on Local Correlation and Semblance Analysis. Remote Sensing. 2021; 13(1):48. https://doi.org/10.3390/rs13010048
Chicago/Turabian StyleSong, Hanjie, Chao Li, Jinhai Zhang, Xing Wu, Yang Liu, and Yongliao Zou. 2021. "Rock Location and Property Analysis of Lunar Regolith at Chang’E-4 Landing Site Based on Local Correlation and Semblance Analysis" Remote Sensing 13, no. 1: 48. https://doi.org/10.3390/rs13010048