Article

Human Activities Enhance Radiation Forcing through Surface Albedo Associated with Vegetation in Beijing

1
Key Laboratory of Geospatial Technology for the Middle and Lower Yellow River Regions, Ministry of Education, Kaifeng 475004, China
2
Key Laboratory of Integrative Prevention of Air Pollution and Ecological Security of Henan Province, College of Environment and Planning, Henan University, Kaifeng 475004, China
3
School of Geography and Information Engineering, China University of Geosciences, Wuhan 430074, China
4
Institute of Geographic Sciences and Natural Resources Research, Chinese Academy of Sciences, Beijing 100101, China
*
Author to whom correspondence should be addressed.
Remote Sens. 2020, 12(5), 837; https://doi.org/10.3390/rs12050837
Submission received: 17 January 2020 / Revised: 29 February 2020 / Accepted: 3 March 2020 / Published: 5 March 2020

Abstract

:
The impact of human activities on vegetation has been the focus of much research, but the impact on radiation energy through surface albedo associated with vegetation greenness and length of the growth season is still not well documented. Based on the land cover data for the years 2000 and 2015, this study first divided the land cover change in Beijing from 2000 to 2015 into five types according to the impact of human activities and vegetation resilience, namely, old urban areas (OU), urban expansion areas (UE), cropland (CP), mixed pixel areas (MP, which means the land covers other than urban expansion which had changed from 2000 to 2015), and the residual vegetation cover areas (pure pixels (PP), dominated by natural and seminatural vegetation, such as grassland, forest, and wetland). Then, we calculated the direct radiative forcing from the albedo change from 2000 to 2015 and analyzed the effect of vegetation on the albedo under different land cover types based on multi-resource Moderate Resolution Imaging Spectroradiometer (MODIS) products of vegetation, albedo, and solar radiation. The results showed that the most typical changes in land cover were from urban expansion. By comparing the PP with the four human-affected land cover types (OU, UE, MP, and CP), we confirmed that the radiative forcing increment between 2001–2003 and 2013–2015 in PP (0.01 W/m2) was much smaller than that in the four human-affected land cover types (the mean increment was 0.92 W/m2). This study highlights that human activities affected vegetation growth. This, in turn, brought changes in the albedo, thereby enhancing radiative forcing in Beijing during 2000–2015.

Graphical Abstract

1. Introduction

Accelerated human activities are fundamentally altering the Earth’s surface cover and biophysical processes. More than half of the Earth’s land surface has been modified by direct human use, and the impacts of human activity on land cover are expected to increase due to population growth and urbanization [1,2]. The expansion of infrastructure and agriculture necessitated by population growth has quickened the pace of land cover transformation [3]. The current transformation of land cover, particularly urban expansion and the loss of agricultural land, is unsustainable in some regards [4]. Human activity can not only directly change the type of land cover but can also indirectly affect the vegetation growth process by influencing the climate system [5,6]. The land cover and vegetation changes in turn lead to changes in the biogeophysical factors, such as surface albedo [7,8,9], which characterizes the surface’s ability to reflect solar radiation [10,11]. Therefore, studying the effect of human activity on the energy balance is important for understanding the effects of human activities on the climate [12].
Albedo directly affects the energy budget [13]. Land cover change can effectively reflect the impacts of human activity on vegetation and its corresponding surface albedo, although the variation of albedo depends not only on the land cover and vegetation change [14,15,16]. Numerous studies have analyzed the relationships between albedo and land cover change, and vegetation greenness and the length of the growth season [17]. As a typical land cover change under human activities, urban expansion always replaces cropland and other natural or seminatural vegetation cover like forest, grassland, and wetland [4], which are accompanied by the increase of buildings, and the corresponding albedo will increase or decrease due to the higher or lower albedo of the main building materials used during the urban expansion of the initial lands occupied.
Moreover, introduced vegetation, landscape replanting and greening often exist in urban areas and urban vegetation also has more opportunities to receive well management [18]. Meanwhile, albedo varies along with the vegetation growth and shows seasonal characteristics. For example, forests during the whole growth season have various albedo [17]. All these imply that both vegetation cover and surface albedo experience multi–interventions and what they reflect are synthetic land surface characteristics.
In general, to measure the impacts of human activity on land surface, as a typical accumulation area of human activities, urban area and its expansion and its effect on vegetation growth and regional climate have been extensively studied [19,20]. In these studies, it is common to compare the land surface temperature difference and vegetation characteristics of urban areas with those of non-urban areas or rural areas in and around the city [21]. However, when those of non-urban areas are just used as statistical units, this ignores the differences of various human activity and vegetation cover (human impact and vegetation resilience). Therefore, some studies have represented the human impact by analyzing the impact of various land cover types on land surface temperature [22].
Temperature is a manifestation of radiant energy and to quantify the impacts of human activity on radiant energy, many studies have carried out climate change simulations from land cover change based on regional climate models [23,24]. Models can reflect the detailed physical process, but there are numerous model parameters, and the sensitivity of climate factors to land cover change after integrating various parameterization schemes for climate models always leads to variable results [25,26]. Therefore, it is difficult to explain the climate contribution corresponding to the change of land cover [27,28]. To solve this problem, the Intergovernmental Panel on Climate Change (IPCC) used a simplified parameterization scheme to calculate the radiative forcing (RF) and analyzed the climate effect of land cover change from the surface albedo [12,29,30], which made it possible to calculate the RF on the pixel scale using remote sensing data [31].
The aim of this study is to assess how human activity affects radiation forcing through surface albedo associated with vegetation on the pixel scale in Beijing, a megacity undergoing rapid urbanization in China. On the basis of the public land cover, vegetation, surface albedo, and downward shortwave radiation data extracted from Moderate Resolution Imaging Spectroradiometer (MODIS) remote sensing images, we used a simplified parameterization scheme, as recommended by IPCC, to analyze the land cover changes and the impacts of vegetation on the albedo and corresponding RF in Beijing from 2000 to 2015. In fact, this study not only effectively integrates remote sensing data but also expands the application of remote sensing in studying climate change from the perspective of biogeophysical parameters.

2. Materials and Methods
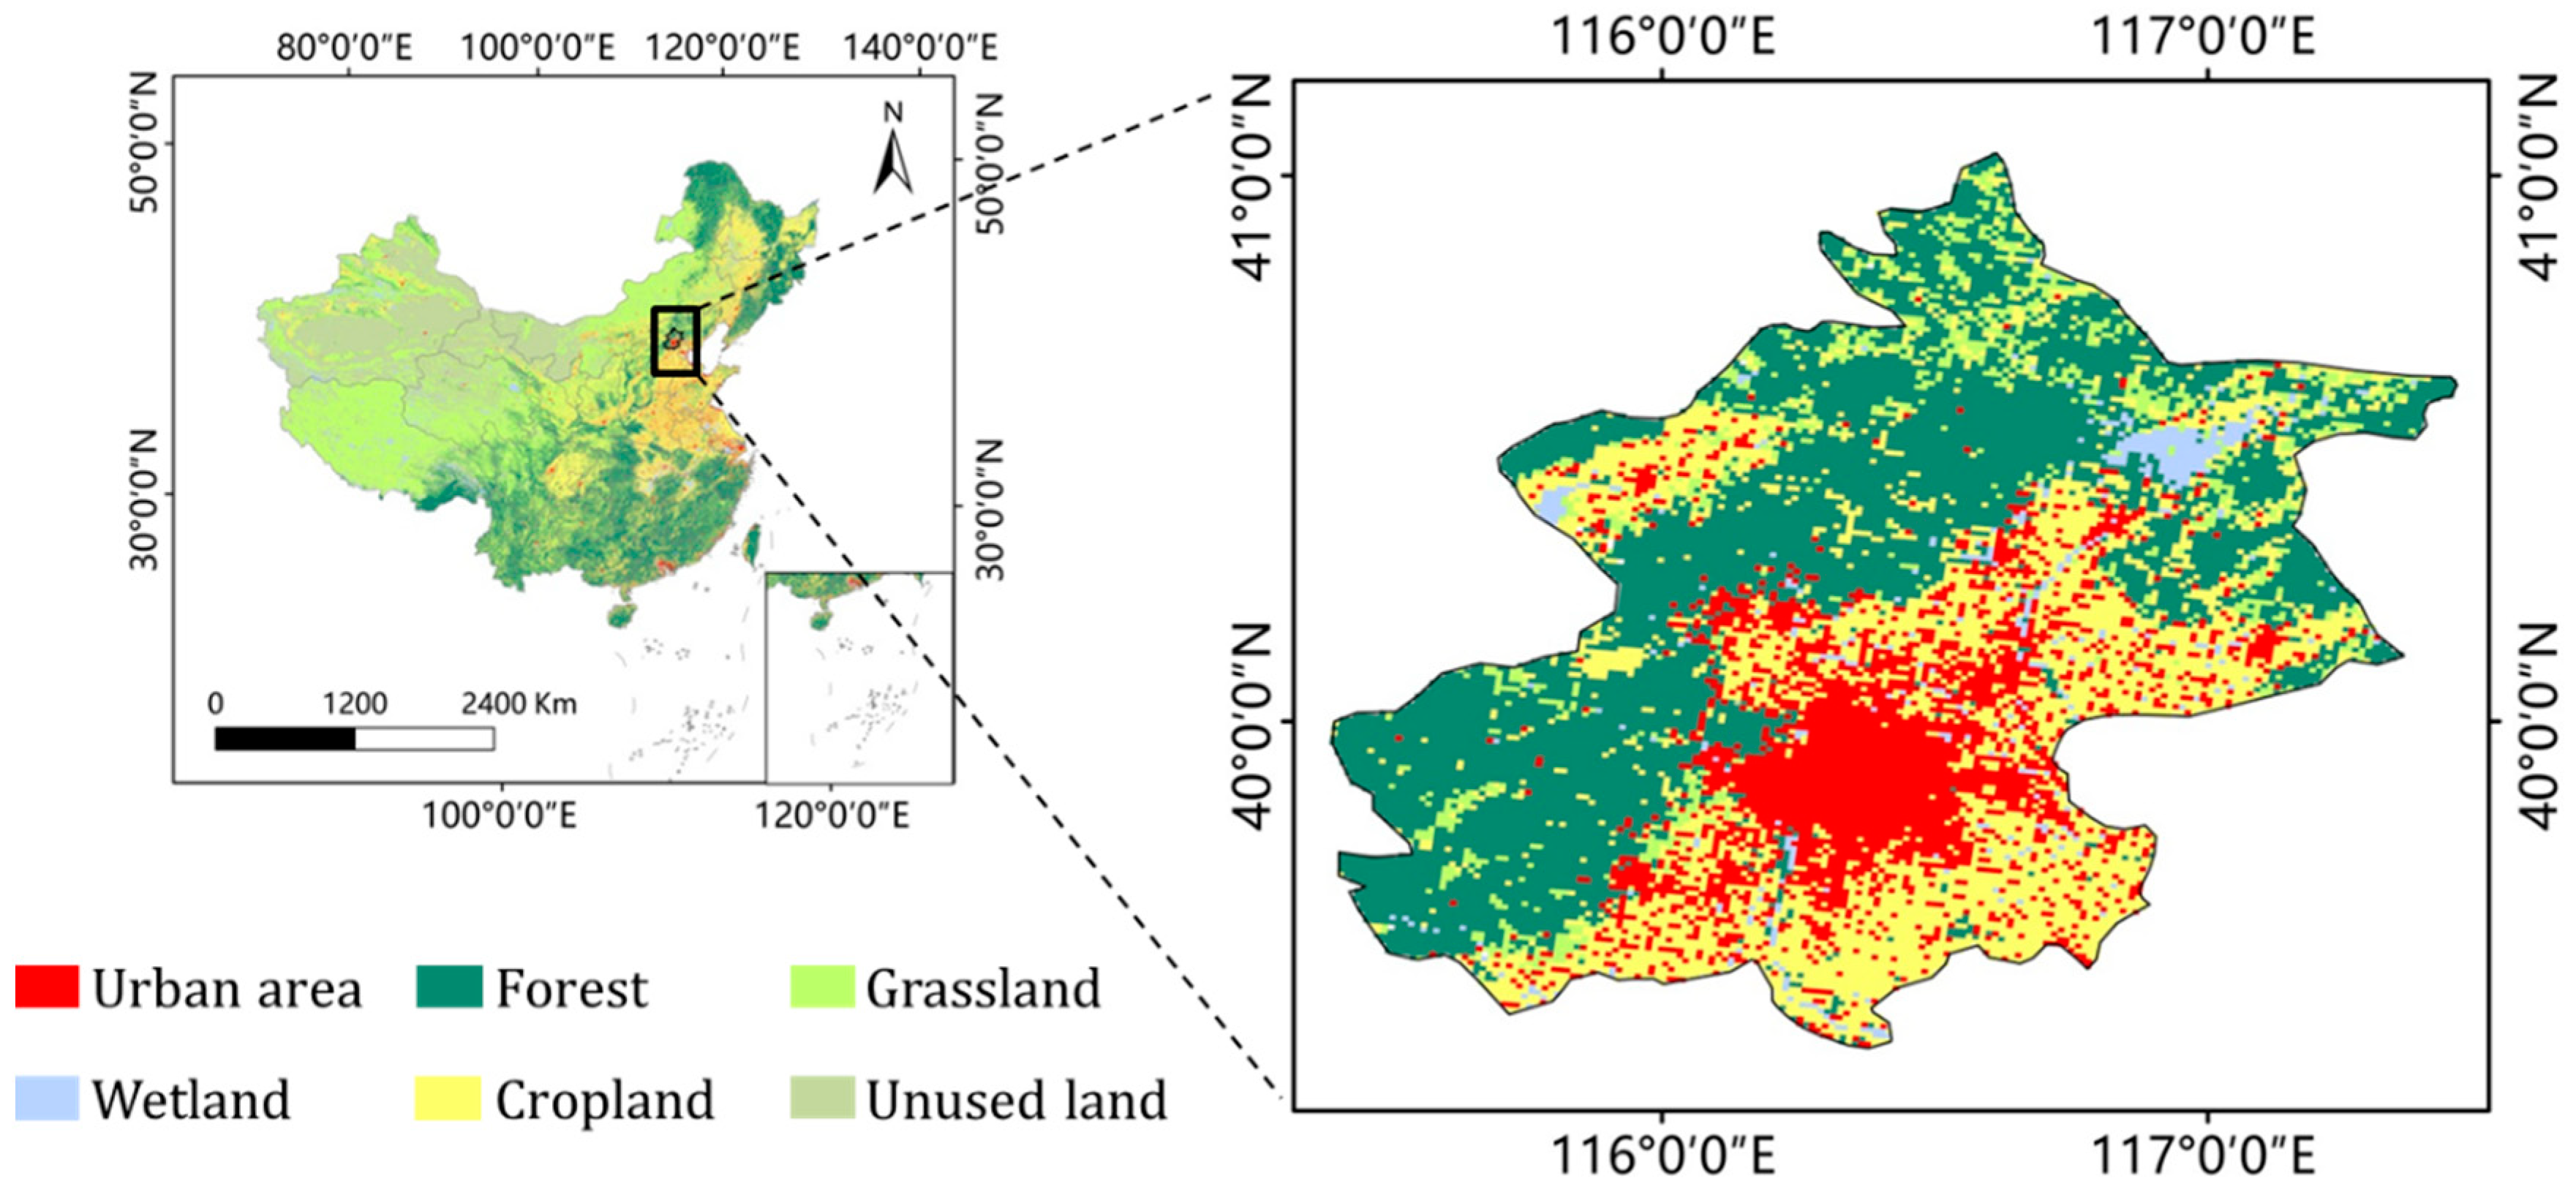
2.1. Study Area

Beijing is the capital of China and is located in northern China (115.7°E–117.4°E, 39.4°N–41.6°N), with a total area of 16.41 thousand km2. Mountains are mainly found to the northwest while the southeast is made up of plains. Beijing has a monsoon-influenced semi-humid continental climate. Based on the Köppen–Geiger climate classification, most regions in Beijing belong to the warm continental climate/humid continental climate, and a few regions belong to the Cold semi-arid climate [32]. The annual average air temperature is ~12 °C, and the annual average precipitation reaches ~640 mm. The average annual sunshine in Beijing is between 2000 and 2800 hours. As the capital of China, human activity is very intense, and Beijing is experiencing rapid urbanization [4]. In addition to urban areas and croplands, the vegetation types in Beijing are mainly warm temperate deciduous broad-leaved forests, with small areas of warm coniferous forests and grasslands (Figure 1).

2.2. Data Collection

Land cover data for 2000 and 2015 were used to identify the multi-year land cover change in Beijing. The latest version of land cover data with a 1 km spatial resolution was downloaded from the Natural Resources and Environment Center, Chinese Academy of Sciences (http://www.resdc.cn). The data were produced by manual visual interpretation with the support of Landsat Thematic Mapper (TM) / Enhanced Thematic Mapper Plus (ETM+) images and the data accuracy was far more than 90% [33,34].
Solar radiation (downward shortwave radiation) and surface albedo data from 2000 to 2015 were used to calculate the temporal and spatial dynamics of RF. Based on MODIS source data, the downward shortwave radiation data with a spatial resolution of 0.05° × 0.05° and a temporal resolution of one month were produced by Environmental Ecology Laboratory, Seoul National University (http://environment.snu.ac.kr/) [35]. As for albedo data, a MODIS inversion product (MCD43A3) with a spatial resolution of 500 m and original temporal resolution of 16 days was used in this study (Land Processes Distributed Active Archive Center, LPDAAC, https://modis.gsfc.nasa.gov/) [36]. Here we integrated black-sky and white-sky albedos for shortwave broadband (BSA and WSA) data to calculate the annual average albedo data [37,38].
Enhanced vegetation index (EVI) and the length of season (LOS) data from 2000 to 2015 were selected to measure the growth status of vegetation. The EVI reflects the vegetation greenness and LOS reflects the vegetation growth process [39,40,41]. In this study, EVI data were the MODIS product of MOD13A1, with the original spatial and temporal resolutions of 500 m and 16 days [42]; LOS data were the MODIS product of MCD12Q2, with the original spatial resolutions of 500 m [43]. Both of the two vegetation data products were collected from the NASA’s LPDAAC (https://modis.gsfc.nasa.gov/).

2.3. Study Methods

2.3.1. Data Preprocessing for Remote Sensing Data Products

All the four data products (EVI, LOS, albedo, and solar radiation) used in this study are publicly available remote sensing data products. The original remote sensing source images of the four data all come from MODIS, which is conducive to our analysis [35,36,41]. The time span of these remote sensing data products was from 2000 to 2015. In this study, the annual LOS and annual average data of EVI, albedo, and solar radiation data were used for the corresponding calculations and analysis, given that the land parameters changed in every season and its climate effect happens over the year. In addition, anomalies and outliers may exist in these data products but we retained all the pixel information. This is mainly based on the following considerations: First, there is no uniform standard definition or criteria to judge which pixels should be noise points; second, some intensive changes may exist theoretically given the intensity of human activity and its impact on surface cover in Beijing. In fact, the annual average processing also plays a filter role.

2.3.2. Land Cover Reclassification

Considering human activity (or interference to the ecosystems) and vegetation resilience together, we reclassified the land cover data from two periods, 2000 and 2015. The study first divided the two periods of land cover data into three types: urban areas, cropland, and other land types (dominated by natural and seminatural vegetation, such as grassland, forest, and wetland) [44]. Then, we used the raster overlay method to convert the two land cover layers to five new land cover types (Figure 2), namely old urban areas (OU, which means that the land had remained urban areas from 2000 to 2015. OU means the ultimate type of urbanization affecting surface cover, which is continuously affected by human activities and the natural and seminatural vegetation recovers with difficulty); urban expansion areas (UE, which means that the other land cover types in 2000 had been converted to urban areas by 2015); cropland (CP, which means that the land covers only one type of cropland); mixed pixels (MP, which means the land covers other than urban expansion which had changed from 2000 to 2015); and the residual natural and seminatural vegetation cover areas (pure pixels (PP), which means that the land contains only the residual land cover types (forest, grassland, or wetland) other than urban area and cropland). This study assumed that the PP areas corresponded to the natural situation since the PP pixels were mainly dominated by natural and seminatural vegetation with strong resilience, and the other four land cover types were affected by human activities to some extent [45,46,47]. Therefore, the difference in the statistical variables between PP and the other four land cover types represented the impact intensity of human activities.

2.3.3. Radiative Forcing

RF, which is used to describe temperature change, can express an imbalance in the planet’s radiation budget caused by human interventions [48,49]. For shortwave forcing agents, the RF at the top of the atmosphere (TOA) can be expressed as [50,51]:
R F   =   - R T O A Δ α p ,
where RTOA is the downward shortwave radiation at the TOA and Δαp is the change value in planetary albedo.
On the basis of the study of Lenton et al. [50,52], the local RF caused by surface albedo (RFalb) can be expressed as:
R F a l b = R T O A f a Δ α s ,
where Δαs is the variation in surface albedo and this study uses Δalbedo to represent the difference between annual albedo during 2001–2015 and albedo in 2000; ƒa is the parameters of the entire atmosphere that absorb and reflect solar radiation. ƒa can be calculated by:
f a = R s R T O A T a ,
where Rs is downward shortwave radiation at the Earth’s surface; Ta is a parameter accounting for the reflected fraction of radiation from the surface to the TOA during the atmospheric transmittance process (here a global value of 0.854 was used). Finally, the local RFalb can be expressed based on surface albedo and atmospheric transmittance parameters:
RF alb = R s T α Δ α s .

2.3.4. Linear Slope Analysis

Linear regression is commonly used to assess the linear trend. The change trends of vegetation, albedo, and RF were calculated by the slope of the least squares regression. If we have one dataset (x1, …, xn) containing n values and another dataset (y1, …, yn) containing n values then the formula for slope is:
S l o p e = n   x y   x   y n   x 2 (   x ) 2 .

3. Results

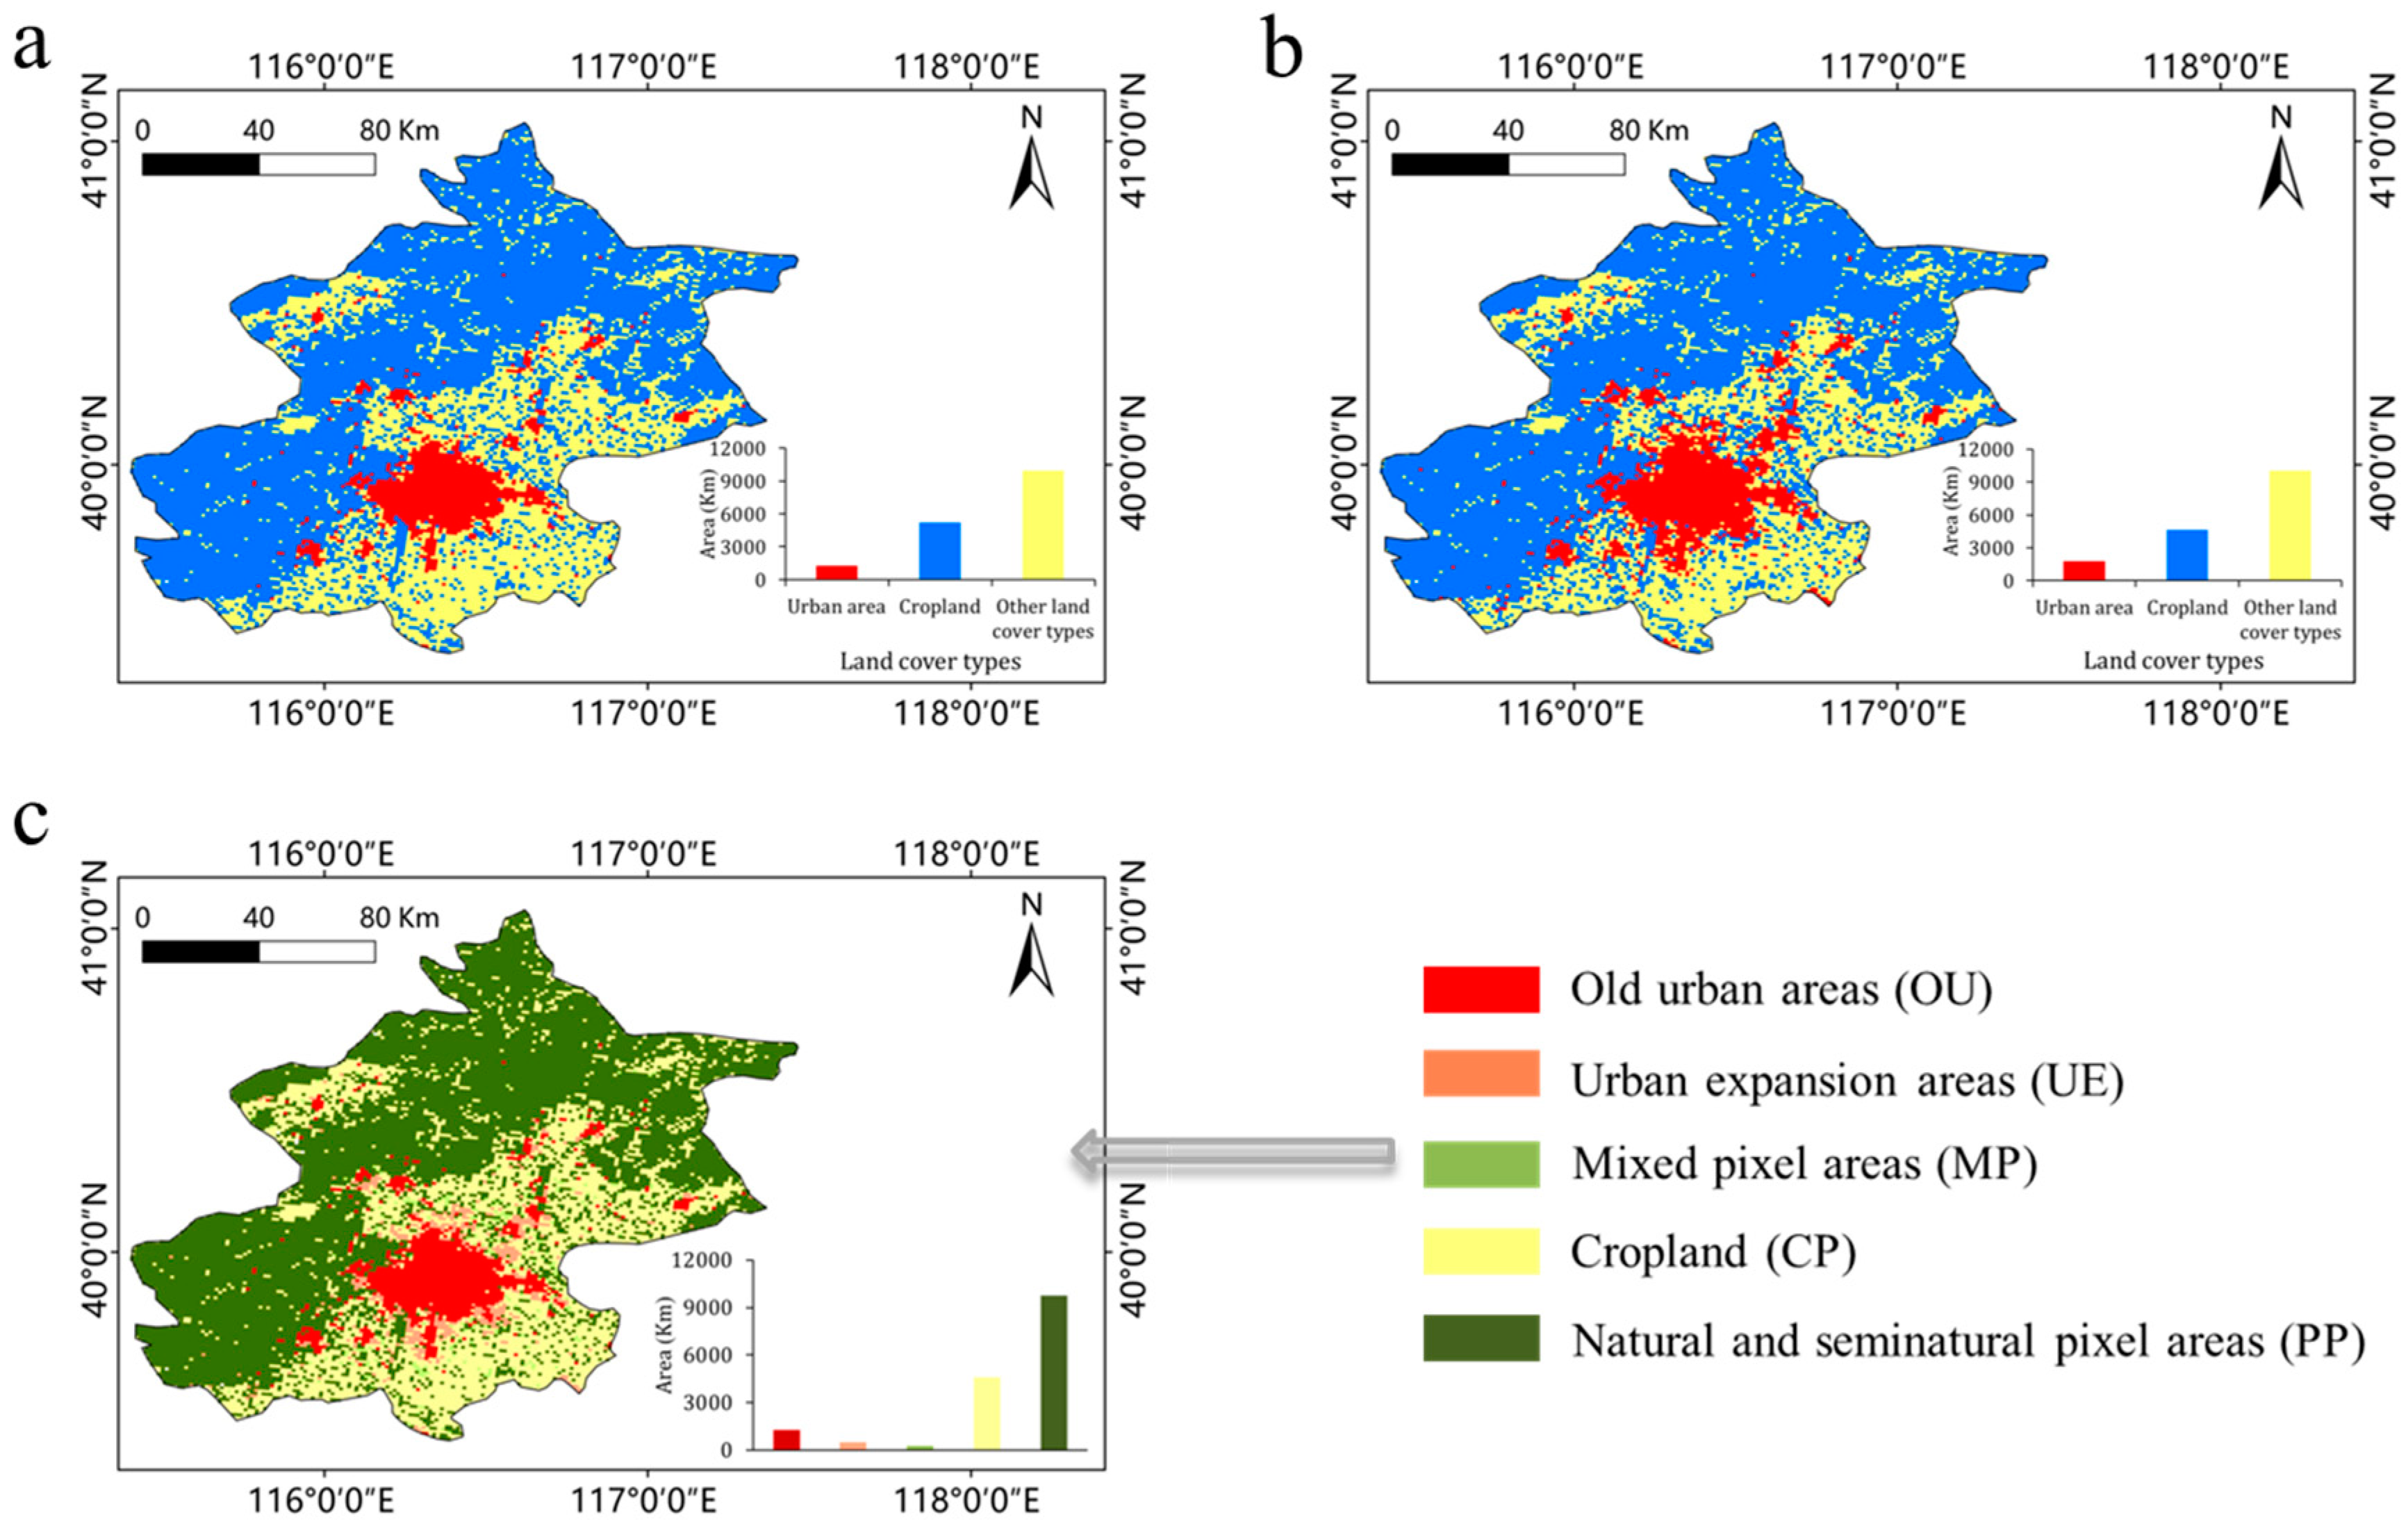
3.1. Land Cover Change from 2000 to 2015

Urban areas and croplands changed noticeably, while the proportion of the other land types was always dominant from 2000 to 2015 (Figure 3). Croplands were most often converted to new urban expansion areas. In 2000, the proportions of urban areas, croplands, and the other land types in Beijing were 7.67%, 31.65, and 60.68%, respectively. By 2015, the proportions of the three land cover types had changed to 10.82%, 28.15%, and 61.03%, respectively. In the past 15 years, urban areas grew by 517 km2, and the area change rate was 41.1%. Correspondingly, croplands decreased by 575 km2, and the area change rate was 11.1%. The area of the other land types dominated by natural and seminatural land cover types increased slightly by 58 km2, and the area change rate was only 0.6% (Table 1).
As for the temporal and spatial changes of the periods of land cover data, this study divided the land cover change into five types based on the degree of human intervention: OU, UE, MP, CP, and PP. The main land cover type in Beijing was PP, covering an area of 9579 km2, followed by CP, with an area of 4603 km2. The total urban area reached 1776 km2 in 2015, including the OU of 1259 km2 and the UE of 517 km2. The area of MP in Beijing was small, only 272 km2 during the whole study period.

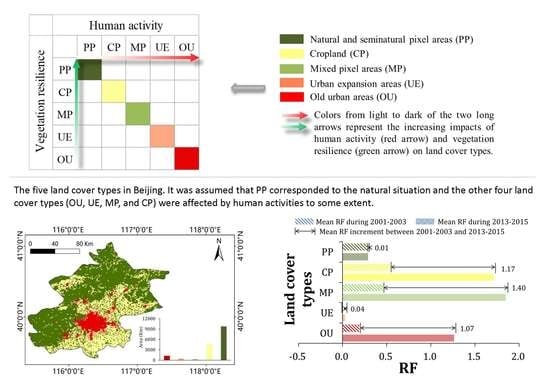
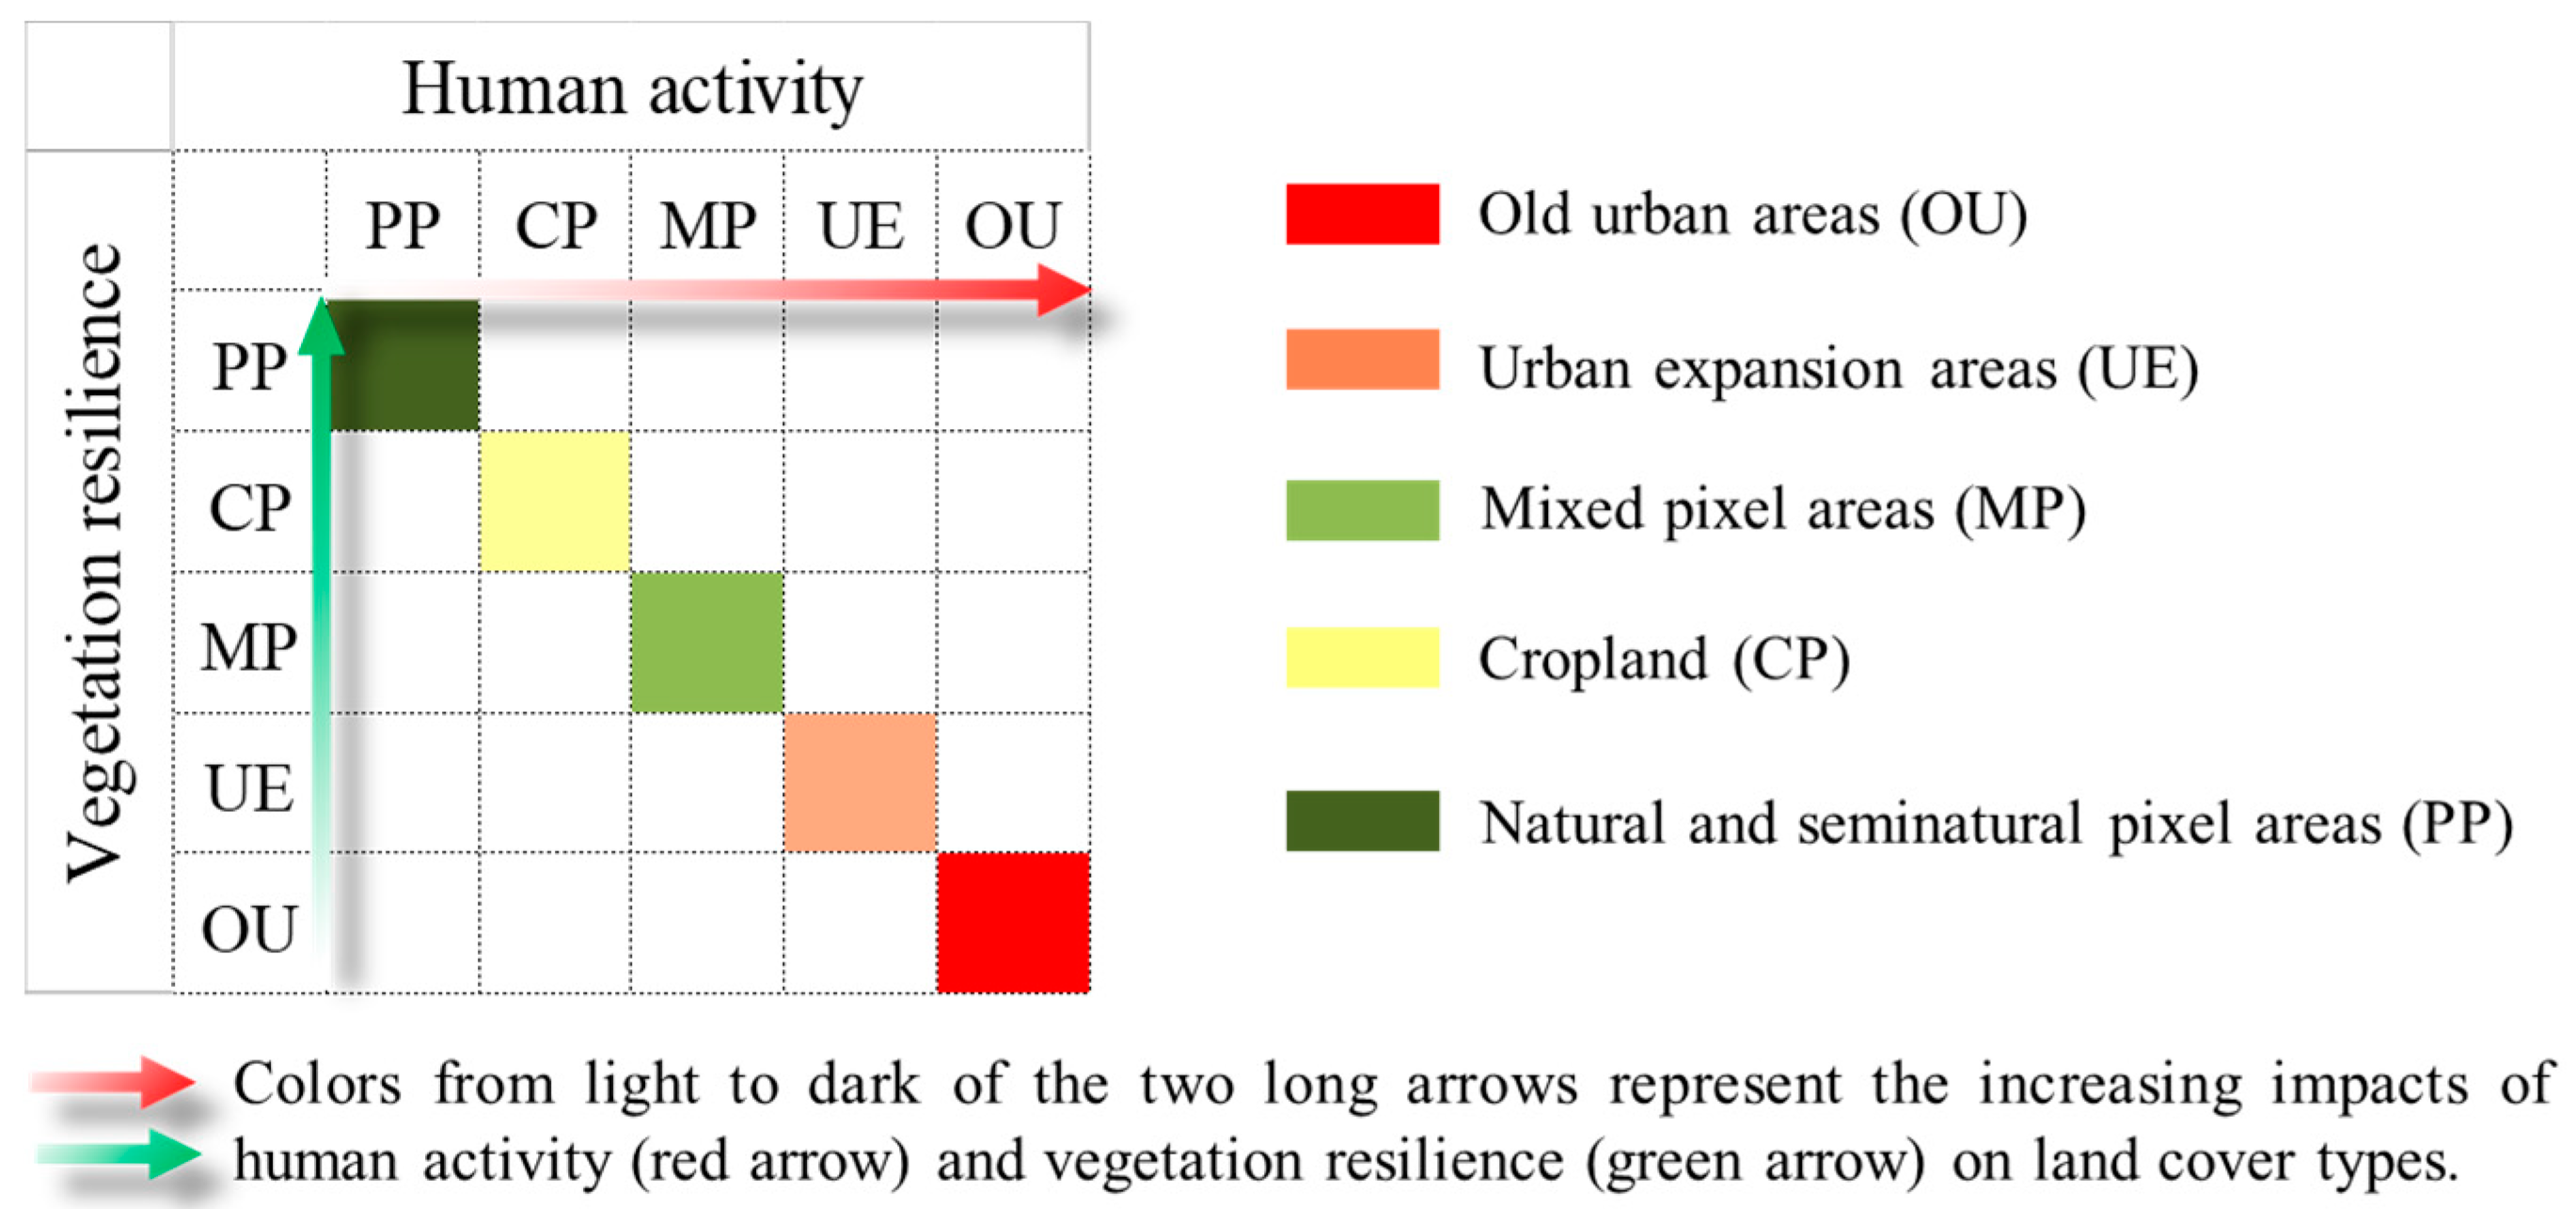
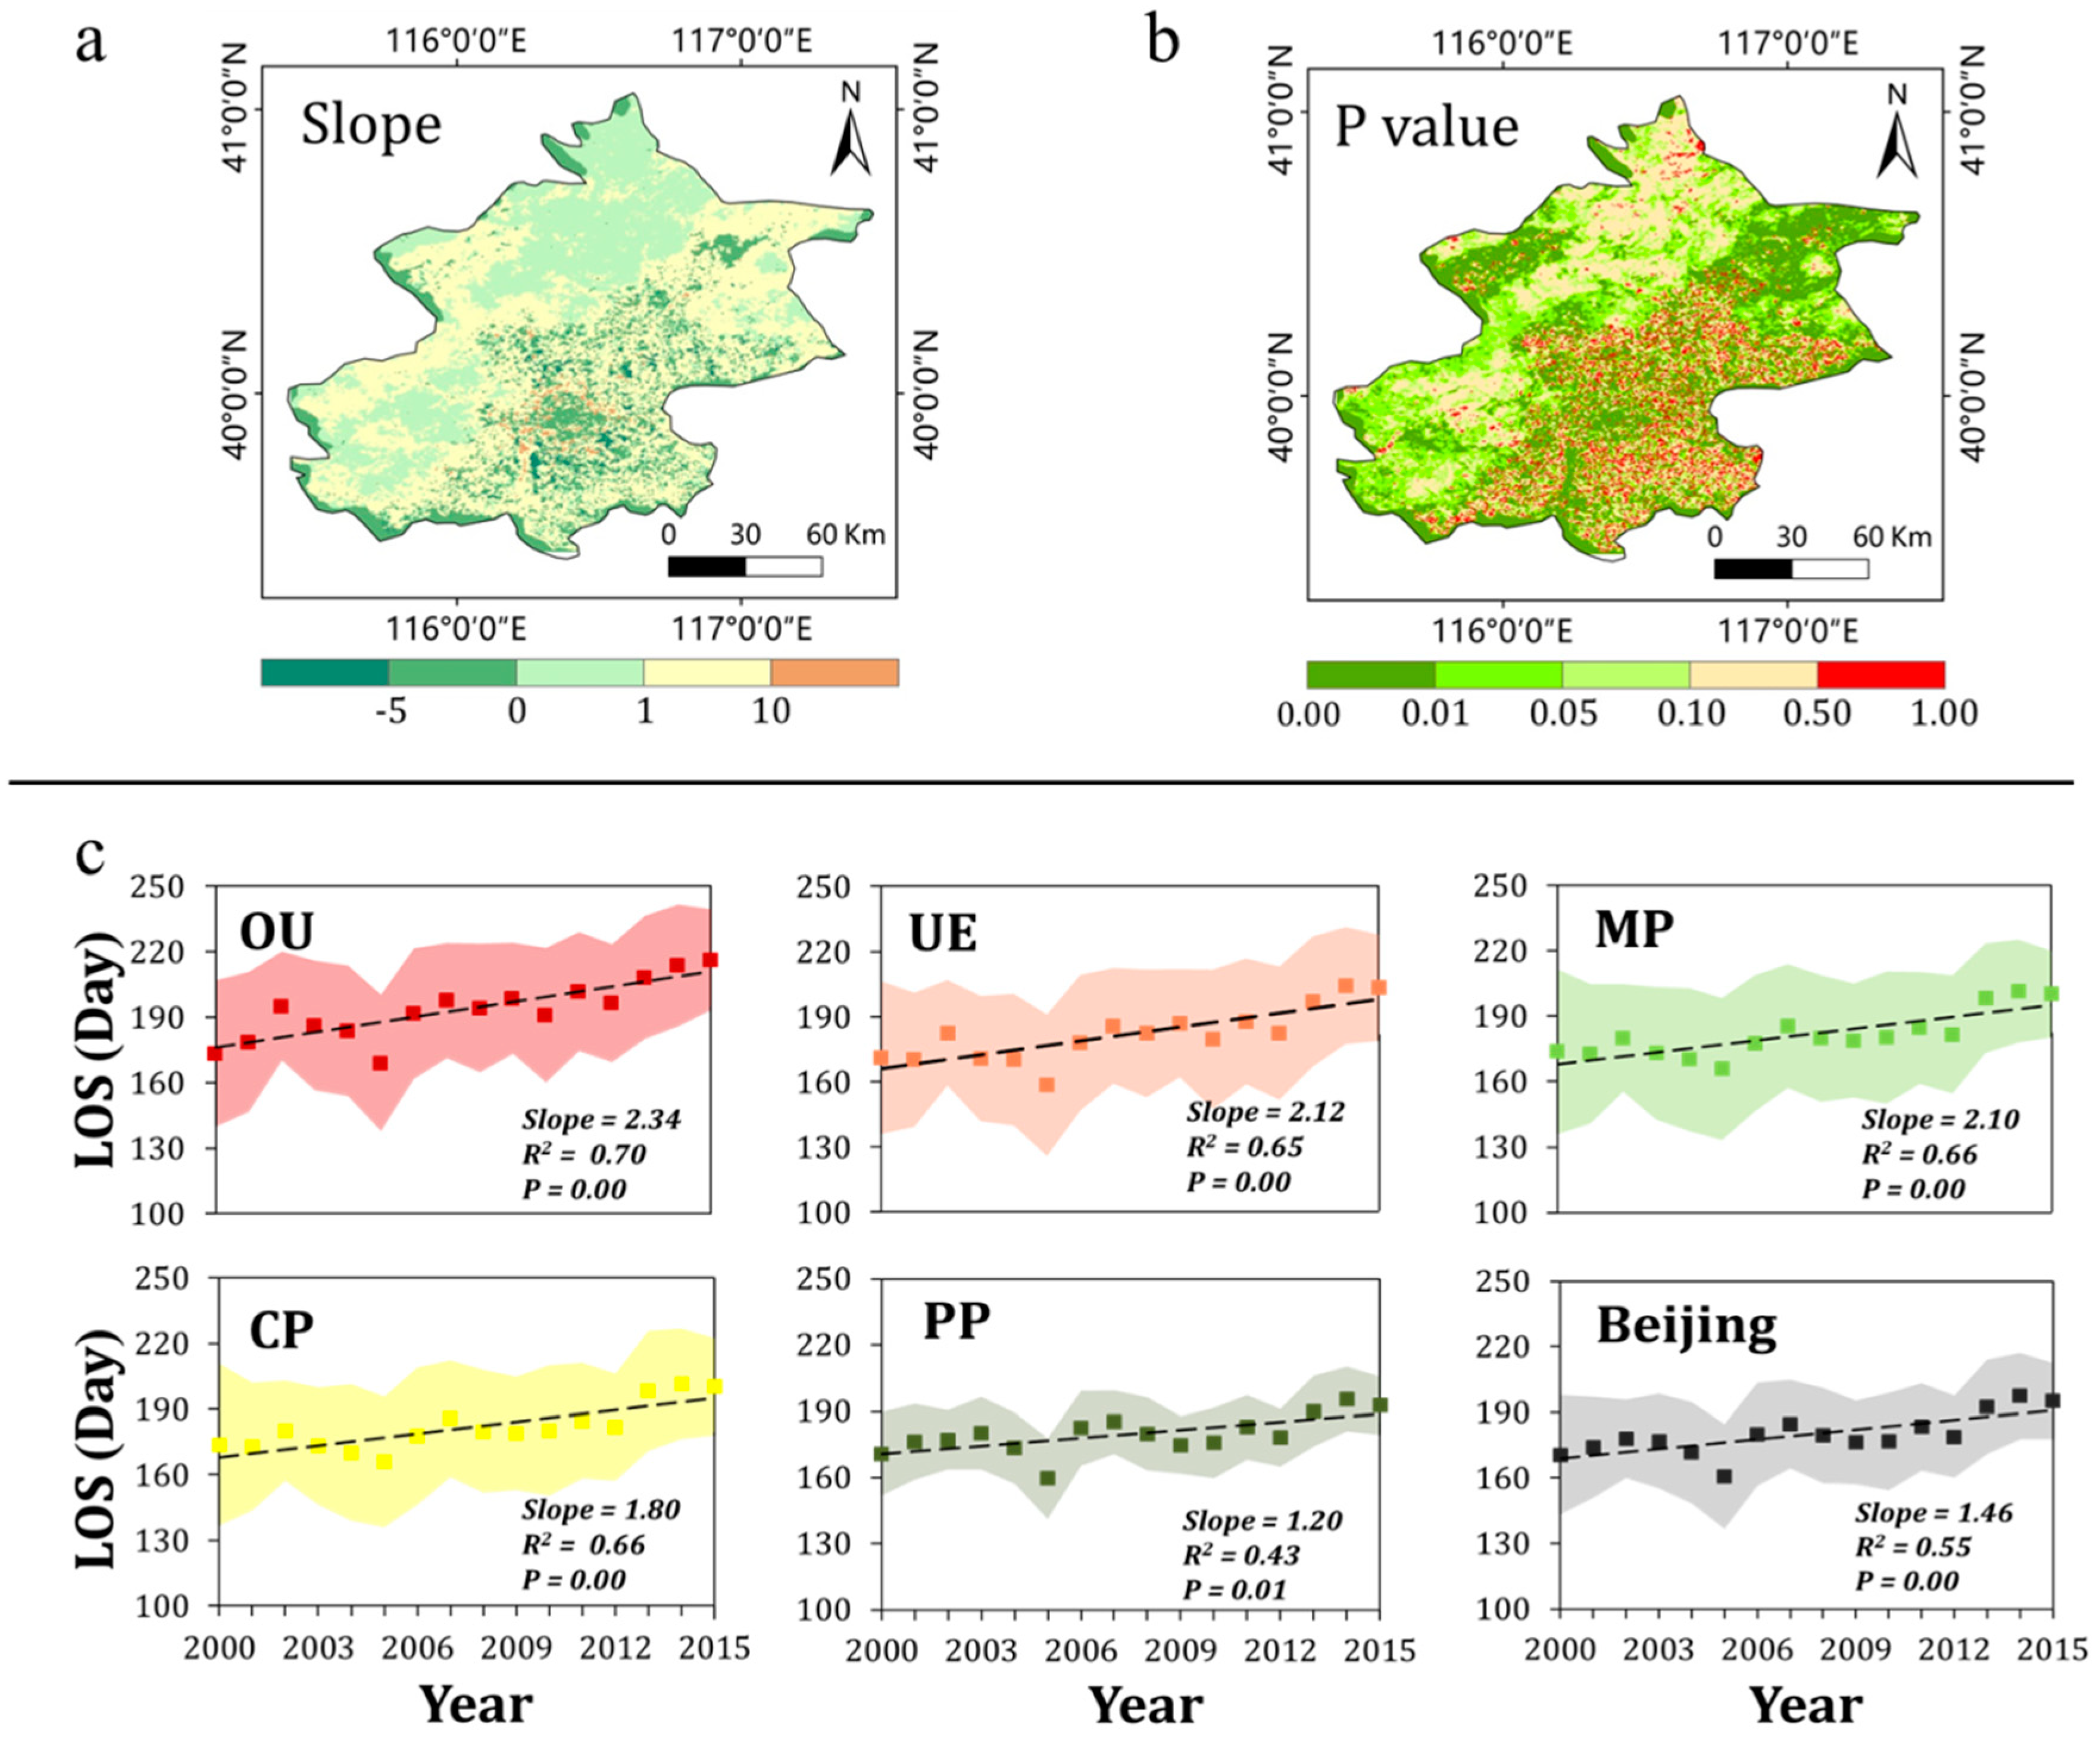
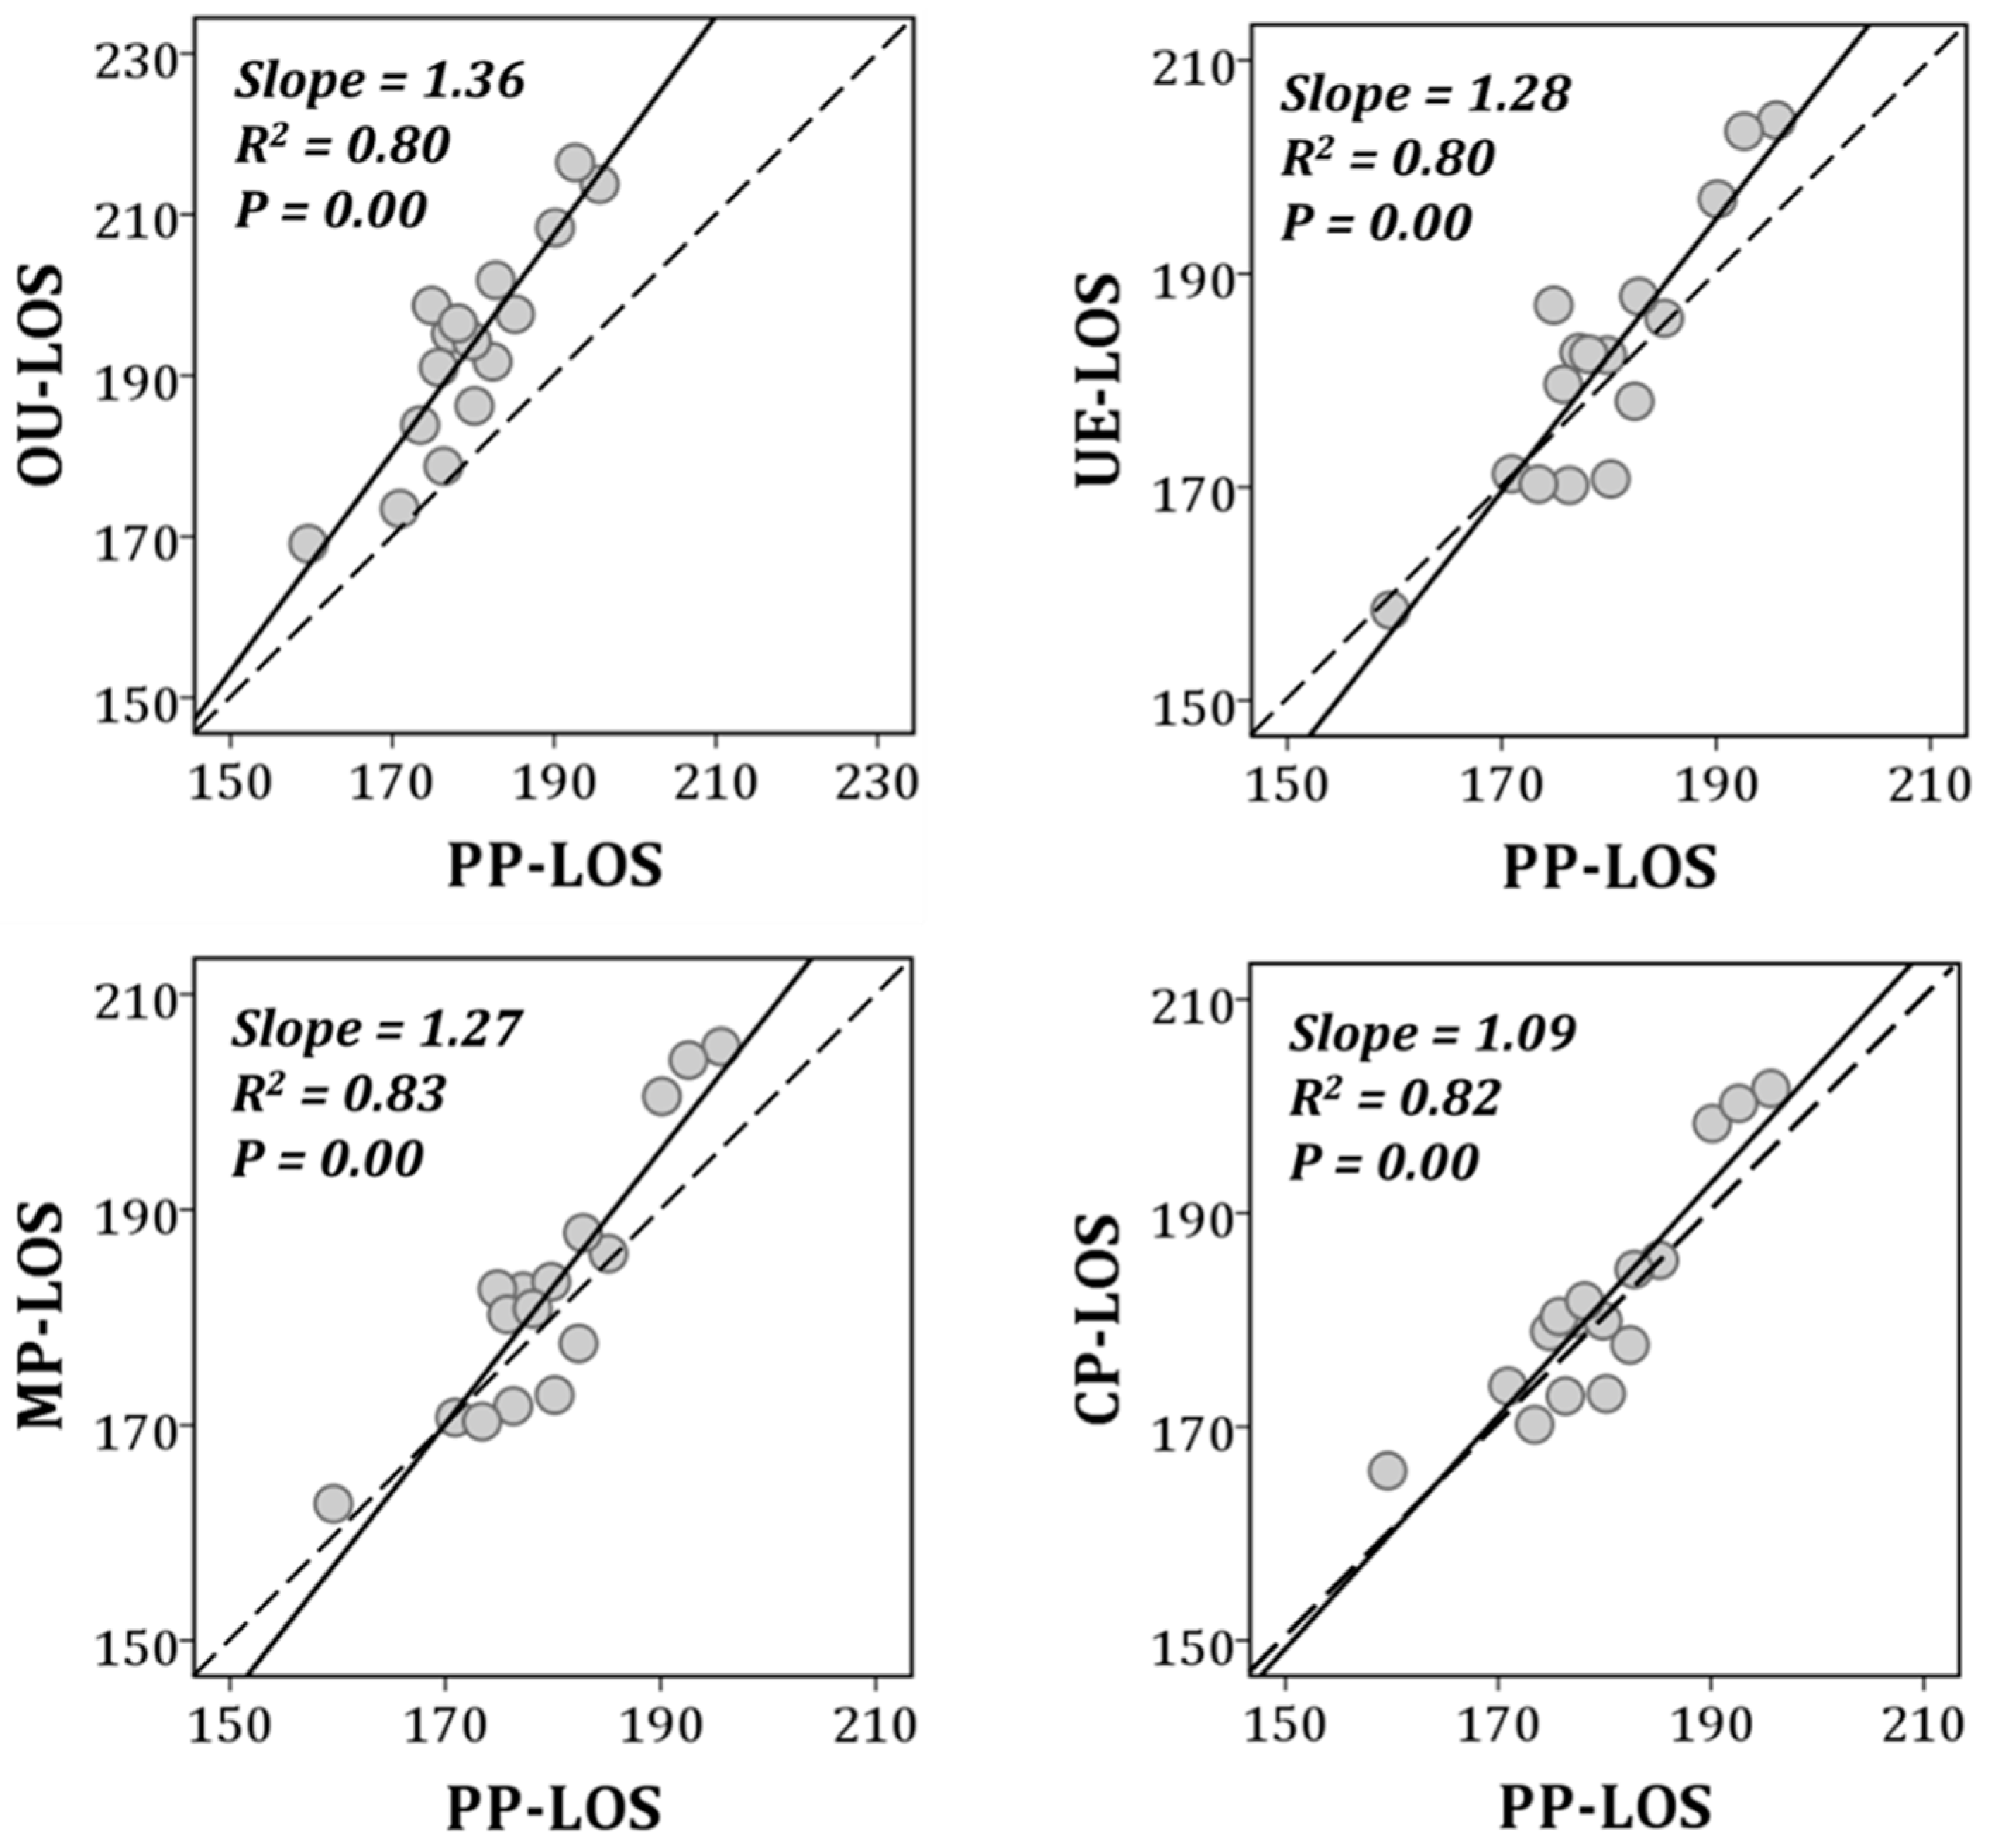
3.2. Impacts of Human Activities on Vegetation in Various Land Cover Types

This study compared the differences of EVI and LOS among various land cover types. Figure 4 shows that the EVI had a decreasing trend with the degree of human activity. PP had the largest EVI and the average value from 2000 to 2015 was 0.229; followed by CP, with an average EVI of 0.216. However, the EVIs in OU, UE, and MP with a relatively dense population and a large influence were all relatively small, with averages of 0.139, 0.177, and 0.194, respectively. In contrast, the average value of LOS generally exhibited a decreasing trend with the degree of human activity in the five land cover types, namely OU > UE > MP > CP > PP. Figure 4 also showed that the LOS in OU was the longest, which implies that LOS is clearly affected by human activities.
This study used the annual changes of EVI and LOS for the five land cover types to assess the detailed impacts of human activities on vegetation greenness and growth process (Figure 5). From 2000 to 2015, the overall EVI in Beijing showed a significant increasing trend, with an annual growth rate of 0.002. In each land cover type, the EVI of OU, CP, and PP showed a significant increasing trend, with annual growth rates of 0.002, 0.001, and 0.003, respectively. Although the EVI of UE and MP also showed an increasing trend, they did not pass the significance test of P < 0.05.
We assumed that the vegetation growth changes corresponding to the PP were mainly affected by natural factors and represented the natural change rate. In Beijing the change rate in the natural EVI was 0.003 (PP slope). On the basis of this, the differences between the change rate of EVI in the other four land cover types and PP were calculated (minus PP slope), and then the differences for OU, UE, MP, and CP were −0.001, −0.002, −0.002, and −0.002, respectively. In addition, in the regression analysis comparing PP with the other four land cover types, the regression slopes of OU, UE, MP, and CP were all less than 1 (Figure 6). All these indicate that, compared with PP, regardless of the degree of the human influence, the change trends of the four land cover types were all lower than PP, indicating that human activities have a negative effect on the vegetation greenness, although the vegetation greenness in the whole study area increased from 2000 to 2015.
To measure the impact of human activities on the growth process of vegetation, this study used the LOS for comparative analysis. From 2000 to 2015, the overall LOS of Beijing showed a significant increasing trend, with an overall growth rate of 1.46. The LOS in UE, MP, and CP showed a large and significant increasing trend of 2.12, 2.10, and 1.80, respectively. Although the LOS in PP also showed a significant increasing trend, the rate was the smallest (Figure 7).
Assuming that the change of LOS in PP corresponds to the change rate under natural conditions, the natural change rate of LOS in Beijing was 1.20. The differences of LOS between the change rate of the other four land cover types and PP were calculated. The residual change rates of OU, UE, MP, and CP were 1.14, 0.92, 0.90, and 0.60. All regression coefficients of the LOS in the four land cover types impacted by human activities were greater than 1 (Figure 8). The analysis results for LOS were clearly the opposite to the results for EVI, showing that human activities have a positive effect on the LOS (increasing the LOS) and the effect increases along with the impact intensity of human activities.

3.3. Albedo Changes and Radiative Forcing of Various Land Cover Types

Factors such as vegetation greenness and growth length directly affect the surface albedo, which in turn affects radiative forcing. In this study, we analyzed the relationship between the albedo, EVI and LOS in Beijing, finding a significant negative correlation between the albedo and EVI, and the LOS (Figure 9). Except for the UE and PP, the negative correlations between the albedo and EVI were all significant in the other three land cover types (P < 0.05). Among the five land cover types, the albedo of MP decreased most rapidly with the increase of EVI. In contrast, the absolute value of the linear slope in PP was the smallest, at −0.02. This indicates that EVI in the natural PP does not have a significant impact on the albedo. In terms of LOS, apart from in PP, the albedo and LOS showed a negative correlation in the other four land cover types, and the significance gradually increased in CP, UE, MP, and OU (P-value tended towards 0). The linear slopes of the LOS and albedo in the five land cover types were all very small compared with the EVI and albedo. The absolute values of the linear slope in UE, MP, and CP were the largest; however, the averaged value was only −0.0002. The absolute values of the linear slope in OU was smallest than that in UE, MP, and CP; however, the slope value in PP was very close to 0. These indicate that the extension of the vegetation growth length has little effect on the surface albedo for natural vegetation, while the extension of LOS reduced the surface albedo under the influence of human activities. Overall, in the four land cover types under human influence, both EVI and LOS had a negative correlation with the albedo, indicating that human activities have contributed to the changes of albedo by affecting the EVI and LOS.
In terms of the annual dynamics of albedo, the albedo in OU, UE, MP, and CP were generally higher than the albedo in PP. From 2000 to 2015. The albedo in OU, UE, MP, and CP all showed a significant decreasing trend, with the highest rate of decline of −0.0008, while the albedo in PP remained almost stable during the study period. Overall, the albedo in Beijing showed a slight decrease, and the linear trend did pass the significance test of 0.05 (Figure 10).
Here, we used the albedo in 2000 for the initial benchmark and introduced RF to express the direct impact of albedo changes on the energy budget. RF showed an increasing trend over the 15 years in different land cover types except that in UE (Figure 11). The mean RF in PP was low, and its rate of increase was close to zero. The human-affected OU, MP, and CP had higher RF, and their increasing trends were faster than PP. In addition, the mean RF differences between 2001–2003 and 2013–2015 showed that the RF increment in PP was the smallest, 0.01 W/m2, while the RF increments in the four human-affected land cover types were all much larger than that in PP (with a mean increment of 0.92 W/m2). These figures from the long-term series indicate that the role of human activities in enhancing RF will be reflected once they occur.

4. Discussion

Human activities change the surface energy by affecting the vegetation cover, although vegetation has many influencing factors [53]. The surface albedo is also affected by many factors [7,54]. Our analysis showed that EVI and LOS had an increasing trend between 2000 and 2015. Although we cannot distinguish the influence of human activities from other influences (such as temperature and precipitation), we can partly identify changes to vegetation growth under different intensities of human activities through the analysis of various land cover types. In this study, according to our limited cognition and related references [45,46,47], the five land cover types are defined to represent different impact levels of human activity and vegetation resilience to some extent (Figure 2).
The differences between PP and the other four land cover types are defined as the human impacts. The analysis results showed that the distinctions of EVI among the five land cover types were very obvious, but the differences of LOS among the five land cover types were not so regular (Figure 4). On the one hand, these results partly confirm that the setting of land cover type is basically in line with the laws of human impact and vegetation restoration; on the other hand, these results also imply that the relevant work is far from enough, and needs to be further extended as both human impact and vegetation resilience are hard to exactly quantify.
Many studies have shown that human activities had a negative impact on vegetation cover due to the increase of impervious surfaces but a positive impact on growth length due to the increase of the changing urban environment [18,19,55,56,57]. All these studies provide basic supports for our study assumption, and our results are also essentially or partly consistent with these conclusions. Correspondingly, for the biogeophysical parameter albedo, it is generally believed that values will increase in urban areas, thereby reflecting more solar radiation and reducing the energy source, while the values may also decrease due to the effect of building shadow [6,58].
However, this study showed that, compared with PP, the other four land cover types had less EVI and longer LOS than PP, i.e., human activities reduced EVI but extended LOS in the four land cover types affected by human activities. This might be due to the impacts of factors, such as the urban heat island effect and human management on vegetation [19,41,59]. Although the albedo of natural vegetation (PP) was lower and the corresponding RF was larger, the RF in the four land cover types affected by human activities showed a significant increase, and the RF increment was also larger. These results demonstrated that the involvement of human activities will significantly enhance the RF over time. However, this study provides a simple analysis on RF and land cover types affected by human activity. In the future, a process model with dynamic vegetation and atmospheric circulation may be necessary to obtain a quantitative impact value of human activities on RF.
Previous studies used the multi-year average solar radiation to replace annual solar radiation to calculate the annual RF [31]. In Beijing, we also calculated the radiative forcing ( RF ¯ ) using the multi-year average solar radiation to replace the annual solar radiation. The RF ¯ only reflected the albedo change but ignored the change of solar radiation. However, the RF ¯ (0.828 W/m2) was slightly more than the RF (0.796 W/m2). It should be noted that although this study used annual solar radiation data, the data sources used in this study were not uniform and their spatial resolutions were different, which might have an impact on our results.
In general, at the kilometer level (or 500 m in this study), mixed pixels always exist. Given that urban area occupies a large proportion in Beijing, the atmospheric conditions in urban, suburban, and neighboring rural areas are all impacted by human activities [20,60]. Furthermore, the areas of anthropogenic impacts on vegetation and albedo are much larger than the urban boundary itself [19,55,57,61]. The impacts of human activities, such as urbanization, are often reflected on a larger scale. A regional climate model can simulate the climatic effects of the underlying surface changes at a mesoscale resolution [24,62]. Some scholars have used the relatively coarse-resolution remote sensing data (0.5° resolution) to study the effects of human influence on vegetation phenology and production, as well [19,20], but the land cover changes within a pixel cannot be checked.
In fact, it is important to distinguish the different effects of vegetation and non-vegetation factors (such as impervious layers) on the albedo within mixed pixels. For example, improving vegetation coverage and building asphalt roads (impervious layers with low albedo) may both reduce albedo, but they have very different effects on the regional energy budgets. Judging from our study data, both EVI and LOS within the mixed pixels with negligible vegetation will be small enough. We can think of these gridcells as NODATA. However, theoretically, EVI and LOS can only reflect vegetation information. In a mixed pixel, in addition to the vegetation element, there are other elements to consider (such as water bodies, roads, squares, buildings, etc.).
When the area proportion of vegetation in a mixed pixel is negligible or there is no vegetation, the change in albedo corresponding to this pixel will be irrelevant to vegetation. This is an important reason why the relationship between vegetation and albedo in this study is not always significant. This gives us a hint that the results of this study may be more reliable in pixels with a larger EVI or areas with larger vegetation coverage; however, this basic conclusion cannot be fully confirmed in our study: Figure 9 shows that the EVI in urban areas (with very small EVIs) is significantly correlated with albedo. This may mean that the interferences of non-vegetation factors on albedo cannot be ignored, or that the two vegetation indicators (EVI and LOS) used in this study cannot fully reflect all vegetation characteristics, or that there are many differences in the sensitivity of various vegetation types (such as trees, shrubs, grasses) to albedo.
Therefore, climate effects corresponding to complex land cover change should be deeply analyzed on a fine-scale in the future. In addition, given that some anomalies may affect the data accuracy and that the land cover parameters vary obviously within a year, a data quality control and a seasonal analysis would be better to indicate our findings in this study. In view of this, the specific values of this study should be carefully understood.

5. Conclusions

Under the impacts of human activities, the land cover pattern in Beijing has undergone significant changes, especially in croplands and urban areas. Urban areas grew by 517 km2, and the area change rate was 41.1% from 2000 to 2015. The vegetation in different land cover types had different growth conditions. The mean and trend values of EVI in PP, which was less affected by human activities, were larger than that in the four land cover types affected by human activities. The LOS in Beijing extended significantly (P < 0.05) in the human-affected land cover type OU, UE, and MP, compared with PP. The difference in the vegetation growth status among various land cover types in Beijing was reflected in the surface albedo, and the RF was thus affected by the albedo change.
Overall, the decrease of albedo reduced the reflection of solar radiation, and human activity increased the radiant energy input. The mean RF differences between 2001–2003 and 2013–2015 showed that the RF increment in PP was the smallest, 0.01 W/m2, while the RF increments in the other four human-affected land cover types were all much larger than that in PP (with a mean increment of 0.92 W/m2). Therefore, from the perspective of the radiation budget, human activities have a positive radiative forcing effect. This study emphasizes the importance of land biogeophysical parameters, and our findings also contribute to the physical mechanism of the urban heat island effect.

Author Contributions

Conceptualization, Y.C., X.T., G.Z., and J.D.; methodology, X.T., Y.C., and N.L.; software, X.T. and Y.F.; formal analysis, Y.C., N.L., Y.F., X.L., Y.R., and M.L.; writing-original draft preparation, Y.C. and X.T.; writing-review and editing, Y.C. and G.Z.; supervision, J.D; funding acquisition, Y.C. All authors have read and agreed to the published version of the manuscript

Funding

This research was funded by Natural Natural Science Foundation of China [41671425, 41401504, and 41701501], Scientific Research Start-up Funding of Special Talent Zone in Henan University (Zhaodong Feng), and Key Research Program of Frontier Sciences by the Chinese Academy of Sciences [QYZDB-SSW-DQC005].

Acknowledgments

The authors acknowledge the Natural Resources and Environment Center (Chinese Academy of Sciences) and NASA’s Land Processes Distributed Active Archive Center (LP DAAC, https://modis.gsfc.nasa.gov/data/) for providing land use data and MODIS products. We also thank Leonie Seabrook, PhD, from Liwen Bianji, Edanz Group China (www.liwenbianji.cn/ac), for editing the English text of a draft of this manuscript.

Conflicts of Interest

The authors declare no conflict of interest.

References

  1. Meyer, W.B.; Turner, B.L. Human population growth and global land-use/cover change. Annu. Rev. Ecol. Syst. 1992, 23, 39–61. [Google Scholar] [CrossRef]
  2. Steffen, W.; Sanderson, R.A.; Tyson, P.D.; Jager, J.; Matson, P.A.; Moore, B.; Oldfield, F.; Richardson, K.; Schellnhuber, H.-J.; Turner, B.L.; et al. Global Change and the Earth System: A Planet under Pressure; Springer: Berlin/Heidelberg, Germany, 2005. [Google Scholar]
  3. Quine, T.A.; Brown, A.G. Fluvial processes and environmental change. In Understanding the Changing Planet, Strategic Directions for the Geographical Sciences; The National Academies Press: Pittsburgh, PA, USA, 1999; p. 413. [Google Scholar]
  4. Cui, Y.; Liu, J.; Xu, X.; Dong, J.; Li, N.; Fu, Y.; Lu, H.; Xia, H.; Si, B.; Xiao, X. Accelerating cities in an unsustainable landscape: Urban expansion and cropland occupation in China, 1990–2030. Sustainability 2019, 11, 2283. [Google Scholar] [CrossRef] [Green Version]
  5. Steffen, W.; Rockström, J.; Richardson, K.; Lenton, T.M.; Folke, C.; Liverman, D.; Summerhayes, C.P.; Barnosky, A.D.; Cornell, S.E.; Crucifix, M. Trajectories of the Earth system in the anthropocene. Proc. Natl. Acad. Sci. USA 2018, 115, 8252–8259. [Google Scholar] [CrossRef] [Green Version]
  6. Cui, Y.; Liu, J.; Hu, Y.; Wang, J.; Kuang, W. Modeling the radiation balance of different urban underlying surfaces. Chin. Sci. Bull. 2012, 57, 1046–1054. [Google Scholar] [CrossRef] [Green Version]
  7. Stephens, G.L.; O’Brien, D.; Webster, P.J.; Pilewski, P.; Kato, S.; Li, J. The albedo of Earth. Rev. Geophys. 2015, 53, 141–163. [Google Scholar] [CrossRef] [Green Version]
  8. Jones, A.D.; Calvin, K.V.; Collins, W.D.; Edmonds, J. Accounting for radiative forcing from albedo change in future global land-use scenarios. Clim. Chang. 2015, 131, 691–703. [Google Scholar] [CrossRef] [Green Version]
  9. Akbari, H.; Menon, S.; Rosenfeld, A. Global cooling: Increasing world-wide urban albedos to offset CO2. Clim. Chang. 2009, 94, 275–286. [Google Scholar] [CrossRef]
  10. Zhai, J.; Liu, R.; Liu, J.; Zhao, G.; Lin, H. Radiative forcing over China due to albedo change caused by land cover change during 1990–2010. Acta Geogr. Sin. 2014, 24, 789–801. [Google Scholar] [CrossRef] [Green Version]
  11. Blok, D.; Schaepmanstrub, G.; Bartholomeus, H.; Heijmans, M.M.P.D.; Maximov, T.C.; Berendse, F. The response of Arctic vegetation to the summer climate: Relation between shrub cover, NDVI, surface albedo and temperature. Proc. SPIE 2011, 250, 612814–612816. [Google Scholar] [CrossRef] [Green Version]
  12. Betts, R.A.; Falloon, P.D.; Goldewijk, K.K.; Ramankutty, N. Biogeophysical effects of land use on climate: Model simulations of radiative forcing and large-scale temperature change. Agr. For. Meteorol. 2007, 142, 216–233. [Google Scholar] [CrossRef]
  13. Burakowski, E.; Tawfik, A.; Ouimette, A.; Lepine, L.; Novick, K.; Ollinger, S.; Zarzycki, C.; Bonan, G. The role of surface roughness, albedo, and Bowen ratio on ecosystem energy balance in the Eastern United States. Agr. For. Meteorol. 2018, 249, 367–376. [Google Scholar] [CrossRef]
  14. Jasinski, M.F. Sensitivity of the normalized difference vegetation index to subpixel canopy cover, soil albedo, and pixel scale. Remote Sens. Environ. 1990, 32, 169–187. [Google Scholar] [CrossRef]
  15. Li, Q.; Ma, M.; Wu, X.; Hong, Y. Snow cover and vegetation-induced decrease in global albedo from 2002 to 2016. J. Geophys. Res. Atmos. 2018, 123, 124–138. [Google Scholar] [CrossRef] [Green Version]
  16. Williamson, S.N.; Barrio, I.C.; Hik, D.S.; Gamon, J.A. Phenology and species determine growing-season albedo increase at the altitudinal limit of shrub growth in the sub-Arctic. Glob. Chang. Biol. 2016, 22, 3621–3631. [Google Scholar] [CrossRef] [PubMed]
  17. Richardson, A.D.; Keenan, T.F.; Migliavacca, M.; Ryu, Y.; Sonnentag, O.; Toomey, M. Climate change, phenology, and phenological control of vegetation feedbacks to the climate system. Agr. For. Meteorol. 2013, 169, 156–173. [Google Scholar] [CrossRef]
  18. Cui, Y.; Xiao, X.; Doughty, R.; Qin, Y.; Liu, S.; Li, N.; Zhao, G.; Dong, J. The relationships between urban-rural temperature difference and vegetation in eight cities of the Great Plains. Front. Earth Sci. 2019, 13, 290–302. [Google Scholar] [CrossRef]
  19. Cui, Y.; Xiao, X.; Zhang, Y.; Dong, J.; Qin, Y.; Russell, B.D.; Zhang, G.; Wang, J.; Wu, X.; Qin, Y.; et al. Temporal consistency between gross primary production and solarinduced chlorophyll fluorescence in the ten most populous megacity areas over years. Sci. Rep. 2017, 7, 14963. [Google Scholar] [CrossRef]
  20. Zhang, X.; Friedl, M.A.; Schaaf, C.B.; Strahler, A.H.; Schneider, A. The footprint of urban climates on vegetation phenology. Geophys. Res. Lett. 2004, 31, 179–206. [Google Scholar] [CrossRef]
  21. Yang, J.; Sun, J.; Ge, Q.; Li, X. Assessing the impacts of urbanization-associated green space on urban land surface temperature: A case study of Dalian, China. Urban For. Urban Green. 2017, 22, 1–10. [Google Scholar] [CrossRef]
  22. He, B.; Zhao, Z.; Shen, L.; Wang, H.; Li, L. An approach to examining performances of cool/hot sources in mitigating/enhancing land surface temperature under different temperature backgrounds based on Landsat 8 image. Sustain. Cities Soc. 2019, 44, 416–427. [Google Scholar] [CrossRef]
  23. Zhao, G.; Dong, J.; Cui, Y.; Liu, J.; Zhai, J.; He, T.; Zhou, Y.; Xiao, X. Evapotranspiration-dominated biogeophysical warming effect of urbanization in the Beijing-Tianjin-Hebei region, China. Clim. Dyn. 2018, 52, 1231–1245. [Google Scholar] [CrossRef]
  24. Cui, Y.; Liu, J.; Zhang, X.; Qin, Y.; Dong, J. Modeling urban sprawl effects on regional warming in Beijing-Tianjin-Tangshan urban agglomeration. Acta Ecol. Sin. 2015, 35, 993–1003. [Google Scholar]
  25. Eyring, V.; Bony, S.; Meehl, G.A.; Senior, C.A.; Stevens, B.; Stouffer, R.J.; Taylor, K.E. Overview of the coupled model intercomparison project phase 6 (CMIP6) experimental design and organization. Geosci. Model Dev. 2016, 9, 1937–1958. [Google Scholar] [CrossRef] [Green Version]
  26. Joos, F.; Roth, R.; Fuglestvedt, J.S.; Peters, G.P.; Enting, I.G.; von Bloh, W.; Brovkin, V.; Burke, E.J.; Eby, M.; Edwards, N.R.; et al. Carbon dioxide and climate impulse response functions for the computation of greenhouse gas metrics: A multi-model analysis. Atmos. Chem. Phys. 2013, 13, 2793–2825. [Google Scholar] [CrossRef] [Green Version]
  27. Prestele, R.; Arneth, A.; Bondeau, A.; de Noblet-Ducoudre, N.; Pugh, T.A.M.; Sitch, S.; Stehfest, E.; Verburg, P.H. Current challenges of implementing anthropogenic land-use and land-cover change in models contributing to climate change assessments. Earth Syst. Dyn. 2017, 8, 369–386. [Google Scholar] [CrossRef] [Green Version]
  28. Bonan, G.B.; Doney, S.C. Climate, ecosystems, and planetary futures: The challenge to predict life in Earth system models. Science 2018, 359, 533. [Google Scholar] [CrossRef] [Green Version]
  29. Barnes, C.A.; Roy, D.P. Radiative forcing over the conterminous United States due to contemporary land cover land use change and sensitivity to snow and interannual albedo variability. J. Geophys. Res. Biogeosci. 2010, 115. [Google Scholar] [CrossRef] [Green Version]
  30. IPCC. Climate Change 2007: The Physical Science Basis: Contribution of Working group I to the Fourth Assessment Report of the Intergovernmental Panel on Climate Change; Solomon, S., Qin, D., Manning, M., Chen, Z., Marquis, M., Averyt, K.B., Tignor, M., Miller, H.L., Eds.; Cambridge University Press: Cambridge, UK; New York, NY, USA, 2007. [Google Scholar]
  31. Schwaab, J.; Bavay, M.; Davin, E.; Hagedorn, F.; Huesler, F.; Lehning, M.; Schneebeli, M.; Thuerig, E.; Bebi, P. Carbon storage versus albedo change: Radiative forcing of forest expansion in temperate mountainous regions of Switzerland. Biogeosciences 2015, 12, 467–487. [Google Scholar] [CrossRef] [Green Version]
  32. Beck, H.E.; Zimmermann, N.E.; McVicar, T.R.; Vergopolan, N.; Berg, A.; Wood, E.F. Present and future Köppen-Geiger climate classification maps at 1-km resolution. Sci. Data 2018, 5, 180214. [Google Scholar] [CrossRef] [Green Version]
  33. Liu, J.Y.; Kuang, W.H.; Zhang, Z.X.; Xu, X.L.; Qin, Y.W.; Ning, J.; Zhou, W.C.; Zhang, S.W.; Li, R.D.; Yan, C.Z.; et al. Spatiotemporal characteristics, patterns, and causes of land-use changes in China since the late 1980s. J. Geogr. Sci. 2014, 24, 195–210. [Google Scholar] [CrossRef]
  34. Liu, J.Y.; Liu, M.L.; Tian, H.Q.; Zhuang, D.F.; Zhang, Z.X.; Zhang, W.; Tang, X.M.; Deng, X.Z. Spatial and temporal patterns of China’s cropland during 1990–2000: An analysis based on Landsat TM data. Remote Sens. Environ. 2005, 98, 442–456. [Google Scholar] [CrossRef]
  35. Jiang, C.; Ryu, Y. Multi-scale evaluation of global gross primary productivity and evapotranspiration products derived from Breathing Earth System Simulator (BESS). Remote Sens. Environ. 2016, 186, 528–547. [Google Scholar] [CrossRef]
  36. Schaaf, C.; Wang, Z. MCD43A1 MODIS/Terra+Aqua BRDF/Albedo Model Parameters Daily L3 Global-500m V006. In NASA EOSDIS Land Processes DAAC; NASA: Washington, DC, USA, 2015. [Google Scholar] [CrossRef]
  37. Lewis, P.; Barnsley, M.J. Influence of the sky radiance distribution on various formulations of the earth surface albedo. In Proceedings of the 6th International Symposium on Physical Measurements and Signatures in Remote Sensing, Mesures Physiques et Signatures en Teledetection, edited, Agence Spatiale Européenne, Val d’Isere, France, 17–21 January 1994; pp. 707–716. [Google Scholar]
  38. Li, Y.; Zhao, M.; Motesharrei, S.; Mu, Q.; Kalnay, E.; Li, S. Local cooling and warming effects of forests based on satellite observations. Nat. Commun. 2015, 6, 6603. [Google Scholar] [CrossRef] [PubMed] [Green Version]
  39. Glenn, E.P.; Huete, A.R.; Nagler, P.L.; Nelson, S.G. Relationship between remotely-sensed vegetation indices, canopy attributes and plant physiological processes: What vegetation indices can and cannot tell us about the landscape. Sensors 2008, 8, 2136–2160. [Google Scholar] [CrossRef] [Green Version]
  40. Matsushita, B.; Yang, W.; Chen, J.; Onda, Y.; Qiu, G. Sensitivity of the Enhanced Vegetation Index (EVI) and Normalized Difference Vegetation Index (NDVI) to topographic effects: A case study in high-density cypress forest. Sensors 2007, 7, 2636–2651. [Google Scholar] [CrossRef] [Green Version]
  41. Zhang, X.; Friedl, M.A.; Schaaf, C.B.; Strahler, A.H.; Hodges, J.C.; Gao, F.; Reed, B.C.; Huete, A.R. Monitoring vegetation phenology using MODIS. Remote Sens. Environ. 2003, 84, 471–475. [Google Scholar] [CrossRef]
  42. Didan, K. MOD13A1 MODIS/Terra Vegetation Indices 16-Day L3 Global 500m SIN Grid V006. In NASA EOSDIS Land Processes; NASA: Washington, DC, USA, 2015. [Google Scholar] [CrossRef]
  43. Friedl, M.; Gray, J.; Sulla-Menashe, D. MCD12Q2 MODIS/Terra+Aqua Land Cover Dynamics Yearly L3 Global 500m SIN Grid V006. In NASA EOSDIS Land Processes DAAC; NASA: Washington, DC, USA, 2019. [Google Scholar] [CrossRef]
  44. Morecroft, M.D.; Duffield, S.; Harley, M.; Pearce-Higgins, J.W.; Stevens, N.; Watts, O.; Whitaker, J. Measuring the success of climate change adaptation and mitigation in terrestrial ecosystems. Science 2019, 366, eaaw9256. [Google Scholar] [CrossRef] [Green Version]
  45. Sanderson, E.W.; Jaiteh, M.; Levy, M.A.; Redford, K.H.; Wannebo, A.V.; Woolmer, G. The human footprint and the last of the wild. Bioscience 2002, 52, 891–904. [Google Scholar] [CrossRef]
  46. De Keersmaecker, W.; Lhermitte, S.; Tits, L.; Honnay, O.; Somers, B.; Coppin, P. A model quantifying global vegetation resistance and resilience to short-term climate anomalies and their relationship with vegetation cover. Glob. Ecol. Biogeogr. 2015, 24, 539–548. [Google Scholar] [CrossRef]
  47. Lavorel, S. Ecological diversity and resilience of Mediterranean vegetation to disturbance. Divers. Distrib. 1999, 5, 3–13. [Google Scholar] [CrossRef]
  48. IPCC. Climate Change 2001: The Scientific Basis: Contribution of Working Group I to the Third Assessment Report of the Intergovernmental Panel on Climate Change; Houghton, J.T., Ding, Y., Griggs, D.J., Noguer, M., van der Linden, P.J., Dai, X., Maskell, K., Johnson, C.A., Eds.; Cambridge University Press: Cambridge, UK; New York, NY, USA, 2001. [Google Scholar]
  49. Forster, P.; Ramaswamy, V.; Artaxo, P.; Berntsen, T.; Betts, R.; Fahey, D.W.; Haywood, J.; Lean, J.; Lowe, D.C.; Myhre, G.; et al. Changes in atmospheric constituents and in radiative forcing. In Climate Change 2007: The Physical Science Basis: Contribution of Working Group I to the Fourth Assessment Report of the Intergovernmental Panel on Climate Change; Solomon, S., Qin, D., Manning, M., Chen, Z., Marquis, M., Averyt, K.B., Tignor, M., Miller, H.L., Eds.; Cambridge University Press: Cambridge, UK; New York, NY, USA, 2013. [Google Scholar]
  50. Munoz, I.; Campra, P.; Fernandez-Alba, A.R. Including CO2-emission equivalence of changes in land surface albedo in life cycle assessment. Methodology and case study on greenhouse agriculture. Int. J. Life Cycle Assess. 2010, 15, 672–681. [Google Scholar] [CrossRef]
  51. Bright, R.M.; Cherubini, F.; Stromman, A.H. Climate impacts of bioenergy: Inclusion of carbon cycle and albedo dynamics in life cycle impact assessment. Environ. Impact Assess. Rev. 2012, 37, 2–11. [Google Scholar] [CrossRef]
  52. Lenton, T.M.; Vaughan, N.E. The radiative forcing potential of different climate geoengineering options. Atmos. Chem. Phys. 2009, 9, 5539–5561. [Google Scholar] [CrossRef] [Green Version]
  53. Jiang, L.; Jiapaer, G.; Bao, A.; Guo, H.; Ndayisaba, F. Vegetation dynamics and responses to climate change and human activities in Central Asia. Sci. Total Environ. 2017, 599, 967–980. [Google Scholar] [CrossRef]
  54. Boussetta, S.; Balsamo, G.; Dutra, E.; Beljaars, A.; Albergel, C. Assimilation of surface albedo and vegetation states from satellite observations and their impact on numerical weather prediction. Remote Sens. Environ. 2015, 163, 111–126. [Google Scholar] [CrossRef] [Green Version]
  55. Churkina, G. The role of urbanization in the global carbon cycle. Front. Ecol. Evol. 2016, 3, 144. [Google Scholar] [CrossRef] [Green Version]
  56. Imhoff, M.L.; Bounoua, L.; DeFries, R.; Lawrence, W.T.; Stutzer, D.; Tucker, C.J.; Ricketts, T. The consequences of urban land transformation on net primary productivity in the United States. Remote Sens. Environ. 2004, 89, 434–443. [Google Scholar] [CrossRef]
  57. Zhou, D.; Zhao, S.; Zhang, L.; Sun, G.; Liu, Y. The footprint of urban heat island effect in China. Sci. Rep. 2015, 5, 11160. [Google Scholar] [CrossRef]
  58. Lee, S.; Ahn, J.; Kim, S.; Kim, H. Multiple albedo variation caused by the shadow effect of urban building and its impacts on the urban surface heat budget. J. Korean Earth Sci. Soc. 2010, 31, 738–748. [Google Scholar] [CrossRef]
  59. Dissanayake, D.M.S.L.B.; Morimoto, T.; Ranagalage, M.; Murayama, Y. Land-use/land-cover changes and their impact on surface urban heat islands: Case study of Kandy City, Sri Lanka. Climate 2019, 7, 99. [Google Scholar] [CrossRef] [Green Version]
  60. Romero-Lankao, P.; Gurney, K.R.; Seto, K.C.; Chester, M.; Duren, R.M.; Hughes, S.; Hutyra, L.R.; Marcotullio, P.; Baker, L.; Grimm, N.B. A critical knowledge pathway to low-carbon, sustainable futures: Integrated understanding of urbanization, urban areas, and carbon. Earths Future 2015, 2, 515–532. [Google Scholar] [CrossRef]
  61. Jin, M.; Dickinson, R.E.; Zhang, D. The footprint of urban areas on global climate as characterized by MODIS. J. Clim. 2005, 18, 1551–1565. [Google Scholar] [CrossRef]
  62. Zhang, X.; Dai, J.; Ge, Q. Spatial differences of changes in spring vegetation activities across Eastern China during 1982–2006. Acta Geogr. Sin. 2012, 67, 53–61. [Google Scholar]
Figure 1. Location of study area and land cover map in Beijing in 2015.
Remotesensing 12 00837 g001
Figure 2. Land cover types that take into account human activity and vegetation resilience in Beijing. Pure pixels (PP).
Remotesensing 12 00837 g002
Figure 3. Spatial pattern and statistical information of land cover in Beijing. a and b are the land cover information for 2000 and 2015, respectively; c is the five land cover types derived from land cover changes between 2000 and 2015.
Remotesensing 12 00837 g003
Figure 4. Statistical feature values of the five land cover types for enhanced vegetation index (EVI) and the length of season (LOS) during 2000 to 2015.
Remotesensing 12 00837 g004
Figure 5. Spatial pattern and temporal changes of enhanced vegetation index (EVI) in Beijing. a and b are the spatial patterns of annual trend and significant test (P value); c is the annual change with standard deviation (shadow zones with different colors) of various land cover types for EVI from 2000 to 2015.
Remotesensing 12 00837 g005
Figure 6. Relationship between pure pixels (PP) and other four land cover types for enhanced vegetation index (EVI).
Remotesensing 12 00837 g006
Figure 7. Spatial pattern and temporal changes of length of season (LOS) in Beijing. a and b are the spatial patterns of annual trend and significant test (P value); c is the annual changes with standard deviations (shadow zones with different colors) of various land cover types for LOS from 2000 to 2015.
Remotesensing 12 00837 g007
Figure 8. Relationship between pure pixels (PP) and other four land cover types for length of season (LOS).
Remotesensing 12 00837 g008
Figure 9. Relationships between the albedo and enhanced vegetation index (EVI), and the length of season (LOS). a is the relationship between albedo and EVI; b is the relationship between the albedo and LOS.
Remotesensing 12 00837 g009
Figure 10. Spatial pattern and temporal changes of surface albedo in Beijing. a and b are the spatial patterns of the annual trend and significance test (P value); c is the annual changes with standard deviations (shadow zones with different colors) of various land cover types for surface albedo from 2000 to 2015.
Remotesensing 12 00837 g010
Figure 11. Annual dynamics of radiative forcing (RF) from 2000 to 2015 (a) and RF increment between 2001–2003 and 2013–2015 (b) of various land cover types in Beijing.
Remotesensing 12 00837 g011
Table 1. Area of land cover types in Beijing in 2000 and 2015. The unit of area is km2.
Land Cover TypesArea in 2000Area in 2015
Urban areas12591776
Cropland51944619
Other land cover types995710015

