Operational Monitoring and Damage Assessment of Riverine Flood-2014 in the Lower Chenab Plain, Punjab, Pakistan, Using Remote Sensing and GIS Techniques

 ,
,  , ,
, ,  and
and
Abstract
:
1. Introduction
2. Materials and Methods
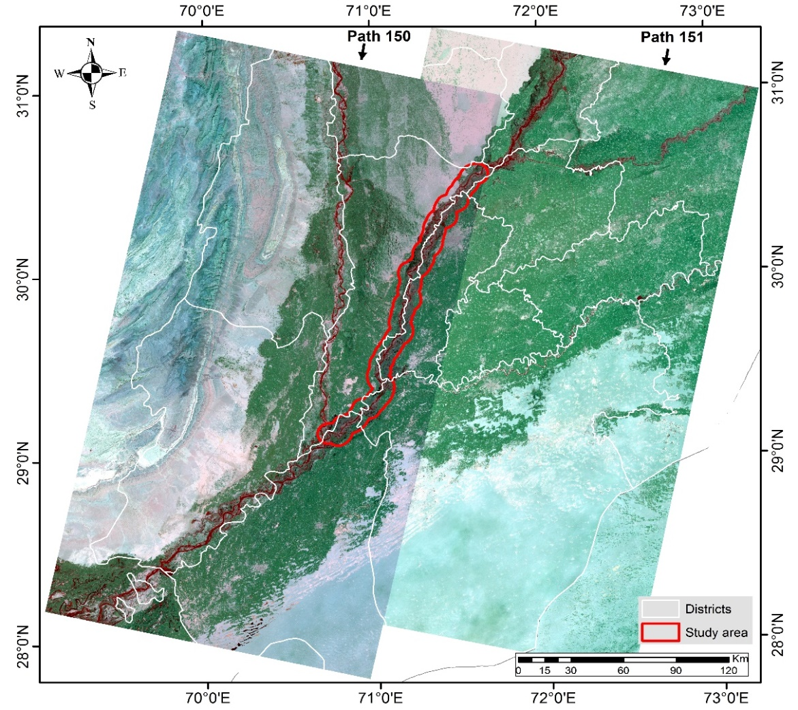
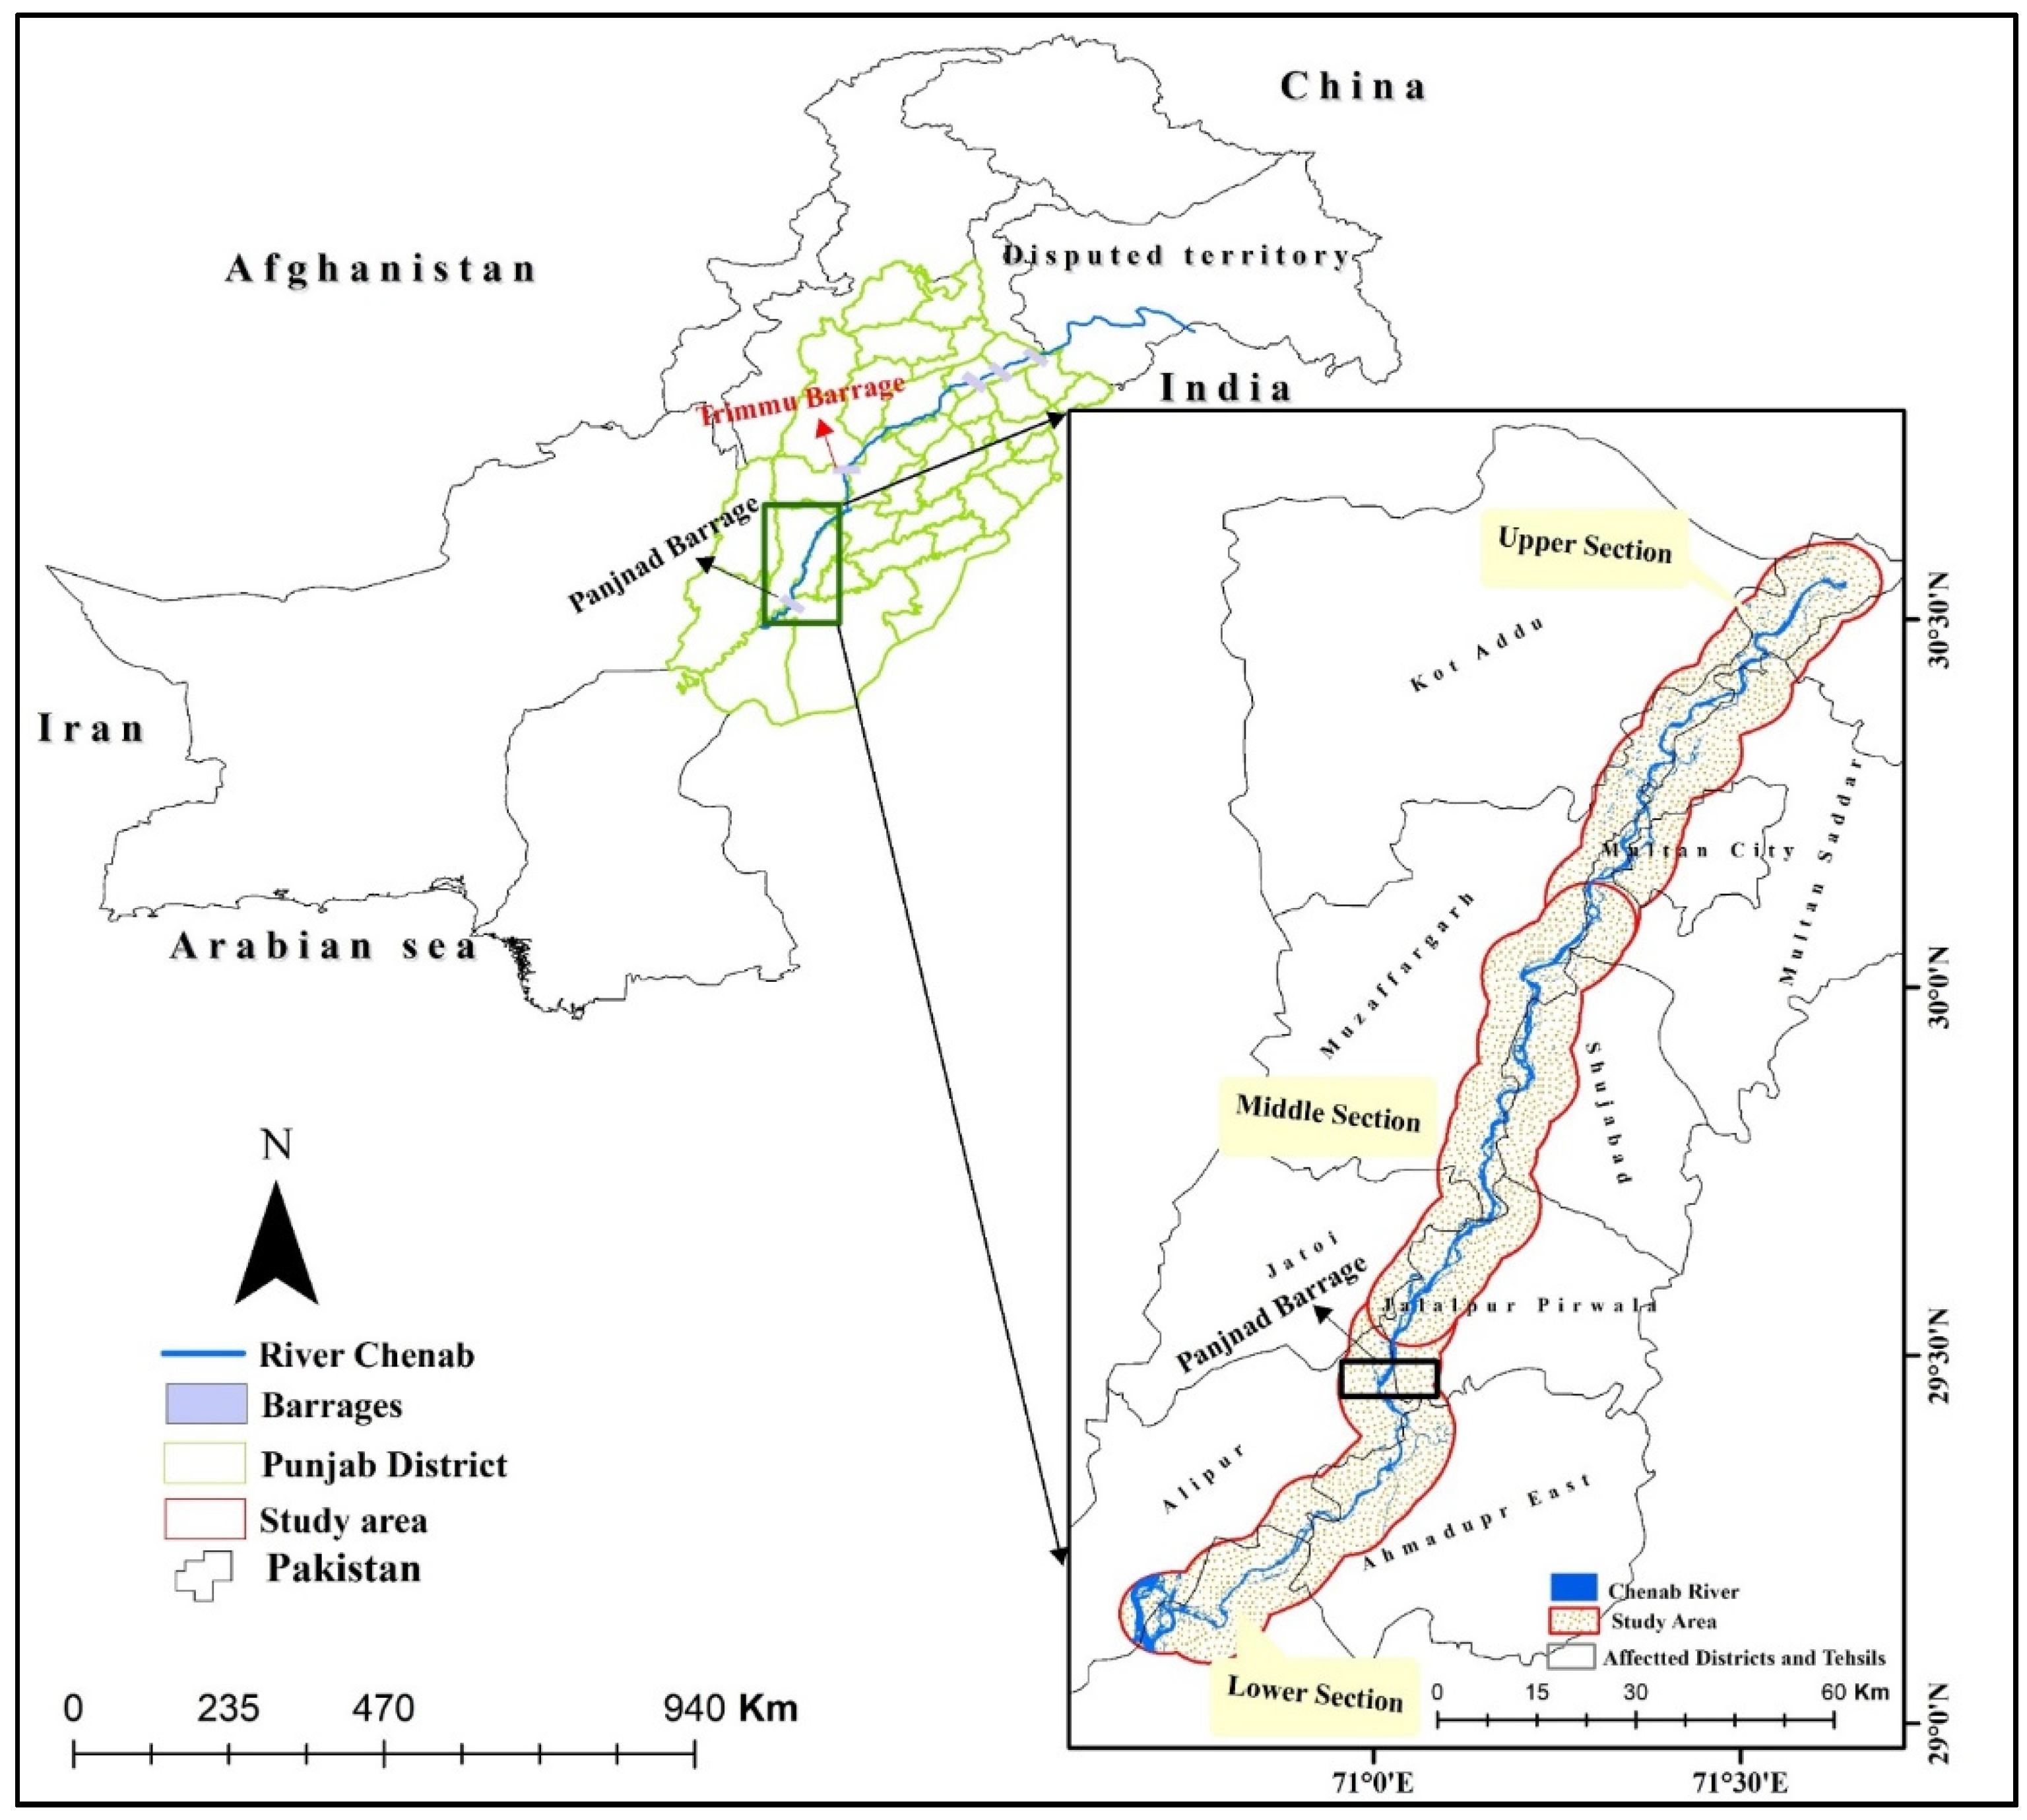
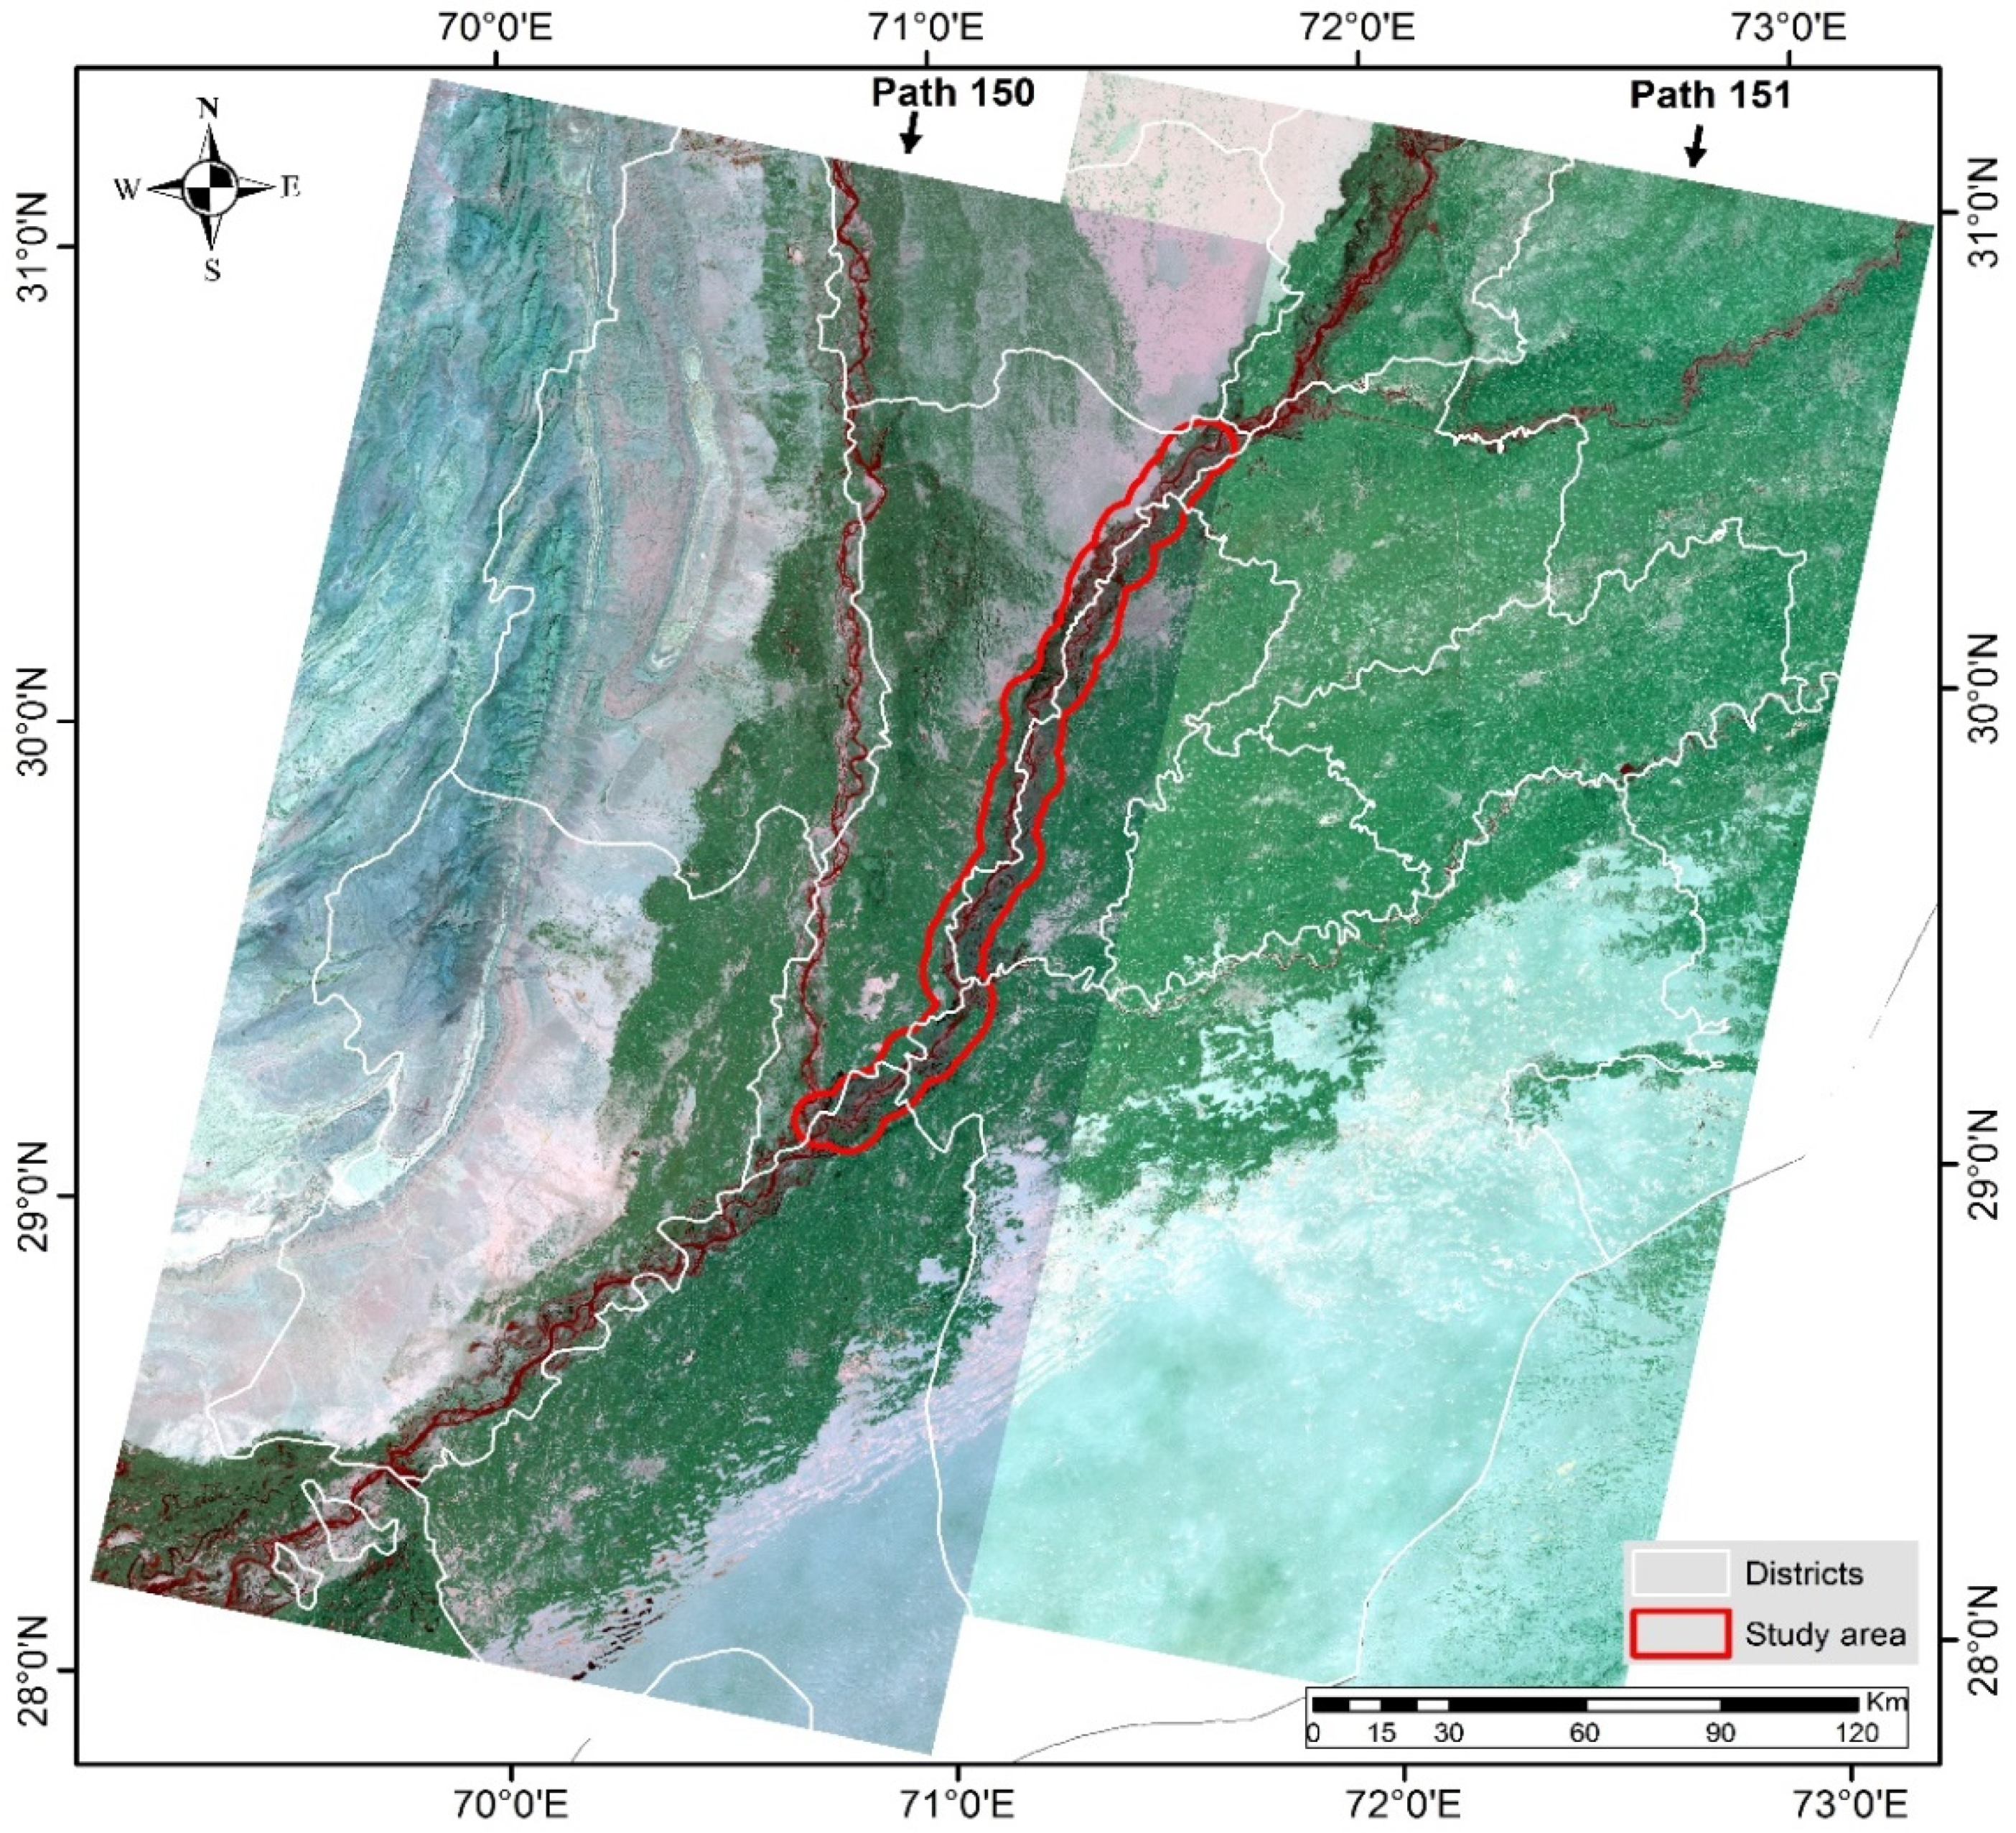
2.1. Study Area
2.2. Materials
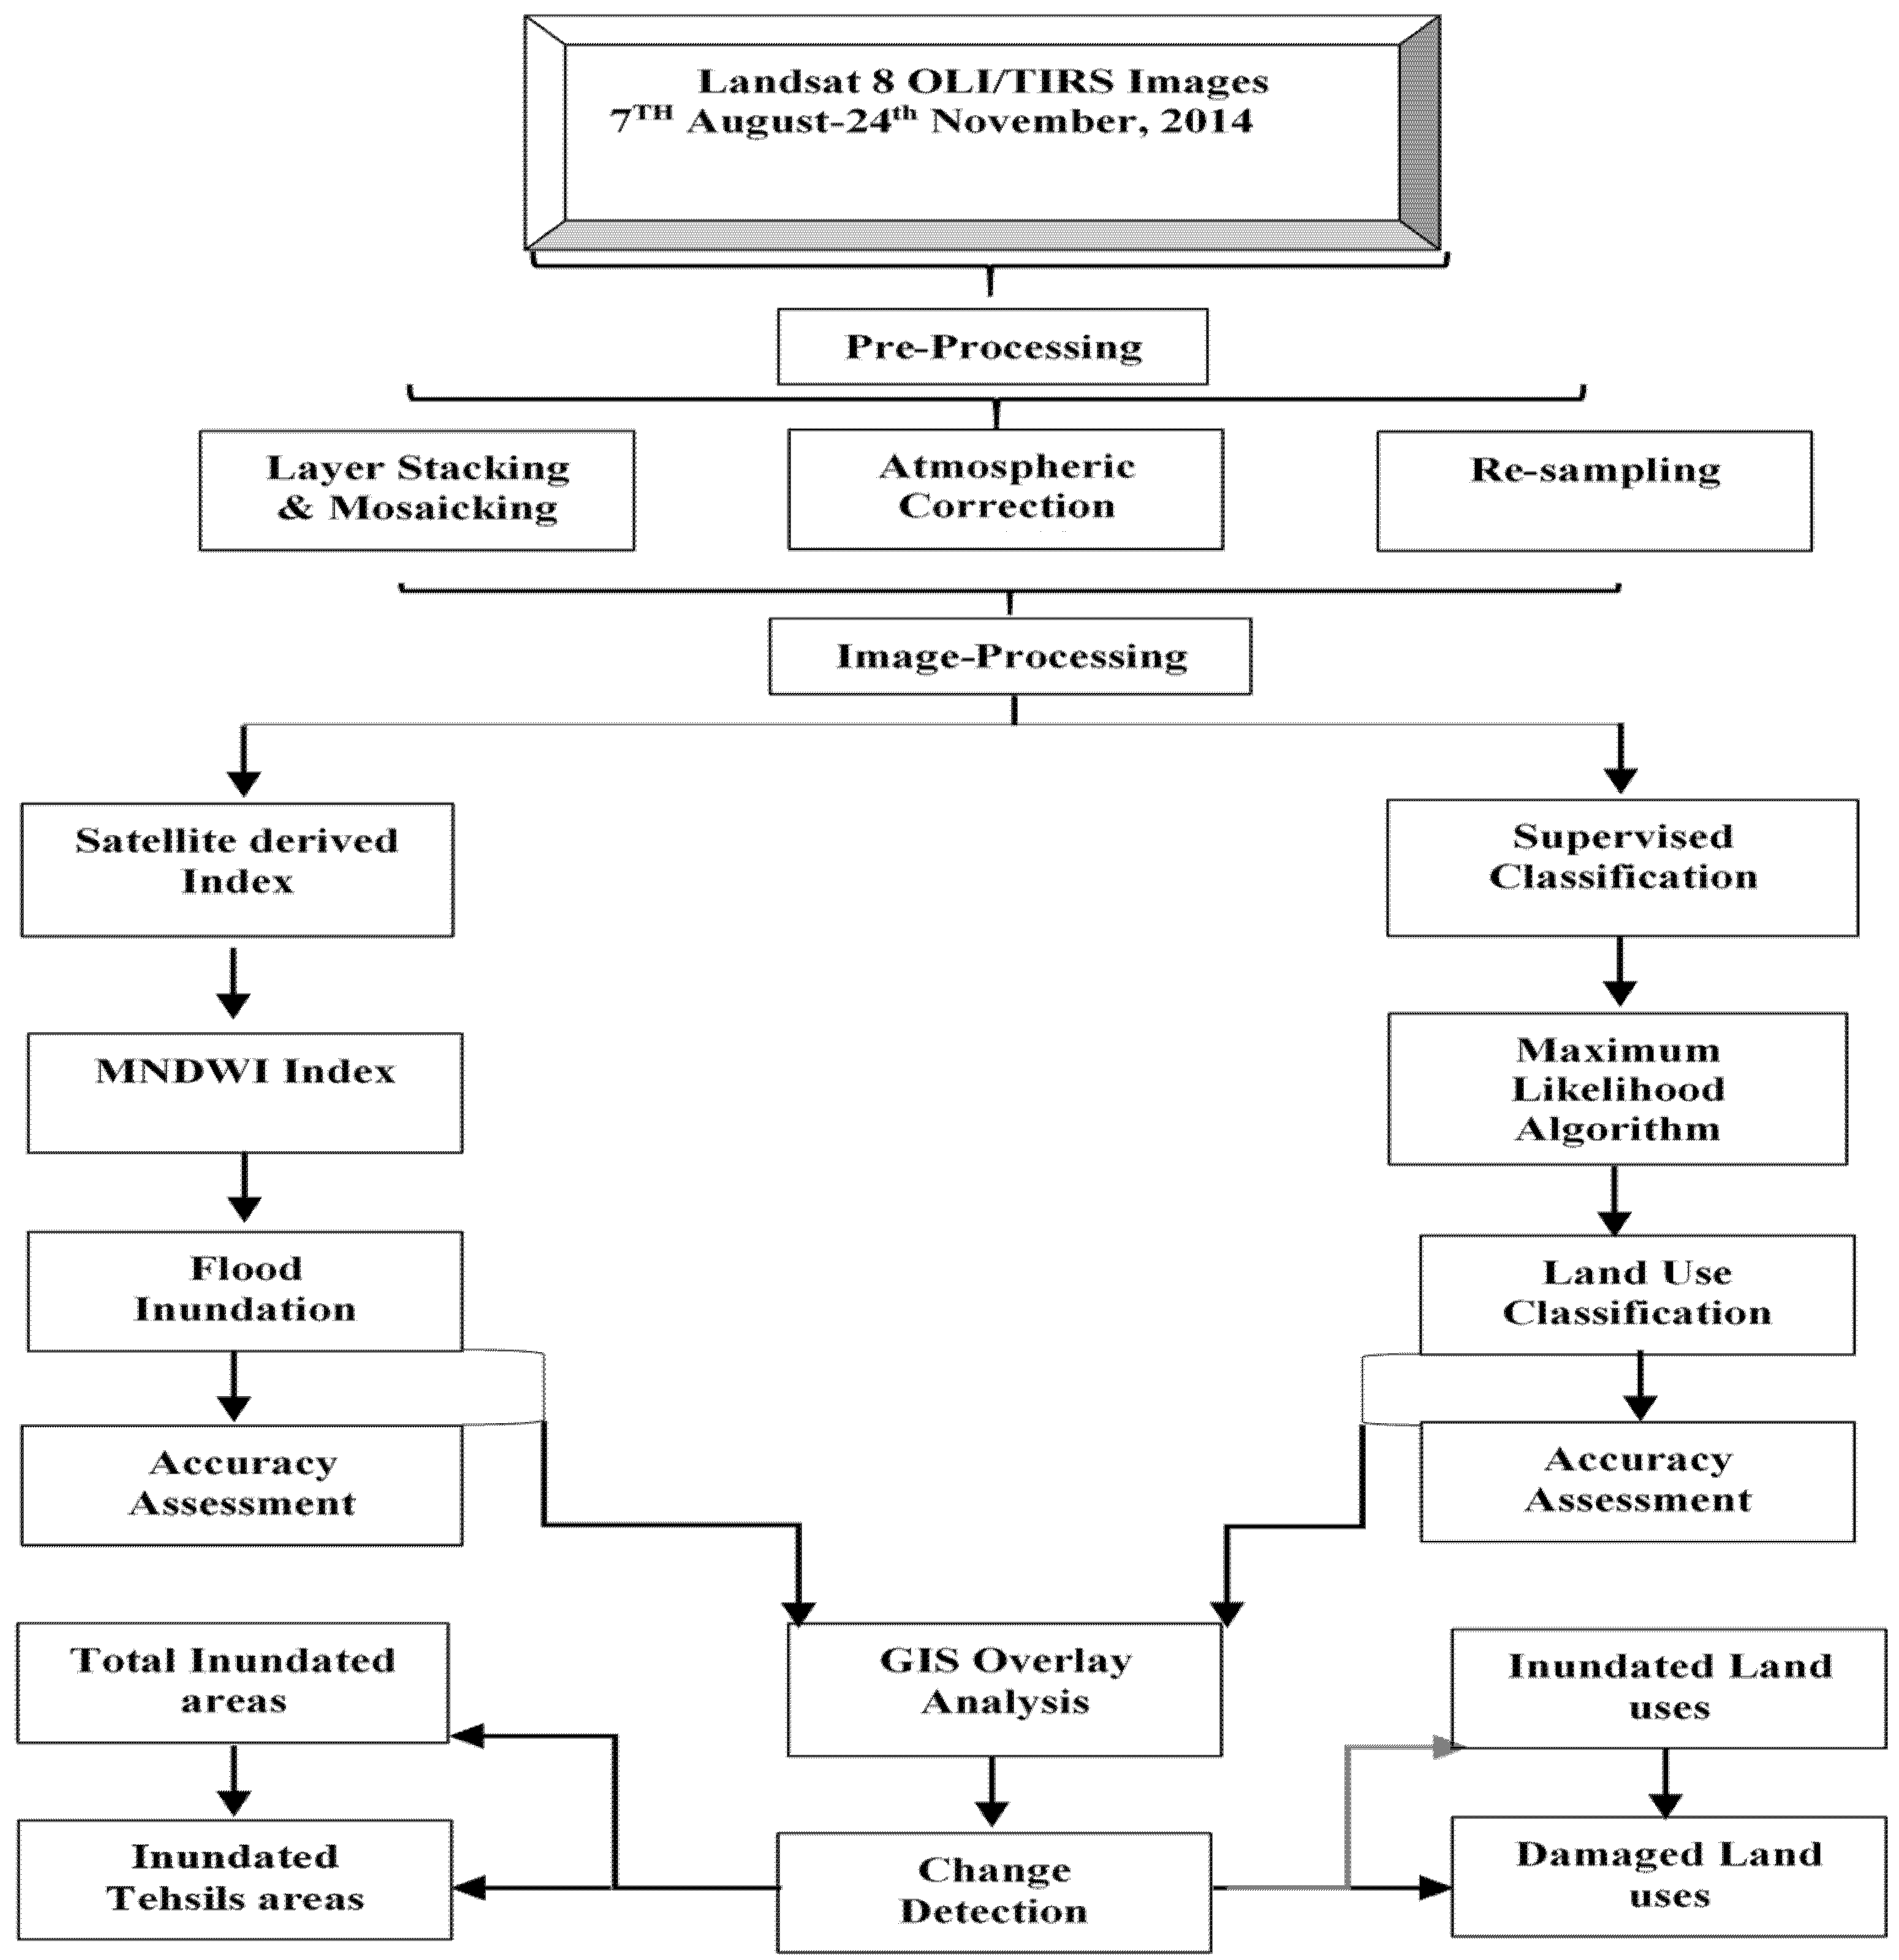
2.3. Methods
2.3.1. MNDWI Index
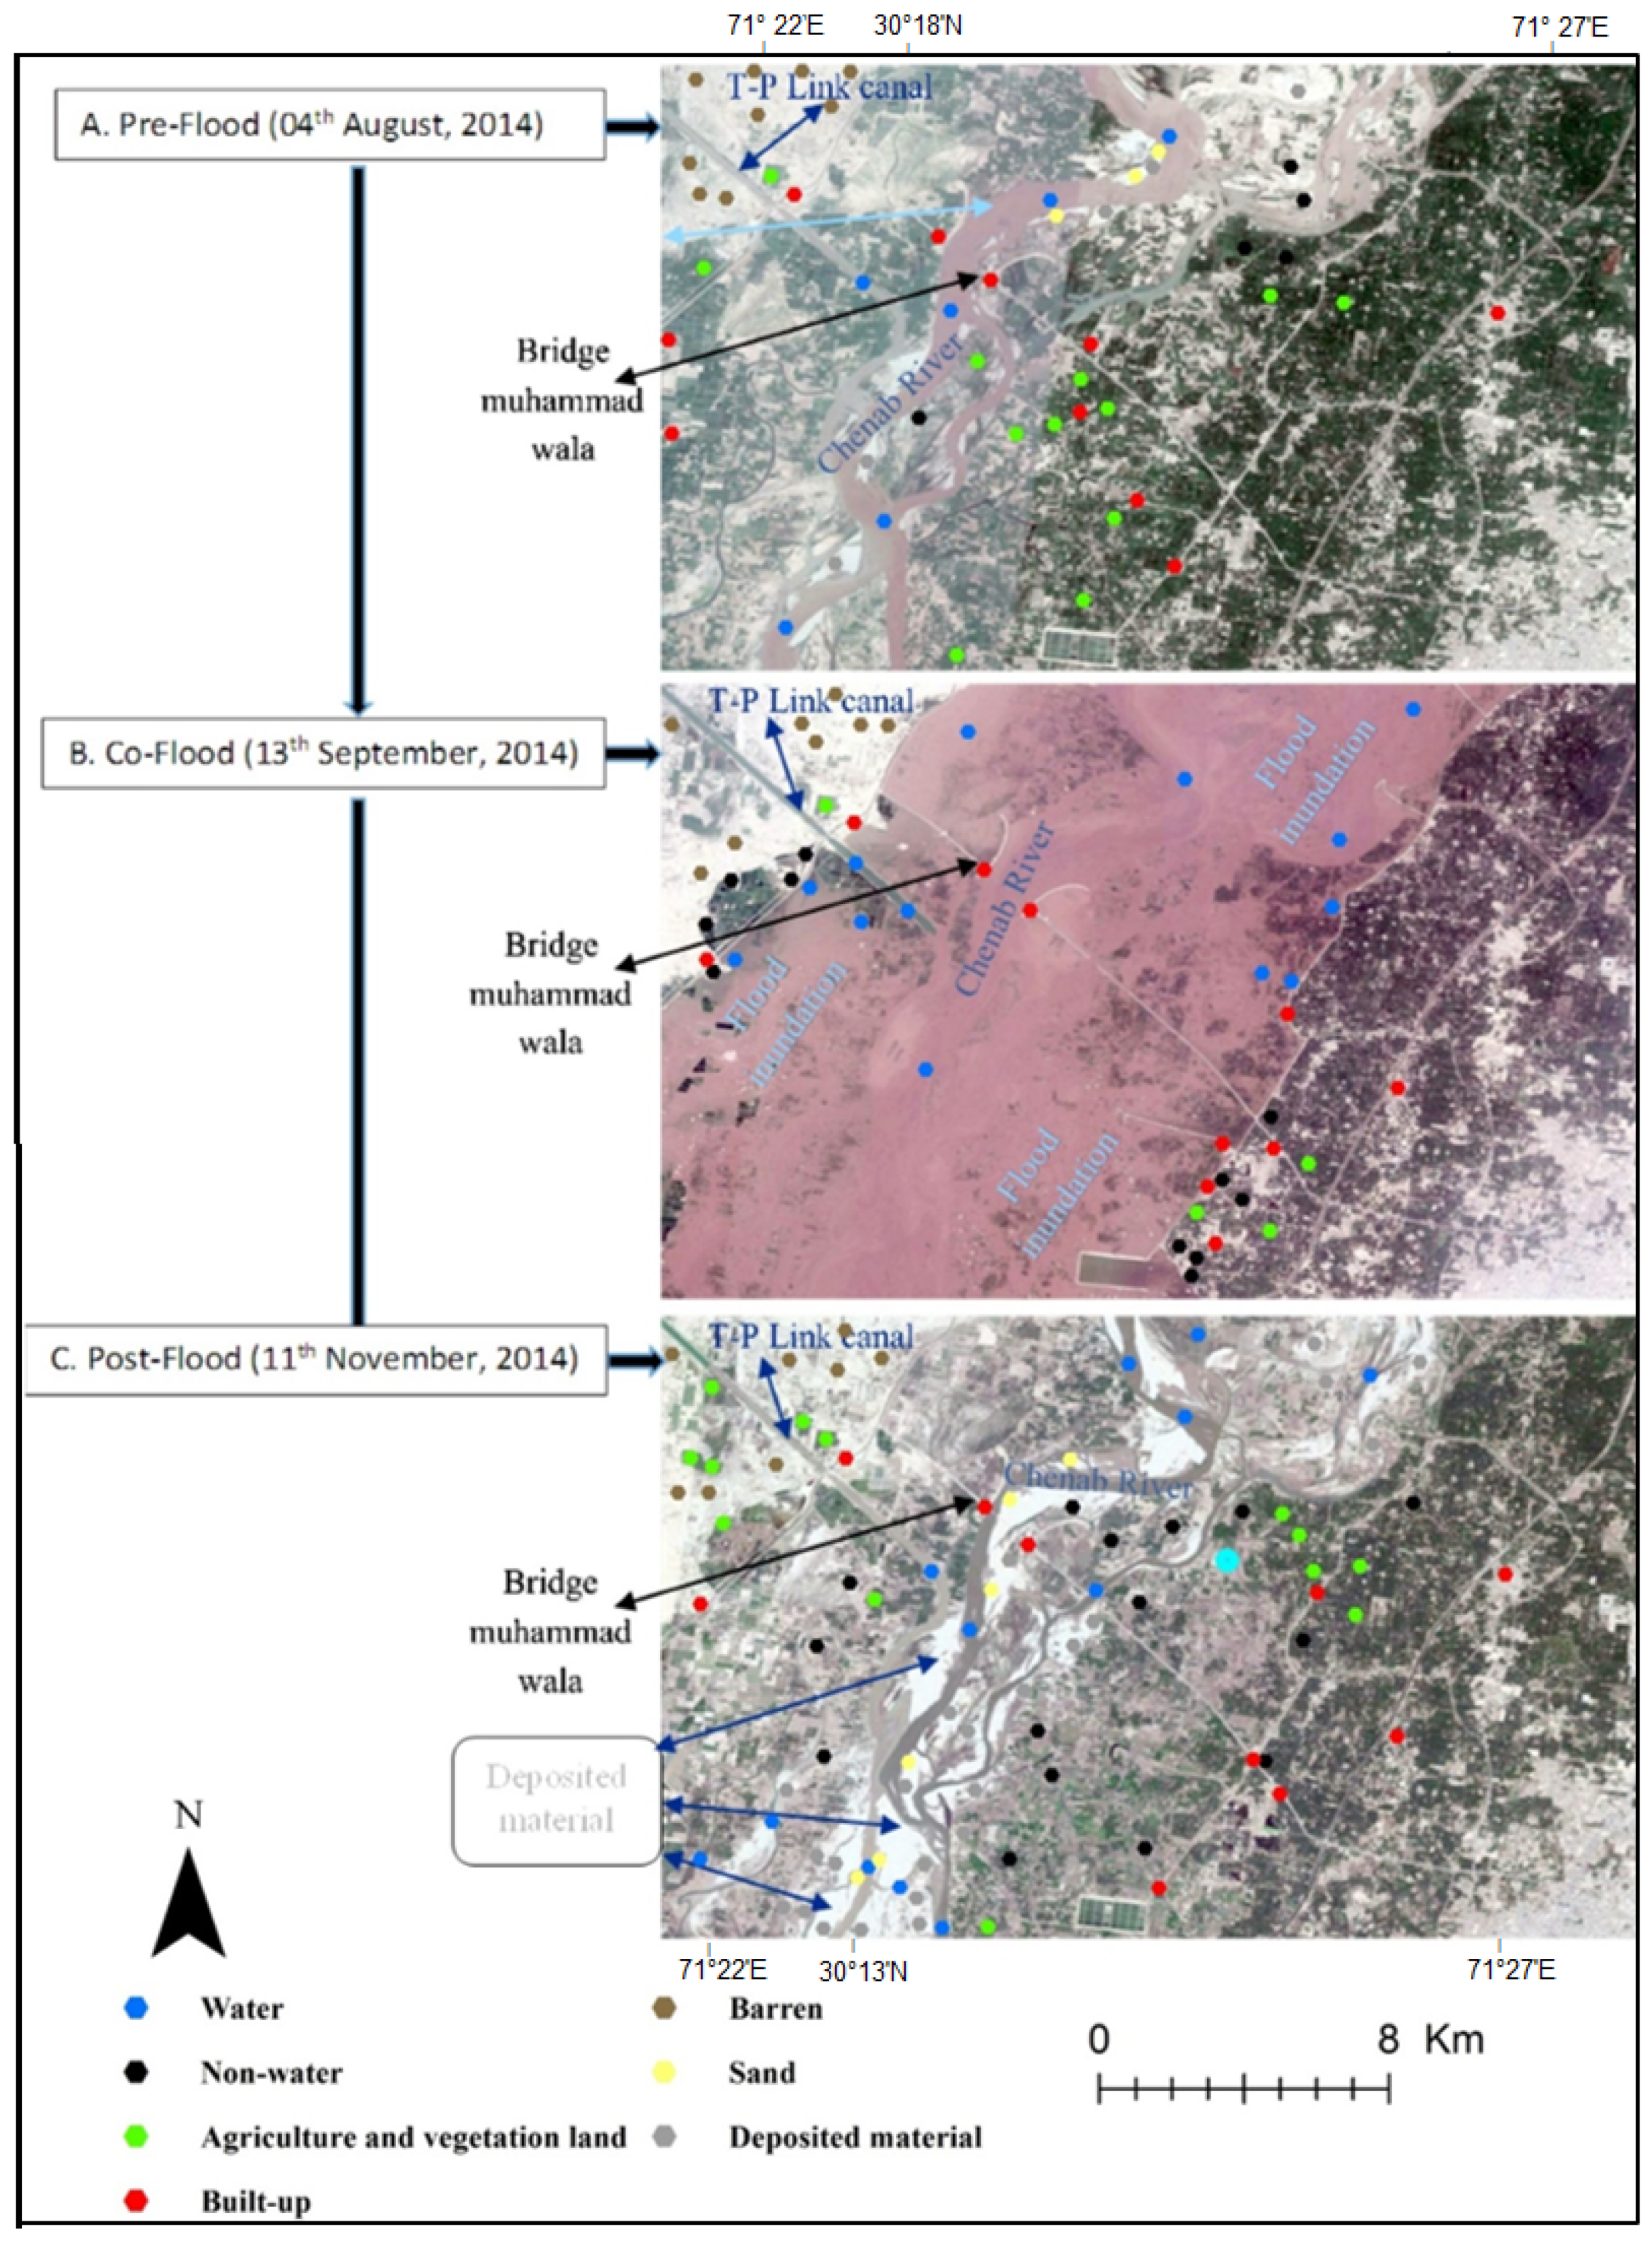
2.3.2. Classification and Inundation Validation
3. Results
3.1. Accuracy Assessment
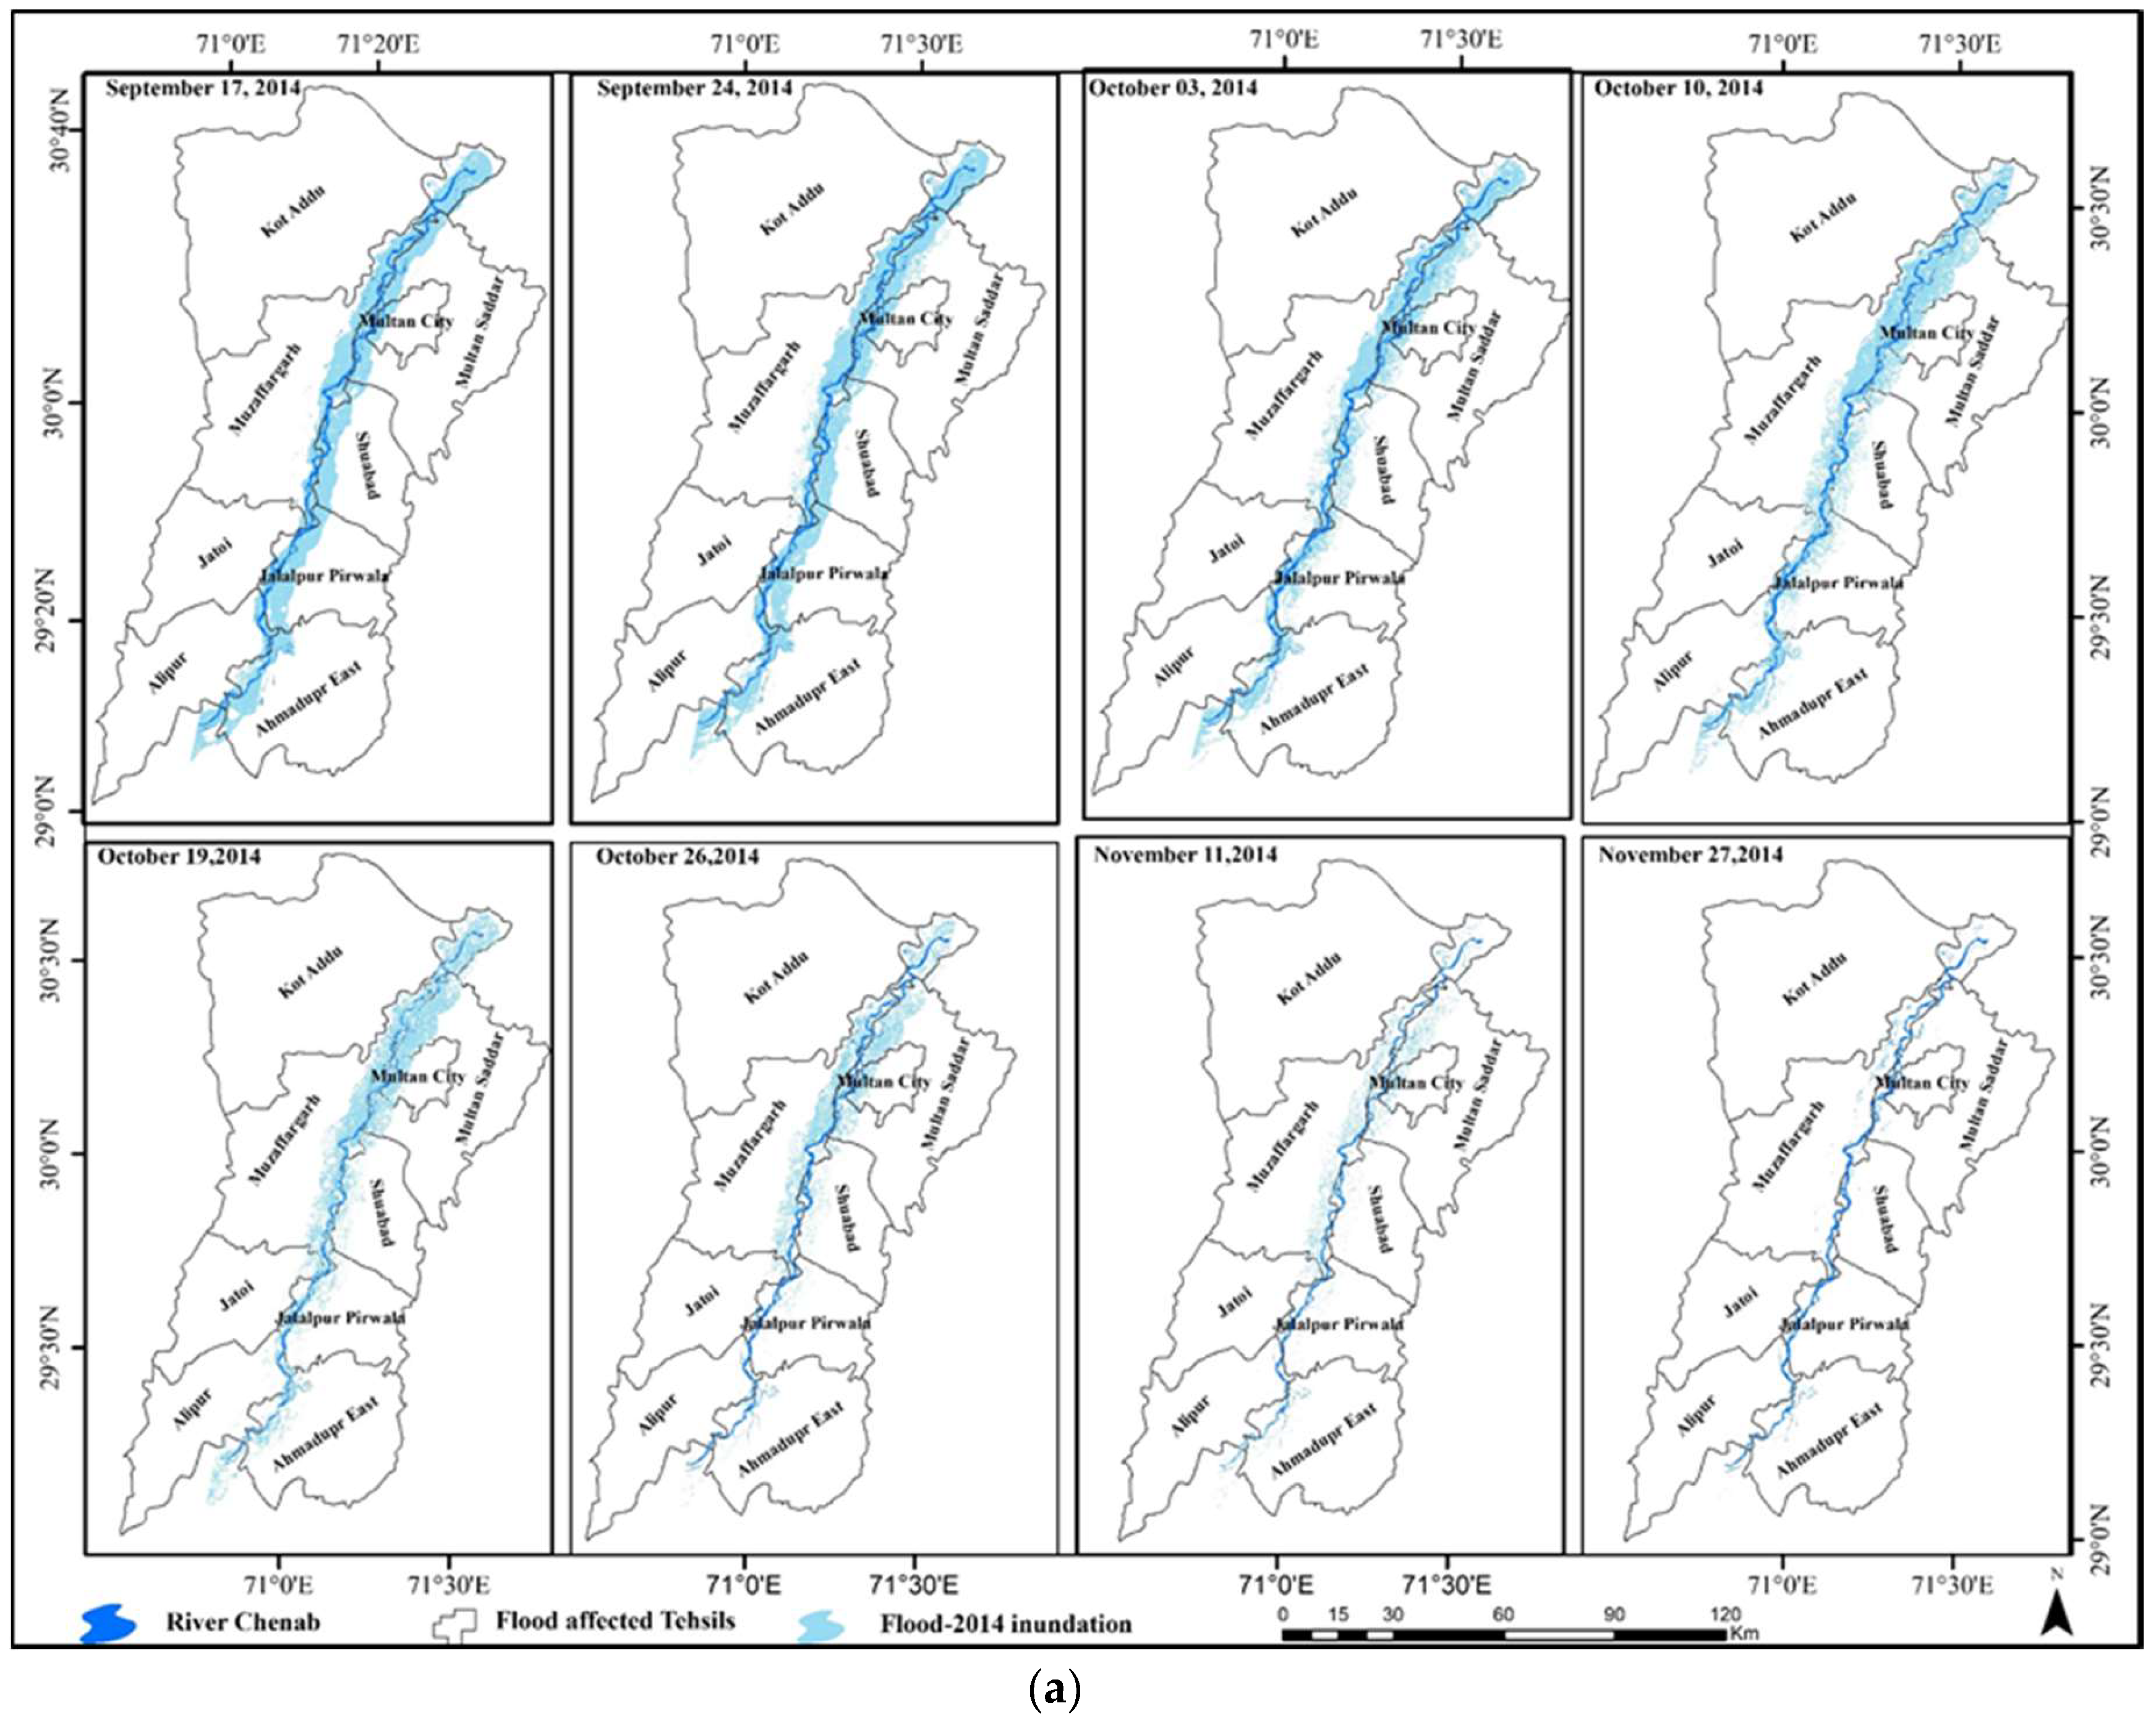
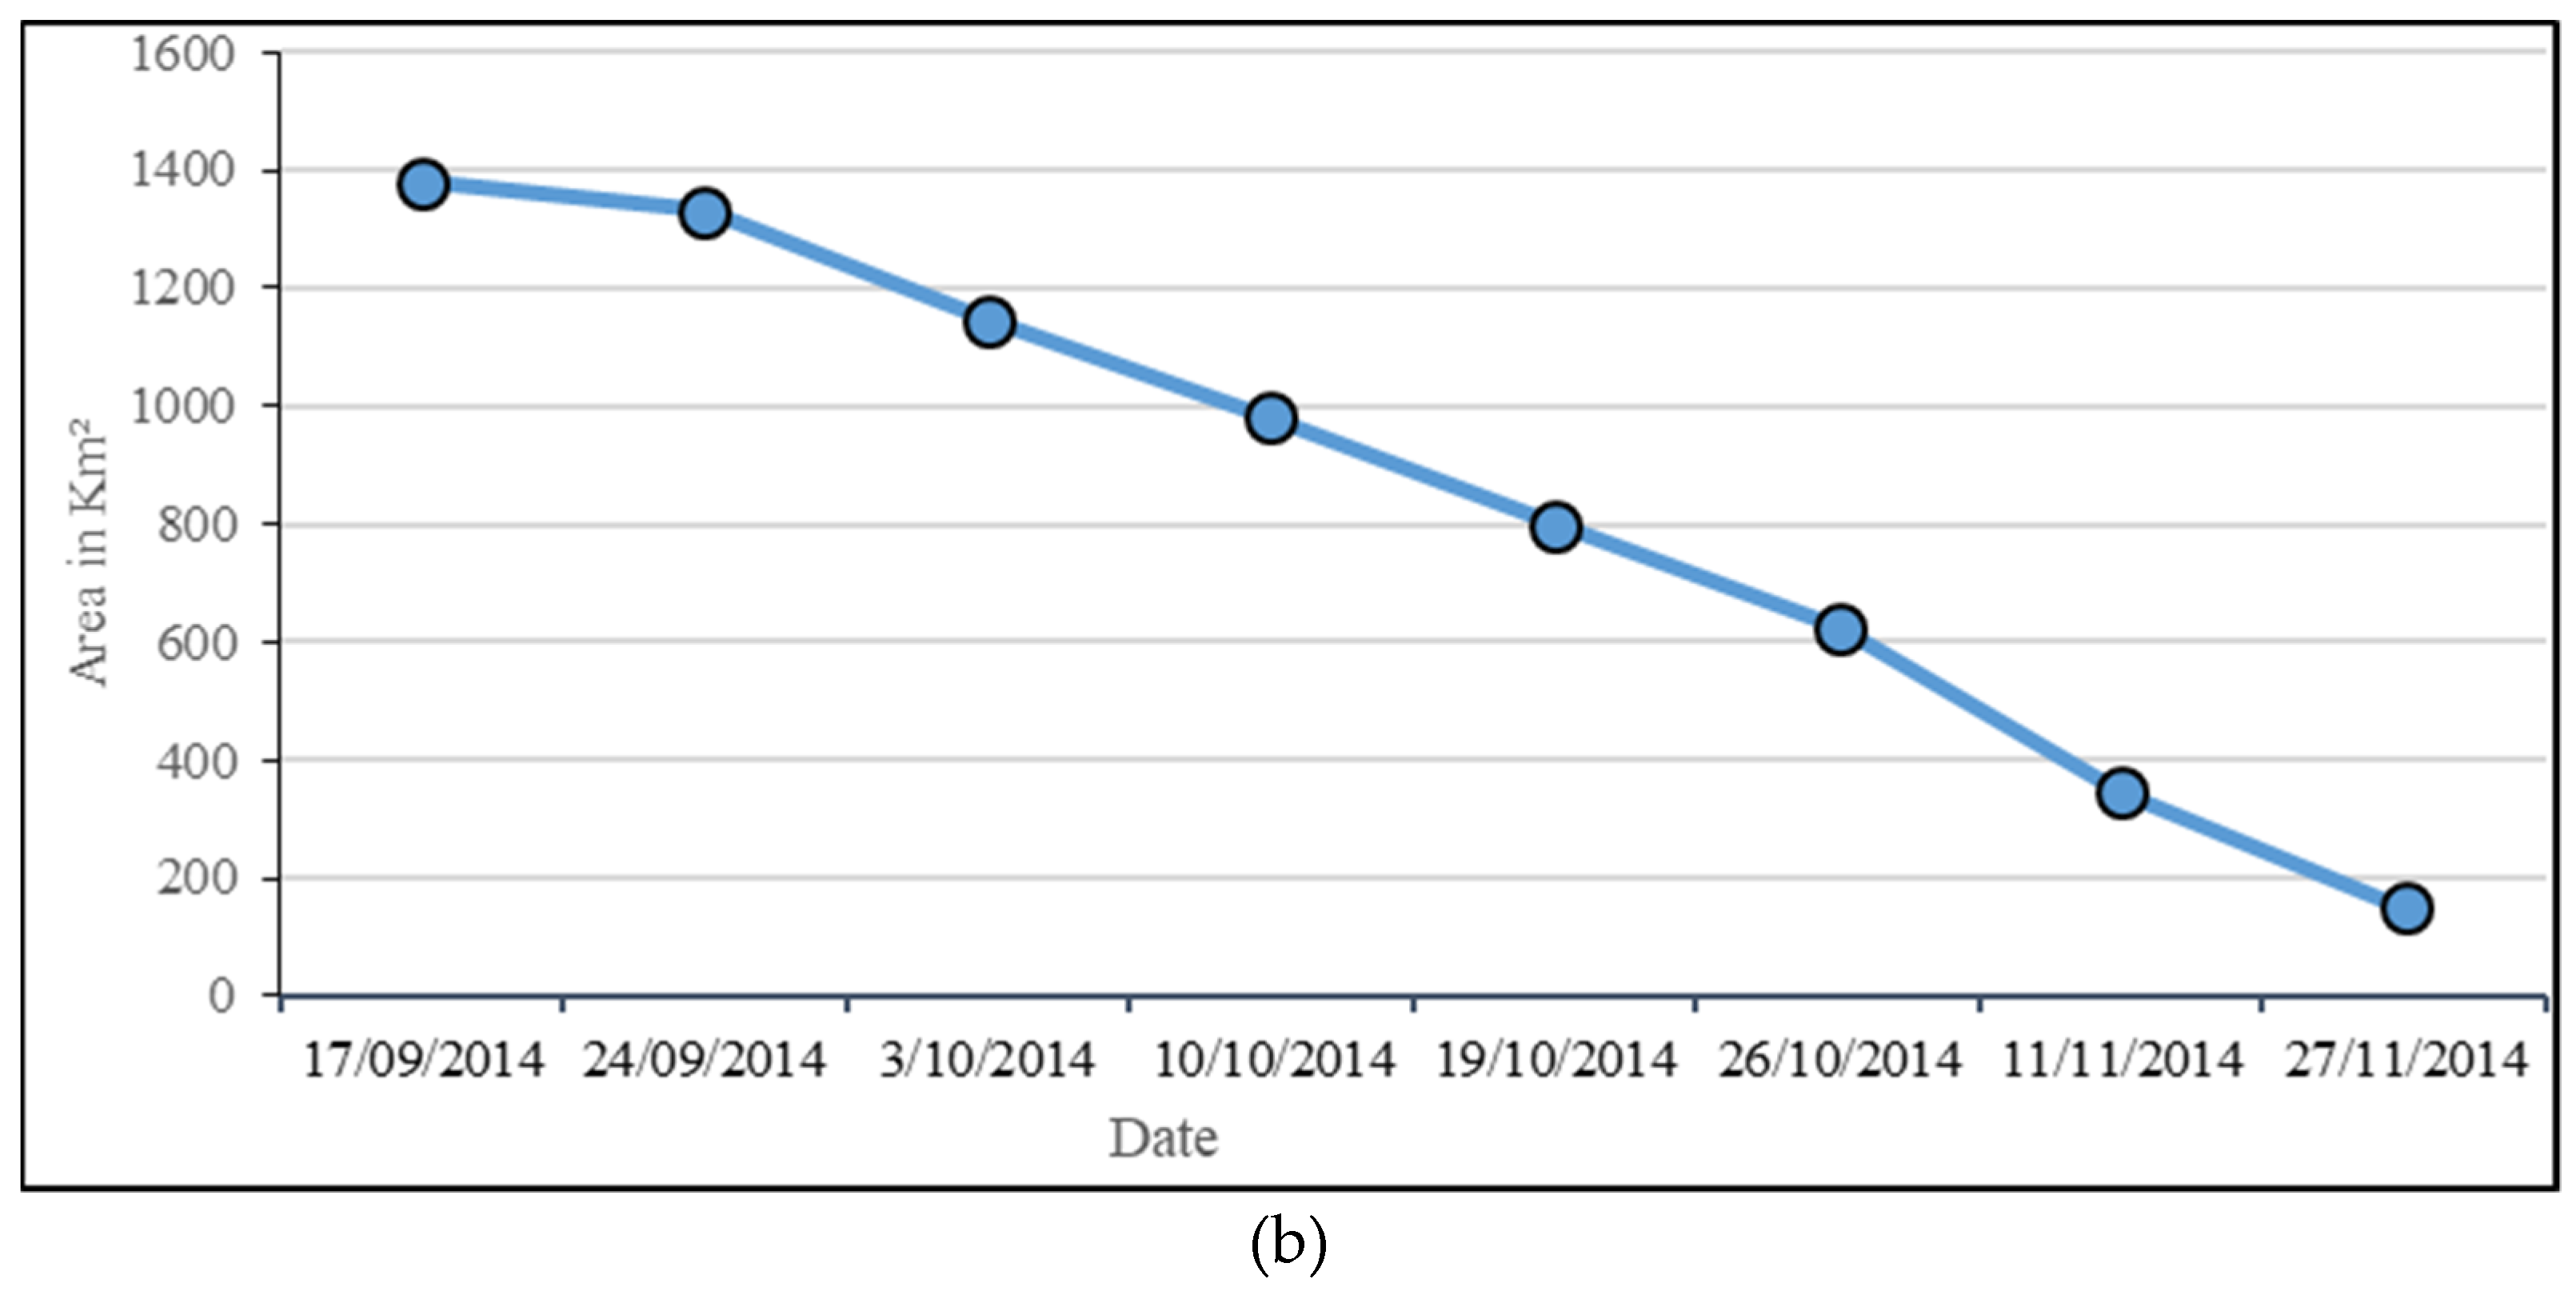
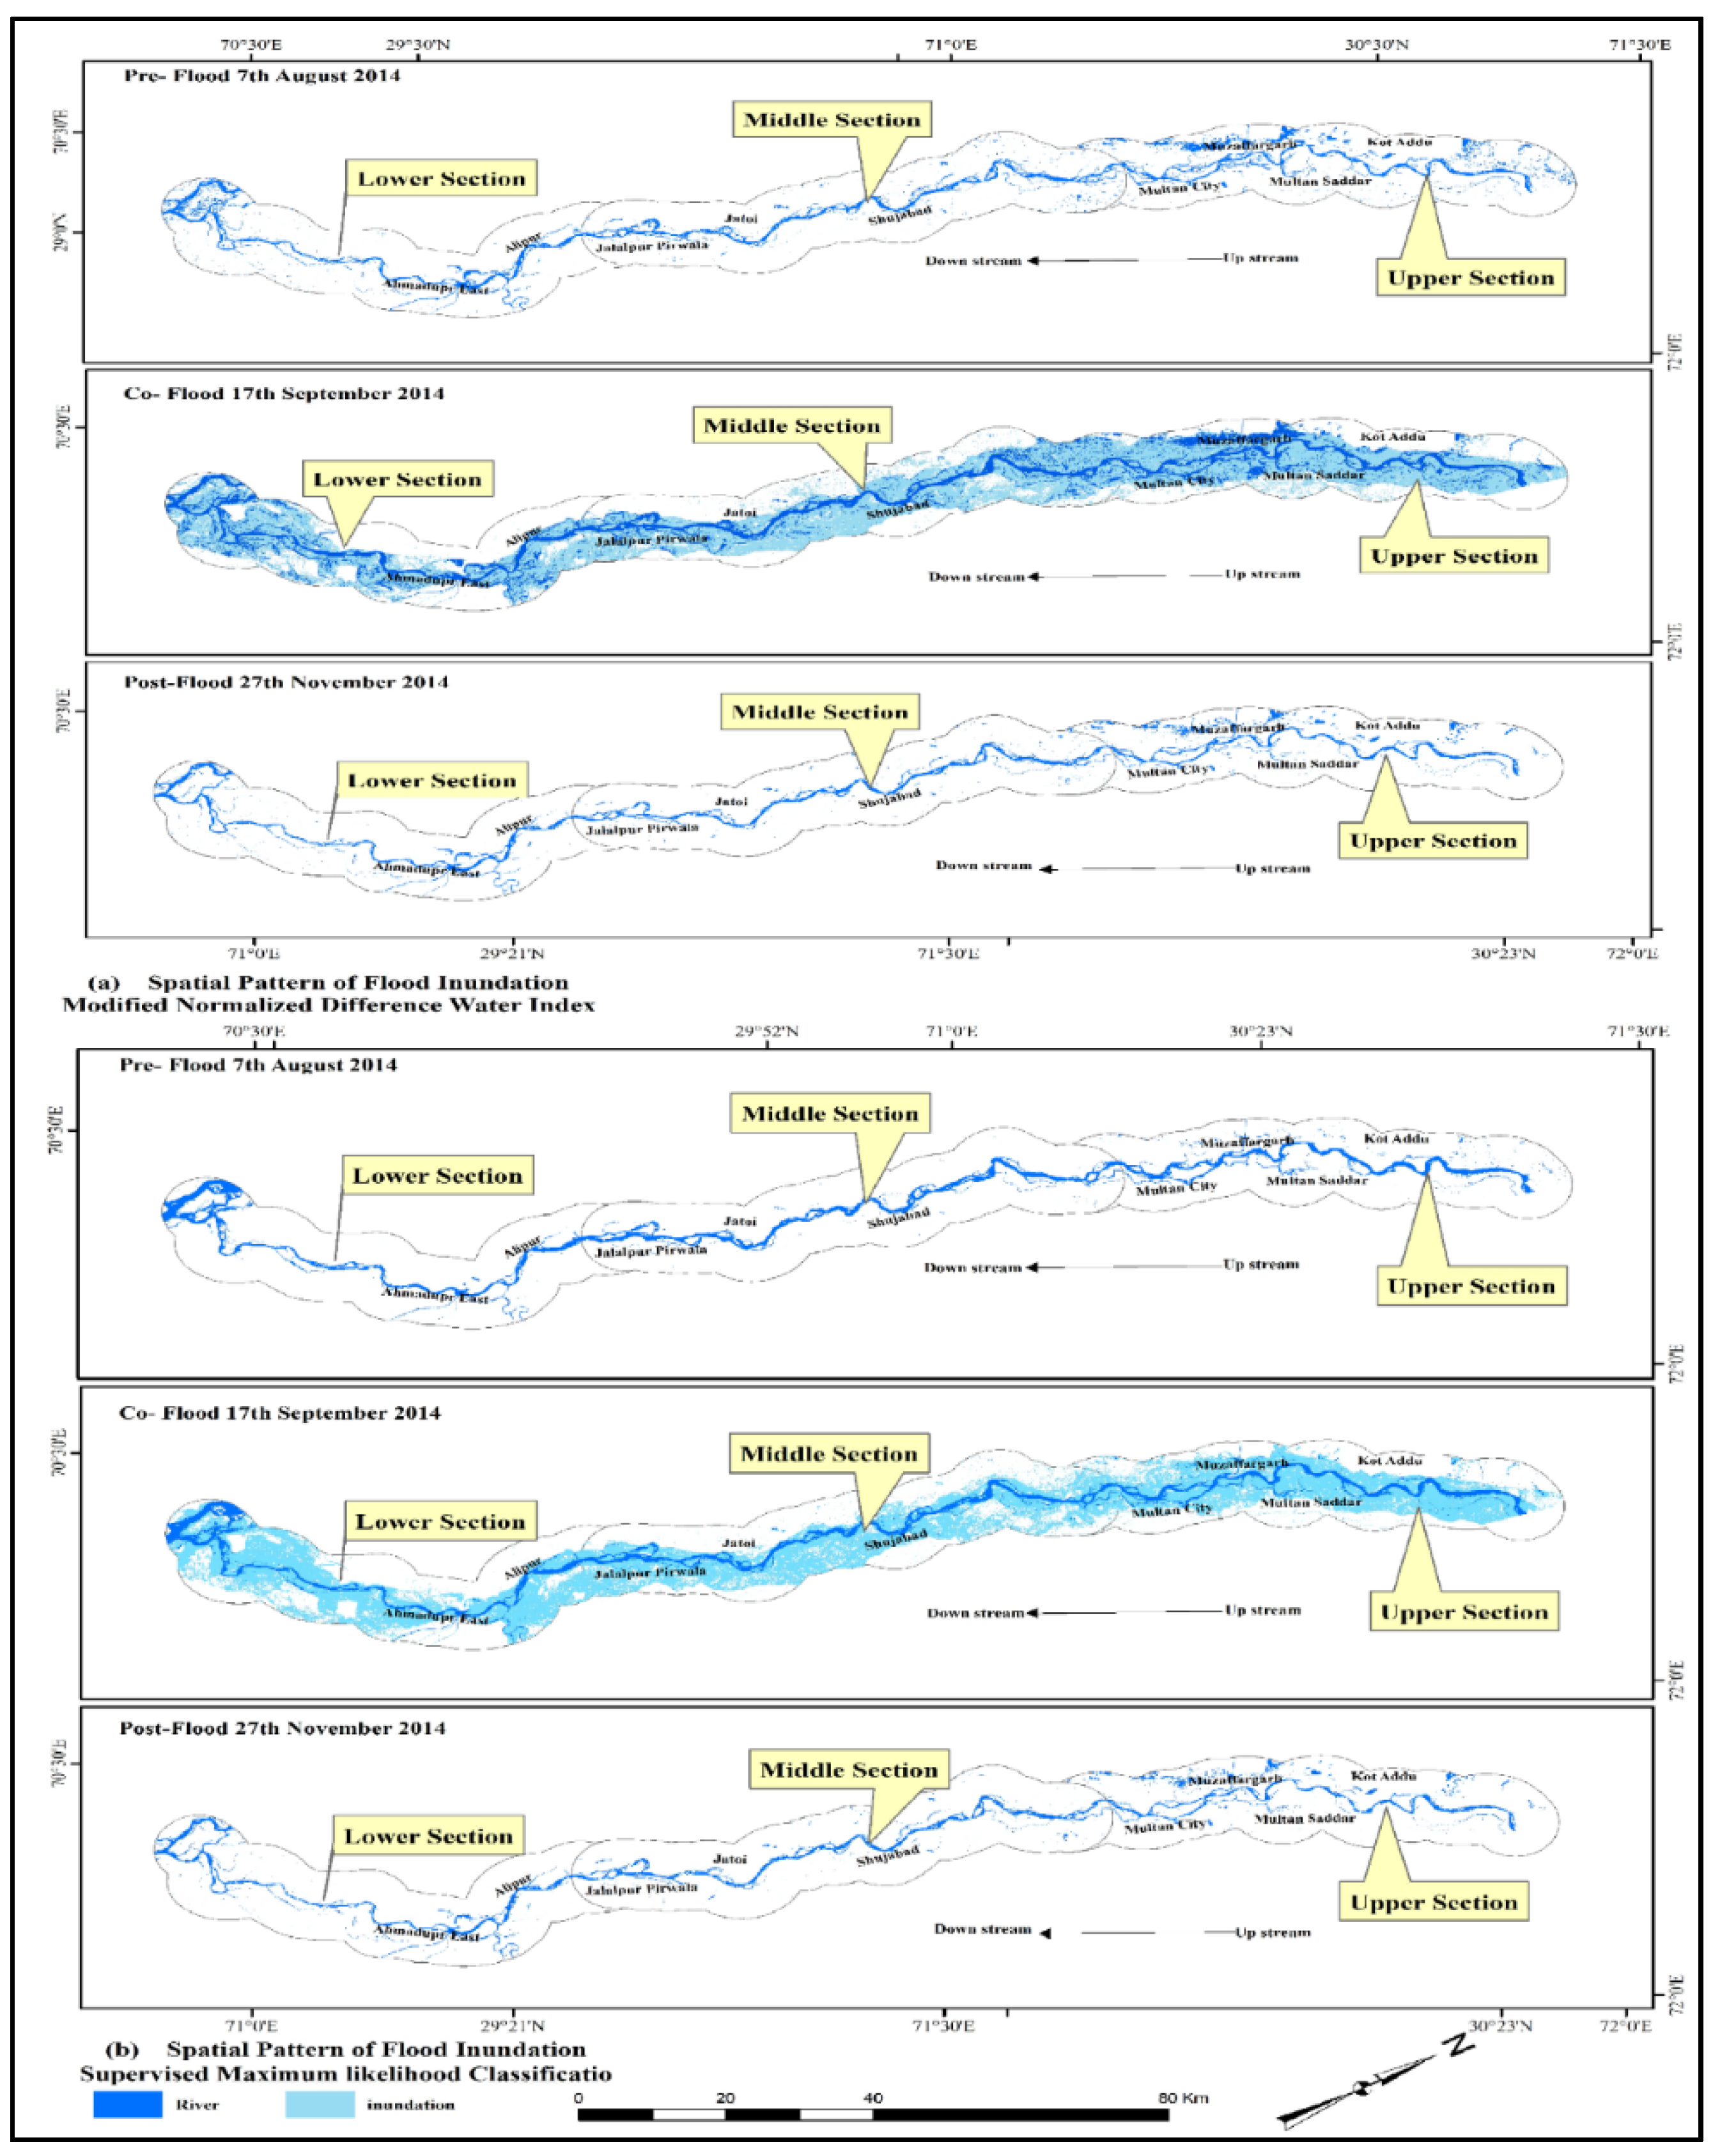
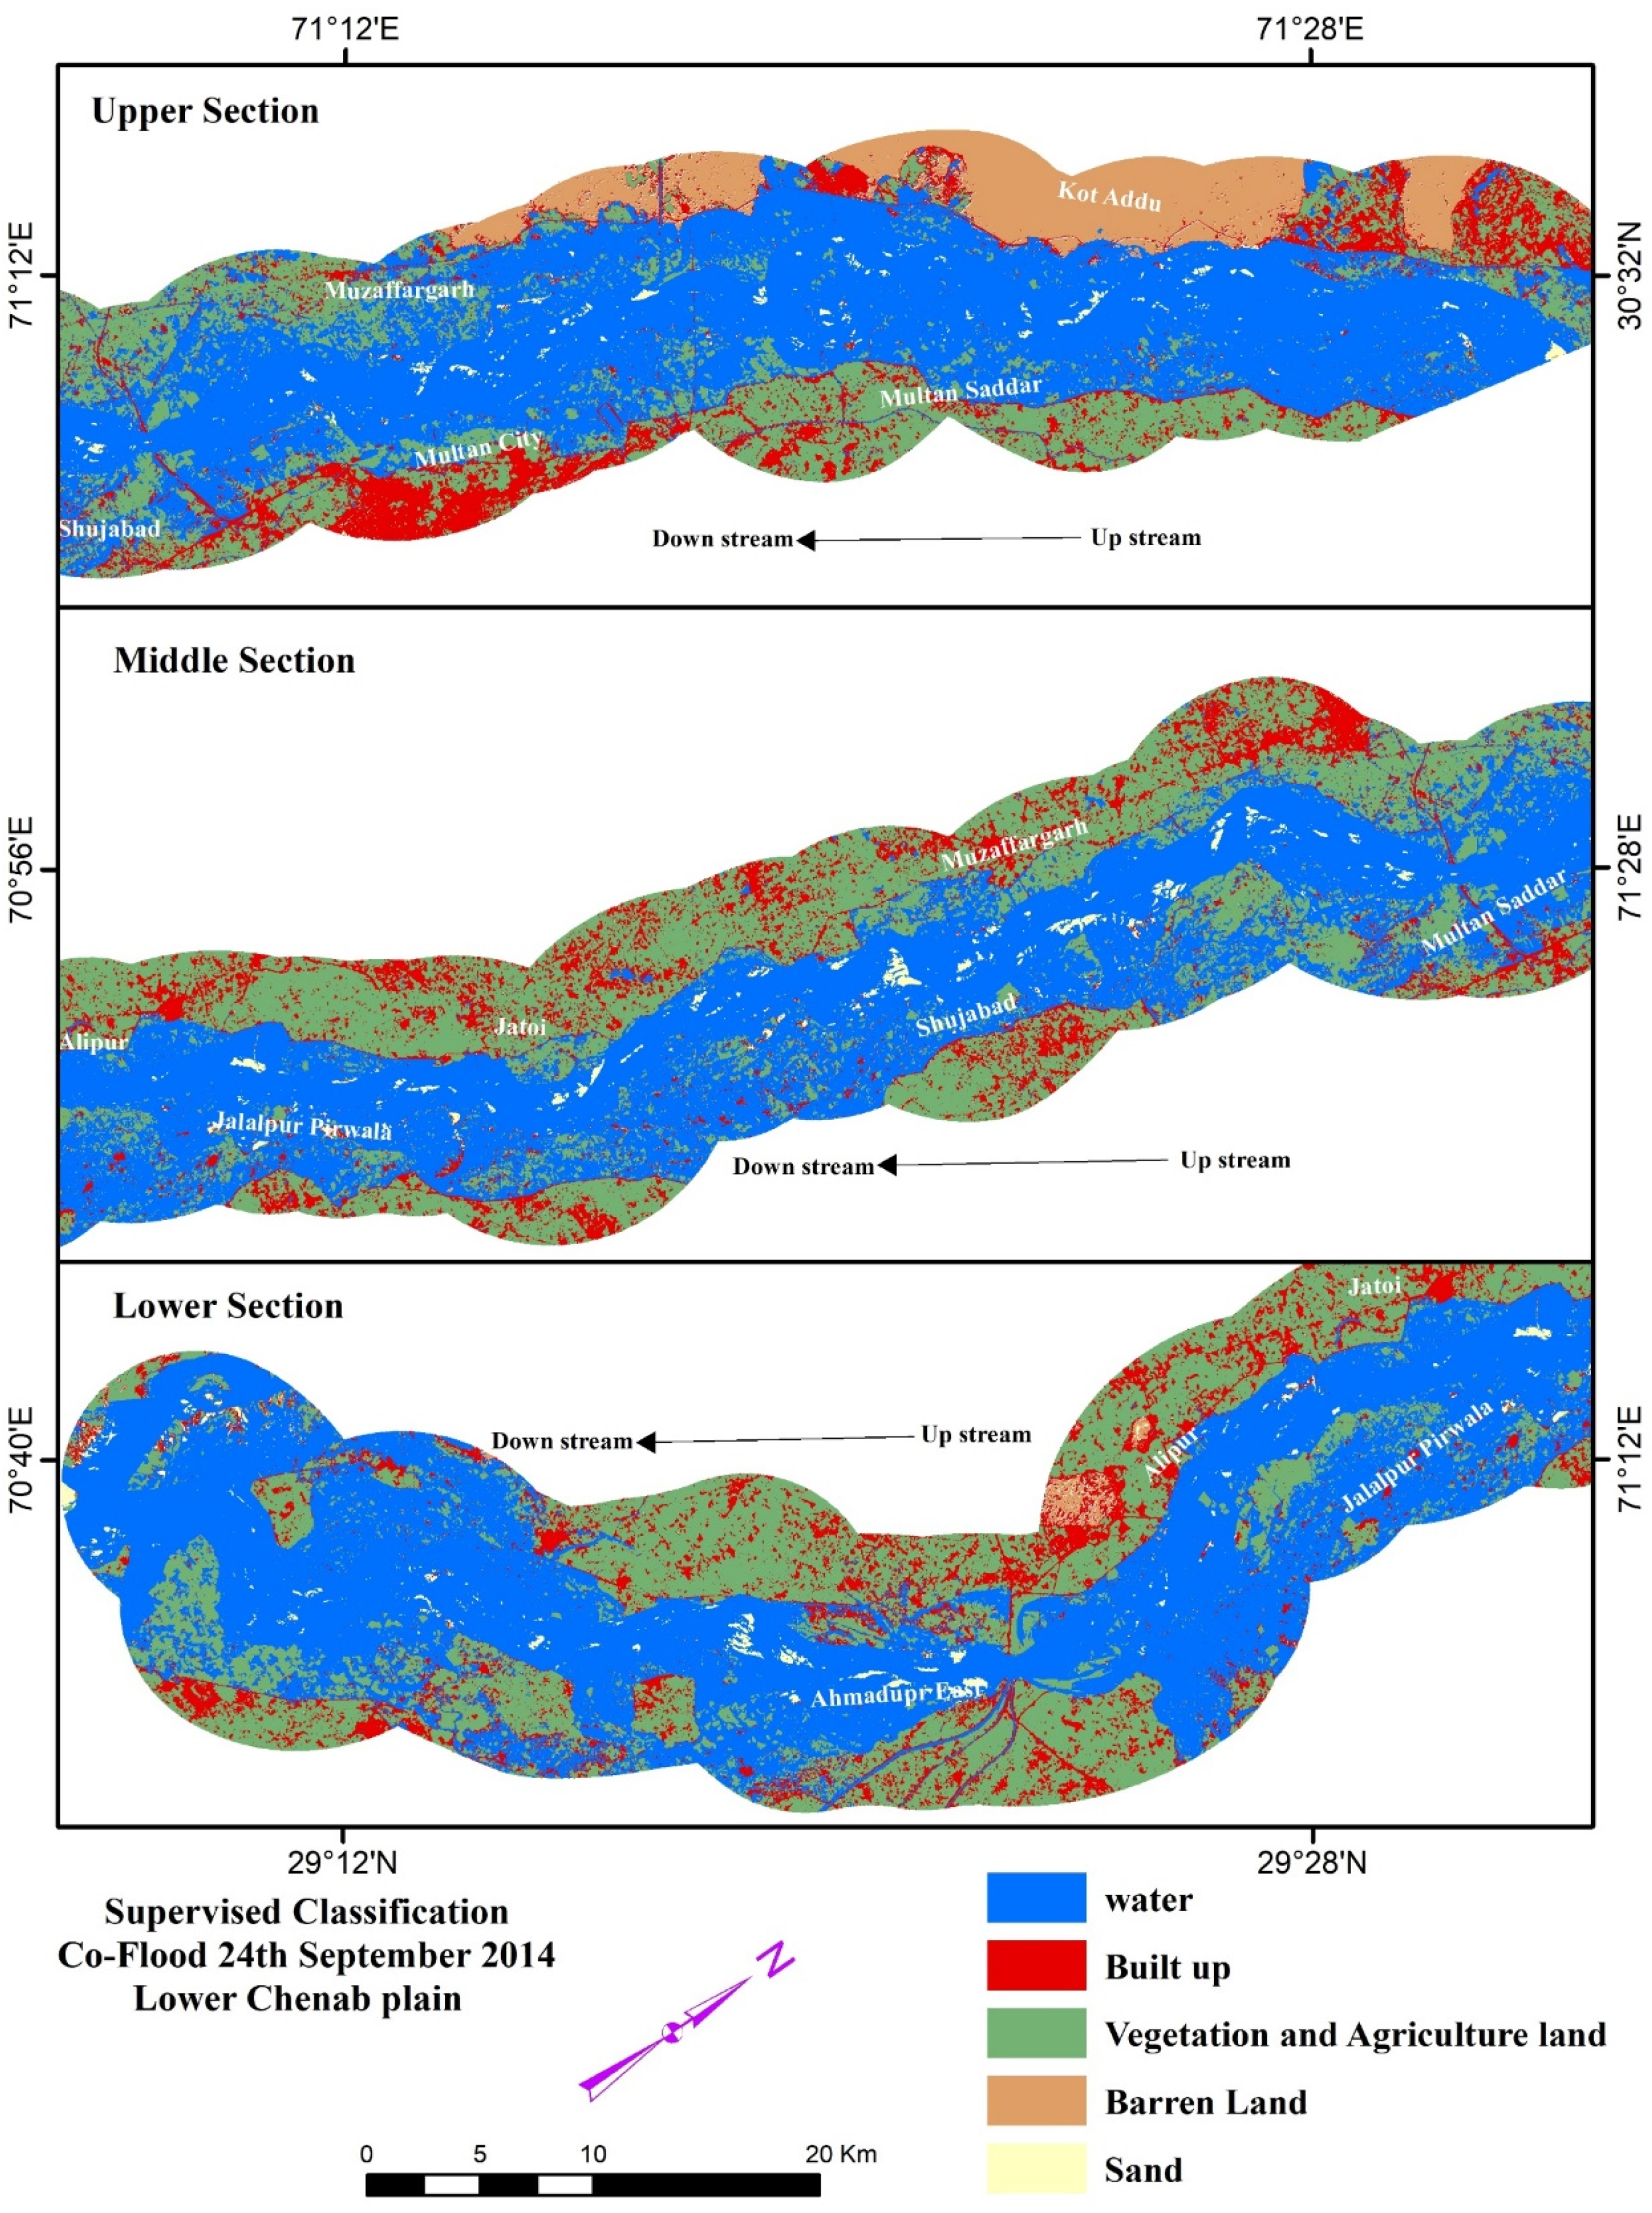
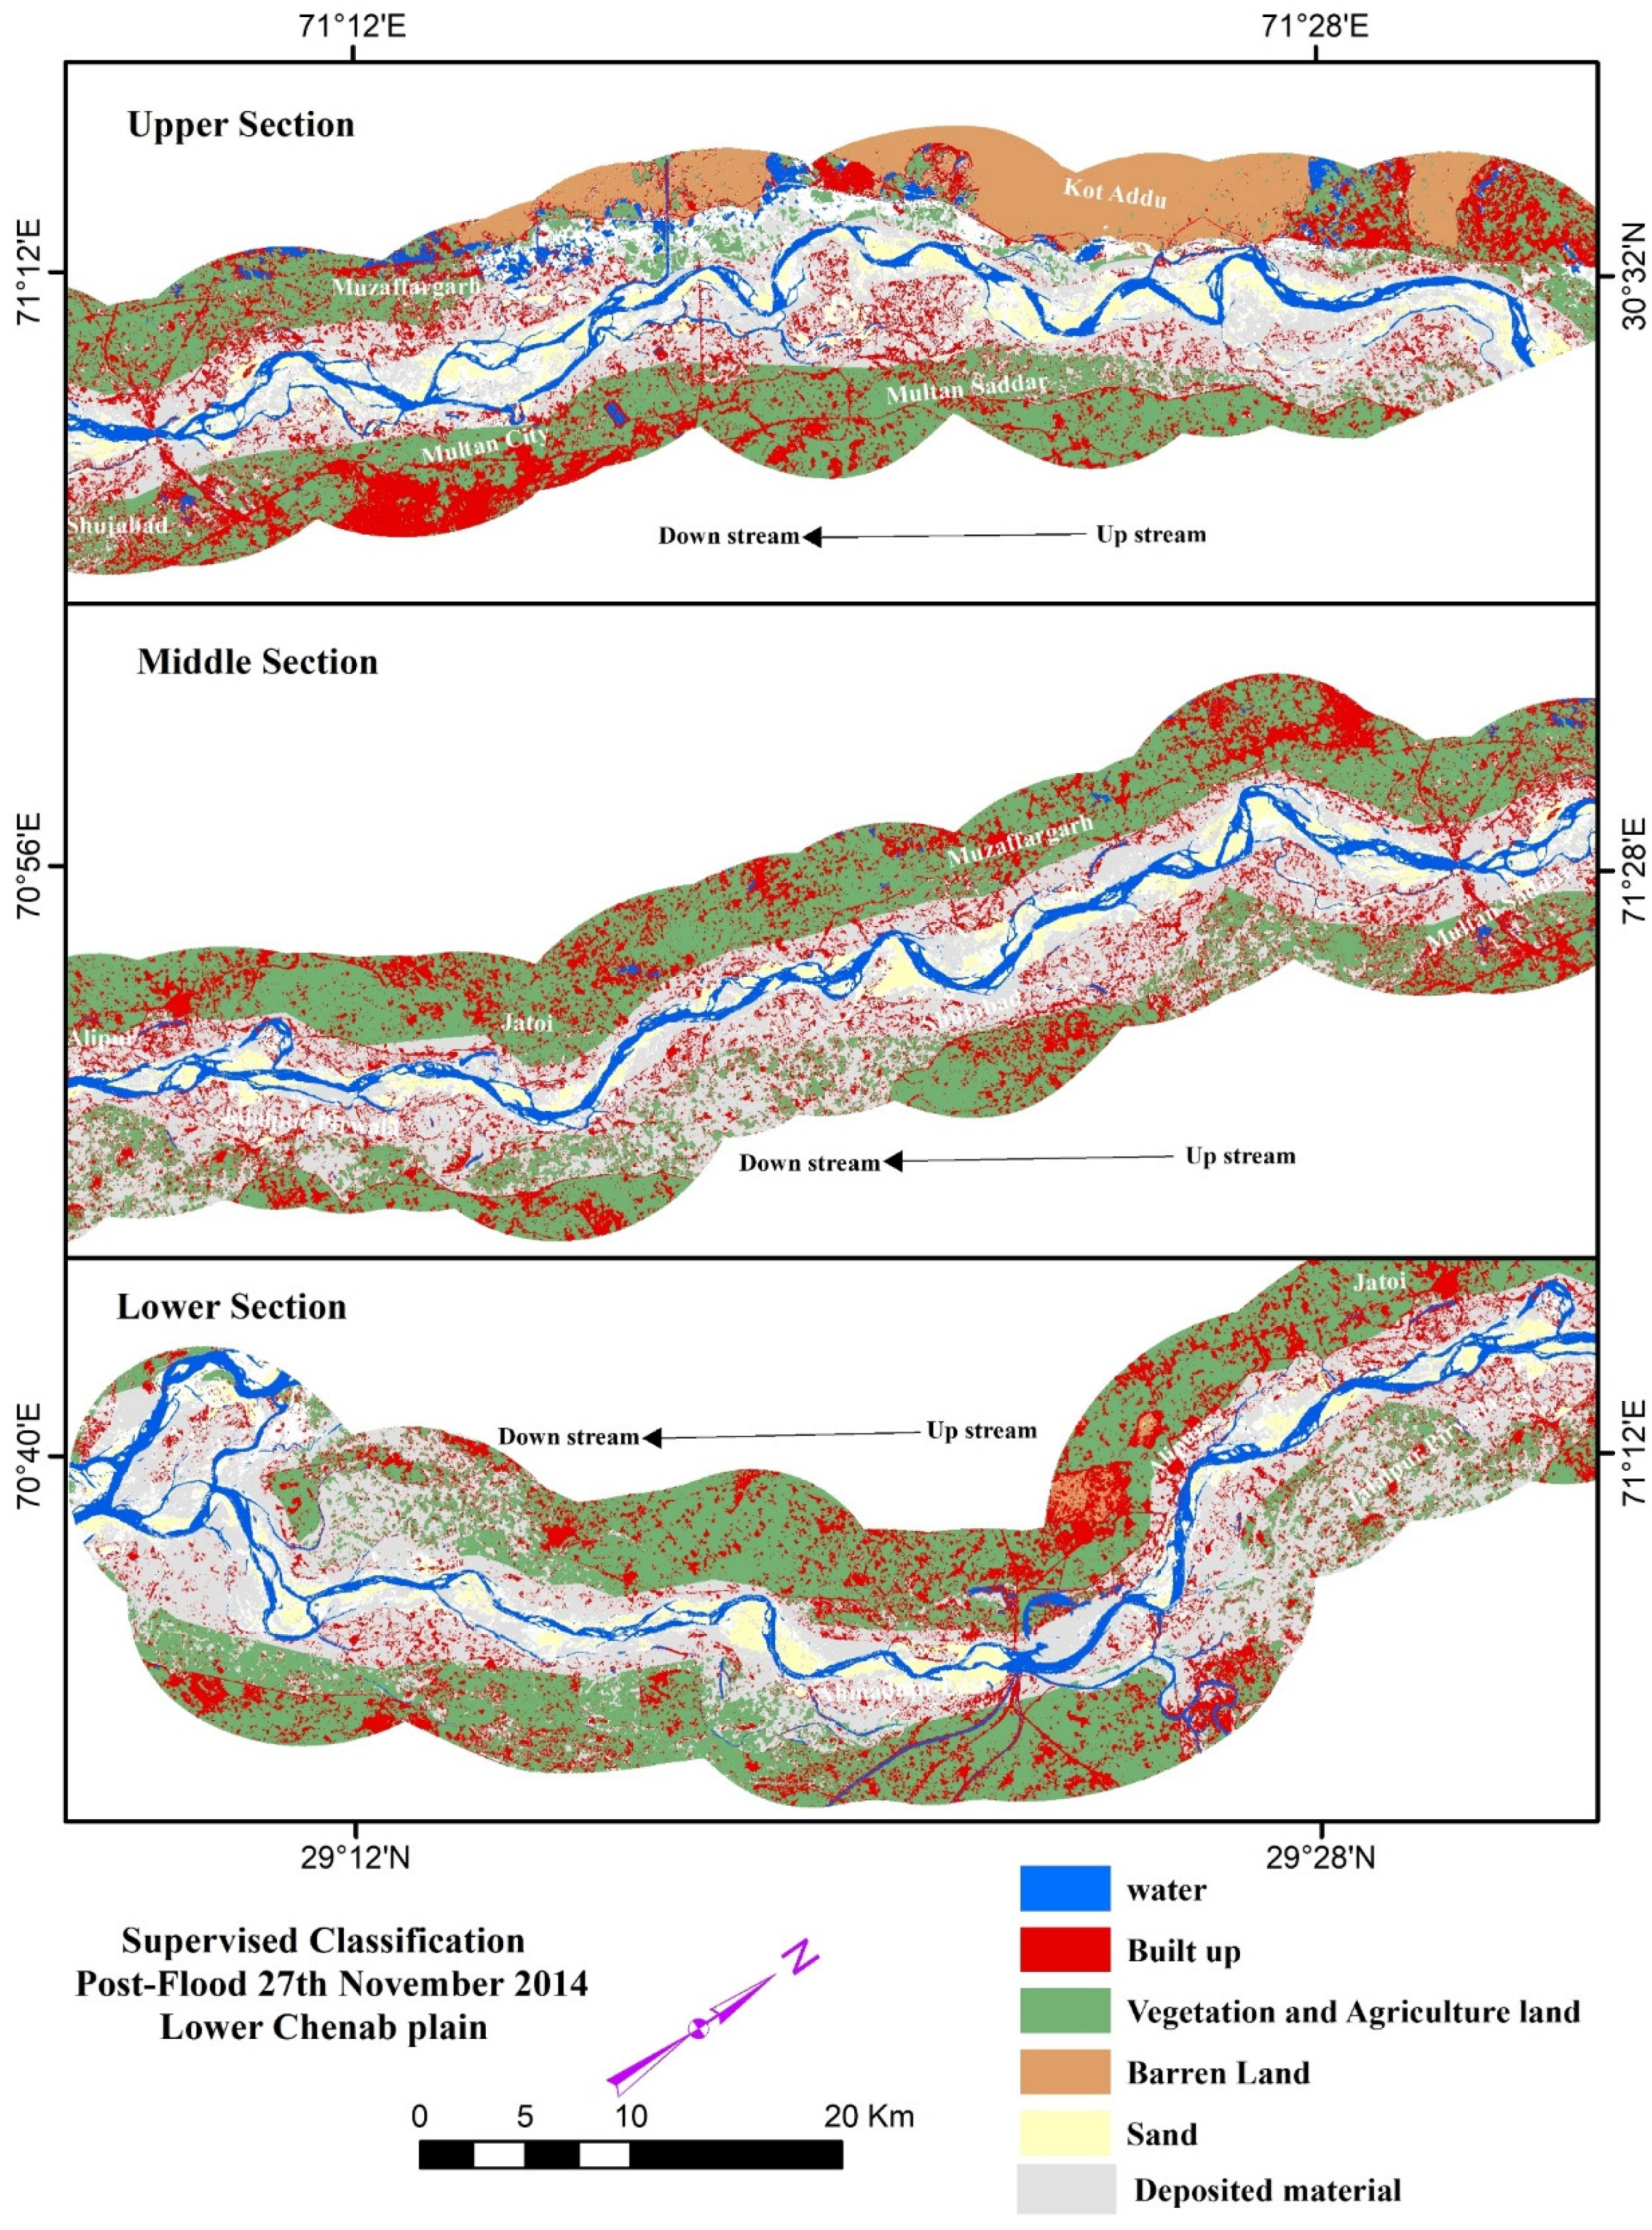
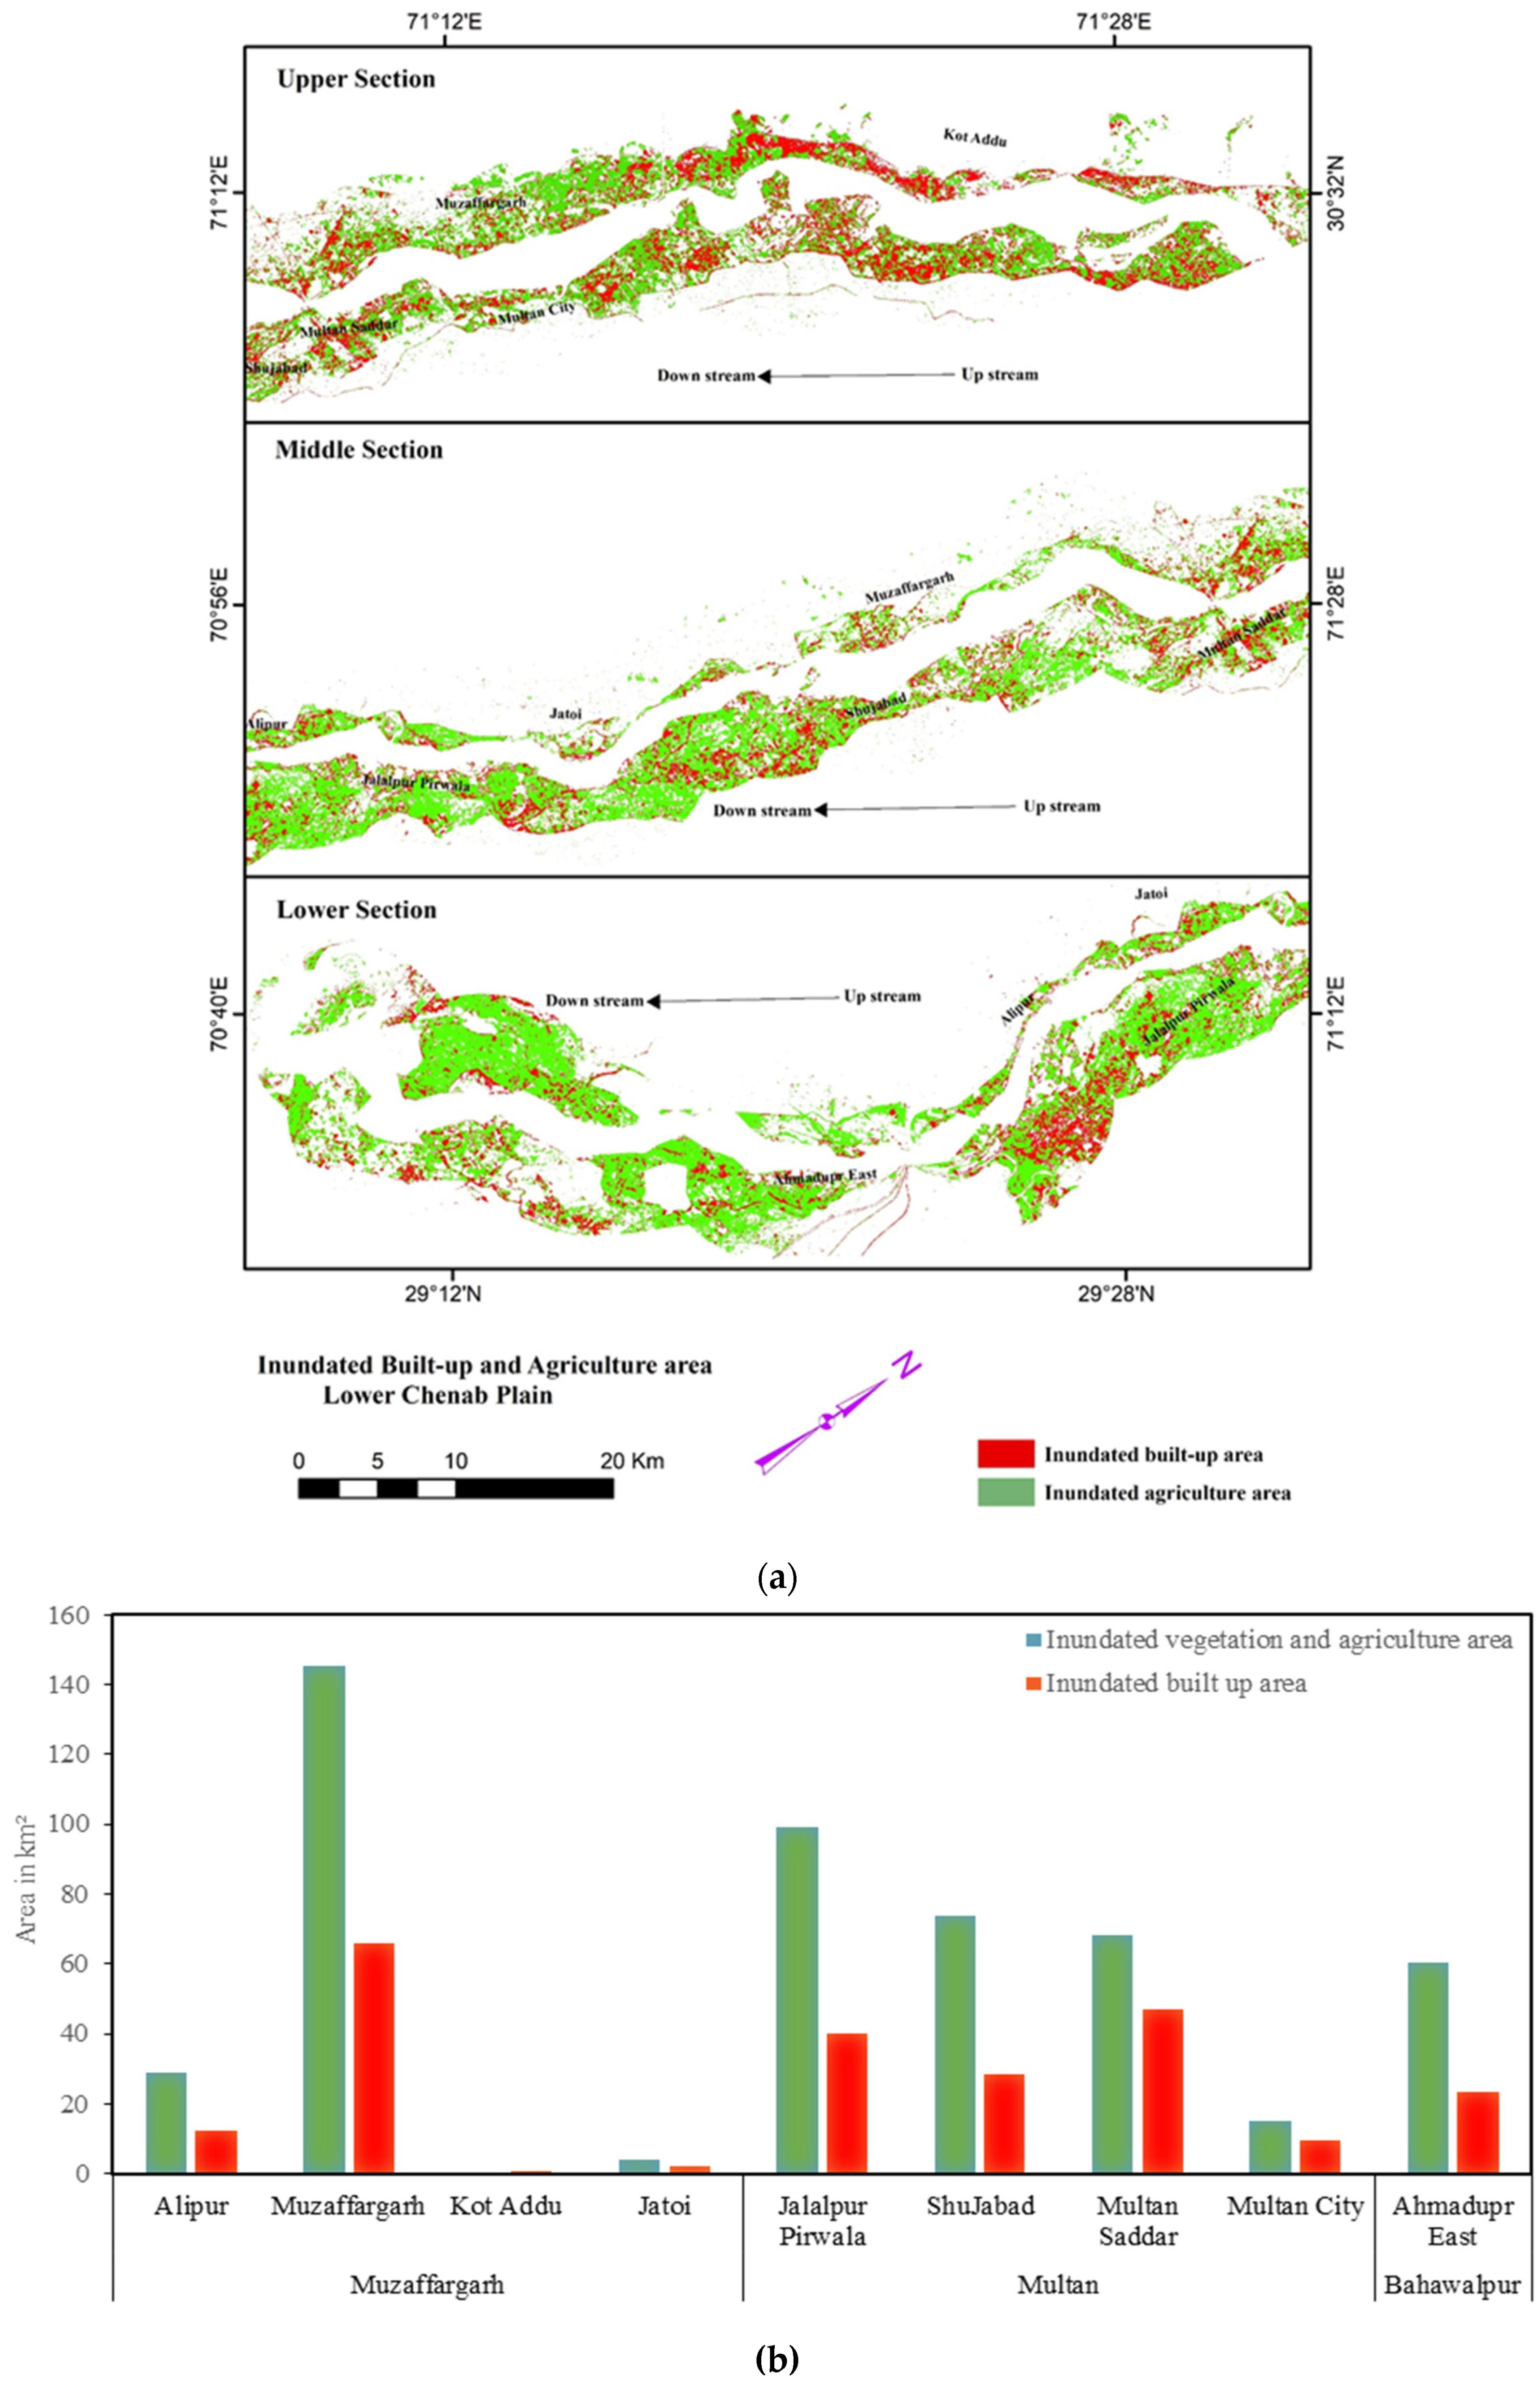
3.2. Flood Mapping and Monitoring
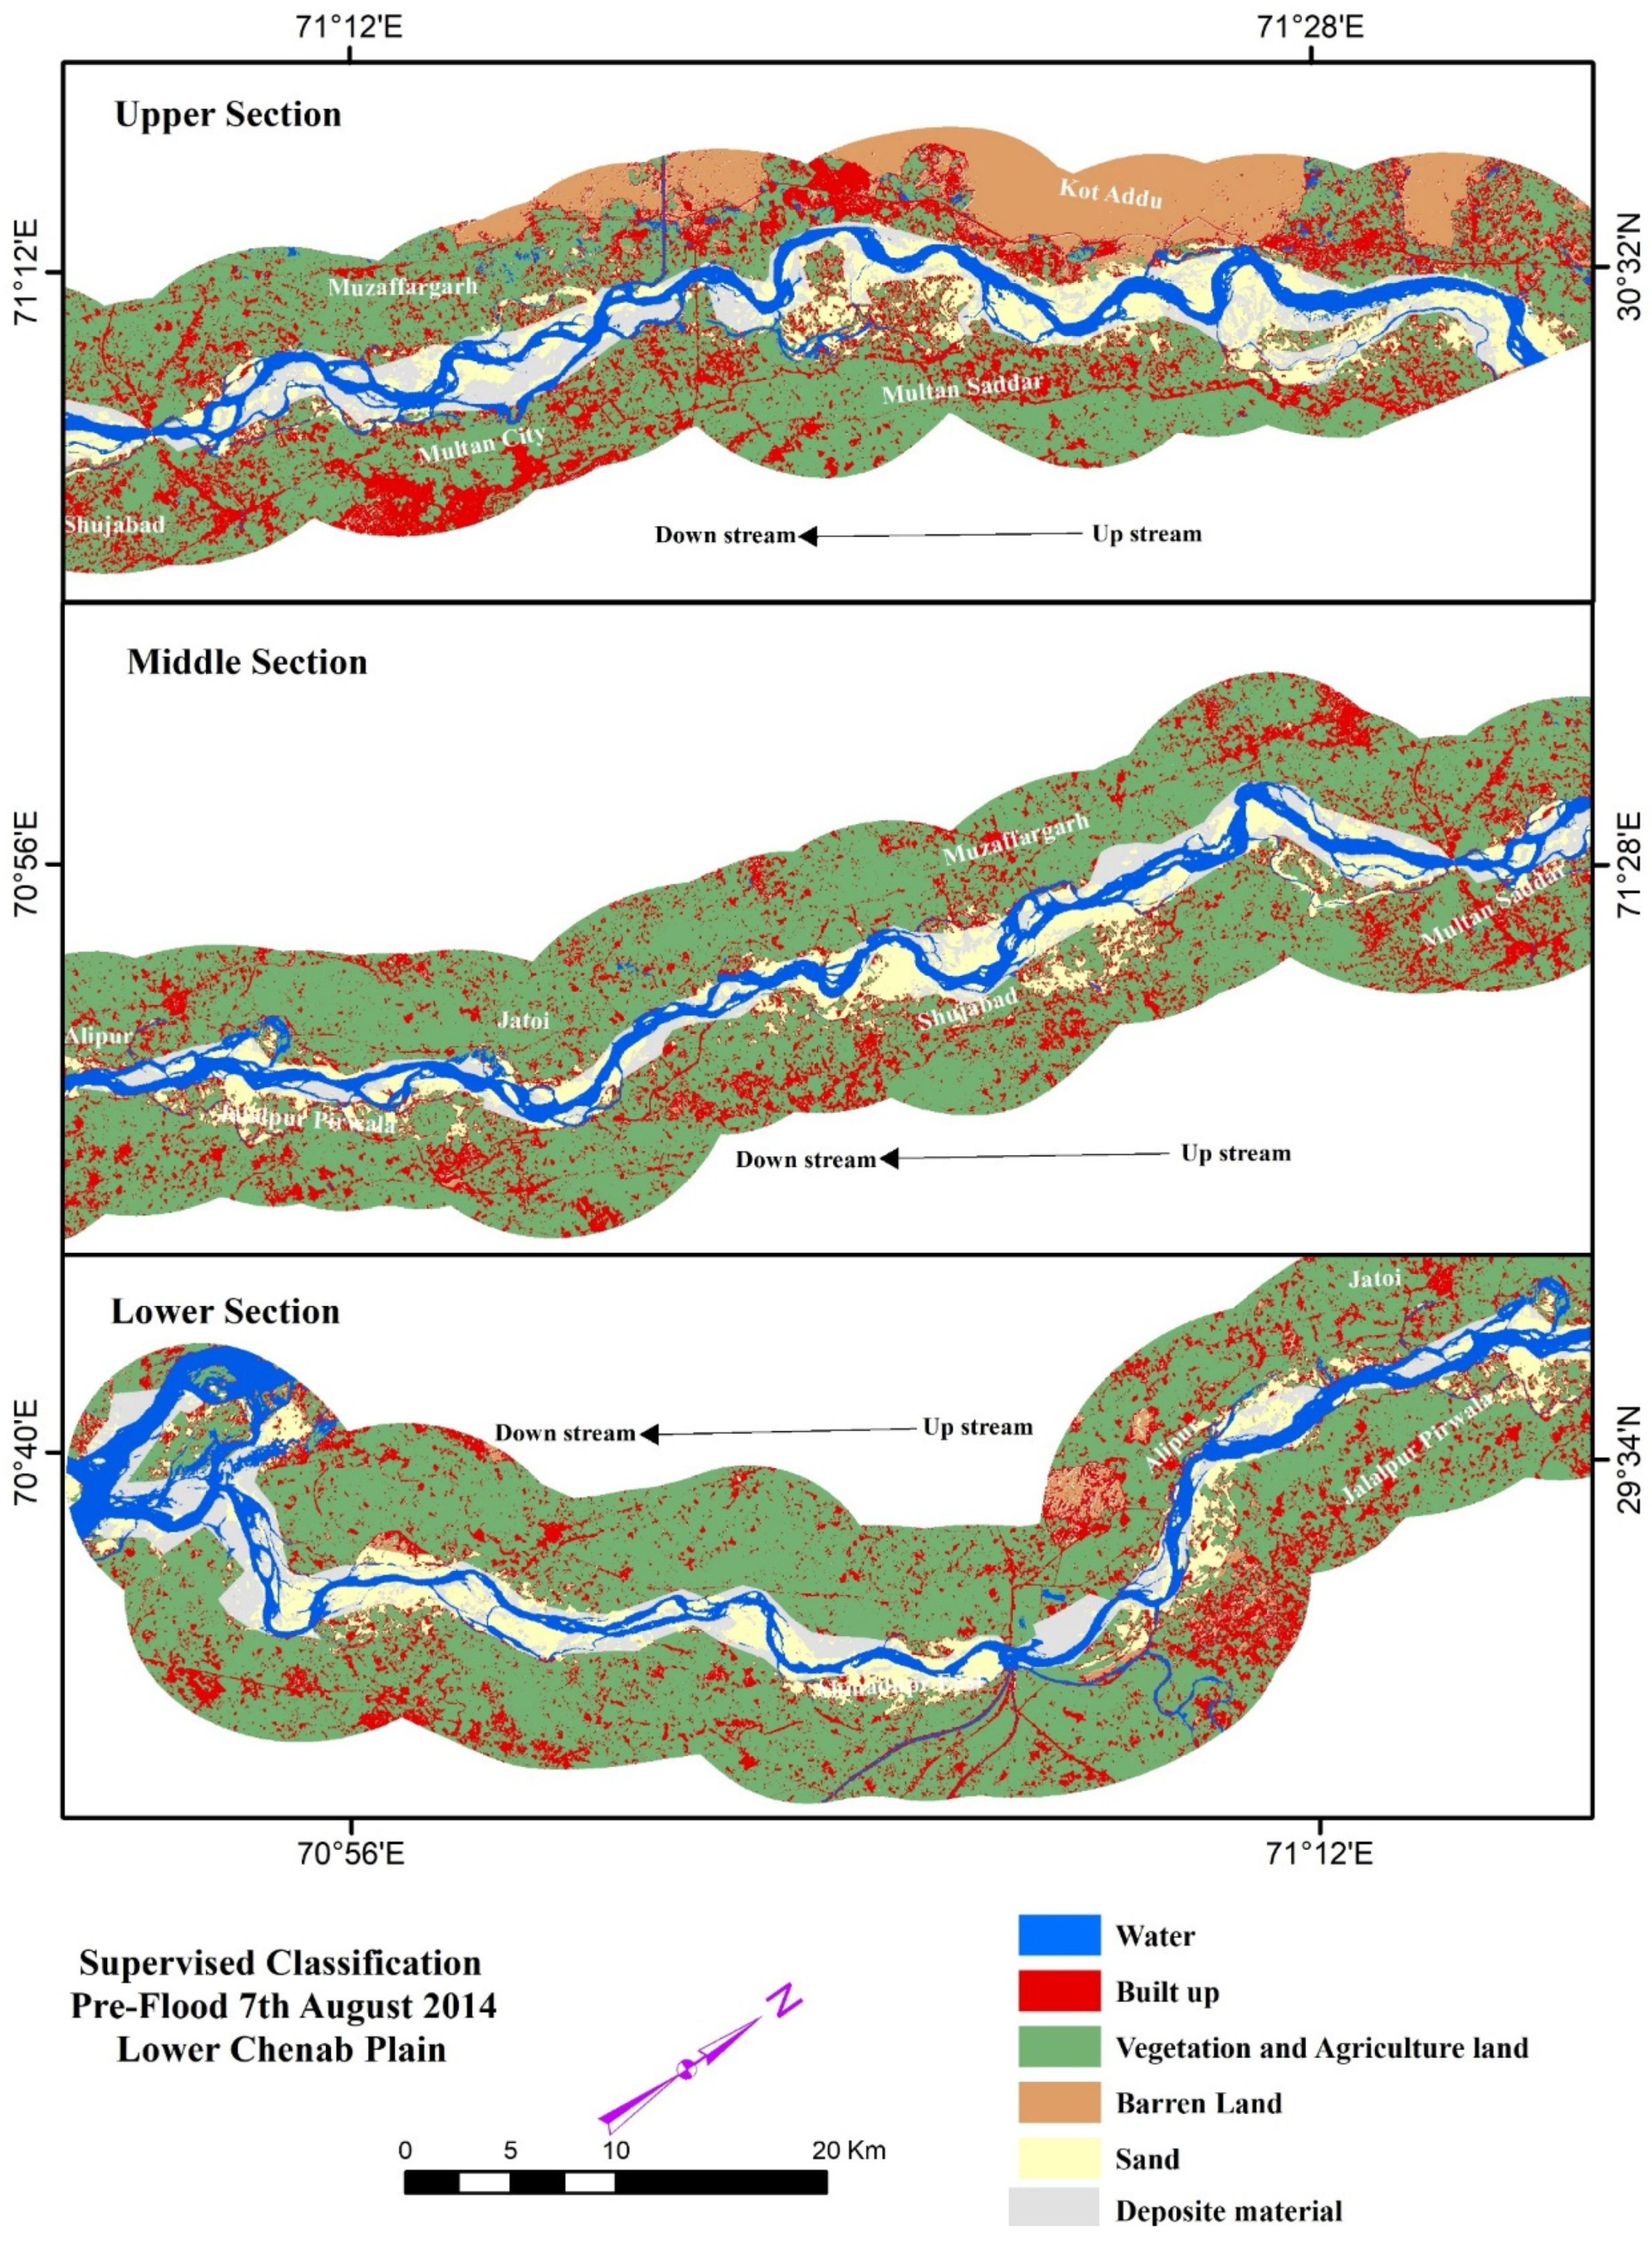
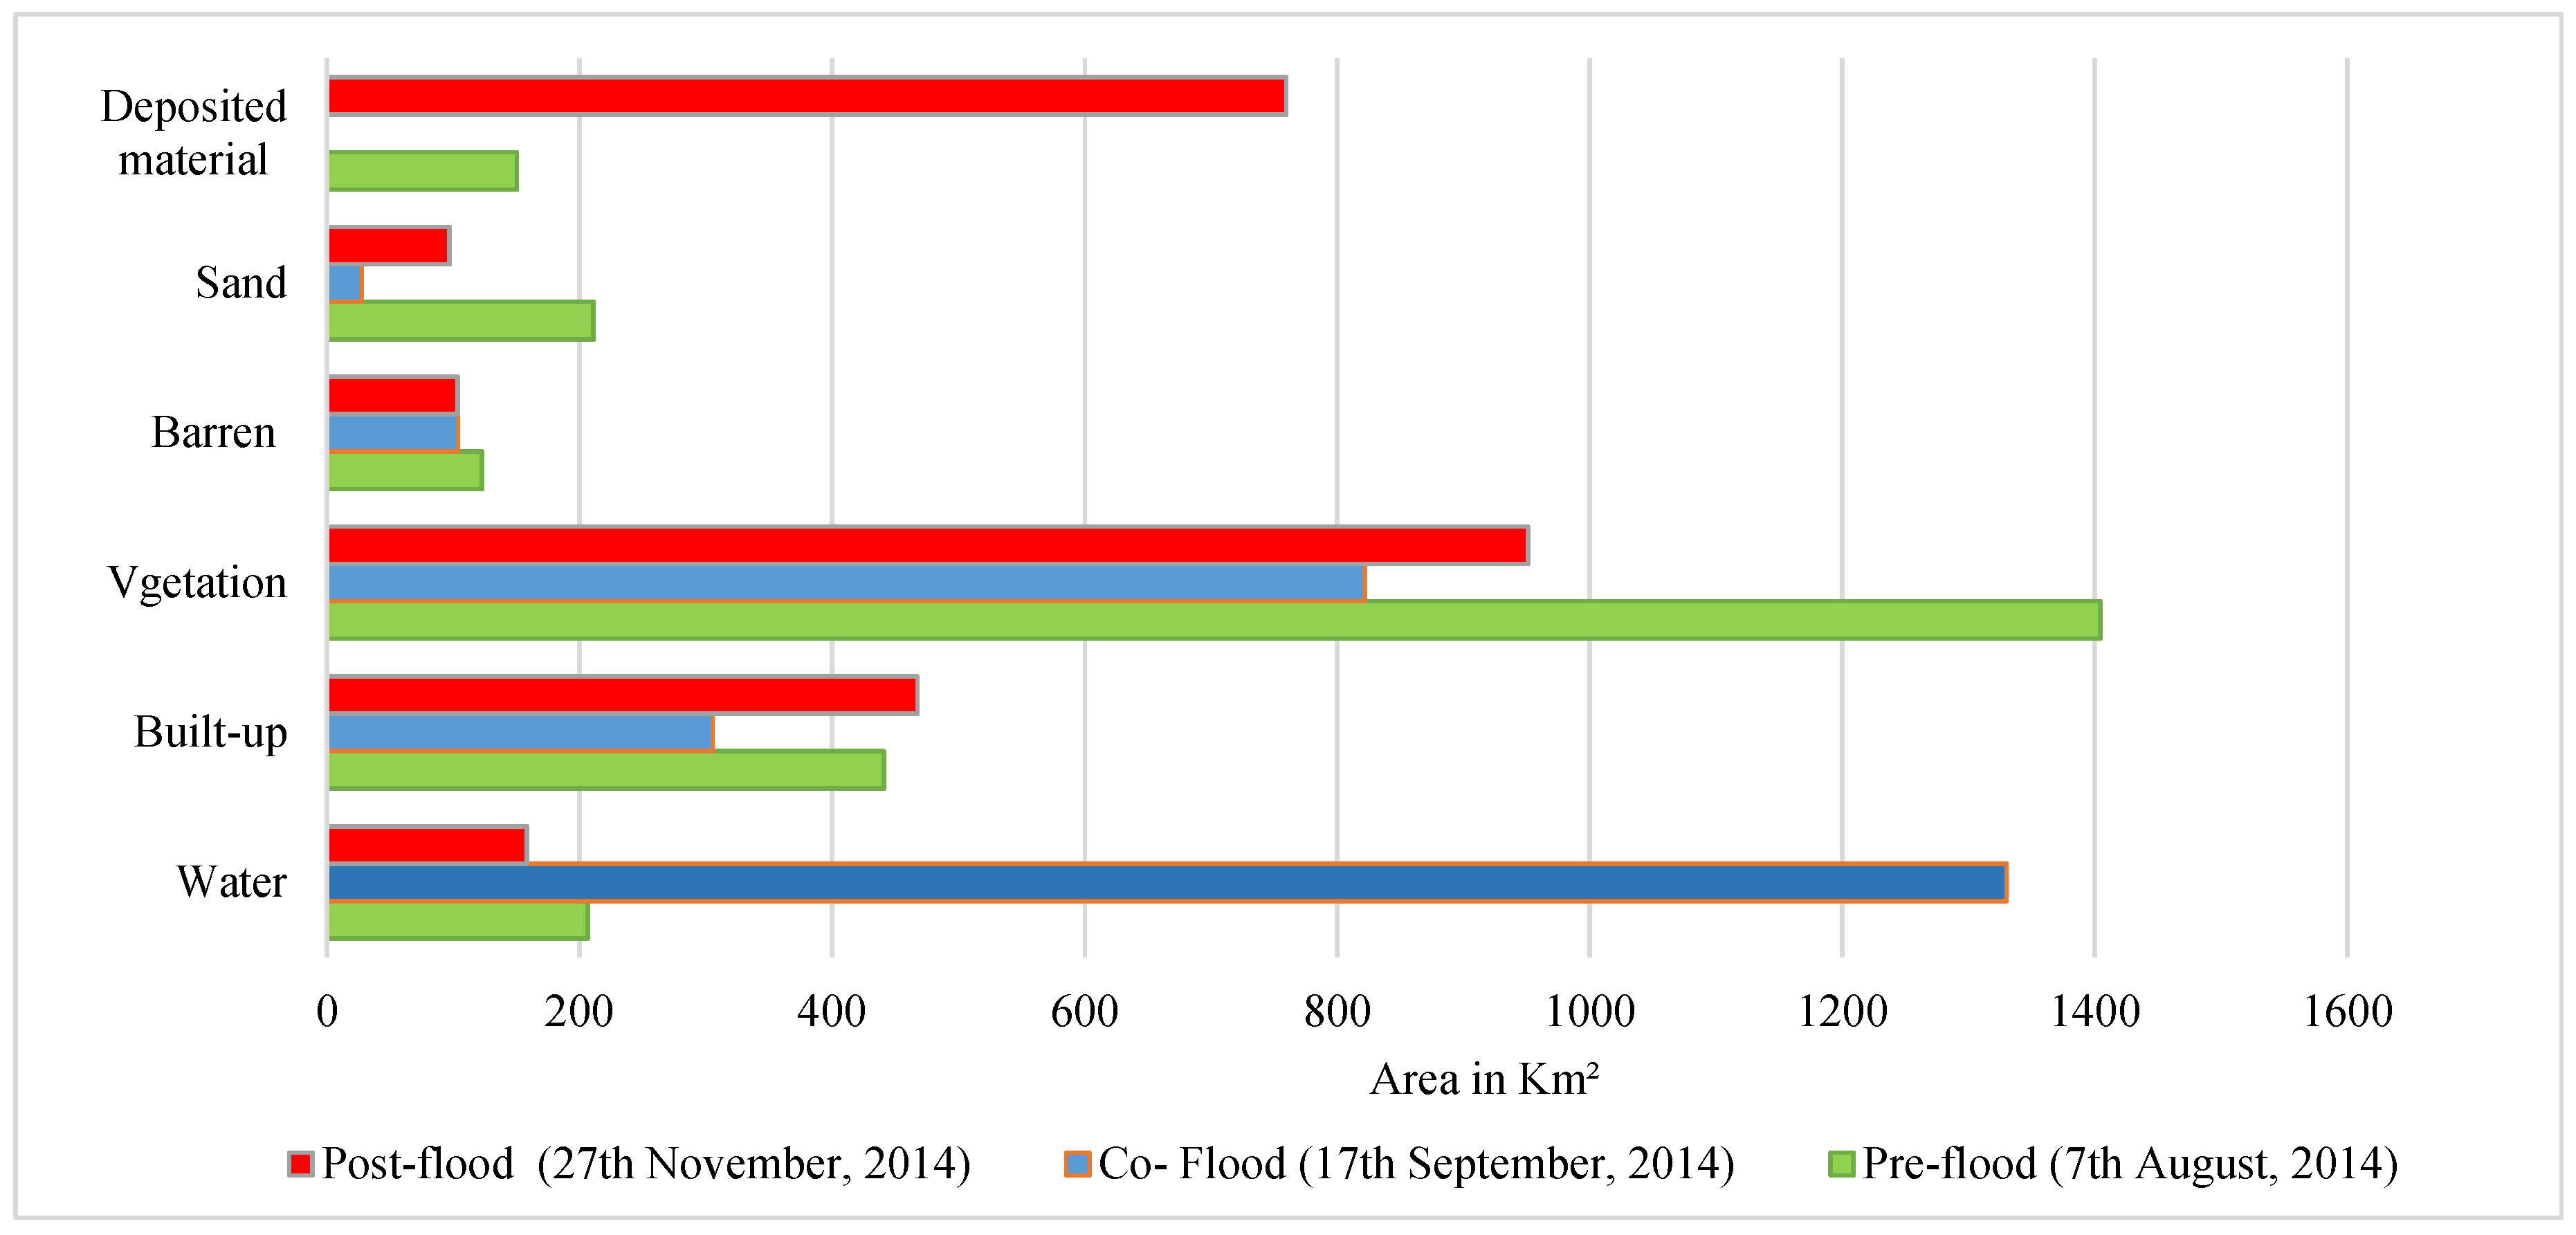
3.3. Land Use and Land Cover Changes
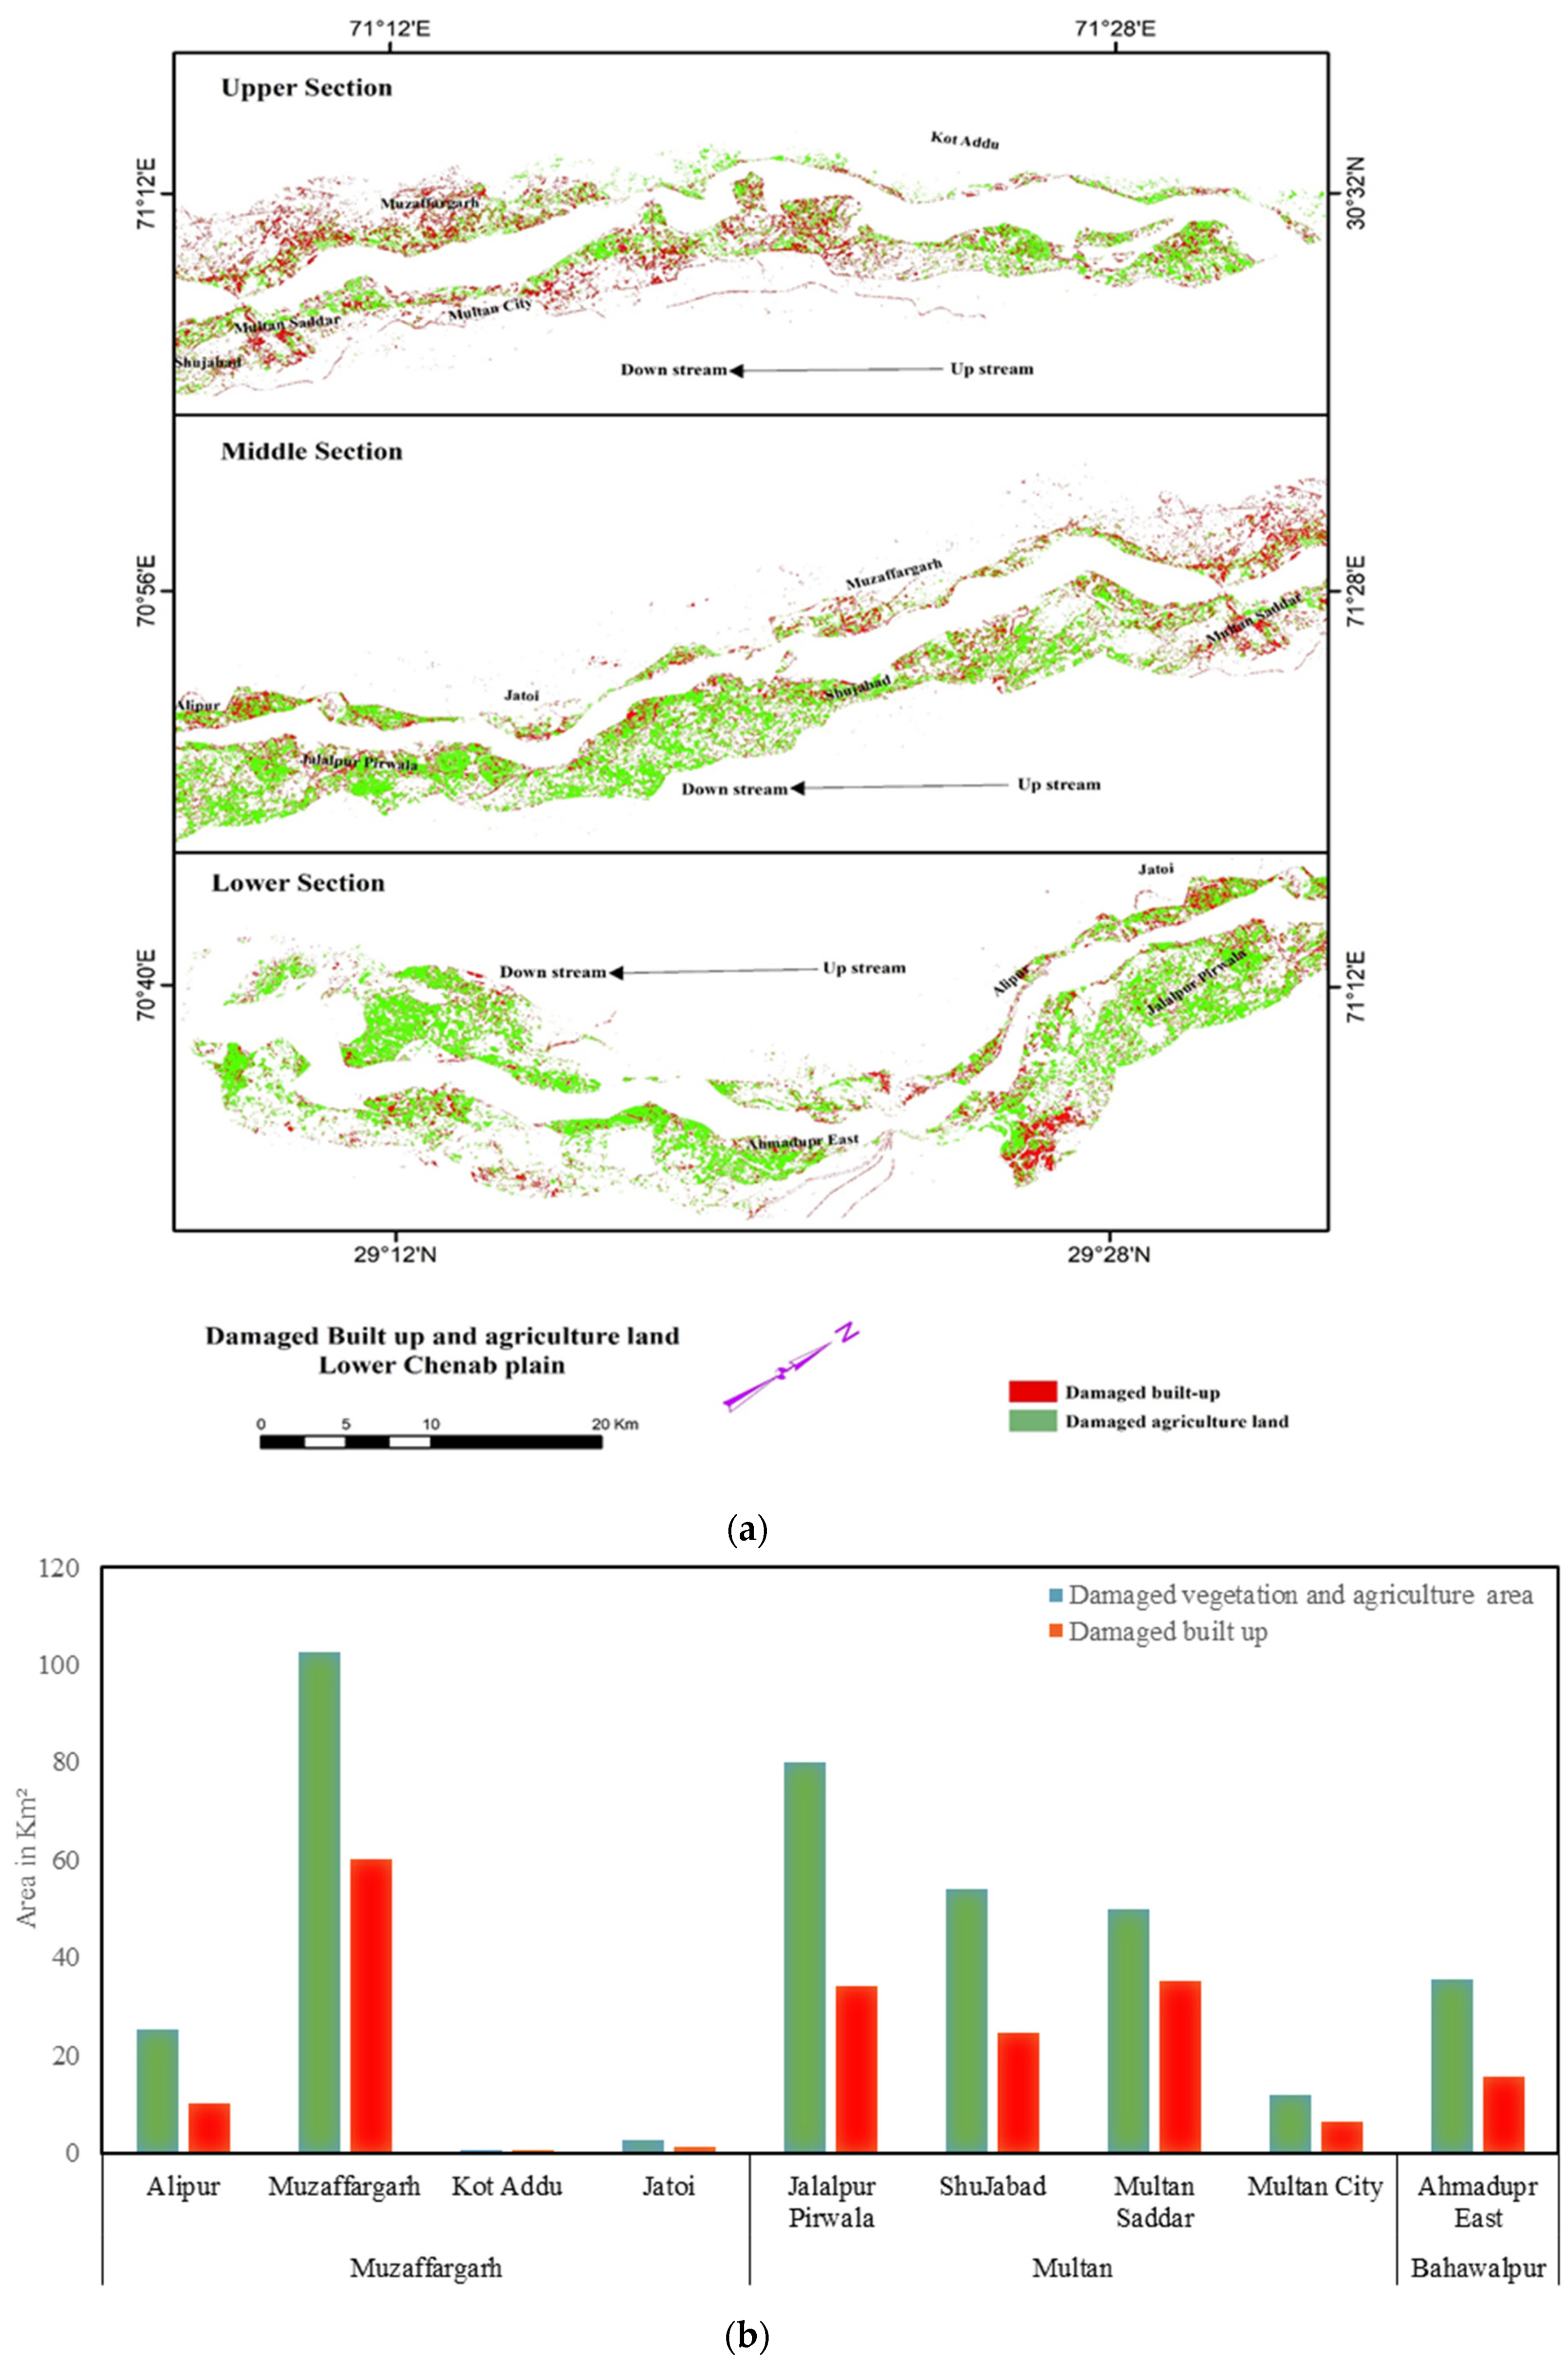
3.4. Damage Assessment
4. Discussion
5. Conclusions
Author Contributions
Funding
Acknowledgments
Conflicts of Interest
References
- Ward, P.J.; Jongman, B.; Weiland, F.S.; Bouwman, A.; van Beek, R.; Bierkens, M.F.; Ligtvoet, W.; Winsemius, H.C. Assessing flood risk at the global scale: Model setup, results, and sensitivity. Environ. Res. Lett. 2013, 8, 044019. [Google Scholar] [CrossRef]
- Schumann, G.; Bates, P.D.; Apel, H.; Aronica, G.T. Global Flood Hazard Mapping, Modeling, and Forecasting: Challenges and Perspectives. Glob. Flood Hazard Appl. Model. Mapp. Forecast. 2018, 239–244. [Google Scholar]
- Iqbal, M.S.; Dahri, Z.H.; Querner, E.P. The impact of climate change on flood frequency and intensity in the Kabul River basin. Geosciences 2018, 8, 114. [Google Scholar] [CrossRef] [Green Version]
- Rahman, A.; Khan, A.N. Analysis of flood causes and associated socio-economic damages in the Hindu Kush region. Nat. Hazards. 2011, 59, 1239–1260. [Google Scholar] [CrossRef]
- Halgamuge, M.N.; Nirmalathas, A. Analysis of large flood events: Based on flood data during 1985–2016 in Australia and India. Int. J. Disaster Risk Reduct. 2017, 24, 1–11. [Google Scholar] [CrossRef]
- Milly, P.C.D.; Wetherald, R.T.; Dunne, K.A.; Delworth, T.L. Increasing risk of great floods in a changing climate. Nature 2002, 415, 514–517. [Google Scholar] [CrossRef] [PubMed]
- Islam, A.S.; Bala, S.K.; Haque, M. Flood inundation map of Bangladesh using MODIS time-series images. J. Flood Risk Manag. 2010, 3, 210–222. [Google Scholar] [CrossRef]
- Syvitski, J.P.; Brakenridge, G.R. Causation and avoidance of catastrophic flooding along the Indus River, Pakistan. GSA Today 2013, 23, 4–10. [Google Scholar] [CrossRef]
- Gaurav, K.; Sindha, R.; Panda, P.K. The Indus flood of 2010 in Pakistan: A perspective analysis using remote sensing data. Nat. Hazards. 2011, 59, 1815–1826. [Google Scholar] [CrossRef]
- Mahmood, S.; Rahman, A.; Sajjad, A. Assessment of 2010 flood disaster causes and damages in district Muzaffargarh, Central Indus Basin, Pakistan. Environ. Earth Sci. 2019, 78, 63. [Google Scholar] [CrossRef]
- Sajjad, A.; Lu, J.; Chen, X.; Chisenga, C.; Mahmood, S. The riverine flood catastrophe in August 2010 in South Punjab, Pakistan: Potential causes, extent and damage assessment. Appl. Ecol. Environ. Res. 2019, 17, 14121–14142. [Google Scholar]
- Federal Flood Commission Islamabad (FFCI). Annual flood Report; Ministry of Water and Power, Government of Pakistan: Islamabad, Pakistan, 2015. [Google Scholar]
- Atif, I.; Mahboob, M.; Waheed, A. Spatio-Temporal Mapping and Multi-Sector Damage Assessment of 2014 Flood in Pakistan using Remote Sensing and GIS. Indian J. Sci. Technol. 2015, 8, 35. [Google Scholar] [CrossRef]
- Ali, S.; Li, D.; Congbin, F. Twenty first century climatic and hydrological changes over upper Indus Basin of Himalayan region of Pakistan. Environ. Res. Lett. 2015, 10, 14007. [Google Scholar] [CrossRef]
- Rahman, A.; Khan, A.N. Analysis of 2010-flood causes, nature and magnitude in the Khyber Pakhtunkhwa, Pakistan. Nat. Hazards. 2013, 66, 887–904. [Google Scholar] [CrossRef]
- Mahmood, S.; Rani, R. Extent of 2014 flood damages in Chenab Basin Upper Indus Plain. In Natural Hazards-Risk Assessment and Vulnerability Reduction; Intech Open: London, UK, 2018. [Google Scholar] [CrossRef] [Green Version]
- Hashmi, H.N.; Siddiqui, Q.T.M.; Ghuman, A.R.; Kamal, M.A.; Mughal, H. A critical analysis of 2010 floods in Pakistan. Afr. J. Agric. Res. 2012, 7, 1054–1067. [Google Scholar]
- Khalid, B.; Cholaw, B.; Alvim, D.S.; Javeed, S.; Khan, J.A.; Javed, M.A.; Khan, A.H. Riverine flood assessment in Jhang district in connection with ENSO and summer monsoon rainfall over Upper Indus Basin for 2010. Nat. Hazards 2018, 92, 971–993. [Google Scholar] [CrossRef]
- Haq, M.; Akhtar, M.; Muhammad, S.; Paras, S.; Rahmatullah, J. Techniques of Remote Sensing and GIS for flood monitoring and damage assessment: A case study of Sindh province, Pakistan. Egypt. J. Remote Sens. Space Sci. 2012, 15, 135–141. [Google Scholar] [CrossRef] [Green Version]
- Pakistan Meteorological Department (PMD). Annual Report; Regional Meteorological Observatory: Lahore, Pakistan, 2015.
- Ashraf, M.; Shakir, A.S. Prediction of river bank erosion and protection works in a reach of Chenab River, Pakistan. Arab. J. Geosci. 2018, 11, 145. [Google Scholar] [CrossRef]
- Chohan, K.; Ahmad, S.R.; Islam, Z.; Adrees, M. Riverine flood damage assessment of cultivated lands along Chenab River using GIS and remotely sensed data: A case study of district Hafizabad, Punjab, Pakistan. J. Geogr. Inf. Syst. 2015, 7, 506–526. [Google Scholar] [CrossRef] [Green Version]
- National Disaster Management Authority((NDMA). Annual Flood Report; Regional office: Islamabad, Pakistan, 2015.
- Punjab Provincial Disaster Management Authority (PPDMA). Annual Flood Report; Regional Office: Lahore, Pakistan, 2015. [Google Scholar]
- Moel, H.D.; Alphen, J.V.; Aerts, J. Flood maps in Europe–methods, availability and use. Nat. Hazards Earth Syst. Sci. 2009, 9, 289–301. [Google Scholar] [CrossRef] [Green Version]
- Musa, Z.N.; Popescu, I.; Mynett, A. A review of applications of satellite SAR, optical, altimetry and DEM data for surface water modelling, mapping and parameter estimation. Hydrol. Earth Syst. Sci. 2015, 19, 3755–3769. [Google Scholar] [CrossRef] [Green Version]
- Zhang, P.; Lu, J.; Feng, L.; Chen, X.; Zhang, L.; Xiao, X.; Liu, H. Hydrodynamic and Inundation Modeling of China’s Largest Freshwater Lake Aided by Remote Sensing Data. Remote Sens. 2015, 7, 4858–4879. [Google Scholar] [CrossRef] [Green Version]
- Bhatt, C.M.; Rao, G.S.; Farooq, M.; Manjusree, P.; Shukla, A.; Sharma, S.V.S.P.; Kulkarni, S.S.; Begum, A.; Bhanumurthy, V.; Diwakar, P.G.; et al. Satellite-based assessment of the catastrophic Jhelum floods of September 2014, Jammu & Kashmir, India. Geomatics. Nat. Hazards Risk 2016, 8, 309–327. [Google Scholar]
- Chignell, S.M.; Anderson, R.S.; Evangelista, P.H.; Laituri, M.J.; Merritt, D.M. Multi-temporal independent component analysis and Landsat 8 for delineating maximum extent of the 2013 Colorado front range flood. Remote Sens. 2015, 7, 9822–9843. [Google Scholar] [CrossRef] [Green Version]
- Lu, J.; Li, H.; Chen, X.; Liang, D. Numerical study of remote sensed dredging impacts on the suspended sediment transport in China’s Largest Freshwater Lake. Water 2019, 11, 2449. [Google Scholar] [CrossRef] [Green Version]
- Giustarini, L.; Chini, M.; Hostache, R.; Pappenberger, F.; Matgen, P. Flood Hazard Mapping Combining Hydrodynamic Modeling and Multi Annual Remote Sensing data. Remote Sens. 2015, 7, 14200–14226. [Google Scholar] [CrossRef] [Green Version]
- Wulder, M.A.; Masek, J.G.; Cohen, W.B.; Loveland, T.R.; Woodcock, C.E. Opening the archive: How free data has enabled the science and monitoring promise of Landsat. Remote Sens. Environ. 2012, 12, 2–10. [Google Scholar] [CrossRef]
- Sanyal, J.; Lu, X.X. Application of Remote Sensing in Flood Management with Special Reference to Monsoon Asia: A review. Nat. Hazards 2004, 33, 283–301. [Google Scholar] [CrossRef]
- Hu, Q.; Wu, W.; Xia, T.; Yu, Q.; Yang, P.; Li, Z.; Song, Q. Exploring the use of Google Earth imagery and object-based methods in land use/cover mapping. Remote Sens. 2013, 5, 6026–6042. [Google Scholar] [CrossRef] [Green Version]
- Twumasi, N.Y.D.; Shao, Z.; Altan, O. Mapping Built-Up Areas Using Two Band Ratio Onlandsat Imagery of Accra In Ghana From 1980 To 2017. Appl. Ecol. Environ. Res. 2019, 17, 13147–13168. [Google Scholar]
- Government of Punjab (GoP) Punjab Development Statistics; Bureau of Statistics Government of Punjab: Lahore, Pakistan, 2015.
- Siddiqui, M.; Haider, S.; Gabriel, H.F.; Shahzad, A. Rainfall–runoff, flood inundation and sensitivity analysis of the 2014 Pakistan flood in the Jhelum and Chenab river basin. Hydrol. Sci. J. 2018, 63, 13–14. [Google Scholar] [CrossRef]
- Hansen, M.C.; Loveland, T.R. A review of large area monitoring of land cover change using Landsat data. Remote Sens. Environ. 2012, 122, 66–74. [Google Scholar] [CrossRef]
- Munasinghe, D.; Cohen, S.; Huang, Y.F.; Tsang, Y.P.; Zhang, J.; Fang, Z.F. Intercomparison of Satellite Remote Sensing-Based Flood Inundation Mapping Techniques. J. Am. Water Resour. Assoc. 2018, 54, 834–846. [Google Scholar] [CrossRef]
- Alphan, H.; Doygun, H.; Unlukaplan, Y.I. Post-classification comparison of land cover using multitemporal Landsat and ASTER imagery: The case of Kahramanmaras, Turkey. Environ. Monit. Assess. 2009, 151, 327–336. [Google Scholar] [CrossRef]
- Rokni, K.; Ahmad, A.; Selamat, A.; Hazini, S. Water feature extraction and change detection using multitemporal Landsat imagery. Remote Sens. 2014, 6, 4173–4189. [Google Scholar] [CrossRef] [Green Version]
- AlFaisal, A.; Kafy, A.A.; Roy, S. (Integration of Remote Sensing and GIS Techniques for Flood Monitoring and Damage Assessment: A Case Study of Naogaon District, Bangladesh. J. Remote Sens. GIS 2018, 7, 236. [Google Scholar]
- Joyce, K.E.; Belliss, S.E.; Samsonov, S.V.; McNeill, S.J.; Glassey, P.J. A review of the status of satellite remote sensing and image processing techniques for mapping natural hazards and disasters. Prog. Phys. Geogr. 2009, 33, 183–207. [Google Scholar] [CrossRef] [Green Version]
- Revilla-Romero, B.; Hirpa, F.A.; Pozo, J.T.; Salamon, P.; Brakenridge, R.; Pappenberger, F.; De Groeve, T. On the use of global flood forecasts and satellite-derived inundation maps for flood monitoring in data-sparse regions. Remote Sens. 2015, 7, 15702–15728. [Google Scholar] [CrossRef] [Green Version]
- McFeeters, S.K. The use of the normalized difference water index (NDWI) in the delineation of open water features. Int. J. Remote Sens. 1996, 17, 1425–1432. [Google Scholar] [CrossRef]
- Xu, H. Modification of normalized difference water index (NDWI) to enhance open water features in remotely sensed imagery. Int. J. Remote Sens. 2006, 27, 3025–3033. [Google Scholar] [CrossRef]
- Fisher, A.; Flood, N.; Danaher, T. Comparing Landsat water index methods for automated water classification in eastern Australia. Remote Sens. Environ. 2016, 175, 167–182. [Google Scholar] [CrossRef]
- Ho, L.T.K.; Umitsu, M.; Yamaguchi, Y. Flood hazard mapping by satellite images and SRTM DEM in the Vu Gia-Thu Bon alluvial plain, central Vietnam. Arch. Photogramm Remote Sens. 2010, 38, 275–279. [Google Scholar]
- Elhag, M. Consideration of Landsat-8 spectral band combination in typical Mediterranean forest classification in Halkidiki, Greece. Open Geosci. 2017, 9, 468–479. [Google Scholar] [CrossRef]
- Acharya, T.D.; Subedi, A.; Lee, D.H. Evaluation of Water Indices for Surface Water Extraction in a Landsat 8 Scene of Nepal. Sensors. 2018, 18, 2580. [Google Scholar] [CrossRef] [PubMed] [Green Version]
- Zhou, S.L.; Zhang, W.C. Flood monitoring and damage assessment in Thailand using multi-temporal HJ-1A/1B and MODIS images. IOP Conf. Ser. Earth Environ. Sci. 2017, 57. [Google Scholar] [CrossRef]
- Notti, D.; Giordan, D.; Caló, F.; Pepe, A.; Zucca, F.; Pedro Galve, J. Potential and Limitations of Open Satellite Data for Flood Mapping. Remote Sens. 2018, 10, 1673. [Google Scholar] [CrossRef] [Green Version]
- Mahmood, S.; Khan, A.H.; Mayo, S.M. Exploring underlying causes and assessing damages of 2010 flash flood in the upper zone of Panjkora River. Nat. Hazards 2016, 83, 1213–1227. [Google Scholar] [CrossRef]
- Mahmood, S.; Khan, A.H.; Ullah, S. Assessment of 2010 flash flood causes and associated damages in Dir Valley, Khyber Pakh-tunkhwa Pakistan. Int. J. Disaster Risk Reduct. 2016, 16, 215–223. [Google Scholar] [CrossRef]
- Memon, A.A.; Muhammad, S.; Rahman, S.; Haq, M. Flood monitoring and damage assessment using water indices: A case study of Pakistan flood-2012. Egypt. J. Remote Sens Space Sci. 2015, 18, 99–106. [Google Scholar] [CrossRef] [Green Version]
- Shuhua, Q.I.; Brown, D.G.; Tian, Q.; Jiang, L.; Zhao, T.; Bergen, K.M. Inundation Extent and Flood Frequency Mapping Using LANDSAT Imagery and Digital Elevation Models. GIScience Remote Sens. 2009, 46, 101–127. [Google Scholar]
- Frazier, P.S.; Page, K.J. Water body detection and delineation with Landsat TM data. Photogramm. Eng. Remote Sens. 2000, 66, 1467. [Google Scholar]
- Uddin, k.; Matin, M.A.; Meyer, F.J. Operational Flood Mapping Using Multi-Temporal Sentinel-1 SAR Images: A Case Study from Bangladesh. Remote Sens. 2019, 11, 1581. [Google Scholar] [CrossRef] [Green Version]
- Pradhan, B.; Pirasteh, S.; Shafie, M. Maximum flood prone area mapping using RADARSAT images and GIS: Kelantan river basin. Int. J. Geoinformatics 2009, 5, 11–23. [Google Scholar]
- Giordan, D.; Notti, D.; Villa, A.; Zucca, F.; Calò, F.; Pepe, A.; Dutto, F.; Pari, P.; Baldo, M.; Allasia, P. Low cost, multiscale and multi-sensor application for flooded area mapping. Nat. Hazards Earth Syst. Sci. 2018, 18, 1493–1516. [Google Scholar] [CrossRef] [Green Version]


| Path | Row | Date of Acquisition | Flood Instances | Use | Resolution (m) |
|---|---|---|---|---|---|
| 151 | 39 and 40 | 7 August 2014 | Pre-flood | Land-use classification | 30 |
| 150 | 39 and 40 | 17 September 2014 | Co-flood | Land-use classification and Flood monitoring | 30 |
| 151 | 39 and 40 | 24 September 2014 | Co-flood | Flood monitoring | 30 |
| 150 | 39 and 40 | 3 October 2014 | Post-flood | Flood monitoring | 30 |
| 151 | 39 and 40 | 10 October 2014 | Post-flood | Flood monitoring | 30 |
| 150 | 39 and 40 | 19 October 2014 | Post-flood | Flood monitoring | 30 |
| 151 | 39 and 40 | 26 October 2014 | Post-flood | Flood monitoring | 30 |
| 151 | 39 and 40 | 11 November 2014 | Post-flood | Flood monitoring | 30 |
| 151 | 39 and 40 | 27 November 2014 | Post-flood | Land-use classification and Flood monitoring | 30 |
| Classes | 17 September 2014 | 24 September 2014 | 3 October 2014 | 10 October 2014 | ||||||||||||
| PA | UA | OA | KC | PA | UA | OA | KC | PA | UA | OA | KC | PA | UA | OA | KC | |
| Water | 0.87 | 0.96 | 0.92 | 0.84 | 0.91 | 0.93 | 0.91 | 0.83 | 0.88 | 0.92 | 0.90 | 0.81 | 0.91 | 0.90 | 0.90 | 0.81 |
| Non-Water | 0.96 | 0.86 | 0.93 | 0.91 | 0.91 | 0.88 | 0.90 | 0.92 | ||||||||
| Classes | 19 October 2014 | 26 October 2014 | 11 November 2014 | 27 November 2014 | ||||||||||||
| PA | UA | OA | KC | PA | UA | OA | KC | PA | UA | OA | KC | PA | UA | OA | KC | |
| Water | 0.91 | 0.91 | 0.90 | 0.80 | 0.94 | 0.86 | 0.90 | 0.81 | 0.91 | 0.85 | 0.88 | 0.76 | 0.93 | 0.91 | 0.92 | 0.85 |
| Non-water | 0.90 | 0.92 | 0.87 | 0.90 | 0.86 | 0.92 | 0.92 | 0.93 | ||||||||
| PA = Producer Accuracy; UA = User Accuracy; OA = Overall Accuracy; KC = Kappa Coefficient | ||||||||||||||||
| Classes | Pre-Flood Classified Image (7 August 2014) | Co-Flood Classified Image (17 September 2014) | Post-Flood Classified Image (17 September 2014) | |||||||||
|---|---|---|---|---|---|---|---|---|---|---|---|---|
| PA | UA | OA | KC | PA | UA | OA | KC | PA | UA | OA | KC | |
| water | 0.95 | 0.92 | 0.86 | 0.83 | 0.92 | 0.92 | 0.85 | 0.81 | 0.99 | 0.88 | 0.92 | 0.90 |
| built up | 0.95 | 0.80 | 0.83 | 0.76 | 0.98 | 0.84 | ||||||
| vegetation | 0.70 | 0.88 | 0.87 | 0.80 | 0.92 | 0.92 | ||||||
| barren | 0.85 | 0.92 | 0.78 | 0.88 | 0.88 | 0.96 | ||||||
| sand | 0.80 | 0.80 | 0.85 | 0.88 | 0.83 | 0.99 | ||||||
| Deposited material | 0.95 | 0.86 | - | - | - | - | 0.92 | 0.92 | ||||
| Districts | Tehsils | 17 September 2014 | 24 September 2014 | 3 October 2014 | 10 October 2014 | 19 October 2014 | 26 October 2014 | 11 November 2014 | 27 November 2014 |
|---|---|---|---|---|---|---|---|---|---|
| Muzaffargarh | Alipur | 58.87 | 57.02 | 50.86 | 34.31 | 26.24 | 15.66 | 12.34 | 11.14 |
| Muzaffargarh | 530.53 | 507.99 | 485.48 | 409.12 | 363.56 | 308.75 | 166.25 | 68.93 | |
| Kot Addu | 2.41 | 2.77 | 2.45 | 2.82 | 2.13 | 1.55 | 0.71 | 0.42 | |
| Jatoi | 11.39 | 15.37 | 13.29 | 19.48 | 15.23 | 11.25 | 8.21 | 1.38 | |
| Multan | Jalalpur Pirwala | 212.51 | 191.89 | 141.34 | 97.86 | 56.34 | 40.16 | 21.45 | 16.01 |
| ShuJabad | 169.51 | 159.95 | 96.19 | 88.48 | 64.73 | 40.36 | 25.13 | 10.39 | |
| Multan Saddar | 209.21 | 223.26 | 212.56 | 205.03 | 188.45 | 147.9 | 74.32 | 22.80 | |
| Multan City | 37.43 | 42.58 | 41.95 | 39.72 | 39.67 | 35.78 | 17.65 | 3.7 | |
| Bahawalpur | Ahmadupr East | 148.57 | 129.13 | 103.80 | 83.6 | 44.05 | 24.94 | 19.34 | 15.79 |
| Total Area | 1380.43 | 1330.96 | 1147.92 | 980.54 | 800.4 | 626.35 | 345.4 | 146.56 | |
© 2020 by the authors. Licensee MDPI, Basel, Switzerland. This article is an open access article distributed under the terms and conditions of the Creative Commons Attribution (CC BY) license (http://creativecommons.org/licenses/by/4.0/).
Share and Cite
Sajjad, A.; Lu, J.; Chen, X.; Chisenga, C.; Saleem, N.; Hassan, H. Operational Monitoring and Damage Assessment of Riverine Flood-2014 in the Lower Chenab Plain, Punjab, Pakistan, Using Remote Sensing and GIS Techniques. Remote Sens. 2020, 12, 714. https://doi.org/10.3390/rs12040714
Sajjad A, Lu J, Chen X, Chisenga C, Saleem N, Hassan H. Operational Monitoring and Damage Assessment of Riverine Flood-2014 in the Lower Chenab Plain, Punjab, Pakistan, Using Remote Sensing and GIS Techniques. Remote Sensing. 2020; 12(4):714. https://doi.org/10.3390/rs12040714
Chicago/Turabian StyleSajjad, Asif, Jianzhong Lu, Xiaoling Chen, Chikondi Chisenga, Nayyer Saleem, and Hammad Hassan. 2020. "Operational Monitoring and Damage Assessment of Riverine Flood-2014 in the Lower Chenab Plain, Punjab, Pakistan, Using Remote Sensing and GIS Techniques" Remote Sensing 12, no. 4: 714. https://doi.org/10.3390/rs12040714