Article

An Automatic Processing Chain for Near Real-Time Mapping of Burned Forest Areas Using Sentinel-2 Data

1
CIMA Research Foundation, I-17100 Savona, Italy
2
Italian Department of Civil Protection, Presidency of the Council of Ministers, I-00189 Rome, Italy
*
Author to whom correspondence should be addressed.
Remote Sens. 2020, 12(4), 674; https://doi.org/10.3390/rs12040674
Submission received: 16 January 2020 / Revised: 11 February 2020 / Accepted: 12 February 2020 / Published: 18 February 2020

Abstract

:
A fully automated processing chain for near real-time mapping of burned forest areas using Sentinel-2 multispectral data is presented. The acronym AUTOBAM (AUTOmatic Burned Areas Mapper) is used to denote it. AUTOBAM is conceived to work daily at a national scale for the Italian territory to support the Italian Civil Protection Department in the management of one of the major natural hazards, which affects the territory. The processing chain includes a Sentinel-2 data procurement component, an image processing algorithm, and the delivery of the map to the end-user. The data procurement component searches every day for the most updated products into different archives. The image processing part represents the core of AUTOBAM and implements an algorithm for burned forest areas mapping that uses, as fundamental parameters, the relativized form of the delta normalized burn ratio and the normalized difference vegetation index. The minimum mapping unit is 1 ha. The algorithm implemented in the image processing block is validated off-line using maps of burned areas produced by the Copernicus Emergency Management Service. The results of the validation shows an overall accuracy (considering the classes of burned and unburned areas) larger than 95% and a kappa coefficient larger than 80%. For what concerns the class of burned areas, the commission error is around 1%−3%, except for one case where it reaches 25%, while the omission error ranges between 6% and 25%.

Graphical Abstract

1. Introduction

Forest fires and, more generally, wildfires represent one of the major causes of ecosystem disturbance and ecological damage. Besides influencing atmospheric chemistry and air quality in terms of emitted greenhouse gases and the presence of aerosol in the atmosphere [1], they change land surface properties, causing loss of vegetation and impacts on forestry economy and local agriculture economy. In turn, loss of vegetation exposes soil to erosion and makes burned areas more vulnerable to runoff and then susceptible to flood [2]. Moreover, the consumption of vegetation that previously anchored the topsoil implies that burned landscapes may become prone to landslides. Accurate knowledge of location and extent of a burned area (BA) is, therefore, fundamental for damage assessment, guiding minimization activities of the aforementioned dangerous effects of vegetation loss, as well as for planning and monitoring vegetation restoration [3].
Satellite earth observation (EO) is widely used to map a BA. Among the different types of EO instruments, multispectral sensors have demonstrated their suitability for this purpose, even though cloud cover can represent a challenge, especially in geographic areas, such as tropical ones, where the presence of clouds can be persistent. Even fire smoke represents a challenge because it may hamper the observation of burned vegetation. Fire has significant effects on vegetation reflectance, in particular on the reflectance ( ρ ) in the near-infrared (NIR) and short wave infrared (SWIR) spectral bands. The difference between the spectral responses of healthy vegetation and burned areas reaches a peak in these bands because a significant reduction of the NIR reflectance ( ρ N I R ) and an increase of the SWIR reflectance ( ρ S W I R ) occur after burning. The former effect is mainly due to the sensitivity of the NIR band to the chlorophyll content of healthy vegetation, while the latter effect is related to the influence of the water content of soil and vegetation on the SWIR reflectance [4,5,6,7].
Even in the absence of cloud cover, burned areas may be undetected by optical sensors. The spectral response of surface fires that do not impact the canopy is quite similar to that of unburned areas, as shown in [7], because of the inability of optical radiation to penetrate the dense canopy. More generally, omission errors can be made when dealing with low severity fires because the fire effect on overall surface reflectance can be lower than that needed to detect the change in the landscape produced by the fire itself. It was found that, for the standard NASA BA product [8], derived from the MODIS sensor, the BA omission error was above 65% (at a global scale) [9]. Using sensors, such as Landsat or Sentinel-2, with higher spatial resolution (20–30m instead of 500m), but worse temporal resolution (5–16 days instead of 1–2 days), the performances improved and omission errors equal to around 40% [10,11], 26.5% [12], and 22% [13] were obtained (generally, at smaller spatial scales).
Undetected clouds represent the major source of commission errors; it was found that commission error was above 40% (at a global scale) for the standard NASA BA product [8] , while it ranged between 48% and 19% for operational BA products derived from higher resolution sensors [10,11,12,13].
The demand for near-real-time (NRT) information on natural disasters derived from EO data has increased considerably during recent years worldwide (NRT refers to the time needed to deliver the information starting from when EO data are available). As for burned areas, several operational services using EO data are currently available (see [7] for details). Among them, the rapid mapping component of the Copernicus Emergency Management Service (CEMS) can provide emergency managers with maps of burned areas at different spatial resolutions (from medium-high to very high) using optical sensors like WorldView-3, Pleiades, SPOT6-7, and Sentinel-2 (https://emergency.copernicus.eu). CEMS is available 24-hours-a-day, 365 days-a-year. However, it is an on-demand service, being triggered on request by authorized users (e.g., National Civil Protection Agencies). Hence, an automatic tool enabling continuous and systematic monitoring of burned areas by routinely producing medium-high resolution maps can complement the rapid mapping component of CEMS for what concerns fire management. In particular, it can improve the timeliness of the maps because the process does not require any user activation. Moreover, it can contribute to the effectiveness of CEMS activation through a better identification of the area of interest, when images with a very high spatial resolution (e.g., WorldView-3) are required for an accurate delineation of the BA extent. Such an automatic tool can, therefore, be useful for local authorities or government agencies at a national scale to take better advantage of the progress achieved in EO technology for managing fire emergencies. The continuous and systematic processing of EO data may also allow users to build a more complete dataset of burned areas in order to derive statistics about the impact of forest fires during the fire season.
The present availability of Sentinel-2 (S2) multispectral data every 5-days on the same target area represents a unique opportunity to design the aforementioned tool, thus to systematically produce maps of burned areas at medium-high spatial resolution (20 m, which is the resolution of the SWIR bands). Several investigations demonstrated the suitability of S2 to detect BA [3,10,12,14,15,16]. It was also found that the high revisit frequency (5 days) of S2 data could mitigate the problem of BA detection in geographic areas with frequent cloud cover [17]. A systematic NRT burned forest areas mapping service was recently requested by the Italian Department of Civil Protection (DCP) in the framework of its competences assigned by law.
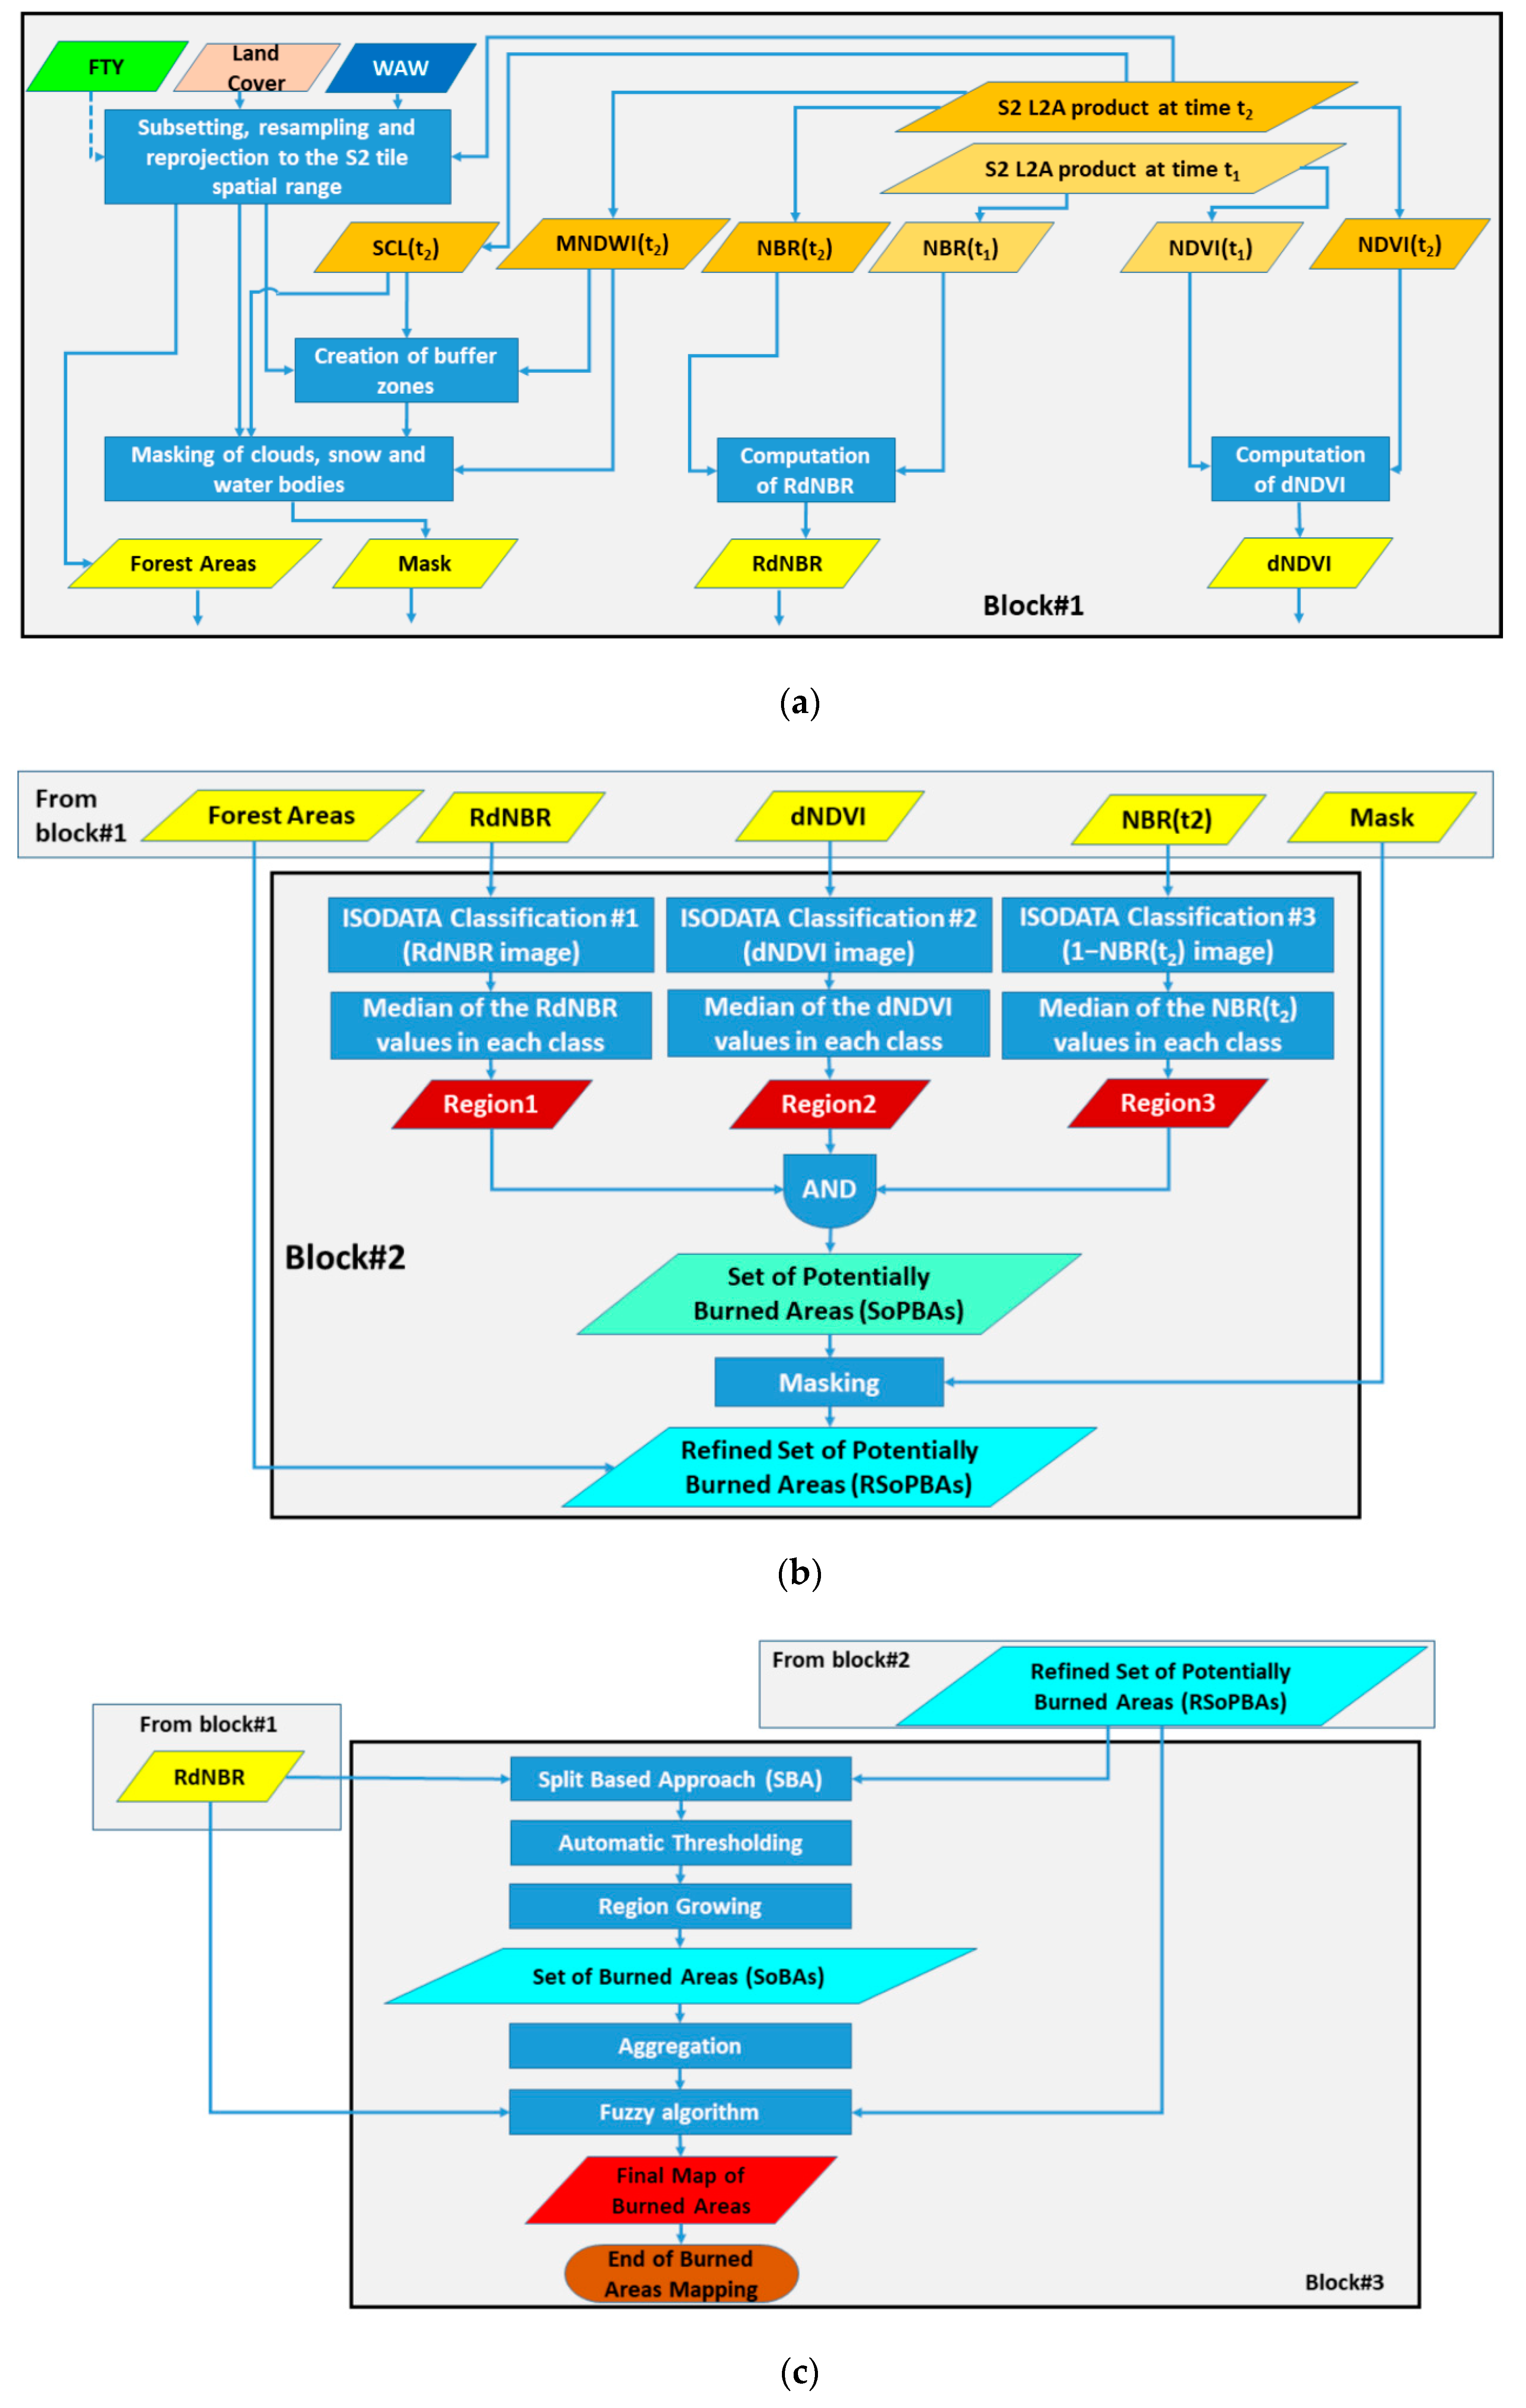
This paper presented an automatic processor, which does not need any supervision, or user intervention, that accomplishes a systematic daily mapping of burned forest areas using S2 data. The acronym AUTOBAM (AUTOmatic Burned Areas Mapper) is used to denote this tool. AUTOBAM was set up in response to the aforementioned request of the Italian DCP, in the framework of the convention between DCP and CIMA Research Foundation, which is one of the DCP competence centers. Therefore, it was conceived to work at national (Italian) scale. Anyway, AUTOBAM can work on any selected pair of pre-fire and post-fire S2 images. AUTOBAM includes also a Sentinel-2 data procurement block, as well as a block for the transfer of the maps to the Italian DCP. Hence, this paper deals also with other challenges related to an operational service, like the NRT access to the S2 data and the delivery of the map to the end-user. Together with the design of a new fully automatic BA detection algorithm, these aspects represent a novel contribution to the literature.
The present release of AUTOBAM focuses on forests because they represent a target that, compared to other land cover types, has a phenological cycle that is quite slow. Hence, a short-term decrease of NIR reflectance combined with a short-term increase of the SWIR reflectance can be reliably ascribed to a fire. Conversely, in other land cover types, such as agricultural areas, short term variations of the reflectance can be due to different causes from fires (e.g., short-term phenology, harvesting activities). Considering that AUTOBAM is a totally unsupervised tool that runs daily at a national scale, it is not possible to provide it with spatially accurate information about short-term phenology and agricultural activities. Hence, including targets, such as agricultural areas, would imply the risk of committing a quite large number of false alarms.
Different approaches are available in the literature to detect burned forest areas using multispectral data. They include visual interpretation [18], physically-based approaches [8,19], supervised classification methods [20], linear and non-linear regression [21,22], principal component analysis [23], support vector regression [24], fuzzy logic [25], spectral mixture analysis [26], and analysis of time series of data [10,27]. Among the others, threshold-based classification represents a methodological reference for mapping BA [3] and, more generally, for the identification of changes due to natural disasters using EO data [28]. The main advantage of a thresholding approach is the computational efficiency that makes it suitable for rapid mapping purposes; it is, therefore, used in AUTOBAM. Several threshold values have been proposed in the literature to discriminate BA (and also distinguish among different degrees of burn severity), generally based on empirical data [5,29,30]. However, a threshold value generally depends on many factors, such as environmental and satellite system parameters, so that it can be highly variable. Therefore, thresholds derived in an empirical way may lack generality, and their applicability to data acquired under different environmental conditions can be questioned. AUTOBAM implements an algorithm to map burned areas that includes automatic thresholding and a method to account for the spatial context and variability. The use of automatic thresholding may be problematic if changed regions cover only a small portion of the satellite scene (see Section 3.2.3). AUTOBAM copes with this problem in a new way by applying a method originally introduced in [28] and successively modified in [31]. The BA mapping algorithm implemented in AUTOBAM is validated considering maps produced by the CEMS in 2018 and 2019 as a benchmark.
The paper has been organized as follows. Section 2 gives an overview of S2 data and introduces the data used by the AUTOBAM tool, as well as the data used to validate the BA mapping algorithm. The latter is presented in Section 3 that describes also the data procurement block and the delivery of the burned forest areas map to the final user. Section 4 presents the results of the validation that are discussed in Section 5, while Section 6 draws the main conclusions.

2. Materials

2.1. Sentinel-2 Data

The Sentinel-2 multispectral instrument performs measurements in 13 spectral bands with spatial resolutions ranging from 10 to 60 m. The spectral channels include four bands at 10 m spatial resolution, six bands at 20 m spatial resolution, and three bands at 60 m spatial resolution. S2 products are available as elementary granules, also called tiles, of fixed size (100 × 100 km2), along with a single orbit. A granule contains all possible spectral bands, and it is the minimum indivisible partition of a product. Figure 1 shows the S2 tiles that cover the Italian territory and are processed by AUTOBAM; their number is 70 subdivided along six orbits. It takes five days to totally cover Italy with the data provided by the S2A and S2B satellites.
AUTOBAM uses level 2A (L2A) surface reflectance products in order to work with data corrected from the atmospheric effects and to take advantage of the availability of a scene classification (SCL) map, which is useful to mask clouds, snow, and water bodies. Among the data included in L2A products, only BOA ρ images at 10 and 20 m resolution and the SCL map at 20 m resolution are used by the processor. The SCL map distinguishes among 11 classes listed in Table 1.
L2A products are available within 12-18 hours through the Copernicus Open Access Hub (also known as Sentinel Data Hub System––DHuS), as well as, for the observations of the Italian territory, through the Hellenic National Sentinel Data Mirror Site––HNSDMS (even the Italian Collaborative Ground Segment will be considered, when it will be fully operative). Hence, these products are suitable for a NRT service just like that presented in this paper.

2.2. Spectral Indices Used by the Algorithm to Map Burned Areas

AUTOBAM basically performs the classification of a difference image for mapping BA. The difference image can be derived by comparing the pre-fire and post-fire values of a spectral index combining the NIR and SWIR bands, such as the normalized burned ratio (NBR), defined as ( ρ N I R ρ S W I R ) / ( ρ N I R + ρ S W I R ) [32]. Actually, instead of simply computing d N B R = N B R p r e f i r e N B R p o s t f i r e , relativized variables were proposed [5,30] in order to reduce the correlation of dNBR with N B R p r e f i r e , which implies that pixels with low N B R p r e f i r e have low dNBR regardless of the degree of burn severity [30]. AUTOBAM uses the relativized dNBR, defined as [5]:
R d N B R = d N B R | N B R p r e f i r e / 1000 |
where | · | indicates the absolute value, and the pre-fire NBR is divided by 1000 because, by convention, NBR is multiplied by 1000 to transform the data in integer format [5,33].
Besides the RdNBR index, AUTOBAM derives also the normalized difference vegetation index (NDVI), defined as ( ρ N I R ρ R E D ) / ( ρ N I R + ρ R E D ) [34], and the modified normalized water index (MNDWI) defined as ( ρ g r e e n ρ S W I R ) / ( ρ g r e e n + ρ S W I R ) [35]. The former is used to complement NBR for BA mapping (details in Section 3.2.2); although spectral indices based on NIR and RED bands proved to be less effective for BA discrimination than those combining NIR and SWIR bands [7], NDVI was widely used for this purpose. Accounting for vegetation vigor, NDVI is, in principle, able to detect the deteriorations of pigments and leaf structure caused by fires [36]. Hence, even the difference between pre- and post-fire values of NDVI (dNDVI) can, to some extent, help in detecting burned areas. MNDWI is used for masking water bodies together with the SCL map and an ancillary map described in the following paragraph.

2.3. Study Area

AUTOBAM has been conceived to work daily at national scale for the Italian territory, which covers the latitudes from 36.6°N to 47.1°N and the longitudes from 6.6°E to 18.6°E (see Figure 2). Italian forest ecosystems are significantly affected by fires; in Mediterranean countries like Italy, an average of 45,000 forest fires, causing the destruction of about 2.6 million hectares, was recorded yearly [36].
According to the CORINE land cover (CLC) inventory, 34% of the entire Italian territory is covered forest and semi-natural areas. More precisely, based on the CLC level 4 nomenclature, it was found that the class of forest with the higher percentage (7%) with respect to the entire Italian territory corresponds to the broad-leaved forests with continuous canopy on mire, followed by broad-leaved forests with discontinuous canopy, not on mire, broad-leaved forests with discontinuous canopy on mire, and plantation of broad-leaved forests all at 3%, respectively.

2.4. Ancillary Data and Their Processing

To identify forests over the Italian territory, a land cover map was generated by rasterizing the CLC level 3 vector file at a spatial resolution of 20 m on the WGS84 reference ellipsoid (projection LATLON-WGS84). The level 3 CLC inventory discriminates 44 classes, including broad-leaved forest, coniferous forest, and mixed forest. The most recent version (2018) of the CLC data, released in the frame of the Copernicus program and available through the catalog of the Copernicus Land Monitoring Service (Pan-European component), was chosen. The raster (shown in Figure 2) basically represents the master product used to generate the outputs of the processor, i.e., the maps of BA, and consists of 66,000 × 58,500 pixels.
To improve the reliability of the identification of forest areas, AUTOBAM allows an operator to optionally combine the information derived from CLC with that provided by the forest type (FTY) product, again available from the Copernicus Land Monitoring Service (Pan-European component––high-resolution layers). If the use of FTY is enabled, a S2 image pixel is labeled as a forest if both CLC and FTY classify it as a forest. For masking purposes, even the combined water and wetness (WAW) product available through the Copernicus Land Monitoring Service (Pan-European component––high-resolution layers) is used by AUTOBAM. WAW is a thematic map that identifies permanent water, temporary water, permanent wetness, and temporary wetness. The 20 m resolution products were chosen for WAW and FTY.
As previously pointed out, although the processing chain described in this paper was conceived to operationally work at national scale for the Italian territory, the BA mapping algorithm can be used with any pair of pre-fire and post-fire S2 image tiles. If the geographic area observed by S2 is included in the European Continent, the ancillary data introduced above, available from the Copernicus Land Monitoring Service, could still be used. Otherwise, forests and water bodies could be identified by means of the global land cover map available from the Climate Change Initiative (CCI-LC, 300 m resolution). It is understood that there is not a univocal correspondence between the CLC legend and the CCI-LC legend, and this could be a source of errors in the identification of forest pixels.

2.5. Validation Data

In order to validate the results generated by the processor and, in particular, by the algorithm developed to detect burned forest areas, thematic maps produced by the CEMS are used as a benchmark. Within the CEMS portfolio, delineation maps, which provide an assessment of the event’s extent, have been chosen when available. Note that according to the Italian DCP needs, the objective of the proposed service is to detect BA and map its extent. Burn severity is not considered so that the information provided by CEMS grading maps (estimation of the damage grade) is not used.
Usually, CEMS delineation products are derived by means of visual interpretation performed by a very skilled operator, so that errors are minimized relative to other remote sensing products. CEMS products have been used as reference data in previous studies, concerning not only fires [10,14,15] but also floods [
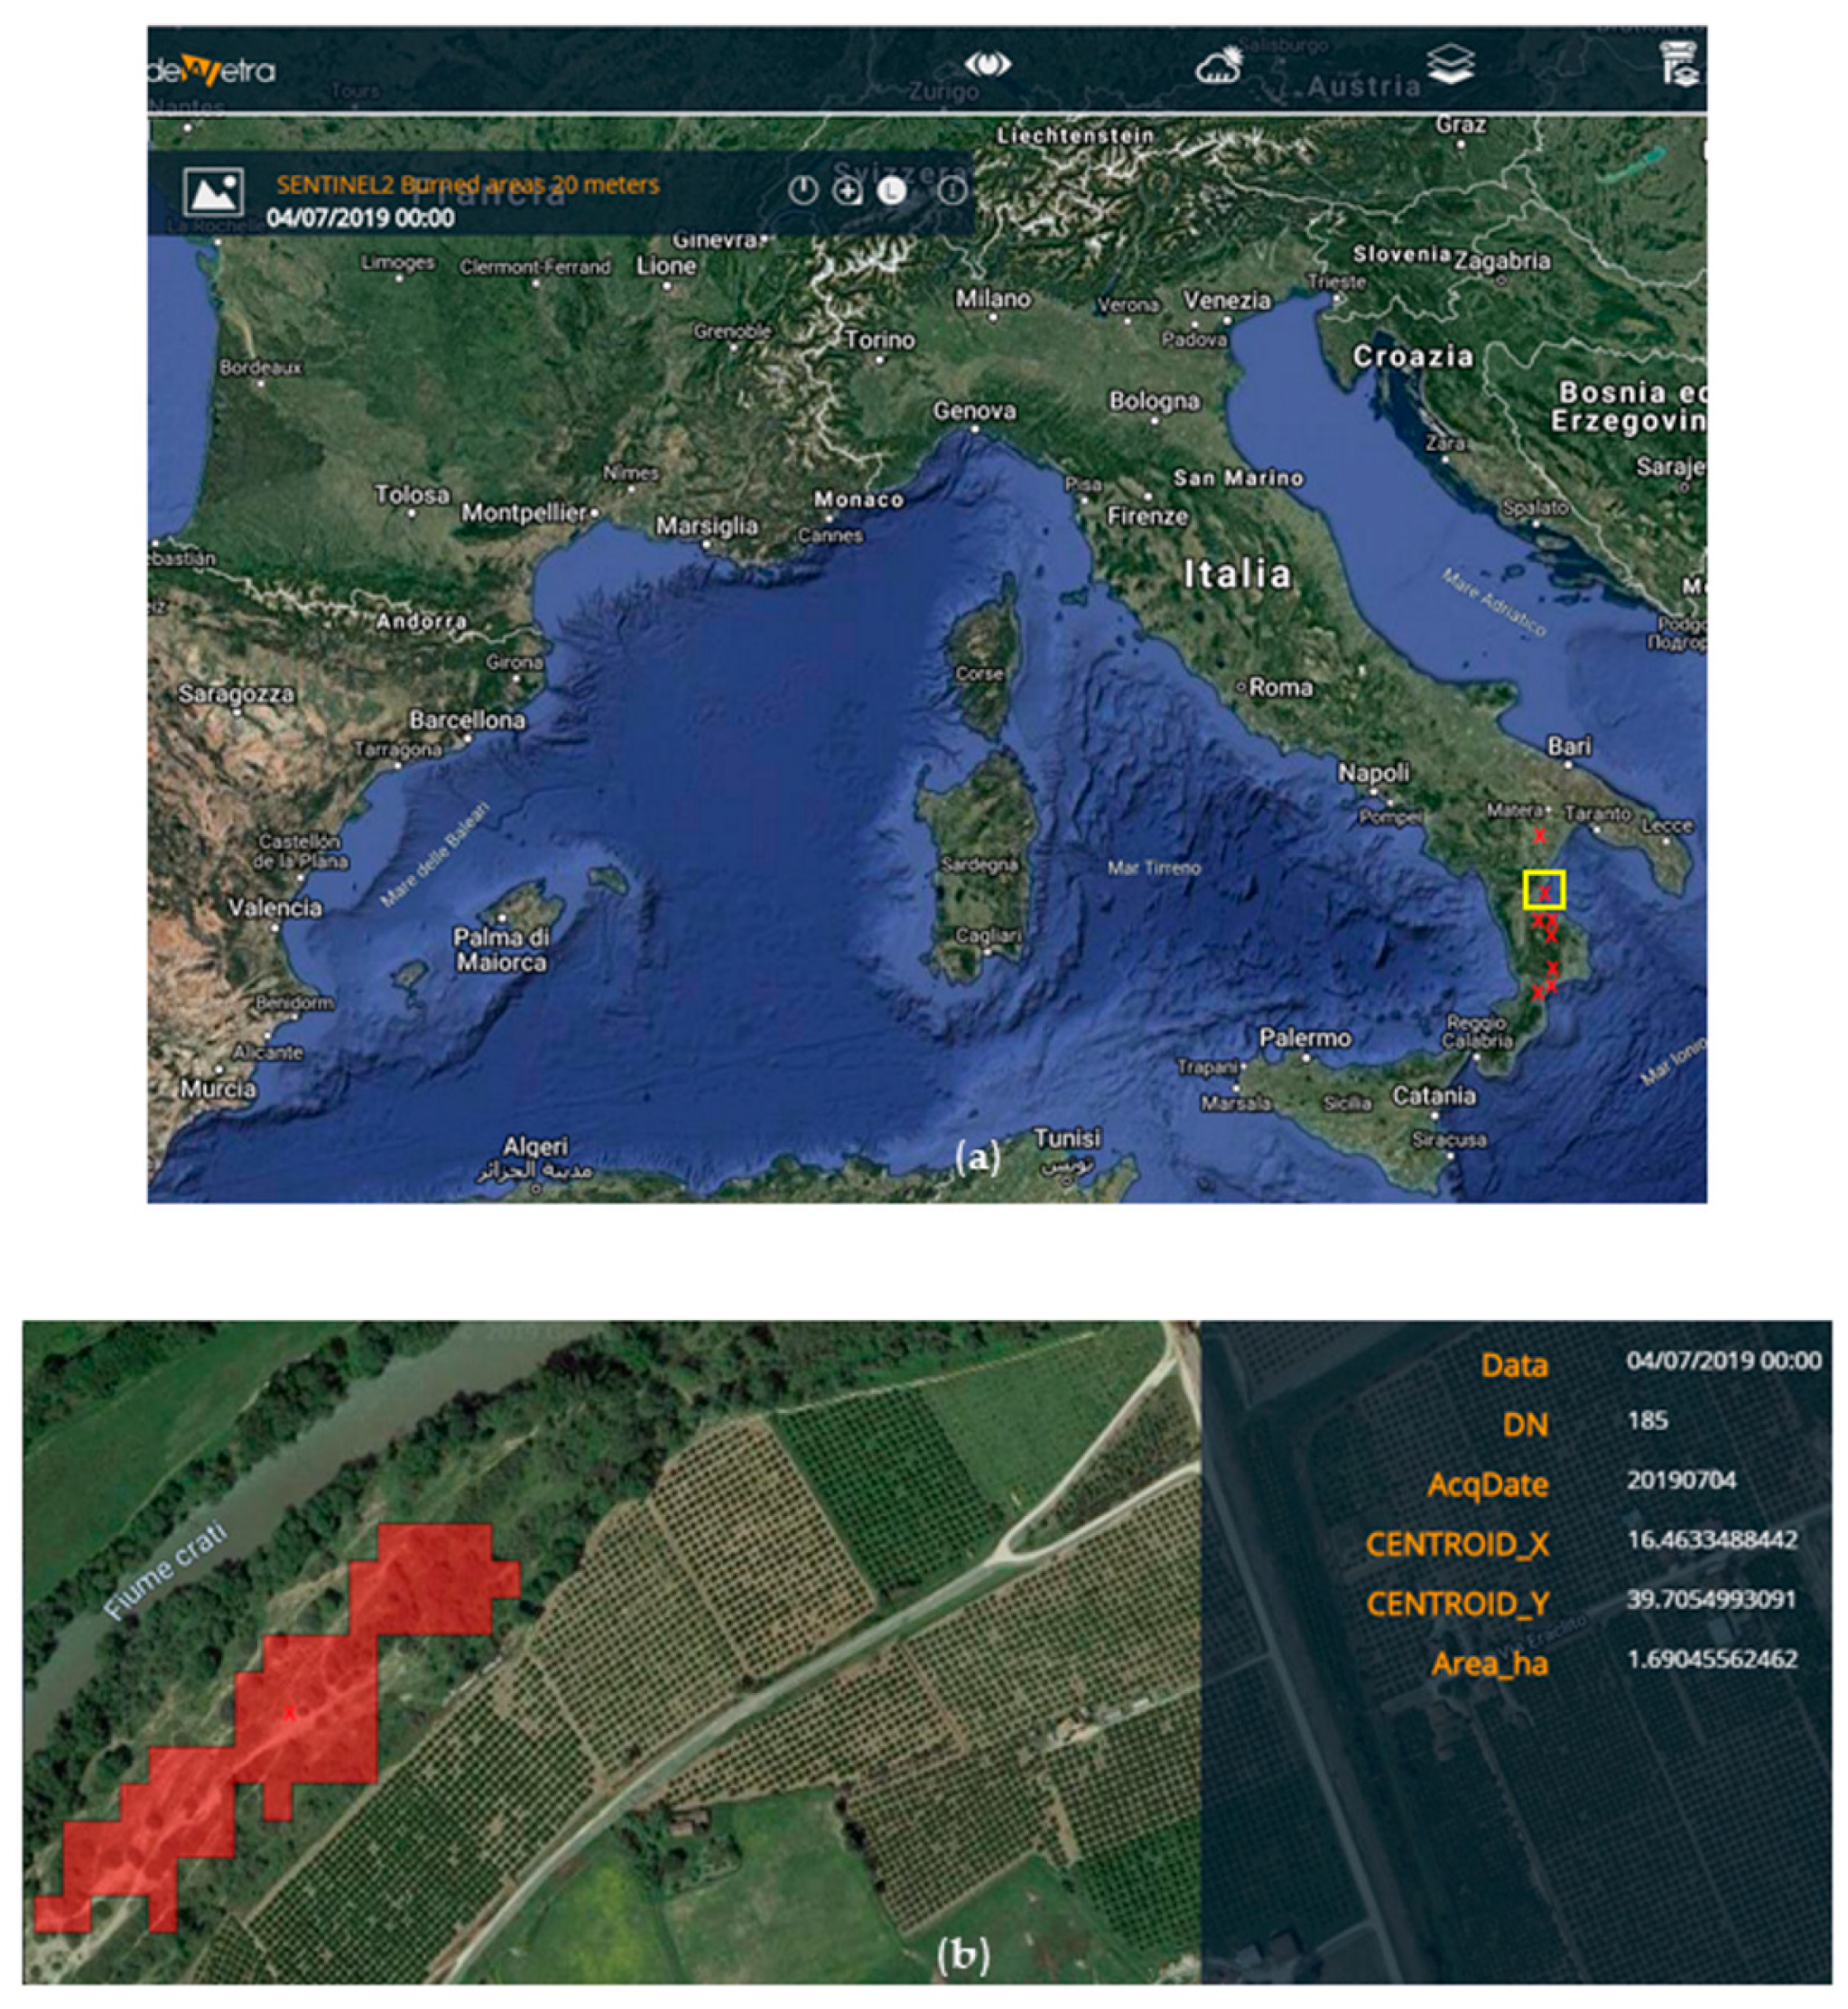
37]. To provide reliable validation results, only delineation products generated by CEMS using S2 images (both pre- and post-fire) are considered, thus avoiding that differences between reference maps and AUTOBAM-derived maps are caused by the use of different kinds of EO data. This constraint led us to select only one fire event that occurred in Italy. To increase the reliability of the validation and to test the actual possibility, mentioned in the Introduction, to apply the algorithm to any pair of S2 images (provided that they refer to the same tile), we have searched for all the CEMS maps produced using S2 data regardless of their geographic location. The corresponding test sites are:
  • Evia Island, Greece (CEMS activation code: EMSR 306). The fire occurred in August 2018 and affected the Kontodespoti and Stavros villages. The vector package, belonging to the Kontodespoti Delineation Map, version 2 data, was downloaded. According to these data, the size of the burned area was about 4 km2. The S2 images (tile T34SGH) were acquired on 14 August 2018 (post-fire) and 31 May 2018 (pre-fire).
  • Tuscany, Italy (CEMS Activation Code: EMSR316). This fire, which occurred in September 2018, hit the area of Monte Serra and the Calci village (central Italy). The vector package, belonging to the Calci Delineation Map, Monitoring 1 version 1 data, was downloaded. According to these data, the size of the burned area was about 10 km2. The S2 images (tile T32TPP) were acquired on 26 September 2018 (post-fire) and 21 September 2018 (pre-fire).
  • Sithonia, Greece (CEMS Activation Code: EMSR331). This fire, which occurred in October 2018, affected an area located 100 km southeast from Thessaloniki in a pine forest. The vector package, belonging to the Sithonia Delineation Map, version 1 data, was downloaded. According to these data, the size of the burned area was about 8 km2. The S2 images (tile T35TKE) were acquired on 26 October 2018 (post-fire) and 18 October 2018 (pre-fire).
  • Mount Kenia, Kenya (CEMS Activation Code: EMSR345). This fire occurred in March 2019 and started in the Tharaka Nithi side of Mount Kenya. The vector package, belonging to the Mount Kenya Delineation Map, version 1 data, was downloaded. According to these data, the size of the burned area was about 140 km2. The S2 images (tile T37MCV) were acquired on 28 February 2019 (post-fire) and 18 February 2019 (pre-fire).
  • Castile and León, Spain (CEMS Activation Code: EMSR368). This fire, which occurred in June 2019, affected the municipality of Gavilanes, Ávila, destroying an area with high ecological value. The vector package, belonging to the El Arenal Grading Product, version 3, release 1 data, was downloaded. According to these data, the size of the burned area was about 15 km2. The S2 images (tile T30TUK) were acquired on 01 July 2019 (post-fire) and 12 May 2019 (pre-fire).
It can be noted that, in some cases, the pre- and post-fire images were acquired with a time interval of multiple weeks. This could have an impact on the validation results, as discussed in Section 5.
Among the files available from the CEMS vector packages introduced above, which are in shapefile (.shp) format, the area_of_interest_a.shp and the observed_event_a.shp were used for the validation. In particular, observed_event_a.shp vector files were rasterized and then used as ground truth images to generate, for each case study, a confusion matrix in order to assess the performance of the BA mapping algorithm. The boundaries of the geographic area considered to derive the confusion matrix were determined through the area_of_interest_a.shp vector files.

3. Methods

The main components of AUTOBAM are the automatic S2 data procurement, the S2 image processing, which includes the algorithm to map burned forest areas, and the delivery of the BA map to the final user. In the next sections, these components are presented in detail.

3.1. Sentinel-2 Data Procurement Component of AUTOBAM

AUTOBAM includes a script to search, download, and unzip S2 L2A data written in Python language. Its scheme is shown in Figure 3. It takes advantage of the freely available Sentinelsat tool (https://pypi.org/project/sentinelsat/) that enables users to automatically search and download Sentinel-1/2/3 data. For the script, the following Sentinelsat inputs were used: 1) URL of the archive from which S2 data are downloaded; 2) start date; 3) tile code identifier; 4) product type (S2-L2A in this case); 5) maximum cloud cover. The two archives introduced in Section 2.1 (DHuS and HNSDMS) are sequentially queried. For each query, the codes used to identify the tiles that cover the Italian territory, shown in Figure 1, are included in the search parameters of the Sentinelsat tool. The maximum cloud cover percentage was fixed at 40%; hence, S2 images with a cloud cover greater than 40% are discarded. The script is automatically executed every day and is scheduled to run every hour, starting from 15:00 UTC until 05:00 UTC of the next day, thus dealing with possible delays in the availability of the S2 data in the archives. Looking at Figure 3, it can be noted that the possibility that, for any reason, L2A data are not found is managed by searching for lower level (L1C) data and then running a freely available software named Sen2Cor, developed by the European Space Agency (ESA), which allows users to generate L2A data from L1C ones.
The S2 L2A products generated as shown in Figure 3 (each product corresponding to a tile, see Section 2.1), are stored in a directory (denoted here as S2newDir for brevity), where the BA mapping algorithm searches for new data every time it is launched. This happens every hour between 15:00 UTC and 05:00 UTC, i.e., at the end of each run of the S2 data download script. After being processed by the algorithm, the S2 data are moved to another directory (S2oldDir) in order to avoid multiple elaborations of the same product. In this way, every day, the download and subsequent processing of the S2 images acquired in the morning (around 10:00 UTC) is performed and guaranteed. The BA mapping algorithm is described in detail in the following paragraph.

3.2. Sentinel-2 Image Processing Component of AUTOBAM

The algorithm designed to map BA represents the core of the AUTOBAM processor. It is composed of three blocks, denoted as Block#1, Block#2, and Block#3 hereafter, whose scheme is shown in the upper (a), central (b), and lower (c) panels of Figure 4, respectively. It has been implemented using the IDL language and the ENVI routines that could be launched by means of specific IDL instructions. It works on single S2 tiles for the purpose of data manageability, thus avoiding to deal with big rasters. The operations described hereafter are referred to a single S2 tile and are sequentially performed until all the products included in S2newDir are processed.

3.2.1. Block#1

Looking at Figure 4a, it can be seen that, initially, the ancillary data (CLC, FTY, and WAW maps) are spatially subset to the spatial range of the single S2 tile and then resampled and reprojected to the spatial grid of the S2 tile. Then, the algorithm computes NBR, NDVI, and also MNDWI. To this aim, the 20 m grid is chosen as reference, and the 10 m S2 bands are resampled to 20 m (5490 × 5490 pixels for each tile). The resized CLC and WAW maps produced in this way are used in combination with the SLC map to mask pixels, where BA mapping cannot be performed. The resized CLC map is also used, optionally in combination with the resized FTY map, to search for forest pixels in the scene.
The pixels that are labeled by the SCL map as no data, saturated or defective, water, and snow (see Table 1) are masked out and not considered in the processing. As discussed in Section 2.4, water pixels are identified and masked using also the ancillary WAW map and the MNDWI map. For what concerns clouds and cloud shadows, a procedure to obtain a robust cloud mask has been set up (note that S2 products for which cloud cover percentage exceeds 40% are discarded, as pointed out in Section 3.1). Firstly, pixels labeled by SCL as cloud medium and high probability, or cloud shadows, or cirrus are masked. Then, the mask is enlarged by creating a buffer zone of 10 pixels (200 m). Note that pixels labeled by SCL as dark areas are not masked (unless they are included in the buffer zone) because it has been verified that burned pixels might fall in this category, as found also in [12]. A buffer zone of 5 pixels (100 m) is also created around snow and water objects.
In Figure 4a, the processed S2 tile is denoted as S2 L2A product at time t2; hence, t2 indicates the current time. After having performed the data masking, the algorithm searches in another directory (S2oldDir) for an NBR map and an NDVI map generated for the same S2 tile, at a previous time t1. They are used to compute RdNBR (see equation (1)) and dNDVI as follows:
R d N B R = [ N B R ( t 1 ) N B R ( t 2 ) ] / | N B R ( t 1 ) | / 1000
d N D V I = [ N D V I ( t 1 ) N D V I ( t 2 ) ] ,
By default, considering the 5-day repeat of S2, t1 = t2 − 5. However, it must be considered that: 1) the S2 product acquired five days before the current one could have been discarded if the cloud cover percentage exceeded 40%; 2) even images whose cloud cover is less than 40% might be affected by clouds. Consequently, t1 is just a nominal time that could be different for different pixels.
NBR and NDVI maps at time t1 must actually contain, for each pixel, the most recent information about these indices. For this purpose, as shown in Figure 5 for NBR (but it is the same for NDVI), AUTOBAM saves them in S2oldDir to be used five days later as NBR(t1) and NDVI (t1) when a new S2 product for the same tile will be acquired. Before saving NBR(t2) and NDVI (t2), in pixels classified as cloudy at t2, the values of NBR(t2) and NDVI(t2) are replaced by the corresponding values of NBR(t1) and NDVI (t1). A limit of 30 days has been fixed for t2t1 in order to avoid comparing data acquired at very different times, so that if there is no cloud-free information for over 30 days, an area is not mapped.

3.2.2. Block#2

In Block#2, the Iterative Self-Organizing Data Analysis Technique Algorithm (ISODATA) is applied to RdNBR, dNDVI, and NBR (as shown in Figure 4b). NBR(t2) and dNDVI are basically used to improve the reliability and robustness of the BA detection, by ensuring that a high value of RdNBR (typical of BA, see [5]) is combined to a low value of NBR(t2) and a high value of dNDVI, thus being caused by an actual loss of vegetation. The ISODATA is an unsupervised classification method that divides an image into multiple segments (sets of pixels, also known as image objects). It begins with arbitrary cluster means and then clusters the pixels according to the minimum spectral distance technique [38]. Each iteration recalculates means and reclassifies pixels with respect to the new means. The process ends when a maximum number of iterations has been performed, or a maximum percentage of unchanged pixels between two iterations has been reached. The ISODATA is mainly used by AUTOBAM to carry out a preliminary identification of BA. It is used also to determine an input parameter of the automatic thresholding described in the following subsection.
A maximum number of classes equal to 10 has been chosen for each ISODATA classification. In order to accomplish an effective application of the ISODATA, a logarithmic transformation, aiming at compressing the dynamic range of the input data, is preliminarily performed. After having applied the ISODATA classification to the RdNBR map, the median of the RdNBR values in each class is computed, and the objects belonging to the class that has the highest median are selected; the set of pixels corresponding to these objects is denoted here as Region1. The median operator is used instead of the mean one because it is less sensitive to outliers. The same is done for the result of the ISODATA classification of the dNDVI map (Region2) and the [1 − NBR(t2)] map (Region3). Since BA generally presents low NBR values, [1 − NBR(t2)] is considered instead of NBR(t2). A pixel is finally selected only if it contemporary belongs to Region1, Region2, and Region3, and the set of selected pixels is denoted as a set of potentially burned areas (SoPBAs). Following [5], even pixels having RdNBR < 316 are excluded from SoPBAs, being 316 the threshold found in [5] to identify low/moderate burn severity. This is one of the few empirical constraints used by AUTOBAM, introduced just to avoid that the SoPBAs contains a large number of unburned pixels. Note that in [29], for a Mediterranean environment (Spain), an RdNBR value of 475 was found for low/moderate fire severity, so that 316 can be considered as a nonrestrictive value.
Using the resized CLC map created, as described in Section 3.1 (optionally combined with the resized FTY map), the objects of SoPBAs that do not include at least 25 forest pixels (corresponding to 1 ha, since the pixel size was 20 × 20 m2 and 20 × 20 × 25 =1 0,000 m2 = 1 ha) are removed from SoPBAs. In this way, the refined set of potentially burned areas (RSoPBAs) is obtained. In other words, the selected objects must contain forest areas whose surface is larger than 1 ha, which is considered the minimum mapping unit. Obviously, pixels masked out as described in Section 3.2.1, are removed from the RSoPBAs. It is understood that it might happen that no unmasked pixels, having RdNBR > 316, are found in SoPBAs (and, therefore, also in RSoPBAs). In this case, the possible detection of burned areas (if present) is devoted to the following step of the algorithm, described hereafter.

3.2.3. Block#3

In the last block of the image processing component of AUTOBAM (Figure 4c), a split-based approach (SBA) is applied before carrying out the automatic thresholding. Here, only the RdNBR map is used because it is assumed that the robustness of the algorithm (e.g., to false alarms) is ensured by the application of the ISODATA even to the maps of [1 − NBR(t2)] and dNDVI done in the previous step. The motivation for the use of the SBA is that automatic thresholding assumes that the histogram of the analyzed image is the sum of two distributions: changed and unchanged pixels (corresponding to burned and unburned areas in this case). Thus, the histogram should have two peaks, and the population of changed (burned) pixels should be large enough to give rise to a significant statistical mode in the histogram. The spatial extent of the fire, compared to the size of the image, determines the percentage of the burned area within the image and then the possibility of the presence of a distinguishable second mode in the histogram. If the percentage is small, the capability of the thresholding algorithm to find a reliable threshold reduces. A way to deal with this problem is the division of the image in smaller sub-images and the application of the automatic thresholding only in sub-images, containing an amount of burned and unburned pixels that gives rise to a bimodal histogram. This is the rationale of the SBA, originally proposed in [28]. In the SBA, the considered image is divided into a set of non-overlapping sub-images (or splits) in order to find splits whose pixel values have a histogram with two peaks. The choice of the dimension of the sub-images is, to some extent, subjective.
AUTOBAM tackles the problem of the automatic determination of a threshold, separating burned and unburned areas in a new way, thanks to the application of the ISODATA done in Block#2. In practice, the size of the splits for the SBA is determined based on the dimensions of the objects produced by the ISODATA. In particular, the size of the splits is N × M pixels, where N and M represent the dimension of the smallest rectangle that contains the biggest object of the RSoPBAs. In this way, the rectangular splits have dimensions of the same order of magnitude as the objects belonging to RSoPBAs, so that some of them likely contains a percentage of both burned and unburned pixels such that the histogram of RdNBR has two distinguishable modes. If RSoPBAs does not contain any pixel, N and M are equal to the S2 tile dimension (i.e., N = M = 5490). The selection of the splits containing two thematic classes (burned and unburned areas in this case) is based on the use of the bimodality coefficient (BC), as done in [39]. BC is defined as:
B C = s 2 + 1 k + 3 ( P 1 ) 2 ( P 2 ) ( P 3 )
where P represents the population size. The value of BC for the uniform distribution is 5/9 (∼0.555), while values greater than 5/9 indicate a bimodal (or multimodal) distribution. Besides having a bimodal distribution of their samples (i.e., BC > 0.555), the splits must also have a mean of the RdNBR values larger than the mean of the RdNBR values of the whole S2 image [40]. In this way, one of the thematic classes included in the selected splits contains pixels with high RdNBR (possibly burned). Once all the splits are analyzed, the size of unselected splits is halved, and a new search for splits having a bimodal histogram of their RdNBR values is carried out (already selected splits are excluded from this new search). This splitting process ends when a minimum size of 20 pixels is reached for N or M. Then, an automatic thresholding algorithm [41] is applied to the selected splits. In order to derive the final threshold value (RdNBR_th) to be applied to the whole S2 image, the median of the threshold values obtained for the selected splits is computed. Again, if RdNBR_th is less than 316, it is set equal to 316, while, if the number of selected splits is zero, RdNBR_th is set equal to 475 [29].
In order to account for the spatial context, the threshold found through the SBA is applied within a region growing algorithm (RGA). RGA is a simple image segmentation method that analyzes neighboring pixels of initial seed points and determines whether the pixel neighbors should be added to the seed region based on a tolerance criterion [42]. The latter is a constraint expressed in terms of the pixel value. In this case, the seed region is represented by the forest pixels belonging to the RSoPBAs, and the tolerance is given by RdNBR_th, so that the seed region is grown to include all connected neighboring pixels for which RdNBR > RdNBR_th. If RSoPBAs contains zero pixels, a restrictive value of RdNBR is used to determine the seed region, i.e., the seed region is given by the pixels for which RdNBR > 835, which was the value found in [29], for a high forest fire severity in a Mediterranean area like Spain. The set of pixels obtained by applying the SBA followed by the RGA is indicated as the set of burned areas (SoBAs, see Figure 4c). To the SoBAs, an aggregation of small class objects to larger objects is applied to refine the results; in particular, objects with a size less than the minimum mapping unit (1 ha) are aggregated to an adjacent, larger object.
To further refine the classification, a fuzzy logic-based algorithm is applied as done in [43,44]. Elements of a fuzzy set have degrees of membership to the set, which are defined through membership functions, whose values are real numbers between zero (no membership) and one (maximum membership). AUTOBAM uses the Z and S functions, shown in Figure 6, which are standard functions used in the literature for image classification purposes [44,45]. By means of these functions, a fuzzy set is built, consisting of three elements: distance from the SoBAs, RdNBR value, and distance from the RSoPBAs derived from the ISODATA classification.
In practice, the fuzzy logic is used in order to find a theoretical framework for including, in the SoBAs, pixels close to this set that have a high value of RdNBR and/or belong to the RSoPBAs. The parameters defining the shape of the functions, shown in Figure 6, have been determined through a trial and error approach in order to fulfill this purpose. By comparing the scales of the horizontal axes of Figure 6a,c, it can be noted that, for the distance from RSoPBAs, the membership degree drops off very quickly (it becomes zero at a distance of only 20 m, i.e., one pixel). Hence, the membership degree according to the distance from the RSoPBAs is such that it is maximum if a pixel belongs to the RSoPBAs and minimum otherwise.
The final step of the post-processing consists of computing the average of three membership degrees defined by the functions shown in Figure 6 and including in the SoBAs pixels whose average is larger than 0.5.

3.3. Delivery of the Burned Forest Areas Map to the Final User

Once all the products provided by the data procurement component of AUTOBAM are elaborated, the maps of burned areas are resampled and re-projected to the reference spatial grid, introduced in Section 2.4 (i.e., that of the CLC map shown in Figure 2); then, they are mosaicked by merging them in one unique map ready to be delivered to the end-user. Note that, since each tile is processed individually, the threshold found to distinguish burned from unburned pixels could be different between adjacent tiles, and, in the areas of overlap between the tiles, different classifications might be in principle produced. In the current release of AUTOBAM, the final classification depends on the order of processing, i.e., the classification of the most recently processed tile is maintained. Note that the contextual information, taken into account by means of the RGA and also the fuzzy logic-based algorithm, could mitigate the problems related to the different thresholds between adjacent tiles.
By accomplishing the operations of resampling, re-projection, and mosaicking, the daily map of BA at a national (Italian) scale is created and made available on a web-portal of the Italian DCP developed by CIMA Research Foundation named MyDewetra [46].
By making available the daily BA map on the MyDewetra platform, emergency managers have a visualization tool that provides them with a synoptic overview of the extent of the BA. In this way, emergency services are constantly kept informed about the effects of fires that take place in their area of interest (Italy, in this case). For a given location, the BA maps are updated every 5 days corresponding to the S2 revisit time.
To make available on MyDewetra the BA maps at a national scale, they are firstly transformed in a vector file that stores the information about:
-
day of acquisition of the Sentinel-2 image used as input in the automatic mapping (corresponding to t2 in the previous description of the BA mapping algorithm);
-
longitude/latitude of the centroid of each BA;
-
shape and extension (in ha) of each BA.
The aforementioned vector file, whose size in MB is considerably smaller than that of the original raster representing the map of BA, is automatically delivered to MyDewetra in order to be visualized.
Figure 7 illustrates an example of how a daily BA map is presented to the end-user (Italian DCP) through MyDewetra. Panel (a) shows what appears to the end-user when an operator opens MyDewetra and chooses a day of interest (4 July 2019, in this case). To make the location of the burned areas easily identifiable, it is assigned a red cross to the center of each area. By clicking on one of the red crosses, a window opens (panel (b)), which shows the information listed above.

3.4. Evaluation of the Performance of AUTOBAM

Figure 8 compares two screenshots derived by zooming two maps, available from MyDewetra, on Sicily (which was strongly affected by fires during summer 2019). Panel (a) shows the AUTOBAM-derived BA map generated from the S2 acquisition on 6 August, 2019, while panel (b) shows the fires’ location in the period 2–6 August 2019, according to information coming from local authorities and news. The period 2–6 August corresponds to the S2 revisit time since the previous S2 image over the same orbit was acquired on August 1st. Note that, in panel (a), the high number of red crosses in a limited area is due to the fact that a BA is composed of a set of noncontiguous objects according to AUTOBAM; conversely, each yellow airplane that is present in panel (b) refers to a different fire signaling. The objective of Figure 8 is, therefore, just to qualitatively compare the location of the red crosses representing AUTOBAM-derived burned areas with the location of the yellow airplanes, representing the location of the fires as derived from local signaling (and not to compare the number of crosses with the number of airplanes).
It could be noted that, despite an expected spatial mismatch between fire signaling (whose geographic location is often just indicative) and AUTOBAM data, most of the fires reported by local news correspond to a BA according to AUTOBAM except for those highlighted by the yellow and orange circles in Figure 8b. One of them (yellow circle) actually corresponds to an area covered by a small cloud at the time of S2 acquisition, so that it was masked by AUTOBAM (and detected five days later). The other two fires (orange circles) are placed in an area not classified as forest by CLC, although they were reported as forest fires.
In order to quantitatively assess the maps produced by AUTOBAM, they were compared to the CEMS maps for the five case studies listed in Section 2.5. To this aim, for each case study, the S2 post-fire images (see Section 2.5 for the acquisition days) have been assumed as the S2 L2A products at time t2, and the pre-fire images have been assumed as the S2 L2A products at time t1 (see Figure 4a). The maps produced by the algorithm are shown in Figure 9, together with the maps obtained by rasterizing the CEMS vectors (observed_event.shp files, see Section 2.5). The areas shown in Figure 9 correspond to the boundaries of the areas of interest provided by the area_of_interest.shp files included in the CEMS vector packages. Looking at Figure 9, it can be noted that the areas classified as clouds by the SCL included in the S2 L2A products, enlarged as described in Section 3.2.1, are superimposed to the CEMS-derived maps too. In this way, the results of the comparison do not depend on the quality of the cloud classification provided by SCL that has nothing to do with the correctness of the algorithm. Hence, only the classes of burned and unburned pixels have been used to quantify the results.

4. Results

A confusion matrix was computed for each case study, and the results are presented in Table 2, where columns represent CEMS classes, while rows represent the AUTOBAM predictions. Table 2 includes scores like the overall accuracy (OA), the kappa coefficient (κ), and the errors of commission and omission for the class of burned areas (those for unburned areas were omitted, being always very small).
Looking at Table 2, it can be seen that both OA and κ are quite high. The former always exceeds 95%, while the latter is greater than 0.82. This indicates that AUTOBAM generally performs quite well, even considering different geographic areas. In general, the commission error is small, being around 1%–3%. The Evia Island fire is the only test case for which the commission error is quite large, exceeding 25%, while the Sithonia fire is the only test case for which the omission error is quite large (around 25%). For the other case studies, the omission error is less than 15%. Both omission and commission errors are discussed in Section 5.1.

5. Discussion

This paper presents a processing chain for near real-time mapping of burned forest areas using S2 data. The service implemented by the processing chain is tested in pre-operational mode since 15 June 2019 and is used by the Italian DCP to monitor the location and the extent of the burned areas.
Some studies about the use of S2 data to map BA have been already published [3,10,12,14,15,16]. What distinguishes this study from previous ones is that it develops a fully automatic processor that includes data procurement and delivery of BA maps. Moreover, while in many papers (e.g., [10,12]), fixed thresholds are used to discriminate BA or at least to initialize the BA detection algorithm, here the thresholds are automatically determined in an adaptive way based on the local properties of the considered RdNBR map. Similarly to other studies, different spectral indices are used in combination in order to ensure that the changes detected by AUTOBAM are actually due to a loss of vegetation. Even the combination of different techniques to improve the reliability of the mapping algorithm has been already applied in previous studies, mainly for the purpose of balancing commission and omission errors [10,12,47].
The only ancillary data used by AUTOBAM are maps of land cover and water bodies. Taking advantage of other ancillary data, like the MODIS-derived active fire product [48], as done, for instance, in [12], might allow a BA mapping algorithm to reduce commission errors. In this case, only areas where hotspots are detected, which have a very high likelihood of being burned, are analyzed. However, the very different spatial resolutions of MODIS and S2 could represent a challenge that might lead to an increase of the omission error, especially when dealing with fires having a small extent. This is the reason why the present release of AUTOBAM does not make use of the information coming from active fire products.
The following sub-sections initially explain the discrepancies between AUTOBAM-derived and CEMS-derived maps. Then, the applicability of the algorithm to areas different from the Mediterranean one is discussed. Finally, the impact of the combination of different image processing techniques to map BA is analyzed.

5.1. Omission and Commission Errors

As expected, one of the major sources of error is represented by the presence of clouds. On the one hand, BA can be obscured by clouds [49]. On the other hand, undetected clouds can be confused with BA [12]. Although the commission error is in the order of 1%–3% (except for one test case), it is expected that, throughout the performance of the daily BA mapping service, missed detection of clouds and cloud shadows might occur in the SCL included in the L2A product, thus giving rise to larger commission error. Updated S2 L2A products will likely improve the capability to detect clouds (as well as to deal with artifacts as topographic shadows).
The problem of the presence of clouds is very critical for an automatic service like AUTOBAM, which processes all the available S2 images of Italy, with the only constraint that cloud cover must be less than 40%. On-demand services like CEMS have the possibility to choose in a large portfolio of satellite data the most suitable ones; nonetheless, even CEMS may have the necessity to select images where cloud cover is present. The Evia Island event (Figure 9a,b), which turned several hectares of pine trees into ashes, represents a case study where CEMS selected a post-fire image partially covered by clouds. Although it is not visible in Figure 9b, it has been found that the creation of a buffer zone to enlarge the cloud mask derived from SCL implies that some pixels classified as burned by CEMS are masked. Hence, enlarging the cloud mask might lead to an increase of the omission error, as highlighted also in [49], where an algorithm to identify BA in dense time-series of Landsat data was presented. On the other hand, the experience gained in daily producing maps of BA at a national scale led us to conclude that without performing this enlargement, false alarms often take place in pixels located at the boundaries of the areas labeled as clouds by SCL.
The Evia Island fire is the only test case for which the commission error is quite large, exceeding 25%, even if both OA and κ were high. Although commission error when mapping BA is mainly caused by an inaccurate masking of clouds, cloud shadows, and terrain shadows [12], in this case, it is mainly related to the long interval between the acquisition times of the pre- and post-fire images (note that the same images as those selected by CEMS have been chosen for validation purposes), which exceeded two months (see Section 2.5). Figure 10 shows an area (highlighted by yellow circles), where a quite significant false alarm occurred. By comparing panels (a) and (b), it can be noted that this area was vegetated (green in the true color image) when the pre-fire image was acquired, while it was bare (brown tone in the true color image) at the post-fire acquisition time. This change was evaluated by the CEMS operators as not caused by the fire, likely because the tone of this area is slightly different from that of the core of the BA (orange circle in panel (b)) that tends to be gray in the post-fire image. Hence, a change in the vegetation conditions likely occurred during the time between the two S2 acquisitions. This outcome explains why we limited to 30 days the maximum difference between pre- and post-fire acquisition times (see Section 3.2.1).
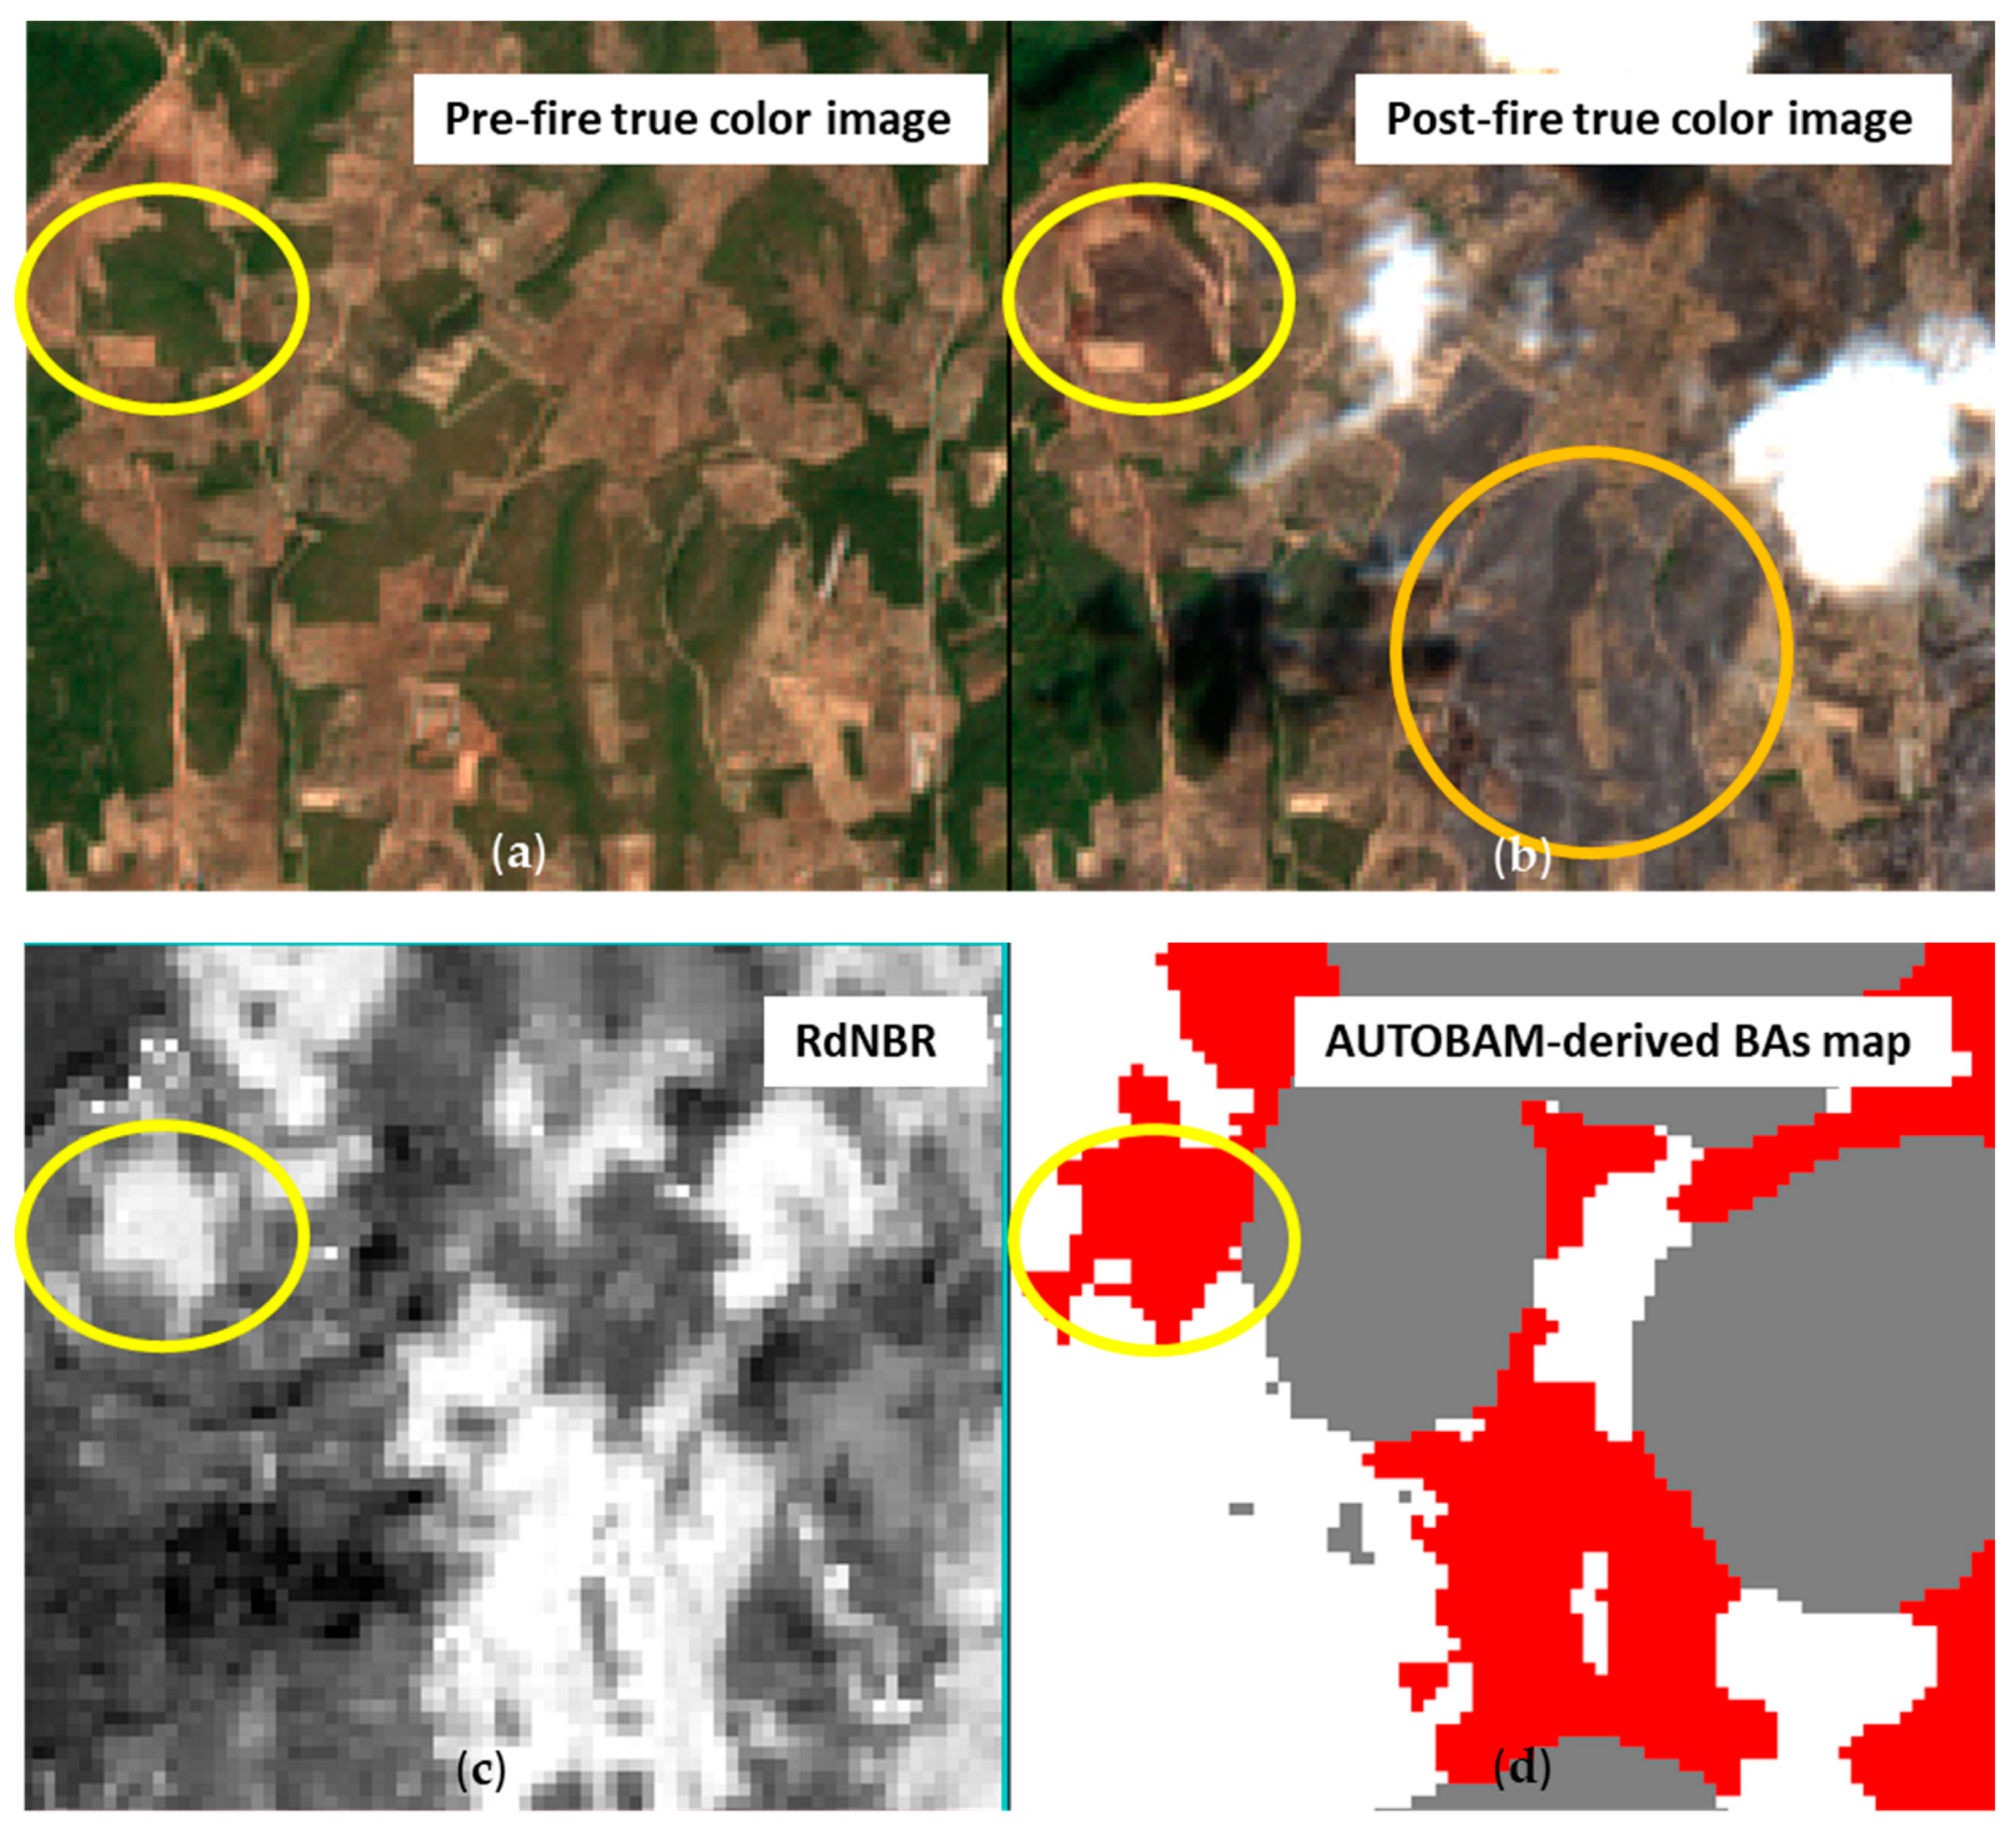
For the Sithonia fire, which caused the damage of about 800 ha of a pine forest, the omission error is around 25%. Looking at Figure 9f, it can be noted that, in this case, the CEMS-derived BA map has no gaps, as if the spectral index used by CEMS to generate the map were totally uniform in the burned area. Looking at Figure 11, (analogous to Figure 10, but for the Sithonia test case), it can be noted that RdNBR is not uniformly high in this area and that the spatial pattern of the AUTOBAM-derived map basically reproduces that of RdNBR. Note that the regions highlighted by the blue circles in Figure 11 (labeled as unburned by AUTOBAM) have a dark green tone in the post-fire image and that RdNBR in these regions assumed even negative values (typical of unburned areas). This justifies the fact that AUTOBAM has not classified these areas as burned. Probably, in these areas, the intensity of the fire caused only low severity damages, so that, as discussed in [50], its effects have not triggered the detection threshold. Furthermore, the fact that the grading map (i.e., that including the degree of severity) provided by CEMS labels these areas as “possibly damaged” confirms the uncertainty of the classification task in this case.

5.2. Applicability of the Algorithm to Different Geographic Areas

In the Introduction, it has been underlined that although the proposed service will be operative in Italy, the algorithm to map BA can work in principle with any pair of pre-fire and post-fire images, provided that they refer to the same tile. Even if only one validation site is in Italy, the majority of the case studies regards forest fires that took place in the Mediterranean area. Hence, from the point of view of the applicability of the algorithm to different geographic areas, the results obtained for Mount Kenia (Figure 9g,h) are the most significant since, in this case, S2 observations of an environment totally different from the Mediterranean one have been processed. The Mount Kenia fire charred thousands of hectares of moorland and bamboo forest. It is worth pointing out that, since CLC is not available outside Europe, the CCI-LC has been used for Mount Kenia. As pointed out in Section 2.4, uncertainties in the transformation from the CCI legend to the CLC legend (the CLC codes were used by AUTOBAM to identify forests) could represent a source of error. Nevertheless, both OA and κ assume high values (99.3% and 0.94, respectively).
Although the Mount Kenia event affected an ecosystem different from the Mediterranean one, the use of a spectral index combining the NIR and SWIR bands enabled to design a quite robust BA detection algorithm. The decrease of NIR reflectance after burning was used since 1980 [51] to map forest not only in temperate regions but also in boreal and tropical environments. Moreover, the increase of the SWIR reflectance after burning, firstly observed in the Mediterranean region [18], was also confirmed in different ecosystems like savanna [7,52]. The robustness of AUTOBAM to changes in the ecosystem is also due to the fact that it takes advantage of image processing techniques like ISODATA and automatic thresholding that adapt themselves to the specific images that have to be processed. It is worth underlining again that, in any case, the algorithm to map BA was designed to deal with forests. Hence, for a reliable application of the present release of AUTOBAM, this kind of land cover must be included in the area affected by the fire.

5.3. Impact of the Combination of Different Image Processing Techniques

Although the algorithm implemented in AUTOBAM basically used thresholding (applied within an approach based on RGA) to map BA, this technique was combined with ISODATA and with the fuzzy logic-based approach.
Concerning the role of the application of the ISODATA in AUTOBAM, it is interesting to compare the BA maps produced with and without applying it. Figure 12 presents this comparison for the Castile and León case study that caused the destruction of 1500 ha of forest and shrubland. The orange box in the upper right corner of panels (a) and (b) corresponds to the area of interest delineated by the area_of_interest.shp CEMS file (that is shown in panel c), so that the upper panels of Figure 12 include also regions located outside this area, which, therefore, were not classified as burned by CEMS. It can be clearly seen that without performing the ISODATA (panel b), there are some pixels that are incorrectly labeled as burned. Hence, in this case, the combination of different image processing techniques contributes to ensuring the robustness to false alarms of the BA mapping algorithm (panel a).
As discussed in Section 3.2.3, the fuzzy logic-based approach performs just a refinement of the BA map aiming at including, in the SoBAs, pixels close to this set that have a high value of RdNBR and/or belong to the RSoPBAs. The use of the fuzzy logic for post-classification purposes was carried out also in [44]. Figure 13 shows the AUTOBAM-derived map of BA for the Tuscany fire, which destroyed 1000 ha of territory, including prevalently forest and olive groves. The pixels colored in blue represented those added to the SoBAs by the fuzzy logic-based algorithm. It can be seen that although only a few pixels were included in the set SoBAs (the biggest sets of pixels are highlighted by blue circles in Figure 13), this inclusion increased the accuracy of the map of BA since the blue pixels were mostly classified as burned by CEMS too. Nonetheless, some areas classified as burned by CEMS and unburned by AUTOBAM remain. In most of these areas, the situation is similar to that discussed when dealing with the Sithonia case study, i.e., the values of RdNBR are not large enough to be above the detection threshold.

6. Conclusions

A tool designed for a fully automated service of burned forest areas mapping using Sentinel-2 has been presented. Although several studies available in the literature dealt with the problem of burned forest areas mapping using multispectral data, the creation of a processing chain that automates the various steps needed to set up an operational service was rarely tackled. These steps include not only the processing of the images but also the data procurement and the delivery of the maps to the end-user.
For the areas of the Italian territory observed by Sentinel-2, the service daily generates maps of burned forest areas at a national scale with a spatial resolution of 20 m. For a given location, the maps are updated every 5 days (the Sentinel-2 revisit time) in the absence of cloud cover. The algorithm to detect burned forest areas takes advantage of different image processing techniques in order to reduce the risk of committing omission or commission errors. As expected, cloud cover is the major source of errors, both commission, if clouds are not correctly detected so that they can be misclassified as burned areas, and omission, because they can hamper the observation of burned areas. Note that the mechanism designed in order to guarantee that the pre-fire image actually contains the most recent Sentinel-2 measurement performed under cloud-free conditions ensures that, if an omission error due to cloud cover in the post-fire image takes place, it will be corrected by the image acquired five days later (if it is not cloudy too). Another source of error could be a long interval between the pre- and post-fire images acquisition times, during which changes in vegetation conditions might occur and be confused with burning, but that this problem is not expected to be very critical for the proposed service, thanks to the short revisit of Sentinel-2. The comparison with maps produced by the Copernicus Emergency Management Service has shown that the mapping algorithm implemented in the processor performs quite well. The high values of the overall accuracy and the kappa coefficient have confirmed, from a quantitative point of view, the good behavior of the algorithm, even considering different geographic areas. We did not quantify the errors due to the presence of cloud cover because the cloud cover detection is carried out at the Sentinel-2 ground segment when producing level 2A products, so that it has nothing to do with the algorithm.
The service is tested in fully pre-operational mode since the summer of 2019. The maps produced by the proposed service could be daily visualized by the end-user (the Italian Department of Civil Protection) through a web portal in order to provide emergency managers with near real-time information about the extent of the burned areas. Future work will concern the possible application of AUTOBAM to identify burned shrubbery areas too, which are prone to be affected by fire in the Mediterranean region.
Although the proposed service has been conceived to work at a national (Italian) scale, it is possible to use the mapping algorithm with any pair of Sentinel-2 pre- and post-fire images, provided that they refer to the same tile. Hence, we have planned to export the burned areas mapping algorithm in a platform named Web Advanced Space Developer Interface (WASDI, available at http://www.wasdi.net) where authorized users will be able to rapidly process selected pairs of Sentinel-2 images. The added value of WASDI with respect to currently existing catalogs is its capability to elaborate Earth Observation data (like Sentinel-2 ones) directly on a cloud server connected to one of the Copernicus Data and Information Access Services (DIAS), namely the ONDA DIAS. The exportation of the algorithm in WASDI would, therefore, move the processor towards the data rather than the data to the users, with a significant time-saving.

Author Contributions

Conceptualization, L.P., G.S., S.P., D.N., and A.G.; methodology, L.P., G.S., and E.F.; software, L.P. and G.S.; validation, E.F., L.P., and G.S.; formal analysis, L.P.; investigation, L.P.; resources, L.F.; data curation, G.S., E.F., and L.P.; writing—original draft preparation, L.P., G.S., and E.F.; writing—review and editing, L.P., G.S., E.F., P.F, L.F., S.P., D.N., and A.G.; visualization, G.S., E.F., and L.P.; supervision, S.P., D.N., A.G., and M.S.; project administration, L.F., P.F., and L.P.; funding acquisition, L.F. and P.F. All authors have read and agreed to the published version of the manuscript.

Funding

This research was funded by the Italian Department of Civil Protection, Presidency of the Council of Ministers, through the convention between Department of Civil Protection and CIMA Research Foundation, for the development of knowledge, methodologies, technologies, and training, useful for the implementation of national systems of monitoring, prevention, and surveillance.

Conflicts of Interest

The authors declare no conflict of interest.

References

  1. Van Der Werf, G.R.; Randerson, J.T.; Giglio, L.; Van Leeuwen, T.T.; Chen, Y.; Rogers, B.M.; Mu, M.; Van Marle, M.J.E.; Morton, D.C.; Collatz, G.J.; et al. Global fire emissions estimates during 1997-2016. Earth Syst. Sci. Data 2017, 9, 697–720. [Google Scholar] [CrossRef] [Green Version]
  2. Fox, D.M.; Laaroussi, Y.; Malkinson, L.D.; Maselli, F.; Andrieu, J.; Bottai, L.; Wittenberg, L. POSTFIRE: A model to map forest fire burn scar and estimate runoff and soil erosion risks. Remote Sens. Appl. Soc. Environ. 2016, 4, 83–91. [Google Scholar] [CrossRef]
  3. Quintano, C.; Fernández-Manso, A.; Fernández-Manso, O. Combination of Landsat and Sentinel-2 MSI data for initial assessing of burn severity. Int. J. Appl. Earth Obs. Geoinf. 2018, 64, 221–225. [Google Scholar] [CrossRef]
  4. Huang, H.; Roy, D.P.; Boschetti, L.; Zhang, H.K.; Yan, L.; Kumar, S.S.; Gomez-Dans, J.; Li, J. Separability analysis of Sentinel-2A Multi-Spectral Instrument (MSI) data for burned area discrimination. Remote Sens. 2016, 8, 873. [Google Scholar] [CrossRef] [Green Version]
  5. Miller, J.D.; Thode, A.E. Quantifying burn severity in a heterogeneous landscape with a relative version of the delta Normalized Burn Ratio (dNBR). Remote Sens. Environ. 2007, 109, 66–80. [Google Scholar] [CrossRef]
  6. Stambaugh, M.C.; Hammer, L.D.; Godfrey, R. Performance of burn-severity metrics and classification in oak woodlands and grasslands. Remote Sens. 2015, 7, 10501–10522. [Google Scholar] [CrossRef] [Green Version]
  7. Chuvieco, E.; Mouillot, F.; van der Werf, G.R.; San Miguel, J.; Tanasse, M.; Koutsias, N.; García, M.; Yebra, M.; Padilla, M.; Gitas, I.; et al. Historical background and current developments for mapping burned area from satellite Earth observation. Remote Sens. Environ. 2019, 225, 45–64. [Google Scholar] [CrossRef]
  8. Giglio, L.; Boschetti, L.; Roy, D.P.; Humber, M.L.; Justice, C.O. The Collection 6 MODIS burned area mapping algorithm and product. Remote Sens. Environ. 2018, 217, 72–85. [Google Scholar] [CrossRef]
  9. Padilla, M.; Stehman, S.V.; Ramo, R.; Corti, D.; Hantson, S.; Oliva, P.; Alonso-Canas, I.; Bradley, A.V.; Tansey, K.; Mota, B.; et al. Comparing the accuracies of remote sensing global burned area products using stratified random sampling and estimation. Remote Sens. Environ. 2015, 160, 114–121. [Google Scholar] [CrossRef] [Green Version]
  10. Filipponi, F. Exploitation of Sentinel-2 Time Series to Map Burned Areas at the National Level: A Case Study on the 2017 Italy Wildfires. Remote Sens. 2019, 11, 622. [Google Scholar] [CrossRef] [Green Version]
  11. Vanderhoof, M.K.; Fairaux, N.; Beal, Y.J.G.; Hawbaker, T.J. Validation of the USGS Landsat Burned Area Essential Climate Variable (BAECV) across the conterminous United States. Remote Sens. Environ. 2017, 198, 393–406. [Google Scholar] [CrossRef]
  12. Roteta, E.; Bastarrika, A.; Padilla, M.; Storm, T.; Chuvieco, E. Development of a Sentinel-2 burned area algorithm: Generation of a small fire database for sub-Saharan Africa. Remote Sens. Environ. 2019, 222, 1–17. [Google Scholar] [CrossRef]
  13. Vanderhoof, M.K.; Brunner, N.; Beal, J.-Y.G.; Hawbaker, T.J. Evaluation of the U.S. Geological Survey Landsat Burned Area Essential Climate Variable across the Conterminous U.S. Using Commercial High-Resolution Imagery. Remote Sens. 2017, 9, 743. [Google Scholar] [CrossRef] [Green Version]
  14. Navarro, G.; Caballero, I.; Silva, G.; Parra, P.C.; Vázquez, Á.; Caldeira, R. Evaluation of forest fire on Madeira Island using Sentinel-2A MSI imagery. Int. J. Appl. Earth Obs. Geoinf. 2017, 58, 97–106. [Google Scholar] [CrossRef] [Green Version]
  15. Fernández-Manso, A.; Fernández-Manso, O.; Quintano, C. SENTINEL-2A red-edge spectral indices suitability for discriminating burn severity. Int. J. Appl. Earth Obs. Geoinf. 2016, 50, 170–175. [Google Scholar] [CrossRef]
  16. Lasaponara, R.; Tucci, B.; Ghermandi, L. On the use of satellite Sentinel 2 data for automatic mapping of burnt areas and burn severity. Sustainability 2018, 10, 3889. [Google Scholar] [CrossRef] [Green Version]
  17. Verhegghen, A.; Eva, H.; Ceccherini, G.; Achard, F.; Gond, V.; Gourlet-Fleury, S.; Cerutti, P.O. The potential of sentinel satellites for burnt area mapping and monitoring in the Congo Basin forests. Remote Sens. 2016, 8, 986. [Google Scholar] [CrossRef] [Green Version]
  18. Chuvieco, E.; Congalton, R.G. Mapping and inventory of forest fires from digital processing of tm data. Geocarto Int. 1988, 3, 41–53. [Google Scholar] [CrossRef]
  19. De Santis, A.; Chuvieco, E. Burn severity estimation from remotely sensed data: Performance of simulation versus empirical models. Remote Sens. Environ. 2007, 108, 422–435. [Google Scholar] [CrossRef]
  20. Bastarrika, A.; Alvarado, M.; Artano, K.; Martinez, M.P.; Mesanza, A.; Torre, L.; Ramo, R.; Chuvieco, E. BAMS: A tool for supervised burned area mapping using landsat data. Remote Sens. 2014, 6, 12360–12380. [Google Scholar] [CrossRef] [Green Version]
  21. Schepers, L.; Haest, B.; Veraverbeke, S.; Spanhove, T.; Vanden Borre, J.; Goossens, R. Burned area detection and burn severity assessment of a heathland fire in belgium using airborne imaging spectroscopy (APEX). Remote Sens. 2014, 6, 1803–1826. [Google Scholar] [CrossRef] [Green Version]
  22. Murphy, K.A.; Reynolds, J.H.; Koltun, J.M. Evaluating the ability of the differenced Normalized Burn Ratio (dNBR) to predict ecologically significant burn severity in Alaskan boreal forests. Int. J. Wildl. Fire 2008, 17, 490–499. [Google Scholar] [CrossRef]
  23. Brewer, C.K.; Winne, J.C.; Redmond, R.L.; Opitz, D.W.; Mangrich, M. V Classifying and Mapping Wildfire Severity: A Comparison of Methods. Photogramm. Eng. Remote Sensing 2005, 71, 1311–1320. [Google Scholar] [CrossRef] [Green Version]
  24. Zheng, Z.; Zeng, Y.; Li, S.; Huang, W. Mapping Burn Severity of Forest Fires in Small Sample Size Scenarios. Forests 2018, 9, 608. [Google Scholar] [CrossRef] [Green Version]
  25. Stroppiana, D.; Azar, R.; Calò, F.; Pepe, A.; Imperatore, P.; Boschetti, M.; Silva, J.M.N.; Brivio, P.A.; Lanari, R. Integration of optical and SAR data for burned area mapping in Mediterranean regions. Remote Sens. 2015, 7, 1320–1345. [Google Scholar] [CrossRef] [Green Version]
  26. Fernandez-Manso, A.; Quintano, C.; Roberts, D.A. Burn severity influence on post-fire vegetation cover resilience from Landsat MESMA fraction images time series in Mediterranean forest ecosystems. Remote Sens. Environ. 2016, 184, 112–123. [Google Scholar] [CrossRef]
  27. Boschetti, L.; Roy, D.P.; Justice, C.O.; Humber, M.L. MODIS-Landsat fusion for large area 30m burned area mapping. Remote Sens. Environ. 2015, 161, 27–42. [Google Scholar] [CrossRef]
  28. Bovolo, F.; Bruzzone, L. A Split-Based Approach to Unsupervised Change Detection in Large-Size Multitemporal Images: Application to Tsunami-Damage Assessment. IEEE Trans. Geosci. Remote Sens. 2007, 45, 1658–1669. [Google Scholar] [CrossRef]
  29. Botella-Martínez, M.A.; Fernández-Manso, A. Estudio de la severidad post-incendio en la comunidad Valenciana comparando los índices dNBR, RdNBR y RBR a partir de imágenes landsat 8. Rev. Teledetec. 2017, 2017, 33–47. [Google Scholar] [CrossRef] [Green Version]
  30. Parks, S.A.; Dillon, G.K.; Miller, C. A new metric for quantifying burn severity: The relativized burn ratio. Remote Sens. 2014, 6, 1827–1844. [Google Scholar] [CrossRef] [Green Version]
  31. Chini, M.; Hostache, R.; Giustarini, L.; Matgen, P. A hierarchical split-based approach for parametric thresholding of SAR images: Flood inundation as a test case. IEEE Trans. Geosci. Remote Sens. 2017, 55, 6975–6988. [Google Scholar] [CrossRef]
  32. Key, C.H.; Benson, N. The Normalized Burn Ratio (NBR): A Landsat TM radiometric measure of burn severity. US Geol. Surv. North. Rocky Mt. Sci. Center. 1999. [Google Scholar]
  33. Miller, J.D.; Knapp, E.E.; Key, C.H.; Skinner, C.N.; Isbell, C.J.; Creasy, R.M.; Sherlock, J.W. Calibration and validation of the relative differenced Normalized Burn Ratio (RdNBR) to three measures of fire severity in the Sierra Nevada and Klamath Mountains, California, USA. Remote Sens. Environ. 2009, 113, 645–656. [Google Scholar] [CrossRef]
  34. Tucker, C.J. Red and Photographic Infrared Linear Combinations for Monitoring Vegetation. Remote Sens. Environ. 1979, 8, 127–150. [Google Scholar] [CrossRef] [Green Version]
  35. Xu, H. Modification of normalised difference water index (NDWI) to enhance open water features in remotely sensed imagery. Int. J. Remote Sens. 2006, 27, 3025–3033. [Google Scholar] [CrossRef]
  36. Lasaponara, R. Estimating spectral separability of satellite derived parameters for burned areas mapping in the Calabria region by using SPOT-Vegetation data. Ecol. Modell. 2006, 196, 265–270. [Google Scholar] [CrossRef]
  37. Amitrano, D.; Di Martino, G.; Iodice, A.; Riccio, D.; Ruello, G. Unsupervised Rapid Flood Mapping Using Sentinel-1 GRD SAR Images. IEEE Trans. Geosci. Remote Sens. 2018, 56, 3290–3299. [Google Scholar] [CrossRef]
  38. Richards, J.A.; Jia, X. Remote Sensing Digital Image Analysis: An introduction; Springer: Berlin/Heidelberg, Germany, 2006; ISBN 3540251286. [Google Scholar]
  39. Boni, G.; Ferraris, L.; Pulvirenti, L.; Squicciarino, G.; Pierdicca, N.; Candela, L.; Pisani, A.R.; Zoffoli, S.; Onori, R.; Proietti, C.; et al. A Prototype System for Flood Monitoring Based on Flood Forecast Combined with COSMO-SkyMed and Sentinel-1 Data. IEEE J. Sel. Top. Appl. Earth Obs. Remote Sens. 2016, 9, 2794–2805. [Google Scholar] [CrossRef]
  40. Martinis, S.; Twele, a.; Voigt, S. Towards operational near real-time flood detection using a split-based automatic thresholding procedure on high resolution TerraSAR-X data. Nat. Hazards Earth Syst. Sci. 2009, 9, 303–314. [Google Scholar] [CrossRef]
  41. Otsu, N. A Threshold Selection Method from Gray Level Histograms. IEEE Trans. Syst. Man. Cybern. 1979, 9, 62–66. [Google Scholar] [CrossRef] [Green Version]
  42. Haralick, R.M.; Shapiro, L.G. Survey: Image Segmentation Techniques. Comput. Vision, Graph. Image Process. 1985. [Google Scholar] [CrossRef]
  43. Pulvirenti, L.; Squicciarino, G.; Cenci, L.; Boni, G.; Pierdicca, N.; Chini, M.; Versace, C.; Campanella, P. A surface soil moisture mapping service at national (Italian) scale based on Sentinel-1 data. Environ. Model. Softw. 2018, 102, 13–28. [Google Scholar] [CrossRef]
  44. Martinis, S.; Kersten, J.; Twele, A. A fully automated TerraSAR-X based flood service. ISPRS J. Photogramm. Remote Sens. 2015, 104, 203–212. [Google Scholar] [CrossRef]
  45. Pierdicca, N.; Chini, M.; Pulvirenti, L.; Macina, F. Integrating physical and topographic information into a fuzzy scheme to map flooded area by SAR. Sensors 2008, 8, 4151–4164. [Google Scholar] [CrossRef] [PubMed] [Green Version]
  46. Pagliara, P.; Corina, A.; Burastero, A.; Campanella, P.; Ferraris, L.; Morando, M.; Rebora, N.; Versace, C. Dewetra, coping with emergencies. In Proceedings of the 8th International Conference on Information Systems for Crisis Response and Management. (ISCRAM 2011), Lisabon, Portugal, 8–11 May 2011. [Google Scholar]
  47. Bastarrika, A.; Chuvieco, E.; Martín, M.P. Mapping burned areas from landsat TM/ETM+ data with a two-phase algorithm: Balancing omission and commission errors. Remote Sens. Environ. 2011, 115, 1003–1012. [Google Scholar] [CrossRef]
  48. Giglio, L.; Schroeder, W.; Justice, C.O. The collection 6 MODIS active fire detection algorithm and fire products. Remote Sens. Environ. 2016, 178, 31–41. [Google Scholar] [CrossRef] [Green Version]
  49. Hawbaker, T.J.; Vanderhoof, M.K.; Beal, Y.J.; Takacs, J.D.; Schmidt, G.L.; Falgout, J.T.; Williams, B.; Fairaux, N.M.; Caldwell, M.K.; Picotte, J.J.; et al. Mapping burned areas using dense time-series of Landsat data. Remote Sens. Environ. 2017, 198, 504–522. [Google Scholar] [CrossRef]
  50. Hawbaker, T.J.; Radeloff, V.C.; Syphard, A.D.; Zhu, Z.; Stewart, S.I. Detection rates of the MODIS active fire product in the United States. Remote Sens. Environ. 2008, 112, 2656–2664. [Google Scholar] [CrossRef]
  51. Hall, D.K.; Ormsby, J.P.; Johnson, L.; Brown, J. Landsat digital analysis of the initial recovery of burned tundra at Kokolik River, Alaska. Remote Sens. Environ. 1980, 10, 263–272. [Google Scholar] [CrossRef]
  52. Trigg, S.; Flasse, S. An evaluation of different bi-spectral spaces for discriminating burned shrub-savannah. Int. J. Remote Sens. 2001, 22, 2641–2647. [Google Scholar] [CrossRef]
Figure 1. Sentinel-2 tiles, covering the Italian territory and processed by AUTOBAM.
Remotesensing 12 00674 g001
Figure 2. Land cover map of Italy derived from the CORINE land cover (CLC) data (projection LATLON-WGS84). Red: artificial surfaces (codes from 111 to 142); yellow: agricultural areas (211 to 244); green: forests and semi-natural areas (311 to 335); cyan: wetlands (411 to 423); blue water bodies (excluded sea; 511 to 522). It represents the master product used by AUTOBAM as a geographic reference for cartographic projection and pixel size.
Remotesensing 12 00674 g002
Figure 3. Block diagram of the script for S2 data procurement implemented in AUTOBAM.
Remotesensing 12 00674 g003
Figure 4. The three-block diagram of the burned area (BA) mapping algorithm implemented in AUTOBAM; (a) Block#1, (b) Block#2, and (c) Block#3. The diagram refers to a single S2 tile.
Remotesensing 12 00674 g004
Figure 5. Saving and update of normalized burned ratio (NBR) maps (the mechanism is identical for NDVI maps).
Remotesensing 12 00674 g005
Figure 6. Fuzzy membership functions defined for (a) distance from the set of burned areas (SoBAs), (b) RdNBR value, and (c) distance from the refined set of potentially burned areas (RSoPBAs).
Remotesensing 12 00674 g006
Figure 7. Map of burned areas for the Italian territory generated by AUTOBAM for the S2 acquisition performed on July 4th, 2019; (a) synoptic view; (b) zoom on one of the burned areas (highlighted by the yellow box in panel (a)) with the information about the burned area available for the end-user.
Remotesensing 12 00674 g007
Figure 8. Comparison between (a) zoom on the Sicily region of the map of burned areas generated by AUTOBAM from the S2 acquisition on 6 August 2019, and (b) map derived from the local fire signaling in the period 2–6 August 2019. Red crosses: AUTOBAM-burned areas; yellow airplanes: location of the fires according to local fire signaling. Local signaling not regarding forests are not considered (masked by green boxes in panel (b)). Both maps are available from the MyDewetra platform. Yellow and orange circles highlight the fires reported by local news, which were not detected by AUTOBAM.
Remotesensing 12 00674 g008
Figure 9. Maps of burned areas derived from AUTOBAM and Copernicus Emergency Management Service (CEMS); (a) AUTOBAM-derived map for the Evia Island event (EMSR306); (b) CEMS-derived map for the Evia Island event (EMSR306); (c) AUTOBAM-derived map for the Tuscany event (EMSR316); (d) CEMS-derived map for the Tuscany event (EMSR316); (e) AUTOBAM-derived map for the Sithonia event (EMSR331); (f) CEMS-derived map for the Sithonia event (EMSR331); (g) AUTOBAM-derived map for the Mount Kenia event (EMSR345); (h) CEMS-derived map for the Mount Kenia event (EMSR345); (i) AUTOBAM-derived map for the Castile and León event (EMSR368); (j) CEMS-derived map for the Castile and León event (EMSR368). Red: BA according to AUTOBAM; orange: BA according to CEMS; white: unburned; black: unclassified (e.g., sea); gray: clouds (enlarged by creating a buffer zone, see Section 3.2.1) according to the scene classification (SCL) included in the level 2A (L2A) products.
Remotesensing 12 00674 g009
Figure 10. Zoom on a portion of the area of interest for the Evia Island test case, where a false alarm occurs (yellow circles); (a) pre-fire true color image; (b) post-fire true color image; (c) RdNBR map; (d) AUTBAM-derived burned areas map.
Remotesensing 12 00674 g010
Figure 11. Zoom on a portion of the area of interest for the Sithonia test case; (a) pre-fire true color image; (b) post-fire true color image; (c) RdNBR map; (d) AUTBAM-burned areas map. The orange line delineates the BA according to CEMS, while the blue circles highlight the zones of disagreement between AUTOBAM- and CEMS-derived maps.
Remotesensing 12 00674 g011
Figure 12. AUTOBAM-burned areas maps for the Castile and León case study; (a) performing the ISODATA classification step; (b) without performing the ISODATA classification step. Green lines represent the perimeter of the CEMS-derived burned areas. The orange box delineates the CEMS-derived area of interest. Panel (c) is a zoom on the CEMS-derived area of interest.
Remotesensing 12 00674 g012
Figure 13. AUTOBAM-derived BA map for the Tuscany case study, where the pixels included in the BA because of the application of the fuzzy logic-based approach are colored in blue; some of them are also highlighted by the blue circles. Green lines represent the perimeter of the CEMS-derived burned areas.
Remotesensing 12 00674 g013
Table 1. Classes of the scene classification map included in Sentinel-2 level 2A products.
LabelClass
0no data
1saturated or defective
2dark area pixels
3cloud shadows
4vegetation
5not vegetated
6water
7unclassified
8cloud medium probability
9cloud high probability
10thin cirrus
11snow
Table 2. Results of the comparison between AUTOBAM-derived and CEMS-derived maps of burned areas for the case studies listed in Section 2.5.
EMSR 306––Evia Island, Greece. OA = 98.5%; κ = 0.82
ClassUnburned (%)Burned (%)Commission (%)Omission (%)
Unburned98.675.63
Burned1.3394.3725.855.63
EMSR 316––Tuscany, Italy. OA = 97.9%; κ = 0.90
ClassUnburned (%)Burned (%)Commission (%)Omission (%)
Unburned99.6114.26
Burned0.3985.743.3314.26
EMSR 331––Sithonia, Greece. OA = 96.6%; κ = 0.84
ClassUnburned (%)Burned (%)Commission (%)Omission (%)
Unburned99.9324.52
Burned0.0774.480.6324.52
EMSR 345––Mount Kenia, Kenia. OA = 99.3%; κ = 0.94
ClassUnburned (%)Burned (%)Commission (%)Omission (%)
Unburned99.9610.46
Burned0.0489.540.7410.46
EMSR 368––Castile and León, Spain. OA = 99.5%; κ = 0.95
ClassUnburned (%)Burned (%)Commission (%)Omission (%)
Unburned99.958.51
Burned0.0591.491.048.51

