Article

Fire Detection and Fire Radiative Power in Forests and Low-Biomass Lands in Northeast Asia: MODIS versus VIIRS Fire Products

1
School of Earth and Space Sciences, University of Science and Technology of China, Hefei 230026, China
2
Institut de recherche sur les forêts, Université du Québec en Abitibi-Témiscamingue (UQAT), Rouyn-Noranda, QC J9X 5E4, Canada
3
Comparative Planetary Excellence Innovation Center, Chinese Academy of Sciences, Hefei 230026, China
4
State Key Laboratory of Fire Science, University of Science and Technology of China, Hefei 230026, China
5
GreenEarth Research Company Inc., Slingerlands, NY 12209, USA
6
Département des sciences biologiques université du Québec à Montréal C.P. 8888.Succursale Centre-Ville, Montréal, QC H3C 3P8, Canada
*
Author to whom correspondence should be addressed.
Remote Sens. 2020, 12(18), 2870; https://doi.org/10.3390/rs12182870
Submission received: 19 July 2020 / Revised: 31 August 2020 / Accepted: 2 September 2020 / Published: 4 September 2020

Abstract

:
Fire omission and commission errors, and the accuracy of fire radiative power (FRP) from satellite moderate-resolution impede the studies on fire regimes and FRP-based fire emissions estimation. In this study, we compared the accuracy between the extensively used 1-km fire product of MYD14 from the Moderate Resolution Imaging Spectroradiometer (MODIS) and the 375-m fire product of VNP14IMG from the Visible Infrared Imaging Radiometer Suite (VIIRS) in Northeastern Asia using data from 2012–2017. We extracted almost simultaneous observation of fire detection and FRP from MODIS-VIIRS overlapping orbits from the two fire products, and identified and removed duplicate fire detections and corresponding FRP in each fire product. We then compared the performance of the two products between forests and low-biomass lands (croplands, grasslands, and herbaceous vegetation). Among fire pixels detected by VIIRS, 65% and 83% were missed by MODIS in forests and low-biomass lands, respectively; whereas associated omission rates by VIIRS for MODIS fire pixels were 35% and 53%, respectively. Commission errors of the two fire products, based on the annual mean measurements of burned area by Landsat, decreased with increasing FRP per fire pixel, and were higher in low-biomass lands than those in forests. Monthly total FRP from MODIS was considerably lower than that from VIIRS due to more fire omission by MODIS, particularly in low-biomass lands. However, for fires concurrently detected by both sensors, total FRP was lower with VIIRS than with MODIS. This study contributes to a better understanding of fire detection and FRP retrieval performance between MODIS and its successor VIIRS, providing valuable information for using those data in the study of fire regimes and FRP-based fire emission estimation.

Graphical Abstract

1. Introduction

Satellite observation with relatively high spatiotemporal resolution and broad spatial coverage is often used to investigate fire impacts on vegetation, atmosphere, climate, air quality, and human society [1,2,3,4,5,6]. Regional to global scale observation of vegetation fires (e.g., fire detection, fire intensity, burned area) is possible via satellite sensors including the Moderate Resolution Imaging Spectroradiometer (MODIS) on Aqua and Terra, the Advanced Very High Resolution Radiometer (AVHRR) on NOAA, the Thematic Mapper/Enhance Thematic Mapper Plus (TM/ETM+) on Landsat, and sensors on the Geostationary Operational Environmental Satellite (GOES) and Himawari-8 satellite [5,7,8,9]. Among these sensors, fire observation, such as fire detection and fire radiative power (FRP) [10,11], is extensively applied based on the MODIS 1-km active fire products. For example, MODIS active fire detection has been applied to estimate agricultural fire impacts on air quality [4], fire spread rates in boreal forests [12], and the influence of fire frequency in savanna ecosystems [13]. MODIS derived FRP has been used to quantify fire intensity [14], estimate smoke injection height [15] and fire severity [16] as well as impacts on post-fire forest productivity [17]. Most commonly, FRP is used to estimate fire emission including the emission coefficient (Ce) [18,19,20,21]. For instance, Kaiser et al. [20] converted FRP density to dry biomass consumption and calculated the global daily emissions of smoke aerosol and trace gases. Ichoku and Kaufman [22] developed a top-down approach to retrieve smoke aerosol Ce using satellite-derived FRP. Several studies based on this method derived Ce of nitrogen oxides [23,24,25]. Recently, Fu et al. [18] obtained Ce of both smoke aerosols and several trace gases including nitrogen oxides, carbon monoxide, and formaldehyde. However, despite wide application of fire observation based on MODIS, the effects of omission and commission errors (false alarms) of fire detection and the accuracy on FRP remain the major sources of uncertainty [19,26,27]. As a result, studies on fire regimes and emission estimation from MODIS fire observation can differ considerably from other satellites [27,28]. We hypothesize that satellite fire observation using a finer spatial resolution and stronger fire sensitivity (e.g., to cooler fires) than MODIS could mitigate these problems.
The Visible Infrared Imaging Radiometer Suite (VIIRS) sensor is a new-generation moderate resolution instrument. VIIRS is designed as a MODIS successor and expected to provide fire observation for the post-MODIS era. Up to date, daily global active fire products at nominal spatial resolutions of 750 and 375 m are provided by VIIRS on board the Suomi National Polar-orbiting Partnership (SNPP) [29], and the VIIRS 375-m active fire product has been available since 2012 [29,30]. Similarities between the VIIRS 375-m and MODIS 1-km active fire products include the application of comparable spectrum channels, the algorithms in fire detection [29,30,31,32], and approaches on FRP calculation [11,32,33]. In addition, SNPP VIIRS has similar equator overpass times (local time) at ≈1:30 PM (ascending orbit) and ≈1:30 AM (descending orbit) with Aqua MODIS [34], enabling the collection of enough simultaneous observations for accurate comparison. However, several major differences exist between VIIRS and MODIS. First, the MODIS spatial resolution is ≈7 times that of VIIRS 375-m observation at nadir, and even higher at scan edge [30,34,35]. Second, an onboard aggregation scheme was adopted for VIIRS to reduce the pixel size growth along the scan angle while no such process was applied for MODIS [35]. Third, a special processing step was applied to calculate FRP with the VIIRS 375-m fire product. That is, the coinciding 375 m fire pixels within a single and co-located 750 m VIIRS pixel share the same fraction of FRP to reduce the saturation effect of the mid-infrared I4 channel at 375 m resolution in FRP retrieval [33]. These improvements allow the VIIRS 375-m fire product to easily detect small size fires (and retrieve their FRP) that are beyond the capacity of MODIS [29,30,36]. Comparing fire products among VIIRS and MODIS, therefore, can support assessments of fire detection performance (e.g., fire omission) and FRP retrieval globally. Such assessments are important because there are ≈20 years (until 2020) of MODIS derived fire records, and the potential effects of fire omission, commission error, and underestimation/overestimation of FRP can impede fire regimes identification [28] and fire emission estimation [19,27]. Though several studies have reported higher fire counts of the VIIRS 375-m than MODIS 1-km global active fire products [37,38,39], more comparative studies are warranted to assess fire detection (e.g., fire omission, commission error) and FRP retrieval between the two fire products. For fire detection, it is not clear whether the potential discrepancy of fire omission and commission error between the two products are magnified or diminished due to differences in vegetation cover since fire size and temperature (represented by fire intensity) differ among vegetation types [14,40], and the detection probability of fires from space is strongly related to fuel type, fire size, and temperature [30,41]. For FRP, discrepancy of fire detection could result in systematic bias of total FRP between the two products in a given region, and FRP of the same fire detected could also differ from each other. In addition, potential duplicate fire detections with VIIRS and MODIS [34] should be considered when comparing fire detection and FRP.
In this study, we focused our observation in Northeast Asia where forest fires and agricultural burning are prevalent. We compared fire detection and FRP between the MODIS 1-km fire product (MYD14) and VIIRS 375-m active fire product (VNP14IMG) by extracting almost simultaneous observations in MODIS-VIIRS overlapping orbits. Duplicate fire detections between two consecutive observation scans were identified and removed for each fire product. We then presented a case study first to explicitly show the fire detection and FRP retrieval between the two products, and then we compared fire detection and FRP from 2012–2017 with emphasis on two broad land cover categories: forests and low-biomass lands (crops, grasses, and herbaceous vegetation). We found significant differences in fire detection and FRP retrieval between low-biomass lands and forests.

2. Materials and Methods

2.1. Study Area

Our study region is in Northeast Asia, mainly including Northeast China and southeastern Siberia. Based on land cover data from 2012 to 2017 (Table 1 and Section 2.2, also see [42]), forests are the most abundant cover type representing ≈54% of the study region, followed by grasslands (≈15%), herbaceous vegetation (≈12%), and croplands (≈5%). Fires are common in the region, with forest fires in Northeast China contributing towards ≈73% of total burned area in China from 1999–2007 [43] and accounting for most of the non-agriculture fire emissions [44]. Moreover, agricultural practices including severe residue burns are prevalent in Northeast Asia [45]. Thus, forest fires and agricultural burning in this region are two important sources of emission [44,45]. Severe air pollution due to long-distance transportation of smoke pollution was documented [46,47], and modern records reveal large forest fires in the region such as in 1987 [48], 2004, and 2006 [18].

2.2. MODIS 1-km Fire Product

In this study we used the latest level 2 fire product MYD14 version 6 [49] from Aqua MODIS. Fire location, fire detection confidence, and FRP are available for each fire pixel in the product [49]. Fire location corresponds to the central longitude and latitude of a fire pixel; fire detection confidence is a measure of a fire pixel to be a true fire or not; and FRP is the release rate of fire radiative energy, calculated by Wooster et al. [11] approach as follows:
FRP = σ A p i x e l a τ 4 ( L 4 L 4 b )   ( Megawatt : MW )
where L 4 and L 4 b are radiances at 4 µm of fire and background pixels, respectively; A pixel is fire pixel area; σ = 5.6704   ×   10 8   W m 2   K 4 is the Stefan–Boltzmann constant; τ 4   is the atmospheric transmittance at 4 μ m ; and a = 3.0 10 9 W m 2 s r 1 μ m 1 k 4 is an empirical constant for MODIS.
MODIS scans the Earth surface along the cross-track direction every ≈1.48 s, with each scan comprising 10 image lines along track and each line comprising 1354 pixels along scan [50]. The resolution of each pixel is 1 × 1 km at nadir while it increases to about 2 × 5 km (along track × along scan) at the scan edge. Thus, substantial overlap exists in the leading and trailing parts between adjacent scans, which can reach up to ≈50% at the scan edge [50], leading to non-negligible duplicate fire detections and overestimation of cumulative FRP [34]. To identify and remove duplicate MODIS fire detections, we calculated the ground area for each fire pixel and estimated the proportion of overlapped fire pixel area using the geolocation product MYD03 [51]. The fire pixel’s ground area was calculated used Equations (2)–(5), following the methods of [22,49].
θ = s ( SID 676.5 )
where θ (o) is MODIS scan angle, s = 0.0014184 is a specific constant for MODIS; SID is the along-scan pixel index of fire pixel within the MODIS image pixel matrix. Then, the ground distance of pixel along scan direction ( Δ S , km) and along track direction ( Δ T , km) can be calculated as follows:
Δ S = R E s [ cos θ / ( R E R E + h ) 2 sin 2 θ 1   ]  
Δ T = ( R E + h ) s [ cos θ ( R E R E + h ) 2 sin 2 θ   ]
where R E is Earth radius (6378.137 km), h is the satellite altitude (705 km for Aqua); s and θ are the same as that in Equation (2). Finally, fire pixel area can be calculated by multiplying Δ S with Δ T as shown in Equation (5):
PixArea = Δ S   Δ T
where PixArea is fire pixel area.

2.3. VIIRS 375-m Fire Product

We used the level 2 fire product VNP14IMG [29] from SNPP VIIRS. Fire location, detection confidence, and FRP are available for each fire pixel in the product [29]. Description of these parameters is similar to those introduced in the MODIS MYD14 fire product. VIIRS scans the Earth surface by rotating its telescope assembly across the track direction [35]. Every ≈1.78 s, VIIRS scans the surface, with each scan containing 32 image lines along track, and each image line containing 6400 pixels along scan [30]. Actual pixel size of the VIIRS 375-m data is 0.38 × 0.36 km at nadir to 0.79 × 0.78 km (along scan × along track) at the scan edge [30]. Such an increase leads to overlap between two consecutive VIIRS 375-m scans, and thus the duplication of fire detections and FRP retrieval in the fire product. In our study, duplicate 375 m fire detections and the associated FRP were removed. To correct VIIRS 375-m duplicate fire detections, we calculated the ground area for each fire pixel, and estimated the proportion of overlapped fire pixel area using the 375-m geolocation product VNP03IMGLL [52]. The calculation approach of VIIRS fire pixel area is similar as that with MODIS.

2.4. Burned Area and Land Cover Data

Independent 30-m burned area data derived from Landsat images were used to explore commission error of the MODIS 1-km and VIIRS 375-m fire products. The data was collected from the Global Annual Burned Area Map of 2015 (GABAM 2015; [53]). This dataset provides worldwide observation of annual burned area for 2015 at 30-m resolution. Its validation has been conducted globally including the region examined in our study, and in different land cover types. The overall accuracies are 91%–99.8% among forests, and 94% over croplands [53].
We required land cover type information to conduct comparisons between the MODIS and VIIRS fire products at the vegetation level. In this study, land cover type information from 2012–2017 was extracted from the global annual land cover maps produced by the European Space Agency (ESA) Climate Change Initiative (CCI) and the Copernicus Climate Change Service (C3S). The spatial resolution of this data is 300 m, and the surface land cover is classified into 22 classes, such as evergreen broadleaved tree cover, croplands (rainfed, irrigated, or post-flooding), and grasslands [42].

2.5. Fire Product Processing

To ensure an accurate comparison of fire detection and FRP retrieval between sensors, we processed the original fire products as follows. For the two sensors we only used (1) fire detections inside MODIS-VIIRS overlapping orbits; (2) fire detections with overpass times ≤5 min to minimize the influence due to potential changes of fire status and atmosphere conditions during the detection time gap between sensors [34]; (3) moderate to high confidence fire detections to reduce effects such as sunlight and water surface reflection [29,49]; (4) non-duplicate fire detections (if more than 30% of the target fire pixel’s area overlapped with the fire pixels detected almost simultaneously in the previous scan, then that target fire pixel was excluded) (see Figure 1); (5) daytime fire detections because performance between sensors at daytime can be different than at nighttime [34].

2.6. Comparing Fire Detections and FRP

Comparison of fire detection and FRP retrieval between the MODIS 1-km and VIIRS 375-m fire products was conducted in two ways: (1) as a case study on 6 November 2015, and (2) across three broad cover categories (forests, low-biomass lands, and a category that includes all cover types together; see details below) using data from 2012–2017. In the case study, we directly compared the number of fire pixels and total FRP retrieval based on MODIS and VIIRS. In addition, for each MODIS 1-km fire pixel, we identified the VIIRS 375-m fire pixels within the same 1-km MODIS fire pixel footprint as co-located VIIRS fire pixels, and their total FRP was calculated as the co-located VIIRS FRP with MODIS. We conducted the linear least-squares regression fitting analysis between MODIS fire-pixel FRP and the co-located total FRP of VIIRS.
To compare the MODIS fire product with VIIRS fire product among different land cover types, we initially processed land cover data as follows. We identified for each fire pixel the land cover type from the nearest grid (300 × 300 m) of the Annual Global Land Cover map (see Section 2.2). Then, those fire pixels were classified into three broad cover categories: (1) forests if they were forest land cover types (40–100, 160, 170); (2) low-biomass lands if they were croplands (classes 10–12, 20, 30), grasslands (classes 130), and herbaceous cover types (classes 110); (3) a category that includes forests, low-biomass lands, and all other cover types (e.g., shrublands (classes 120, 180)) together for the purpose of investigating the overall performance (hereafter ‘all land cover type’ category).
After that, we examined the fire detection performance of MODIS and VIIRS following two approaches. First, MODIS and VIIRS fire pixels were classified as with and without co-located fire detections from each other, and we calculated the corresponding proportions. We then compared proportions between MODIS and VIIRS to explore their relative fire detection performance across the three broad cover categories in our study region.
As our second approach, burned area with a finer spatial resolution (30-m) from Landsat (Table 1) was used as reference data to assess the commission errors of both fire products. We did this because for false fire detections (commission errors) (e.g., solar heated bare soil, warm rooftop), there is no burned area created and existing in the pixel footprints. Therefore, by checking the existence of the Landsat 30-m burned area for each fire pixel, we can identify the potential false fire detections of the MODIS 1-km and VIIRS 375-km fire products, and use them for commission errors assessment. To test whether the commission errors of MODIS and VIIRS are different among land cover types and change with fire intensity, we grouped fire pixels into FRP bins based on their FRP values, with each bin having a width of 2 MW. We defined those fires pixels that were undetected by the Landsat 30-m burned area as commission error of fire detection, and estimated the commission error as a percentage ( E c , %) using Equation (6) for each FRP bin of the two products and across the three broad cover categories.
E c = 100 % M N
where M is the number of fire pixels in a FRP bin that was undetected (without co-located 30-m burned area observation) by Landsat, N is the total number of fire pixels in that FRP bin. Analyses were conducted for 2015, since the Landsat 30-m burned area data in our study region was only derived in this year (see Section 2.2).
Finally, we compared FRP between the two products over space and time. We directly compared the total FRP of MODIS with VIIRS during 2012–2017 on a grid-cell basis of 0.25°, with the total FRP for each grid cell calculated by summing FRP of fire pixels within it. We further analyzed the spatial distribution of delta FRP (VIIRS minus MODIS), VIIRS-to-MODIS FRP ratio, and the cumulative FRP of VIIRS as a function of FRP ratio. We also compared the monthly time series of the MODIS total FRP with VIIRS during 2012–2017, and applied Pearson correlation analysis and the linear least-squares regression between them.

3. Results

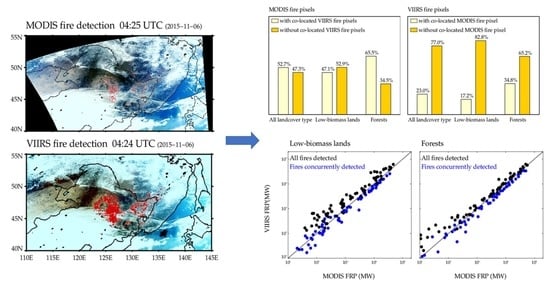
3.1. Fire Detection and FRP Comparison: Case Study

The case study shows the fire observation captured by SNPP VIIRS at 04:24 (UTC) and by Aqua MODIS at 04:25 (UTC) on 6 November 2015. As a large anomaly on the Earth surface, this fire case was confirmed by the MODIS Rapid Response Project. Figure 2 shows the RGB true-color images overlaid with fire detections (red dots), with the low confidence and duplicate fire detections removed (see Section 2.3). In this fire case, VIIRS identified 6868 fire pixels in the orbit-overlapped area with MODIS, which is about six times that of MODIS (1124 fire pixels). Noticeable VIIRS fire pixels (red dots in Figure 2b) are seen without corresponding MODIS fire observation (red dots in Figure 2a), suggesting the serious omission of MODIS detection. As a result, the total FRP of VIIRS fires (42,157 MW) is higher than MODIS (24,293 MW) by a factor of 73%, showing the significant underestimation of MODIS total FRP.
The correlation between MODIS fire-pixel FRP and the paired VIIRS FRP (sum FRP of the co-located VIIRS fire pixels inside a MODIS fire pixel) is shown in Figure 3. There are 779 out of the 1124 MODIS fire pixels that have co-located VIIRS fire detections, and a significant correlation is found between MODIS and the paired VIIRS FRP with a Pearson correlation coefficient of 0.85 observed (Figure 3). The linear fitting slope of the paired VIIRS FRP versus MODIS FRP is 0.72 less than 1:1, suggesting that FRP derived from VIIRS is smaller than MODIS for fires concurrently detected.
In brief, the total VIIRS FRP is much higher than that of MODIS due to a greater number of fire detections with VIIRS; however, for concurrently detected fires, FRP derived from VIIRS is lower than MODIS.

3.2. Fire Detection Comparison Across Land Cover Categories

For each fire product, proportions of fire pixels with and without co-located fire detection are shown in Figure 4 using data from 2012–2017. About 47.1% and 65.5% MODIS fire pixels have corresponding VIIRS fire observation in low-biomass lands and forests, respectively (Figure 4a, in light yellow). However, only 17.2% and 34.8% VIIRS fire pixels have co-located MODIS fire detections in the two broad land cover categories (Figure 4b, in light yellow). In other words, there are 52.9% and 34.5% MODIS fire pixels that have no co-located VIIRS fire detections (Figure 4a, in deep yellow) in the low-biomass lands and forests categories, respectively; while these proportions reach 82.8% and 65.2% for VIIRS fire pixels, respectively (Figure 4b, in deep yellow). Such results reveal the stronger fire detection capability of VIIRS and the more serious fire omission of MODIS in the study region, particularly over areas dominated by low-biomass lands.
The number of fire pixels in 2015 is distributed in Figure 5, with fire pixels detected and undetected by the Landsat 30-m burned area shown in red and blue colors, respectively, to further explore the potential commission errors of the two fire products. As Figure 5 shows, a large part of fire detections that were undetected by Landsat burned area have a low FRP observation (e.g., <10 MW for MODIS, and 3 MW for VIIRS). While for fire detections with relatively high FRP observation (e.g., >120 MW for MODIS in Figure 5c, and >40 MW for VIIRS in Figure 5f), these were generally detected by the Landsat burned area. Difference between low-biomass lands and forests were observed in at least two ways. First, fires in forests have a generally higher FRP than fires in low-biomass lands as the number of fire pixels in forests distributes in a higher value region of FRP compared with that in low-biomass lands. Second, the proportion of fire pixels undetected by Landsat are likely much higher in low-biomass lands than in forests (Figure 5b,e vs. Figure 5c,f).
Further analysis showed the higher commission error in low-biomass lands than in forests, which was observed in both fire products (Figure 6b,c). In addition, the commission error was strongly related to the average FRP per fire pixel. For instance, the MODIS commission error in forests were reduced from ≈65% when FRP per fire pixel reached 2–4 MW to less than 20% when FRP per fire pixel reached 18–20 MW (Figure 6c). Generally lower commission errors were also observed with the VIIRS 375-m fire product than with the MODIS 1-km fire product, which is shown in Figure 6a (all land cover types) and Figure 6c (forests). This suggests that with similar FRP observation, the probability of a fire pixel being a false detection was much lower with VIIRS than that with MODIS. However, this was not observed in low-biomass lands that showed similar commission errors between the two products (Figure 6b).

3.3. FRP Comparison Across Land Cover Categories

To assess the spatial similarity and dissimilarity of FRP between the two products, we showed the spatial distribution of the total FRP over the period 2012–2017 in Figure 7 at 0.25° resolution. Both products observed high total FRP along the China–Russia and China–North Korea boundaries, and in the Songnen and Sanjiang Plains in Northeastern China, and observed low FRP over the remaining areas (Figure 7a,b), indicating the generally consistent spatial patterns of MODIS and VIIRS FRP in our study region. However, many grid cells had FRP observation from VIIRS while these FRP were missed by MODIS; the total FRP using VIIRS was higher than with MODIS (Figure 7a,b). Direct calculation of FRP difference (VIIRS minus MODIS) revealed that most of grid cells had higher total FRP using VIIRS compared to MODIS (red in Figure 7c) except for a few grid cells that had lower total FRP of VIIRS than MODIS (blue in Figure 7c). The distribution of FRP ratio (VIIRS total FRP/MODIS total FRP) was further explored at 0.25° resolution (Figure 7d) to show the spatial discrepancy of FRP. For those grid cells with both MODIS and VIIRS fire detections, 73.2% of them had a ratio >1.0, and 11.7% of them even had a FRP ratio >4.0 with most of those high-ratio grid cells existing in the Songnen and Sanjiang Plains (red in Figure 7d) dominated by low-biomass lands.
The difference of FRP between MODIS and VIIRS was explored in more detail via Figure 8, which shows the cumulative sum of VIIRS FRP as a function of FRP ratio (VIIRS to MODIS). This distribution quantitatively describes the FRP discrepancy of the 0.25° grid cells between the two products. The results showed that 22.5% of VIIRS FRP occurs in grid cells having a FRP ratio <1.0. For these cells, it is likely that VIIRS underestimated FRP (discussion in Section 4), particularly over forest areas with 34.1% of VIIRS FRP sourced from grid cells where FRP ratios are smaller than 1.0, and much higher than that of low-biomass lands (22.5%). It was more common for grid cells to have a ratio >1.0 (Figure 8). There was 39.2% of VIIRS FRP in low-biomass lands that contributed from grid cells that had a ratio between 1.0 and 2.0 (Figure 8). This proportion, however, increased to 48.6% in forest areas (Figure 8). A high proportion of FRP was also contributed from grid cells having a ratio >2.0, especially over low-biomass lands accounting for 38.3% of total FRP. For these cells, the FRP underestimation with MODIS was significant due to fire omission (see Section 3.1 and Section 3.2).
The monthly time series of total FRP (Figure 9) were analyzed to show the temporal variations of MODIS versus VIIRS. Good agreement of the temporal variations was shown between MODIS FRP and VIIRS FRP (Figure 9) indicating the comparable FRP retrieval with the two products. However, the absolute values of monthly FRP were significantly different between the two products. Specifically, the monthly total FRP from all fires detected by VIIRS were generally higher than those detected by MODIS (Figure 9a,c,e), while opposite results were observed for the concurrently detected fires (Figure 9b,d,f). This indicates that for fires concurrently detected by both sensors, the derived FRP was lower with VIIRS than MODIS. However, there were many fires detected by VIIRS that were omitted by MODIS (see Section 3.2); these extra fire detections offset the effect of the lower FRP retrieved by VIIRS for those concurrently detected fires, and led to overall higher monthly total FRP with VIIRS than MODIS.
Figure 10 shows the correlation and linear regressions between monthly total FRP using MODIS and VIIRS. For monthly total FRP summed from all detected fires in the fire products, strong correlations were observed between the two products with the goodness of fit R-squared (R2) reaching 0.95, 0.91, and 0.98 for the three broad cover categories, respectively. The linear fitting slopes of VIIRS-vs-MODIS FRP were 1.22, 1.32, and 1.22 (black dots in Figure 10) for the three broad cover categories, respectively, revealing much higher monthly total FRP (from all detected fire) with VIIRS than MODIS, especially in the low-biomass lands (Figure 10b). For the monthly total FRP summed from concurrently detected fires, the linear regression slopes were 0.72, 0.73, and 0.70 for the three land cover type categories, respectively, corresponding with R2 of 0.99, 0.99, and 0.98. The linear fitting slopes less than 1:1 again revealed the lower FRP with VIIRS than MODIS for concurrently detected fires, which was consistent with that observed in Figure 3.

4. Discussion

4.1. Fire Detection Comparison Across Land Cover Categories

Both fire products showed a high proportion of fire pixels that had no co-located fire detection with each other (Figure 4) or undetected by the Landsat 30-m burned area, which was a strong indication of fire omission and commission errors.
For fire omission, the moderate resolution of MODIS and VIIRS seemed to lead to omission error in detecting subpixel fires. Besides, the spectral bands at 4 μm used for fire detection by MODIS and VIIRS could also contribute to fire omission in our study. The spectral band has been reported less sensitive than the shortwave infrared bands (e.g., 1.6 μm) in detecting hotspots of gases flaring [55], suggesting it is less sensitive to small size (e.g., the size of gases flaring) and low intensity fires. Actually, MODIS was reported to have a minimum detectable FRP of 2.5 MW at nadir and 17 MW at swath edge [34]. For the VIIRS 375-m fire product, we found that the minimum FRP detected in our study region is 0.4 MW. This suggests fires with FRP lower than their minimum detection limit are omitted. Fire omission by MODIS is important in our study region, as overall 77% of VIIRS fire detection have no concurrent MODIS observation (Figure 4b). High detection capability of the VIIRS 375-m fire product relative to the MODIS 1-km fire product has been observed in previous studies [30,38], for instance, in Punjab, India [38]. This is understandable, because VIIRS has finer spatial resolution than MODIS enabling it to detect fires of smaller size (e.g., small burned area) and lower intensity [30,36]. The slightly different cloud masking schemes [30,32] applied in the MODIS and VIIRS fire detection algorithms could also contribute to the different fire detection performance between the two sensors, since the misclassification of fire pixel as cloud pixel can lead to fire detection omission [32]. However, we did not investigate this effect on the relative performance of fire detection and FRP retrieval between the two sensors.
In addition, important fire omission was observed in croplands, grasslands, and herbaceous vegetation—featured with low biomass density [56,57]—compared with forests (Section 3.2). One of the major reasons could be attributed to the prevalence of small fire size [36,58] and lower fire intensities in those areas due to low fuel loads compared with forests [3,59]. For example, the average FRP per fire pixel using MODIS (VIIRS) was 56 MW (13 MW) in forests of our study region compared to 29 MW (7 MW) in low-biomass lands. Significantly lower fire intensity in low-biomass lands compared to forests was also found in the United States, Australia, and Brazil in a recent study by Kganyago and Shikwambana [60]. The serious fire omission in low-biomass lands suggests the importance in considering such effect in associated studies (e.g., FRP-based emission calculation), especially for the MODIS fire product (compared with VIIRS fire product) and in regions dominated by cropland fires, grassland fires, and other low-biomass vegetation fires; for example, in Africa where croplands and grasslands are extensive [61].
Commission errors were also noticeable and associated with lower mean FRP per fire pixel (Figure 6) likely as the result of various non-fire phenomena (e.g., solar heated bare soil, warm rooftop) that are easy to confuse from space with low intensity fires [36]. Such phenomena are less likely to produce false alarms with high FRP. Commission errors were also much higher in croplands, grasslands, and herbaceous cover types than in forests (Figure 6b,c). This could be due to some urban structures including concrete pavement and bright rooftops in agricultural areas (e.g., croplands) (e.g., [30,36]). Other non-fire phenomena such as sunlight reflection from small water bodies and warm bare soil can also produce values emulating low intensity fires thus contributing to the higher commission errors (e.g., Schroeder et al. [62]).

4.2. FRP Comparison Across Land Cover Categories

The FRP in the study region were generally comparable between the MODIS 1-km and VIIRS 375 m fire products, since good agreements were observed in spatial distributions (Figure 7) and time series (Figure 9), and the strong temporal correlations were also observed across the three broad land cover categories (Figure 10). Elvidge et al. [63] found that VIIRS FRP derived from the Nightfire algorithm were highly correlated with MODIS FRP in Sumatra. Recently, Li et al. [34] found that VIIRS FRP from the operational 750-m fire product in NOAA was comparable to that of Aqua MODIS in most fire clusters and at continental scales. Nevertheless, the absolute difference of FRP was remarkable between the two products (Section 3.3). For fires nearly concurrently detected by both sensors, VIIRS FRP was generally smaller than that of MODIS with a persistent VIIRS-MODIS slope of ≈0.70 observed in the case study and in the analysis across land cover types (Figure 3 and Figure 9). Similar finding were shown from the monitoring of active gas flares in a multisite study by Kumar et al. [64], and in a night fire case in Sumatra [63] with the latter observing a slope of 0.82 close to that in our study (0.70–0.73). One explanation of the lower VIIRS FRP than MODIS FRP for concurrently detected fires is the attenuation due to atmospheric absorption of carbon dioxide (CO2) at the VIIRS M-13 channel (3.97–4.13 μm) which was used for FRP calculation [33,65]. Such absorption could result in systematic underestimation of fire FRP retrieval by VIIRS [65]. Thick overhead smoke from fires can enhance the attenuation of VIIRS FRP [64]. In addition, a recent study in Madhavan [66] reported positive bias for temperature observation with the VIIRS M-13 band than MODIS B-22 band (used for MODIS FRP calculation) at colder scenes, but this does not exist at warmer scenes [66]. This suggests higher background radiation estimation with VIIRS than MODIS during the calculation of fire FRP. Based on Equation (1), such positive bias estimation of background radiation (or temperature) at M-13 bands can directly result in the underestimation of VIIRS FRP. Besides, for a given MODIS fire pixel with multiple hotspots (or long fire lines) [67], VIIRS will omit the hotspots below its detection capability. In such case, the MODIS FRP for this given MODIS pixel are expected to be higher than the total FRP of the co-located VIIRS fire pixels. In our study, these situations could co-exist and likely explain the lower VIIRS FRP for concurrently detected fires.
However, fires were necessarily detected by both sensors. Actually, many fires were detected by VIIRS but were omitted by MODIS (see Section 3.1 and Section 3.2 ). This finally offset the effect of the lower FRP retrieved by VIIRS for concurrently detected fires, and led to overall higher total FRP with VIIRS than MODIS in our study region when considering all detected fires in each fire product. Our findings were consistent with previous studies. For instance, Zhang et al. [36] observed much higher total FRP (from all fire detected) with VIIRS than MODIS over an agricultural area in eastern China, and the linear fitting slopes of VIIRS FRP(derived from their designed algorithm) to MODIS FRP varied from 1.01 in individual fire clusters to 1.84 at the scale of 1° grid cells (Figure 13c,f in [36]). The slopes (from all detected fires in fire products) obtained in our study changed from 1.22 to 1.32 among the three broad cover categories (Figure 10), falling in their valid range. A much higher value of 2.2 was reported by [38] in Punjab, India, which could be partially attributed to the non-contemporaneous fire detections considered, and the higher detection frequency (thus fire detections and corresponding FRP) of VIIRS than MODIS for a given place due to the wider swath of VIIRS (≈3000 km) than MODIS (≈2400 km). While, such a situation was excluded in our study, since we constrained our comparison by using fire detections from the MODIS-VIIRS overlapping orbits, and with an overpass time difference ≤5 min.
Our results also revealed the higher discrepancy of FRP between the two products in low-biomass lands than in forests. This can be explained as follows. First, due to the detection limit, it was more likely for MODIS to omit low-intensity fires (e.g., <10 MW [68]) compared with VIIRS. Much lower fire intensities in low-biomass lands relative to forests led to higher MODIS fire omission in low-biomass lands than in forests compared to VIIRS. As a result, higher FRP discrepancy between the two sensors was observed in low-biomass lands. Second, the attenuation of VIIRS FRP due to smoke cover and atmospheric CO2 absorption [64,65] to some extent offset the omission-related FRP difference (higher total FRP with VIIRS than MODIS), and such an effect seemed to be stronger in forests than in low-biomass lands. This was likely due to higher fire intensities in forests of our study region with high biomass consumption and smoke emission (e.g., CO2), and thus more smoke cover and CO2 absorption. For example, the cumulative sum of FRP from areas having a VIIRS-to-MODIS FRP ratio <1.0 was much higher in forests (34.1%) than in low-biomass lands (22.5%) (Figure 8), and the linear fitting slope of FRP (VIIRS vs MODIS) for concurrently detected fires was smaller in forest (0.70) than in low-biomass lands (0.73) (Figure 10). Therefore, these factors contribute to the smaller FRP discrepancy in forest than in low-biomass lands between the two sensors.
Overall, results in this study demonstrated some important differences in fire detection and FRP retrieval between MODIS and its successor VIIRS. Similar significant differences were also found in other products between the two sensors, for instance, the normalized difference vegetation index (NDVI) product [69] and aerosol optical depth (AOD) product [70].

4.3. Uncertainty and Error Sources

Several potential uncertainty and error sources impacted our results. First, cloud cover and smoke affected fire detection and FRP retrieval. Cloud cover was shown to reduce FRP of MODIS and VIIRS to some extent [71]. Likewise, thick smoke was also found to underestimate FRP retrieval of the two sensors [64]. However, the influence of cloud cover and smoke on MODIS FRP versus VIIRS FRP remains unclear. Second, the location of active fires inside a fire pixel (e.g., in the center or near edge of fire pixel) can affect FRP retrieval significantly [26,68], which could contribute to the difference of MODIS and VIIRS FRP. Third, the accuracy of the Landsat burned area data [53] used in our study can affect the commission error estimation. The burned area was derived from Landsat time series [53]. It can omit some real surface burned area due to the temporal gap caused by the relatively low temporal resolution of the Landsat images (more than 10 days) and cloud obstruction [53]. Such omissions in the reference data can cause an overestimation of the commission errors for MODIS and VIIRS fire products, which could be more significant over areas dominated by croplands, grasslands, and herbaceous vegetation featured with quick post-fire recovery. Therefore, the commission errors estimated in this study could be overestimated and should be towards the upper limit, especially in low-biomass lands. Finally, the accuracy of FRP in each fire product, and the quality of land cover type data can also introduce uncertainty in our results.

5. Conclusions

Accuracy of fire detection (omission and commission errors) and fire radiative power (FRP) from moderate-resolution satellite sensors impede the studies on fire regimes and FRP-based fire emissions estimation. In this study, we conducted a comprehensive comparison of fire detection and FRP retrieval between VIIRS 375-m and MODIS 1-km fire products in Northeast Asia using data from 2012 to 2017. Fire detection omission errors with the MODIS 1-km fire product were more important than with the VIIRS 375 m fire product, especially in low-biomass lands (croplands, grasslands, and herbaceous vegetation). The higher omission errors of MODIS observed in low-biomass lands were mainly due to the combination of MODIS coarser spatial resolution and the overall low fire intensity in low-biomass lands over which fires were more likely to be detected at higher spatial resolution. The commission errors of both fire products were strongly dependent on the derived fire-pixel FRP values and the land cover types. With FRP, MODIS and VIIRS showed generally comparable retrieval, with good agreement of spatial patterns and strong temporal correlations observed between the two sensors. However, differences in absolute values of FRP were significant between the two products. Specifically, for concurrently detected fires, VIIRS total FRP showed generally lower values than MODIS total FRP in our study region. The smoke and atmospheric absorption of carbon dioxide at M-13 (used for FRP calculation) with VIIRS could partially explain the observed differences. In contrast, when considering all detected fires in each fire product, VIIRS total FRP showed overall higher values than those with MODIS due to more fire detection of VIIRS, particularly in low-biomass lands. This study contributes to a better understanding of the relative performance in fire detection and FRP retrieval between MODIS and VIIRS, providing valuable information for their application in FRP-based fire emission estimation and fire regimes identification (e.g., fire intensity and fire severity based on FRP). We suggest the application of both MODIS and VIIRS to examine areas with complex fire regimes (where low-, moderate-, and high-intensity fires burn). VIIRS may be more useful for low-biomass areas dominated by low-intensity fires, while MODIS may provide more accurate FRP retrieval for high-intensity fires with thick smoke and strong atmospheric absorption (for VIIRS signal). Alternatively, if these low biomass areas were to change via afforestation, using both sensors would help to determine if there could be an increase in fire intensity.

Author Contributions

Data curation, Y.W. and J.H.; Formal analysis, Y.F. and X.W.; Investigation, Y.F.; Methodology, Y.F.; Resources, R.L.; Software, R.L.; Supervision, R.L., Y.B. and O.V.; Visualization, Y.F.; Writing—original draft, Y.F.; Writing—review and editing, Y.B., O.V. and R.D.C. All authors have read and agreed to the published version of the manuscript.

Funding

This work was supported by the National Natural Science Foundation of China NSFC, the Belmont Forum and JPI-Climate Collaborative Research Action with NSFC (Grant No. 41661144007, 41675022, 41375148, 41375030), the National Key Research and Development Program of China (Grant No. 2017YFC1501402), the Jiangsu Provincial 2011 Program (Collaborative Innovation Center of Climate Change).

Acknowledgments

We thank the China Scholarship Council for support the study in Canada. We thank Evan Ellicott and MODAPS Support Office for discussion about the calculation of MODIS and VIIRS fire pixels size. Thanks also to Xiaoyang Zhang for discussion about SNPP VIIRS fire products.

Conflicts of Interest

The authors declare no conflict of interest. The founding sponsors had no role in the design of the study; in the collection, analyses, or interpretation of data; in the writing of the manuscript, and in the decision to publish the results.

References

  1. Bowman, D.M.; Williamson, G.J.; Abatzoglou, J.T.; Kolden, C.A.; Cochrane, M.A.; Smith, A.M. Human exposure and sensitivity to globally extreme wildfire events. Nat. Ecol. Evol. 2017, 1, 1–6. [Google Scholar] [CrossRef]
  2. Chu, T.; Guo, X. Remote sensing techniques in monitoring post-fire effects and patterns of forest recovery in boreal forest regions: A review. Remote Sens. 2014, 6, 470–520. [Google Scholar] [CrossRef] [Green Version]
  3. Wiedinmyer, C.; Akagi, S.; Yokelson, R.J.; Emmons, L.; Al-Saadi, J.; Orlando, J.; Soja, A. The Fire INventory from NCAR (FINN): A high resolution global model to estimate the emissions from open burning. Geosci. Model Dev. 2011, 4, 625. [Google Scholar] [CrossRef] [Green Version]
  4. Zha, S.; Zhang, S.; Cheng, T.; Chen, J.; Huang, G.; Li, X.; Wang, Q. Agricultural fires and their potential impacts on regional air quality over China. Aerosol Air Qual. Res. 2013, 13, 992–1001. [Google Scholar] [CrossRef] [Green Version]
  5. Chuvieco, E.; Aguado, I.; Salas, J.; Garcia, M.; Yebra, M.; Oliva, P. Satellite Remote Sensing Contributions to Wildland Fire Science and Management. Curr. For. Rep. 2020, 6, 81–96. [Google Scholar] [CrossRef]
  6. Bergeron, Y. Fire Regimes: Spatial and Temporal Variability and Their Effects on Forests; Bergeron, Y., Gauthier, S., Eds.; Multidisciplinary Digital Publishing Institute: Basel, Switzerland, 2017. [Google Scholar]
  7. Chuvieco, E.; Mouillot, F.; van der Werf, G.R.; San Miguel, J.; Tanase, M.; Koutsias, N.; García, M.; Yebra, M.; Padilla, M.; Gitas, I. Historical background and current developments for mapping burned area from satellite Earth observation. Remote Sens. Environ. 2019, 225, 45–64. [Google Scholar] [CrossRef]
  8. Li, F.; Zhang, X.; Roy, D.P.; Kondragunta, S. Estimation of biomass-burning emissions by fusing the fire radiative power retrievals from polar-orbiting and geostationary satellites across the conterminous United States. Atmos. Environ. 2019, 211, 274–287. [Google Scholar] [CrossRef]
  9. Xu, W.; Wooster, M.J.; Kaneko, T.; He, J.; Zhang, T.; Fisher, D. Major advances in geostationary fire radiative power (FRP) retrieval over Asia and Australia stemming from use of Himarawi-8 AHI. Remote Sens. Environ. 2017, 193, 138–149. [Google Scholar] [CrossRef] [Green Version]
  10. Kaufman, Y.J.; Justice, C.O.; Flynn, L.P.; Kendall, J.D.; Prins, E.M.; Giglio, L.; Ward, D.E.; Menzel, W.P.; Setzer, A.W. Potential global fire monitoring from EOS-MODIS. J. Geophys. Res. Atmos. 1998, 103, 32215–32238. [Google Scholar] [CrossRef]
  11. Wooster, M.; Zhukov, B.; Oertel, D. Fire radiative energy for quantitative study of biomass burning: Derivation from the BIRD experimental satellite and comparison to MODIS fire products. Remote Sens. Environ. 2003, 86, 83–107. [Google Scholar] [CrossRef]
  12. Loboda, T.; Csiszar, I. Reconstruction of fire spread within wildland fire events in Northern Eurasia from the MODIS active fire product. Glob. Planet. Chang. 2007, 56, 258–273. [Google Scholar] [CrossRef]
  13. Ribeiro, N.; Ruecker, G.; Govender, N.; Macandza, V.; Pais, A.; Machava, D.; Chauque, A.; Lisboa, S.N.; Bandeira, R. The influence of fire frequency on the structure and botanical composition of savanna ecosystems. Ecol. Evol. 2019, 9, 8253–8264. [Google Scholar] [CrossRef] [PubMed]
  14. Vadrevu, K.P.; Csiszar, I.; Ellicott, E.; Giglio, L.; Badarinath, K.; Vermote, E.; Justice, C. Hotspot analysis of vegetation fires and intensity in the Indian region. IEEE J. Sel. Top. Appl. Earth Obs. Remote Sens. 2012, 6, 224–238. [Google Scholar] [CrossRef]
  15. Peterson, D.; Hyer, E.; Wang, J. Quantifying the potential for high-altitude smoke injection in the North American boreal forest using the standard MODIS fire products and subpixel-based methods. J. Geophys. Res. Atmos. 2014, 119, 3401–3419. [Google Scholar] [CrossRef]
  16. Heward, H.; Smith, A.M.; Roy, D.P.; Tinkham, W.T.; Hoffman, C.M.; Morgan, P.; Lannom, K.O. Is burn severity related to fire intensity? Observations from landscape scale remote sensing. Int. J. Wildland Fire 2013, 22, 910–918. [Google Scholar] [CrossRef]
  17. Sparks, A.M.; Kolden, C.A.; Smith, A.M.; Boschetti, L.; Johnson, D.M.; Cochrane, M.A. Fire intensity impacts on post-fire temperate coniferous forest net primary productivity. Biogeosciences 2018, 15, 1173. [Google Scholar] [CrossRef] [Green Version]
  18. Fu, Y.; Li, R.; Huang, J.; Bergeron, Y.; Fu, Y.; Wang, Y.; Gao, Z. Satellite-Observed Impacts of Wildfires on Regional Atmosphere Composition and the Shortwave Radiative Forcing: A Multiple Case Study. J. Geophys. Res. Atmos. 2018, 123, 8326–8343. [Google Scholar] [CrossRef]
  19. Ichoku, C.; Ellison, L. Global top-down smoke-aerosol emissions estimation using satellite fire radiative power measurements. Atmos. Chem. Phys. 2014, 14, 6643–6667. [Google Scholar] [CrossRef] [Green Version]
  20. Kaiser, J.; Heil, A.; Andreae, M.; Benedetti, A.; Chubarova, N.; Jones, L.; Morcrette, J.-J.; Razinger, M.; Schultz, M.; Suttie, M. Biomass burning emissions estimated with a global fire assimilation system based on observed fire radiative power. Biogeosciences 2012, 9, 527. [Google Scholar] [CrossRef] [Green Version]
  21. Wooster, M.J.; Roberts, G.; Perry, G.; Kaufman, Y. Retrieval of biomass combustion rates and totals from fire radiative power observations: FRP derivation and calibration relationships between biomass consumption and fire radiative energy release. J. Geophys. Res. Atmos. 2005, 110. [Google Scholar] [CrossRef]
  22. Ichoku, C.; Kaufman, Y.J. A method to derive smoke emission rates from MODIS fire radiative energy measurements. IEEE Trans. Geosci. Remote Sens. 2005, 43, 2636–2649. [Google Scholar] [CrossRef]
  23. Mebust, A.; Cohen, R.C. Space-based observations of fire NOx emission coefficients: A global biome-scale comparison. Atmos. Chem. Phys 2014, 14, 2509–2524. [Google Scholar] [CrossRef] [Green Version]
  24. Mebust, A.; Russell, A.; Hudman, R.; Valin, L.; Cohen, R. Characterization of wildfire NOx emissions using MODIS fire radiative power and OMI tropospheric NO2 columns. Atmos. Chem. Phys. 2011, 11, 5839. [Google Scholar] [CrossRef] [Green Version]
  25. Schreier, S.F.; Richter, A.; Kaiser, J.W.; Burrows, J. The empirical relationship between satellite-derived tropospheric NO2 and fire radiative power and possible implications for fire emission rates of NOx. Atmos. Chem. Phys. 2014, 14, 2447–2466. [Google Scholar] [CrossRef] [Green Version]
  26. Freeborn, P.H.; Wooster, M.J.; Roy, D.P.; Cochrane, M.A. Quantification of MODIS fire radiative power (FRP) measurement uncertainty for use in satellite-based active fire characterization and biomass burning estimation. Geophys. Res. Lett. 2014, 41, 1988–1994. [Google Scholar] [CrossRef]
  27. Zhang, T.; de Jong, M.C.; Wooster, M.J.; Xu, W.; Wang, L. New eastern China agricultural burning fire emission inventory and trends analysis from combined geostationary (Himawari-8) and polar-orbiting (VIIRS-IM) fire radiative power products. Atmos. Chem. Phys. Discuss. 2020, 1–30, accepted. [Google Scholar]
  28. Freeborn, P.H.; Cochrane, M.A.; Wooster, M.J. A decade long, multi-scale map comparison of fire regime parameters derived from three publically available satellite-based fire products: A case study in the Central African Republic. Remote Sens. 2014, 6, 4061–4089. [Google Scholar] [CrossRef] [Green Version]
  29. Schroeder, W. Visible Infrared Imaging Radiometer Suite (VIIRS) 375 m & 750 m Active Fire Detection Data Sets Based on Nasa VIIRS Land Science Investigator Processing System (SIPS) Reprocessed Data-Version 1, NASA. 2017. Available online: https://lpdaac.usgs.gov/documents/132/VNP14_User_Guide_v1.3.pdf (accessed on 17 January 2020).
  30. Schroeder, W.; Oliva, P.; Giglio, L.; Csiszar, I.A. The New VIIRS 375 m active fire detection data product: Algorithm description and initial assessment. Remote Sens. Environ. 2014, 143, 85–96. [Google Scholar] [CrossRef]
  31. Csiszar, I.; Schroeder, W.; Giglio, L.; Ellicott, E.; Vadrevu, K.P.; Justice, C.O.; Wind, B. Active fires from the Suomi NPP Visible Infrared Imaging Radiometer Suite: Product status and first evaluation results. J. Geophys. Res. Atmos. 2014, 119, 803–816. [Google Scholar] [CrossRef]
  32. Giglio, L.; Schroeder, W.; Justice, C.O. The collection 6 MODIS active fire detection algorithm and fire products. Remote Sens. Environ. 2016, 178, 31–41. [Google Scholar] [CrossRef] [Green Version]
  33. Schroeder, W.; Giglio, L. Visible Infrared Imaging Radiometer Suite (VIIRS) 375 m Active Fire Detection and Characterization Algorithm Theoretical Basis Document; University of Maryland: Washington, DC, USA, 2016. [Google Scholar]
  34. Li, F.; Zhang, X.; Kondragunta, S.; Csiszar, I. Comparison of fire radiative power estimates from VIIRS and MODIS observations. J. Geophys. Res. Atmos. 2018, 123, 4545–4563. [Google Scholar]
  35. Wolfe, R.E.; Lin, G.; Nishihama, M.; Tewari, K.P.; Tilton, J.C.; Isaacman, A.R. Suomi NPP VIIRS prelaunch and on-orbit geometric calibration and characterization. J. Geophys. Res. Atmos. 2013, 118, 11508–11521. [Google Scholar] [CrossRef] [Green Version]
  36. Zhang, T.; Wooster, M.J.; Xu, W. Approaches for synergistically exploiting VIIRS I-and M-Band data in regional active fire detection and FRP assessment: A demonstration with respect to agricultural residue burning in Eastern China. Remote Sens. Environ. 2017, 198, 407–424. [Google Scholar] [CrossRef] [Green Version]
  37. Liu, T.; Marlier, M.E.; Karambelas, A.; Jain, M.; Singh, S.; Singh, M.K.; Gautam, R.; DeFries, R.S. Missing emissions from post-monsoon agricultural fires in northwestern India: Regional limitations of MODIS burned area and active fire products. Environ. Res. Commun. 2019, 1, 011007. [Google Scholar] [CrossRef]
  38. Vadrevu, K.; Lasko, K. Intercomparison of MODIS AQUA and VIIRS I-Band fires and emissions in an agricultural landscape—Implications for air pollution research. Remote Sens. 2018, 10, 978. [Google Scholar] [CrossRef] [PubMed] [Green Version]
  39. Vadrevu, K.P.; Lasko, K.; Giglio, L.; Schroeder, W.; Biswas, S.; Justice, C. Trends in vegetation fires in south and Southeast Asian countries. Sci. Rep. 2019, 9, 1–13. [Google Scholar] [CrossRef]
  40. Fang, L.; Yang, J.; Zu, J.; Li, G.; Zhang, J. Quantifying influences and relative importance of fire weather, topography, and vegetation on fire size and fire severity in a Chinese boreal forest landscape. For. Ecol. Manag. 2015, 356, 2–12. [Google Scholar] [CrossRef]
  41. Giglio, L.; Descloitres, J.; Justice, C.O.; Kaufman, Y.J. An enhanced contextual fire detection algorithm for MODIS. Remote Sens. Environ. 2003, 87, 273–282. [Google Scholar] [CrossRef]
  42. ESA. Land Cover CCI Product User Guide Version 2. Tech. Rep. 2017. Available online: Maps.elie.ucl.ac.be/CCI/viewer/download/ESACCI-LC-Ph2-PUGv2_2.0.pdf (accessed on 18 May 2020).
  43. Tian, X.-R.; Shu, L.-F.; Zhao, F.-J.; Wang, M.-Y.; McRae, D.J. Future impacts of climate change on forest fire danger in northeastern China. J. For. Res. 2011, 22, 437. [Google Scholar] [CrossRef]
  44. Song, Y.; Liu, B.; Miao, W.; Chang, D.; Zhang, Y. Spatiotemporal variation in nonagricultural open fire emissions in China from 2000 to 2007. Glob. Biogeochem. Cycles 2009, 23. [Google Scholar] [CrossRef]
  45. Huang, X.; Li, M.; Li, J.; Song, Y. A high-resolution emission inventory of crop burning in fields in China based on MODIS Thermal Anomalies/Fire products. Atmos. Environ. 2012, 50, 9–15. [Google Scholar] [CrossRef]
  46. Bertschi, I.T.; Jaffe, D.A. Long-range transport of ozone, carbon monoxide, and aerosols to the NE Pacific troposphere during the summer of 2003: Observations of smoke plumes from Asian boreal fires. J. Geophys. Res. Atmos. 2005, 110. [Google Scholar] [CrossRef]
  47. Goldammer, J.G.; Statheropoulos, M.; Andreae, M.O. Impacts of vegetation fire emissions on the environment, human health, and security: A global perspective. Dev. Environ. Sci. 2008, 8, 3–36. [Google Scholar]
  48. Cahoon, D.R., Jr.; Stocks, B.J.; Levine, J.S.; Cofer, W.R., III; Pierson, J.M. Satellite analysis of the severe 1987 forest fires in northern China and southeastern Siberia. J. Geophys. Res. Atmos. 1994, 99, 18627–18638. [Google Scholar] [CrossRef] [Green Version]
  49. Giglio, L.; Schroeder, W.; Hall, J.V.; Justice, C.O. MODIS Collection 6 Active Fire Product User’s Guide Revision B. 2018. Available online: http://modis-fire.umd.edu/files/MODIS_C6_Fire_User_Guide_B.pdf (accessed on 17 January 2020).
  50. Wolfe, R.E.; Nishihama, M.; Fleig, A.J.; Kuyper, J.A.; Roy, D.P.; Storey, J.C.; Patt, F.S. Achieving sub-pixel geolocation accuracy in support of MODIS land science. Remote Sens. Environ. 2002, 83, 31–49. [Google Scholar] [CrossRef]
  51. MODIS Characterization Support Team (MCST). MODIS Geolocation Fields Product; NASA MODIS Adaptive Processing System, Goddard Space Flight Center: Greenbelt, MD, USA, 2017. [Google Scholar] [CrossRef]
  52. Goddard Space Flight Center (GSFC). VIIRS Geolocation Fields Product. 2017. Available online: https://ladsweb.modaps.eosdis.nasa.gov/ (accessed on 7 October 2018).
  53. Long, T.; Zhang, Z.; He, G.; Jiao, W.; Tang, C.; Wu, B.; Zhang, X.; Wang, G.; Yin, R. 30 m Resolution Global Annual Burned Area Mapping Based on Landsat Images and Google Earth Engine. Remote Sens. 2019, 11, 489. [Google Scholar] [CrossRef] [Green Version]
  54. C3SCDS. 2019. Available online: https://cds.climate.copernicus.eu/ (accessed on 18 May 2020).
  55. Sharma, A.; Wang, J.; Lennartson, E.M. Intercomparison of MODIS and VIIRS fire products in Khanty-Mansiysk Russia: Implications for characterizing gas flaring from space. Atmosphere 2017, 8, 95. [Google Scholar] [CrossRef] [Green Version]
  56. Liu, Y.Y.; Van Dijk, A.I.; De Jeu, R.A.; Canadell, J.G.; McCabe, M.F.; Evans, J.P.; Wang, G. Recent reversal in loss of global terrestrial biomass. Nat. Clim. Chang. 2015, 5, 470–474. [Google Scholar] [CrossRef]
  57. Ordóñez, J.; de Jong, B.H.; García-Oliva, F.; Aviña, F.; Pérez, J.V.; Guerrero, G.; Martínez, R.; Masera, O. Carbon content in vegetation, litter, and soil under 10 different land-use and land-cover classes in the Central Highlands of Michoacan, Mexico. For. Ecol. Manag. 2008, 255, 2074–2084. [Google Scholar] [CrossRef]
  58. Randerson, J.; Chen, Y.; Van Der Werf, G.; Rogers, B.; Morton, D. Global burned area and biomass burning emissions from small fires. J. Geophys. Res. Biogeosci. 2012, 117. [Google Scholar] [CrossRef]
  59. Hoelzemann, J.J.; Schultz, M.G.; Brasseur, G.P.; Granier, C.; Simon, M. Global Wildland Fire Emission Model (GWEM): Evaluating the use of global area burnt satellite data. J. Geophys. Res. Atmos. 2004, 109. [Google Scholar] [CrossRef]
  60. Kganyago, M.; Shikwambana, L. Assessment of the Characteristics of Recent Major Wildfires in the USA, Australia and Brazil in 2018–2019 Using Multi-Source Satellite Products. Remote Sens. 2020, 12, 1803. [Google Scholar] [CrossRef]
  61. Kganyago, M.; Shikwambana, L. Assessing spatio-temporal variability of wildfires and their impact on sub-Saharan ecosystems and air quality using multisource remotely sensed data and trend analysis. Sustainability 2019, 11, 6811. [Google Scholar] [CrossRef] [Green Version]
  62. Schroeder, W.; Prins, E.; Giglio, L.; Csiszar, I.; Schmidt, C.; Morisette, J.; Morton, D. Validation of GOES and MODIS active fire detection products using ASTER and ETM+ data. Remote Sens. Environ. 2008, 112, 2711–2726. [Google Scholar] [CrossRef]
  63. Elvidge, C.D.; Zhizhin, M.; Hsu, F.-C.; Baugh, K.E. VIIRS nightfire: Satellite pyrometry at night. Remote Sens. 2013, 5, 4423–4449. [Google Scholar] [CrossRef] [Green Version]
  64. Kumar, S.S.; Hult, J.; Picotte, J.; Peterson, B. Potential Underestimation of Satellite Fire Radiative Power Retrievals over Gas Flares and Wildland Fires. Remote Sens. 2020, 12, 238. [Google Scholar] [CrossRef] [Green Version]
  65. Oliva, P.; Schroeder, W. Atmospheric correction of VIIRS and MODIS fire radiative power retrievals for multi-sensor comparison. In Proceedings of the 2015 IEEE International Geoscience and Remote Sensing Symposium (IGARSS), Milan, Italy, 26–31 July 2015; pp. 2038–2040. [Google Scholar]
  66. Madhavan, S.; Brinkmann, J.; Wenny, B.N.; Wu, A.; Xiong, X. Evaluation of VIIRS and MODIS thermal emissive band calibration stability using ground target. Remote Sens. 2016, 8, 158. [Google Scholar] [CrossRef] [Green Version]
  67. Peterson, D.; Wang, J.; Ichoku, C.; Hyer, E.; Ambrosia, V. A sub-pixel-based calculation of fire radiative power from MODIS observations: 1: Algorithm development and initial assessment. Remote Sens. Environ. 2013, 129, 262–279. [Google Scholar] [CrossRef]
  68. Schroeder, W.; Csiszar, I.; Giglio, L.; Schmidt, C.C. On the use of fire radiative power, area, and temperature estimates to characterize biomass burning via moderate to coarse spatial resolution remote sensing data in the Brazilian Amazon. J. Geophys. Res. Atmos. 2010, 115. [Google Scholar] [CrossRef] [Green Version]
  69. Skakun, S.; Justice, C.O.; Vermote, E.; Roger, J.-C. Transitioning from MODIS to VIIRS: An analysis of inter-consistency of NDVI data sets for agricultural monitoring. Int. J. Remote Sens. 2018, 39, 971–992. [Google Scholar] [CrossRef]
  70. Wei, J.; Sun, L.; Huang, B.; Bilal, M.; Zhang, Z.; Wang, L. Verification, improvement and application of aerosol optical depths in China Part 1: Inter-comparison of NPP-VIIRS and Aqua-MODIS. Atmos. Environ. 2018, 175, 221–233. [Google Scholar] [CrossRef]
  71. Dickinson, M.B.; Hudak, A.T.; Zajkowski, T.; Loudermilk, E.L.; Schroeder, W.; Ellison, L.; Kremens, R.L.; Holley, W.; Martinez, O.; Paxton, A. Measuring radiant emissions from entire prescribed fires with ground, airborne and satellite sensors–RxCADRE 2012. Int. J. Wildland Fire 2016, 25, 48–61. [Google Scholar] [CrossRef] [Green Version]
Figure 1. Example of duplicate fire detection correction of the Moderate Resolution Imaging Spectroradiometer (MODIS) 1-km fire product (left panel) and Visible Infrared Imaging Radiometer Suite (VIIRS) 375-m fire product (right panel). The example was detected by MODIS at 04:25 (UTC) and VIIRS at 04:24 (UTC) on 6 November 2015 in the study region. (a,b) False-color images overlaid with original detected fire pixels (footprints shown in red quadrangles) in the MODIS and VIIRS fire products, respectively. The background false-color images in (a,b) were composited using the MODIS 500-m reflectance at bands 7, 2, and 4 observed at 04:25 UTC, with mosaics in orange and red showing active surface fires; the white rectangles in the false-color images delineate regions shown in the panels below; (c,e) are the MODIS 1-km fire detections and the correction after removing the duplicate fire detections, respectively; the red quadrangles and dots inside are the boundary and center of the MODIS 1-km fire pixels; the blue and black quadrangles present the MODIS 1-km non-fire pixel footprints from the prior and subsequent scans, respectively; (d,f) are similar to (c,e) but for the VIIRS 375-m fire product.
Remotesensing 12 02870 g001
Figure 2. Composited RGB (Red, Green, Blue) true-color images overlaid with fire locations (red dots) of the fire case in Northeast Asia: (a) MODIS on 6 November 2015 (04:25 UTC); (b) VIIRS on 6 November 2015 (04:24 UTC).
Remotesensing 12 02870 g002
Figure 3. Scatter plot of MODIS fire-pixel fire radiative power (FRP) versus the paired VIIRS FRP (sum FRP of the co-located VIIRS fire pixels inside a MODIS fire pixel) for the fire case in Northeast Asia. K is the fitted slope of the linear least-squares regression; R is the Pearson correlation coefficient; and N is the number of MODIS fire pixels that have co-located VIIRS fire detections. RMSE is the root mean square error of the MODIS fire-pixel FRP and VIIRS paired FRP.
Remotesensing 12 02870 g003
Figure 4. Proportions of (a) MODIS fire pixels with and without co-located VIIRS fire detections; (b) VIIRS fire pixels with and without co-located MODIS fire detections for the three broad cover categories: low-biomass lands, forests, and all land cover types (including low-biomass lands, forests, and all other cover types such as shrublands). The number of fire pixels is shown in parentheses.
Remotesensing 12 02870 g004
Figure 5. Number of fire pixels detected (red) and undetected (blue) by Landsat 30-m burned area along with fire pixel FRP. (ac) results of MODIS fire detections over the broad cover categories of all land-cover types, low-biomass lands; and forests, respectively. (df) are same as that of (ac) but for the VIIRS fire detections.
Remotesensing 12 02870 g005
Figure 6. Commission errors of MODIS (blue) and VIIRS (red) for (a) all land-cover types; (b) low-biomass lands; (c) forests.
Remotesensing 12 02870 g006
Figure 7. Spatial distribution of total FRP over 2012–2017 in Northeast Asia at 0.25° resolution: (a) MODIS; (b) VIIRS; (c) Delta FRP (VIIRS minus MODIS); (d) VIIRS-to-MODIS FRP ratio; (e) land cover type shown in 2015.
Remotesensing 12 02870 g007
Figure 8. Cumulative sum of VIIRS FRP (%), expressed as function of the per-grid cell VIIRS-to-MODIS FRP ratio.
Remotesensing 12 02870 g008
Figure 9. Monthly time series of the total FRP of MODIS (blue curves) and VIIRS (red curves). The left panel shows the total FRP from all detected fires in fire product; the right panel shows the total FRP from concurrently detected fires. (a,b) all land cover types; (c,d) low-biomass lands; (e,f) forests.
Remotesensing 12 02870 g009
Figure 10. Scatter plots of the monthly total FRP of VIIRS versus MODIS. (a) all land cover types, (b) low-biomass lands, (c) forests. Black dots are the monthly total FRP summed from all detected fires in fire products; blue dots are the monthly total FRP summed from concurrently detected fires.
Remotesensing 12 02870 g010
Table 1. Specifications of products and data applied in this study.
Products/DataMajor Information UsedSpatial ResolutionTemporal ResolutionPeriodPlatform/SourceData Available From
MYD14 [49]Fire pixel location; FRP1 km5 min2012–2017Aqua MODIShttps://ladsweb.modaps.eosdis.nasa.gov/
MYD03 [51]Geolocation1 km5 min2012–2017Aqua MODIS
VNP14IMG [30]Fire pixel location; FRP375 m6 min2012–2017SNPP VIIRS
VNP03IMGLL [52]Geolocation375 m6 min2012–2017SNPP VIIRS
Annual Global Land Cover [42,54]Land cover type300 mAnnual2012–2017C3S CDShttps://cds.climate.copernicus.eu/
GABAM 2015 [53]Burned area30 mAnnual2015Landsathttps://vapd.gitlab.io/post/gabam2015/

