Article

Carbon Dynamics in a Human-Modified Tropical Forest: A Case Study Using Multi-Temporal LiDAR Data

by
Yhasmin Mendes de Moura
1,*,
Heiko Balzter
1,2,
Lênio S. Galvão
3,
Ricardo Dalagnol
3,
Fernando Espírito-Santo
1,
Erone G. Santos
4,
Mariano Garcia
5,
Polyanna da Conceição Bispo
6,
Raimundo C. Oliveira
7 and
Yosio E. Shimabukuro
3
1
Centre for Landscape and Climate Research, School of Geography, Geology and Environment, University of Leicester, Leicester LE1 7RH, UK
2
National Centre for Earth Observation, University of Leicester, Leicester LE1 7RH, UK
3
National Institute for Space Research, Remote Sensing Division, São José dos Campos SP 12245-970, Brazil
4
Department of Geosciences and Geography Helsinki Institute of Sustainability Science (HELSUS), University of Helsinki, PL64, Gustaf Hällströmin katu 2, FI-00014 Helsinki, Finland
5
Environmental Remote Sensing Research Group, Department of Geology, Geography and the Environment, Universidad de Alcalá. Calle Colegios 2, 28801 Alcalá de Henares, Spain
6
Department of Geography, School of Environment, Education and Development, University of Manchester, Oxford Rd, Manchester M13 9PL, UK
7
Empresa Brasileira de Pesquisa Agropecuária (EMBRAPA), Centro de Pesquisa Agroflorestal da Amazônia Oriental, Belém PA 66095-903, Brazil
*
Author to whom correspondence should be addressed.
Remote Sens. 2020, 12(3), 430; https://doi.org/10.3390/rs12030430
Submission received: 18 December 2019 / Revised: 17 January 2020 / Accepted: 21 January 2020 / Published: 29 January 2020
(This article belongs to the Special Issue Forest Biomass and Carbon Observation with Remote Sensing)

Abstract

:
Tropical forests hold significant amounts of carbon and play a critical role on Earth´s climate system. To date, carbon dynamics over tropical forests have been poorly assessed, especially over vast areas of the tropics that have been affected by some type of disturbance (e.g., selective logging, understory fires, and fragmentation). Understanding the multi-temporal dynamics of carbon stocks over human-modified tropical forests (HMTF) is crucial to close the carbon cycle balance in the tropics. Here, we used multi-temporal and high-spatial resolution airborne LiDAR data to quantify rates of carbon dynamics over a large patch of HMTF in eastern Amazon, Brazil. We described a robust approach to monitor changes in aboveground forest carbon stocks between 2012 and 2018. Our results showed that this particular HMTF lost 0.57 m·yr−1 in mean forest canopy height and 1.38 Mg·C·ha−1·yr−1 of forest carbon between 2012 and 2018. LiDAR-based estimates of Aboveground Carbon Density (ACD) showed progressive loss through the years, from 77.9 Mg·C·ha−1 in 2012 to 53.1 Mg·C·ha−1 in 2018, thus a decrease of 31.8%. Rates of carbon stock changes were negative for all time intervals analyzed, yielding average annual carbon loss rates of −1.34 Mg·C·ha−1·yr−1. This suggests that this HMTF is acting more as a source of carbon than a sink, having great negative implications for carbon emission scenarios in tropical forests. Although more studies of forest dynamics in HMTFs are necessary to reduce the current remaining uncertainties in the carbon cycle, our results highlight the persistent effects of carbon losses for the study area. HMTFs are likely to expand across the Amazon in the near future. The resultant carbon source conditions, directly associated with disturbances, may be essential when considering climate projections and carbon accounting methods.

Graphical Abstract

1. Introduction

Tropical forests play a significant role in the global carbon cycle [1] and biodiversity functioning of our planet [2]. However, in the Brazilian Amazon, high levels of anthropogenic disturbances, such as deforestation, fragmentation, logging, and fires, are changing the terrestrial carbon cycle of these forests from sink to sources of carbon [3]. Furthermore, the ongoing exposure of tropical ecosystems to anthropogenic disturbances has significant consequences to biodiversity [4]. Consequently, there are substantial concerns about the future of tropical forests as a component of the global climate system. The comprehension of the carbon dynamics, in response to human-modified tropical forests (HMTF), defined here as a result from various types of human disturbance (e.g., selective logging, understory fires, and fragmentation), is therefore one of the greatest challenges of the 21st century.
Forest degradation caused by anthropogenic activities can have a strong impact on the carbon budget of tropical forest ecosystems [5]. The United Nations Framework Convention on Climate Change (UNFCC) has added and specifically addressed the importance of carbon emissions derived from forest degradation, considering mechanisms, such as Reducing Emissions from Deforestation and Forest Degradation (REDD+), on national inventories of greenhouse gas emissions and removals. While intact tropical forests appear to be a net carbon sink [6], inventory plot-based studies suggest that HMTF contributes as a net source. For instance, in the Brazilian Amazon, approximately 40% of the gross carbon emissions are associated with forest degradation of HMTF [4]. Forest degradation has been reported in the literature as a significant contributor to carbon emissions [4,7,8,9]. However, it is rarely accounted for in national and international emissions inventories. This is especially due to the challenges associated with the monitoring of forest degradation and to the lack of an internationally accepted definition that could build on a framework for an operational approach [10].
Persistent effects of forest degradation have been also mentioned in the literature, such as tree mortality accelerated by human activities [11], diminished growth by stress due to droughts [12] and recurrence of fires [13]. As a result, there is a great reduction in the healthy and conditions of Amazonian forests [14]. Therefore, improving our understanding of HMTF carbon dynamics is necessary in order to close the carbon cycle balance in the tropics.
Deforestation rates have declined in the past years, while forest degradation is still poorly quantified [15,16]. Official estimates of forest degradation in the Brazilian Amazon indicate that the total forest degradation almost doubled in area from 15,983 km2 in 2007 to 27,370 km2 in 2016 [17]. Recent results have shown that degraded forests contain 45% of the carbon stocks of intact forests [9]. The magnitude of carbon losses from forest degradation is large with impact on carbon stocks from 4%–22% (selective logging) and 60%–65% (fires) when compared with intact forests [8]. A study in the central Amazon, comparing logged and burned forests, suggests that forest degradation can reduce the aboveground biomass by approximately 55% [9]. However, the mechanism that underlies the processes of forest recovery and mortality and their carbon budget is still largely unknown for HMTFs [9,18].
The process of characterization and detection of degradation of HMTF is primarily visible through changes in forest structure, reducing canopy layers from structurally diverse to degraded, single or few story systems. The major challenge in quantifying forest degradation is the lack of measurements of vegetation structure over time. Although several studies of HMTF are currently based on traditional forest inventory methods (Silva et al., 2016), small field plots fail to quantify the impact of disturbance and mortality on forest structure and carbon dynamics and the spatial variability that exists over larger regions (Clark and Clark, 2000). Remote sensing, particularly from small-footprint (<1 m) airborne laser scanning (ALS), can quantify forest structure at the scale at which forest dynamics occur. The recent availability of multi-temporal and high-spatial resolution airborne Light Detection and Ranging (LiDAR) data over the Amazon provides an excellent opportunity to assess forest degradation [19,20]. Airborne LiDAR data collected over time serve as a tool to understand the variability of carbon stocks and the dynamics over larger regions [21]. LiDAR allows the direct measurements of the three-dimensional distribution of vertical vegetation elements from ground-based [22], airborne [23], and spaceborne platforms [24].
Natural regrowth through secondary succession, i.e., the regrowth after nearly complete removal of forest cover for agricultural use [25], is of paramount importance for disturbed areas to recover. Vegetation regrowth is an important factor of the resilience of tropical forests [26]. The rapid rate of carbon sequestration through regeneration can reach up to 11 times the carbon uptake rate of old-growth forests [27]. Pristine tropical forests are well known to be a sink of atmospheric CO2 [28]. However, forest degradation can potentially affect the role of these forests leading to great losses of biomass carbon. Regardless of the decline of Amazon deforestation in recent years [15,29], forest degradation continues leading to biomass carbon losses [8,9]. This is particularly important in the tropics, where high plant productivity sustains one of the largest remaining terrestrial carbon pools of the planet [30,31].
The anthropogenic pressures and climatic changes have led to substantial concerns about the future of tropical forests as a component of the global climate system [32,33]. In addition, more frequently occurring, large-scale climatic extreme events further highlight concerns for the Amazon region [12]. These events cause not only forest degradation through tree mortality [34], but also constrain regional rainfall, increasing the vulnerability of forests to fire [13].
Recent studies have shown an increase in tree mortality in the tropics [35], which leads to several concerns when considering their role in the global carbon cycle [36]. The drivers and mechanisms that lead to tree mortality increase in the tropics are currently unknown. A better understanding of the trajectories of the carbon cycle in HMTFs is urgently needed to improve their representation in global carbon models, reduce climate model uncertainties, and increase the accuracy of predictions of vegetation changes under future climate scenarios. In addition, this knowledge will help to overcome the large uncertainties inherent in carbon-climate feedbacks [37]. It directly contributes to the improvement of the carbon balance over degraded areas in the tropics, assisting in carbon accounting under the United Nations mechanisms for REDD+ [9].
The overarching goal of this study was to quantify carbon dynamics in a HMTF using repeated airborne LiDAR data. Specifically, we aimed to (1) quantify the rates of forest growth and mortality given by carbon gains and losses; (2) determine whether the studied HMTF is acting much more as a carbon source or sink; and (3) assess the effects of sampling time intervals on measurements of LiDAR-based carbon dynamics. To do this, we studied a large fragment of HMTF (670 ha or 6.7 km2) located in the eastern Brazilian Amazon. We quantified the changes in forest structure during a 6-year period using four repeated airborne LiDAR acquisitions.

2. Materials and Methods
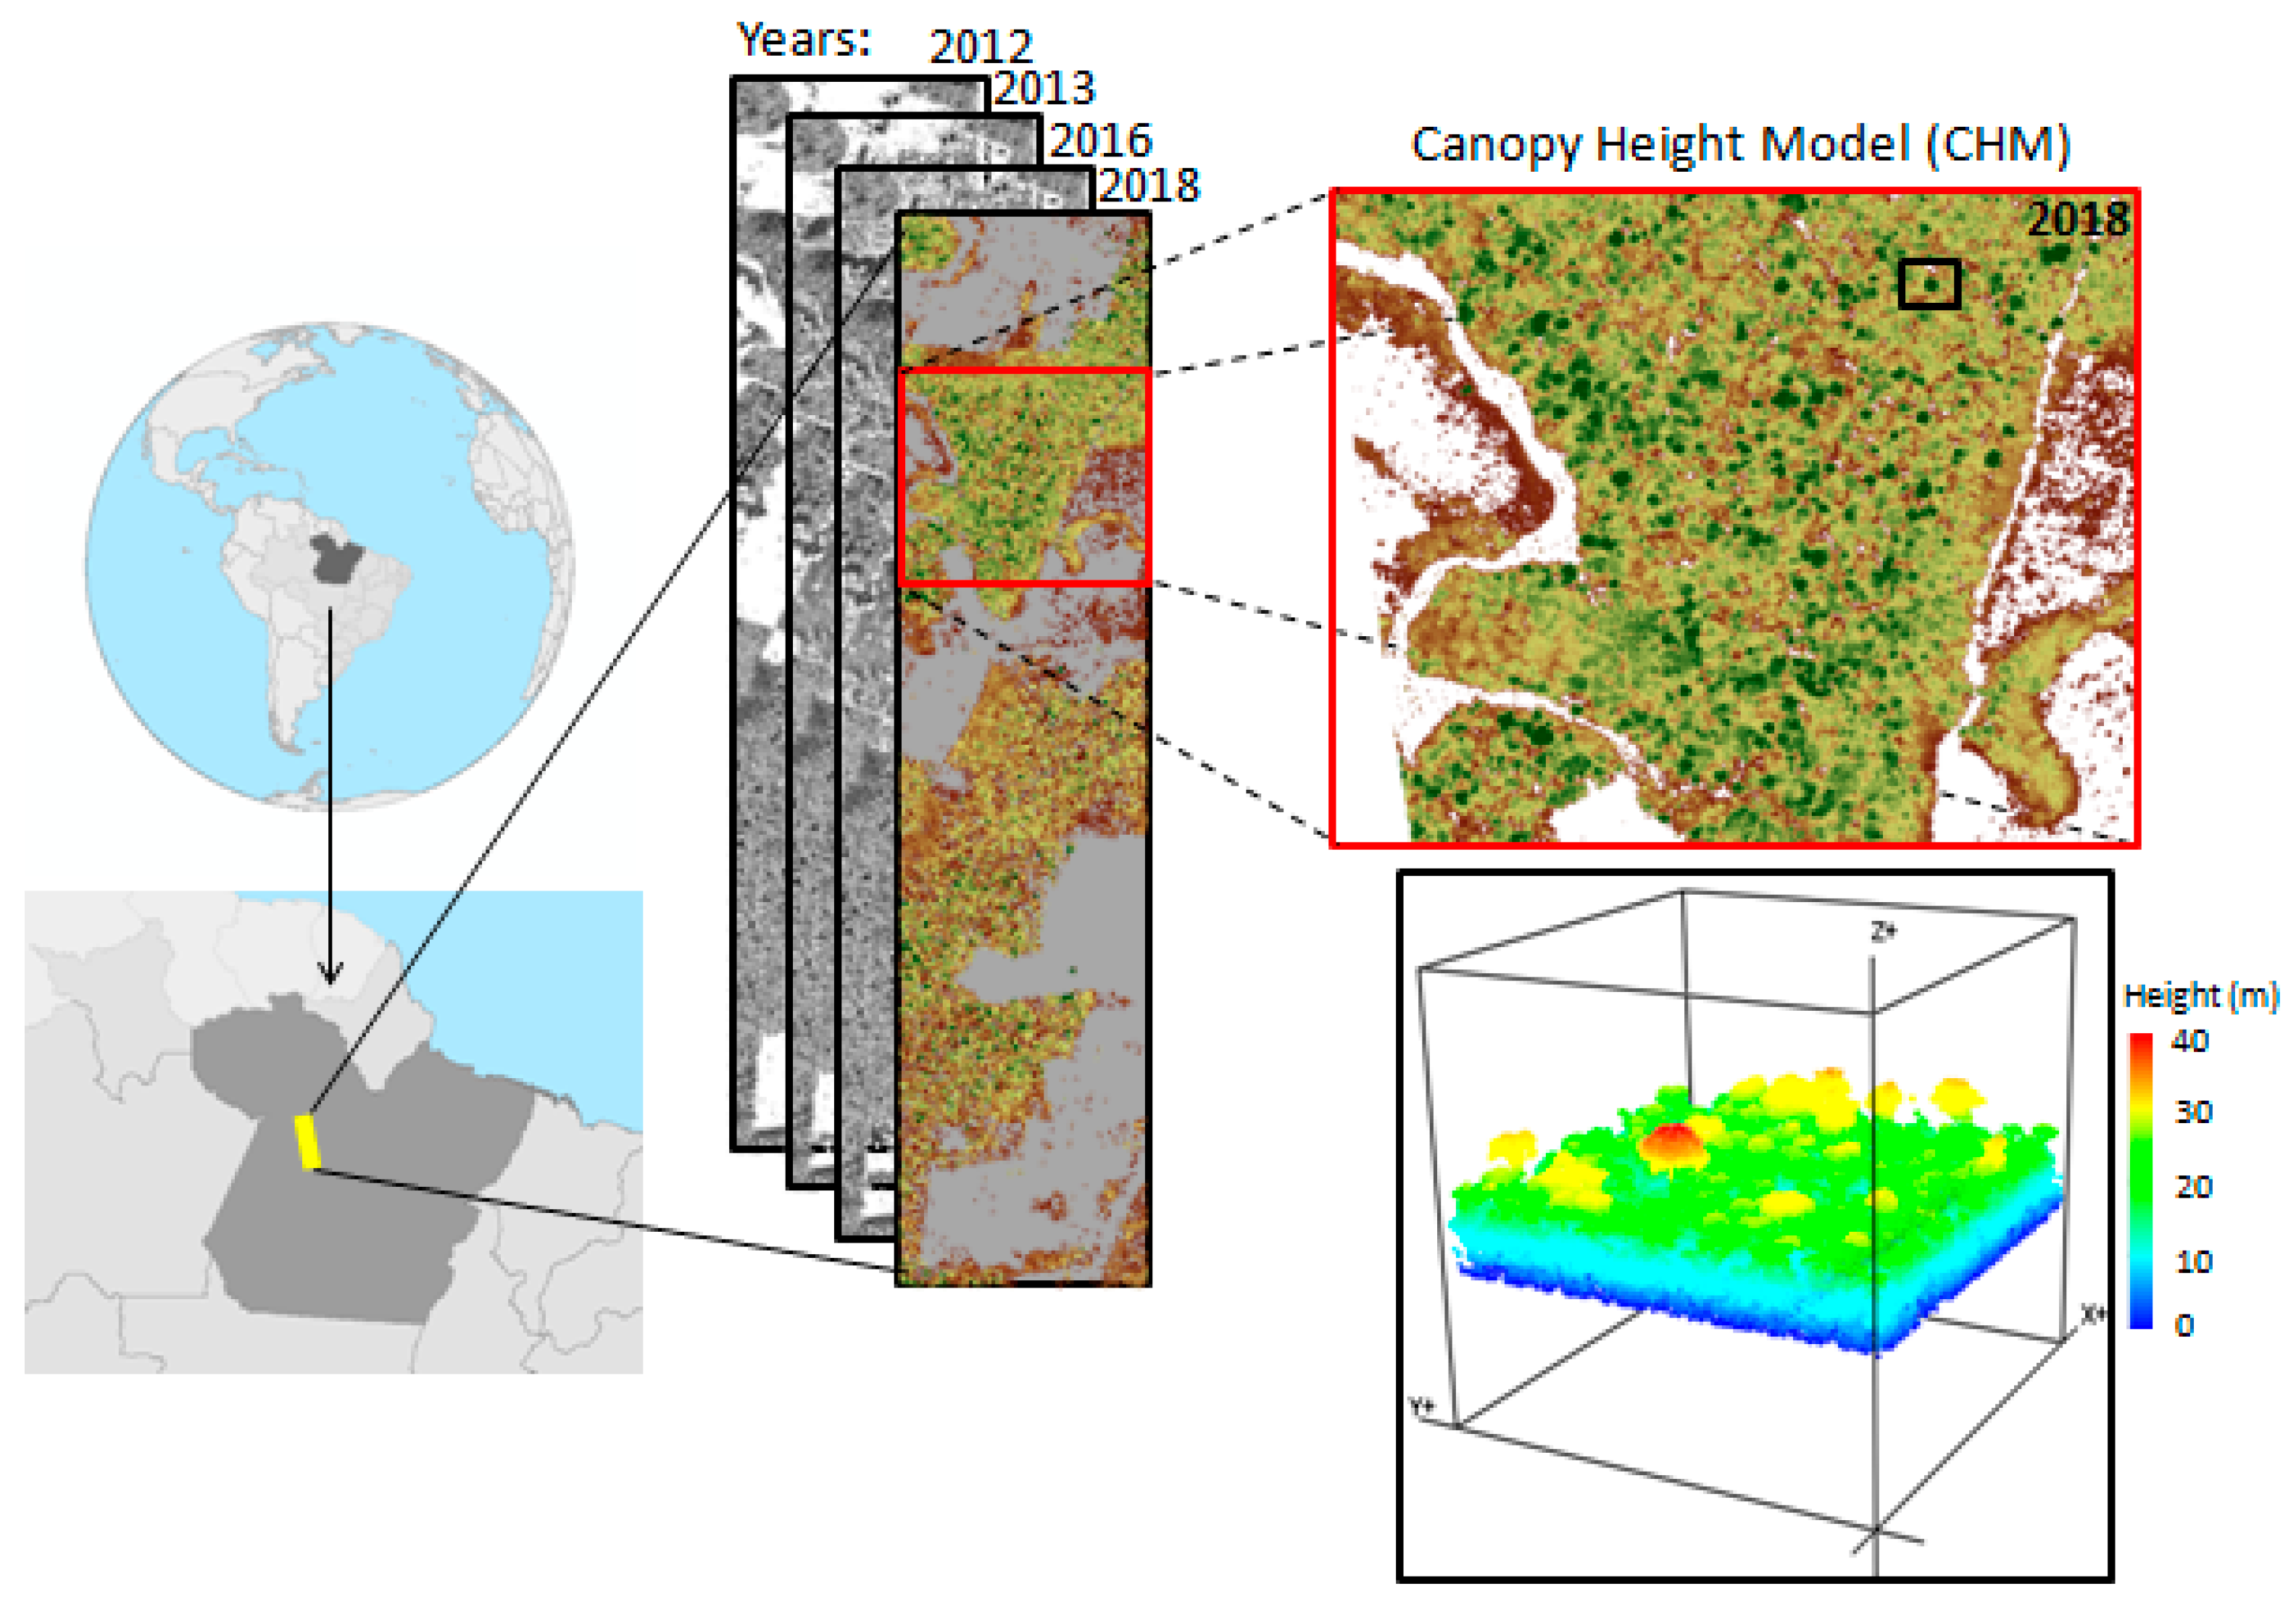
2.1. Study Area

The study area is located close to the limits of the Brazilian Tapajos National Forest, in the state of Pará, near the municipalities of Belterra and Santarém (Figure 1). The native vegetation is mainly composed of dense ombrophilous forest [38]. The region outside the park has been extensively disturbed over the years [39], including patches of secondary succession [40]. Selective logging and fires are generally observed in the study area. However, large patches of HMTFs remain in the region. The climate is tropical AmW (monsoon type with short dry season) in the Köppen classification. The duration of the dry season, defined as months with rainfall less than 100 mm or less than one third of precipitation range, is five months from July to November [41]. The mean annual temperature is 26 °C.

2.2. Airborne LiDAR Data Acquisition and Processing

We used repeated airborne LiDAR acquisitions from 2012 (30 July 2012 and 04 September 2012), 2013 (10 September 2013), 2016 (22 March 2016 and 23 March 2016), and 2018 (14 October 2018) to quantify forest structure (e.g., canopy height), carbon stocks, and related temporal changes (forest dynamics). The LiDAR campaigns were performed from a maximum flight altitude of 800 m. The acquisitions covered approximately 670 ha. The multi-temporal information on forest structure allowed for the quantification of changes in height and carbon stocks at large scale, related to processes of tree growth and mortality. The overlap of the flightlines was between 65% and 70% with a field-of-view ranging from 11° to 15°. The average laser point density, expressed by the number of laser returns in points per m2 (ppm2), was between 27 and 38.9 ppm2. ALS data were acquired by a Brazilian ALS company (GEOID Ltd) using an Altm3100/Optech laser sensor. The data were provided by United States Agency for International Development (USAID) and the Empresa Brasileira de Pesquisa Agropecuária (Embrapa) through the Sustainable Landscapes project (http://mapas.cnpm.embrapa.br/paisagenssustentaveis/).
LiDAR point cloud data were processed using LASTools version 160.905 [42] and the FUSION software [43]. Canopy Height Models (CHMs) for each flightline were built by subtracting the Digital Terrain Model (DTM) from the Digital Surface Model (DSM) at 1-m resolution using the R programming language [44]. For each year, ALS data were used as an input to the parametric Aboveground Carbon Density (ACD) model to estimate carbon stocks (Longo et al. 2016). The ACD model is based on the mean top of canopy height (CHM), producing ACD estimates (Mg·C·ha−1) of live trees in a minimum size area of 0.25 ha. The model excludes standing dead trees, which allows the comparison with pan-tropical maps [8]. As the LiDAR-derived allometric equation requires only the CHM, it allows us to directly understand the relation between forest height and carbon stocks. In order to use the CHM as an input to the model, all the CHMs were resampled to 0.25 ha grid size to match the spatial resolution of the model. ACD was calculated by Equation (1):
a = b ( c ) × d e ( f )
where a represents the Aboveground Carbon Density (ACD) estimated from the Canopy Height Model (CHM), b = 0.025, and d = CHM. Values in parentheses, c = 0.007, e = 1.99, and f = 0.08, are the standard errors for each coefficient, obtained from 1000 bootstrap iterations. Detailed information on the uncertainties of the model was described by [8]. We selected this ACD model due to its simplicity and feasible replication in other studies. Furthermore, it was developed to allow inter-comparison with other regional carbon maps [8]. In addition, to describe the randomness and uncertainty of the data, we randomly selected 1000 samples across our multi-temporal LiDAR data and evaluated whether the measure of the uncertainty was produced by random effects.

2.3. Forest Canopy Mask

The HMTF is a heterogeneous landscape covered by pristine forests, logged and burned forests, as well as open areas of deforestation and pastures. To quantify changes only over forest-covered areas, we applied a CHM threshold over each LiDAR dataset to consider only trees above 5 m in the data analysis. Therefore, this strategy removed pasture and deforested areas from the analysis, but included natural disturbances of tree-fall gaps, branch-fall, and tree mortality. These disturbances are responsible for carbon emissions in forests [45].

2.4. Changes in Carbon Stocks and Height
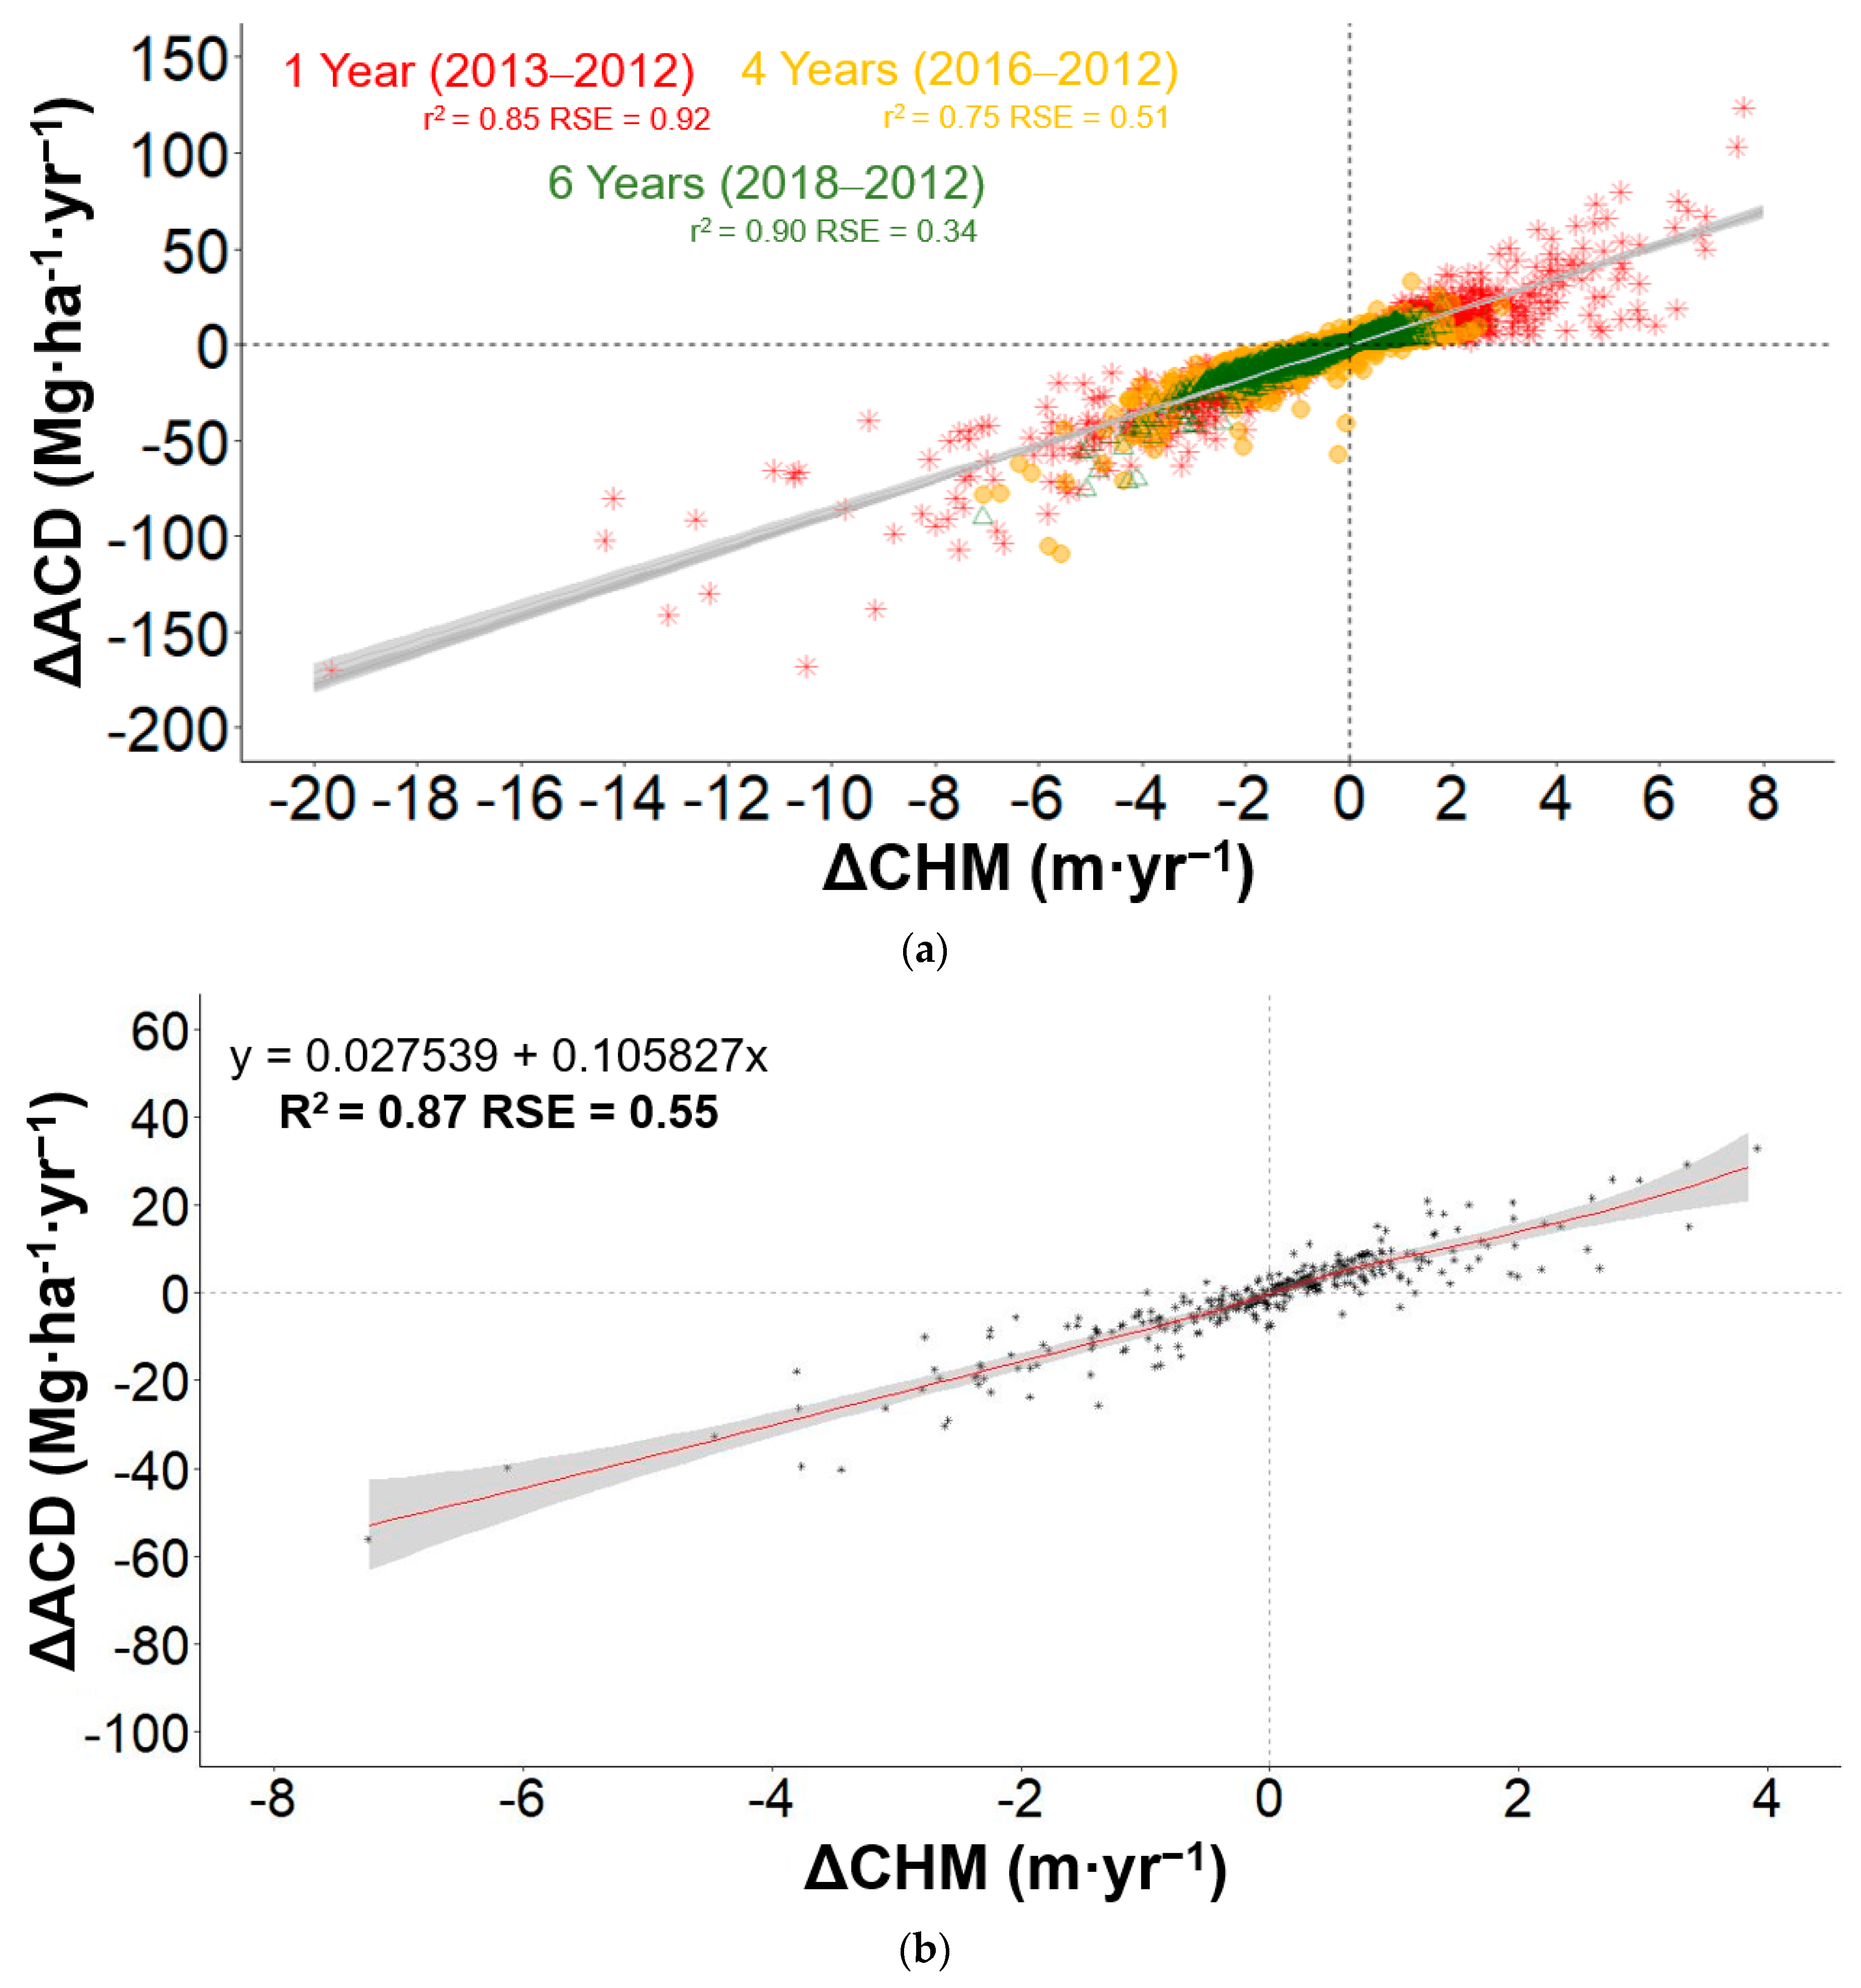
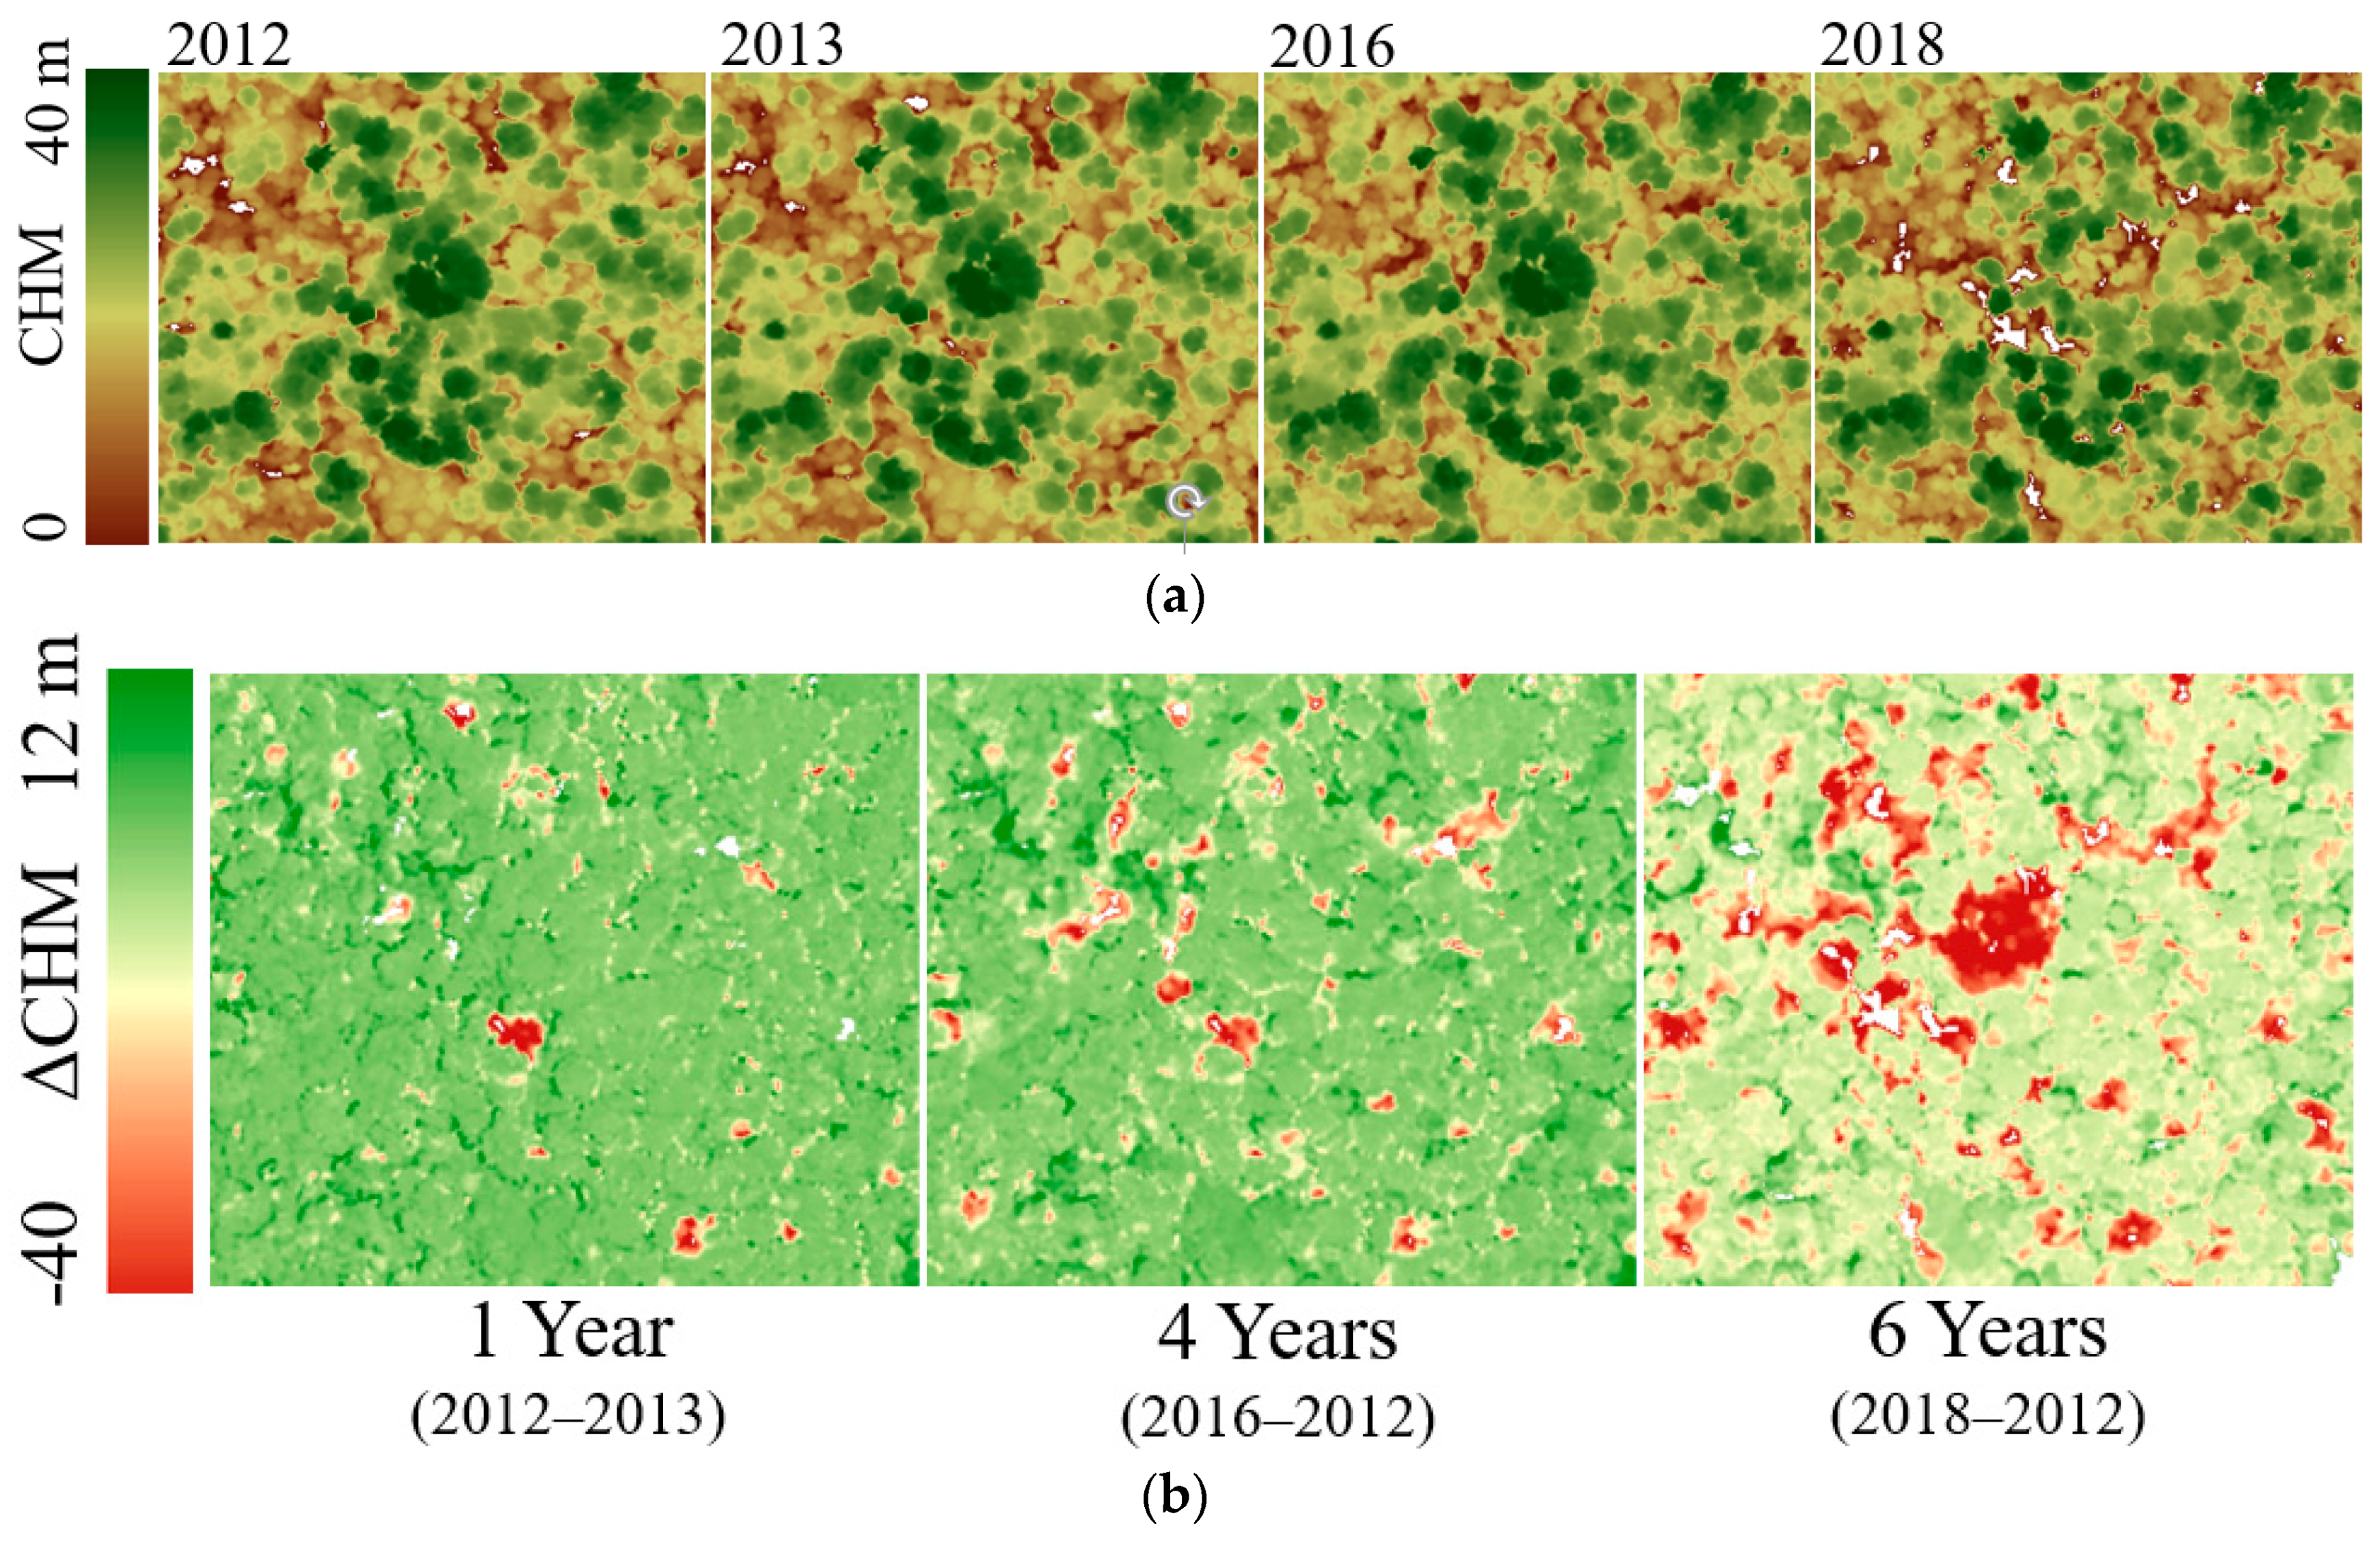
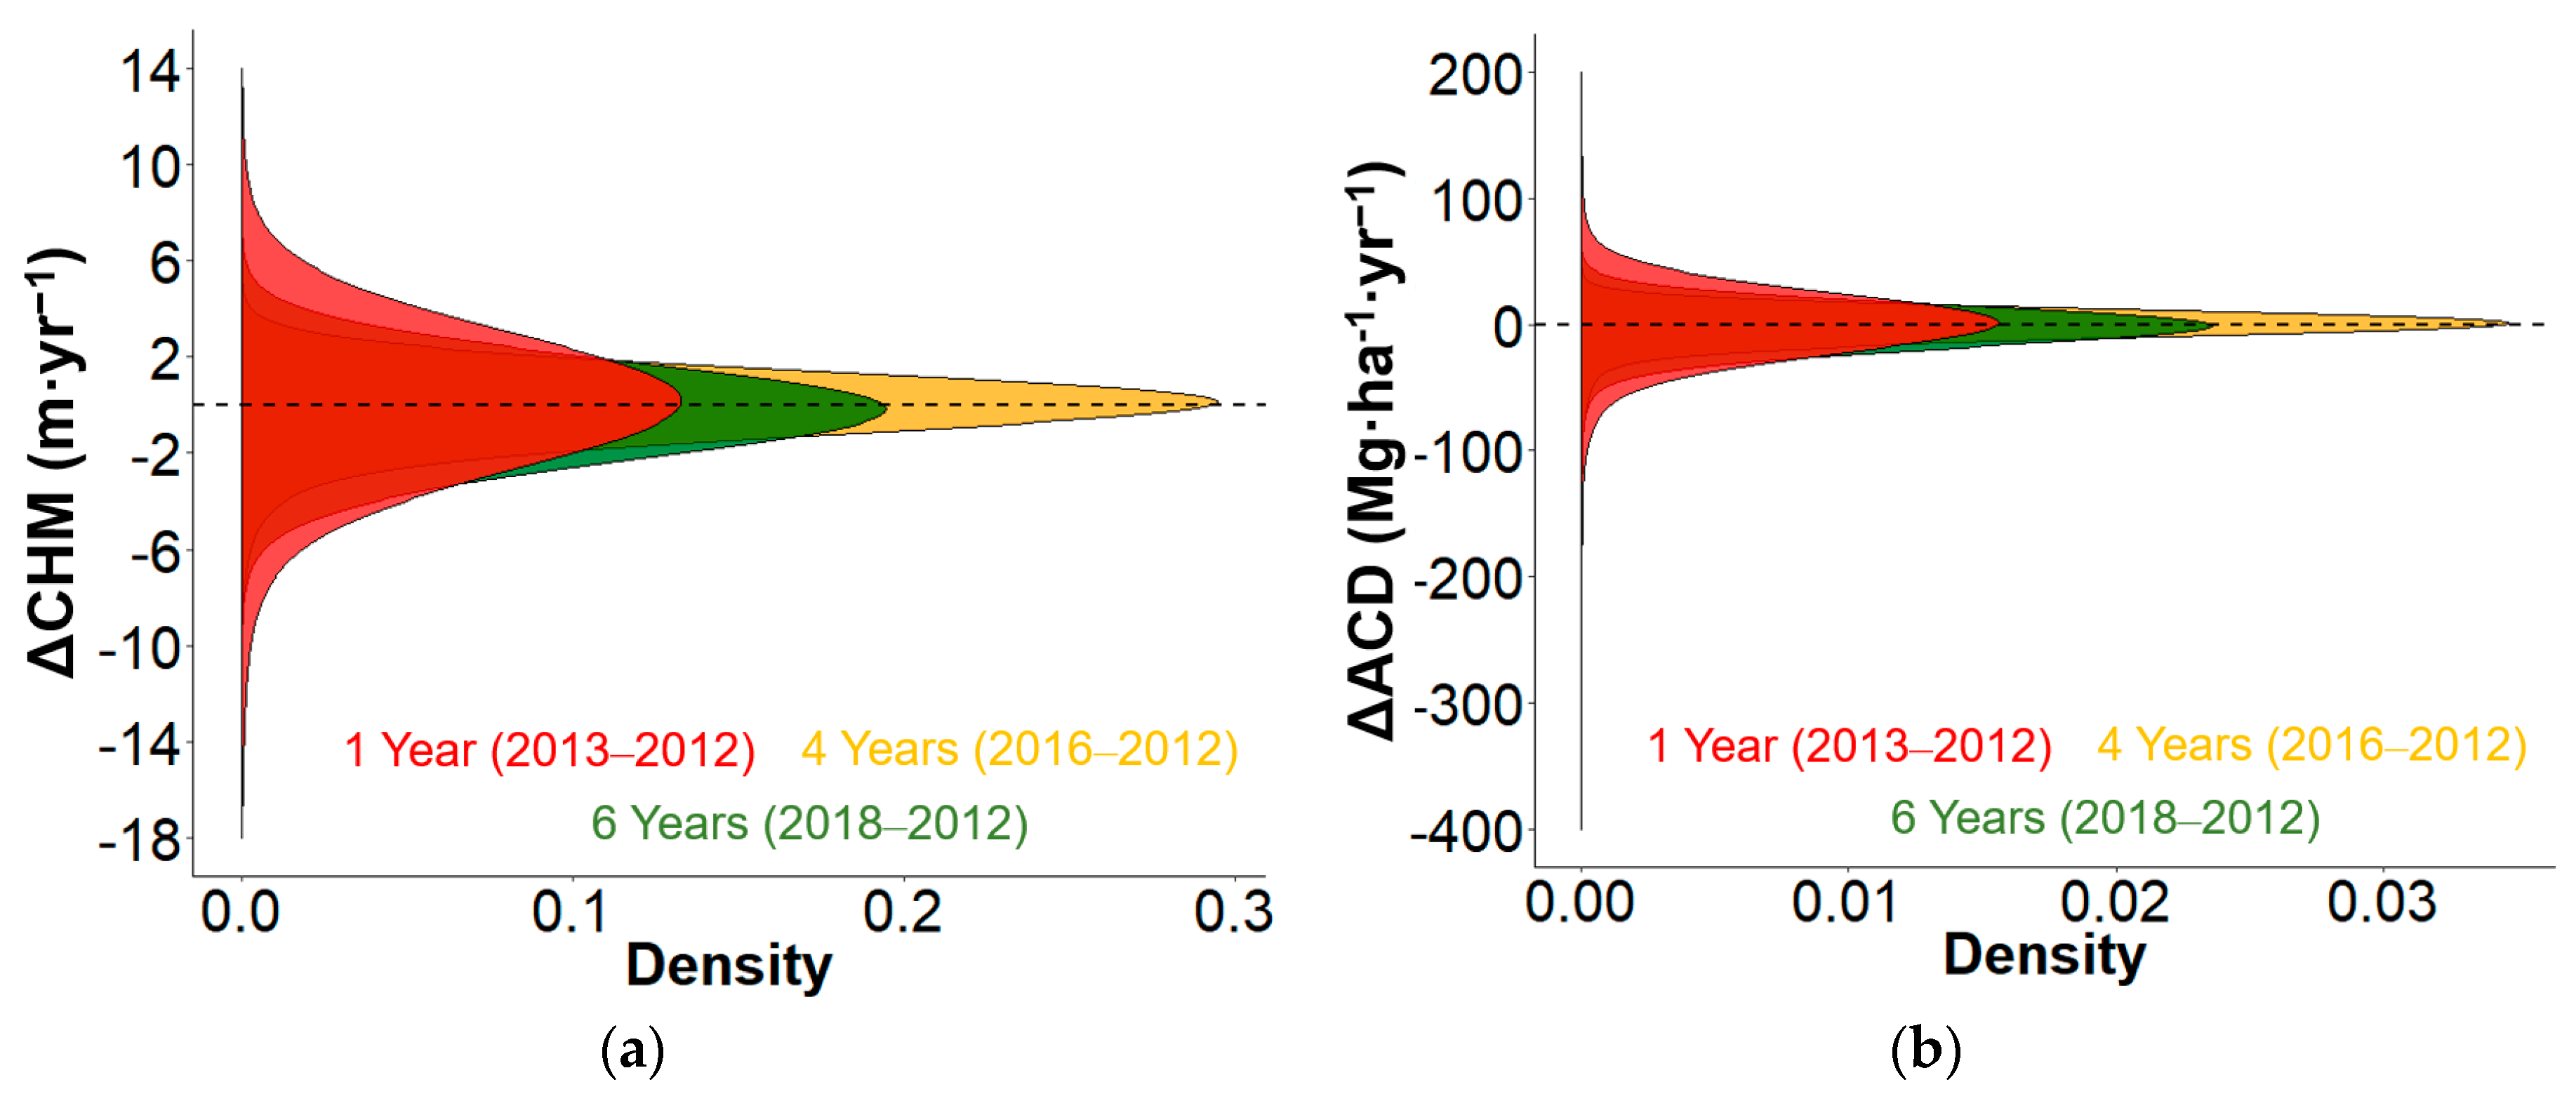
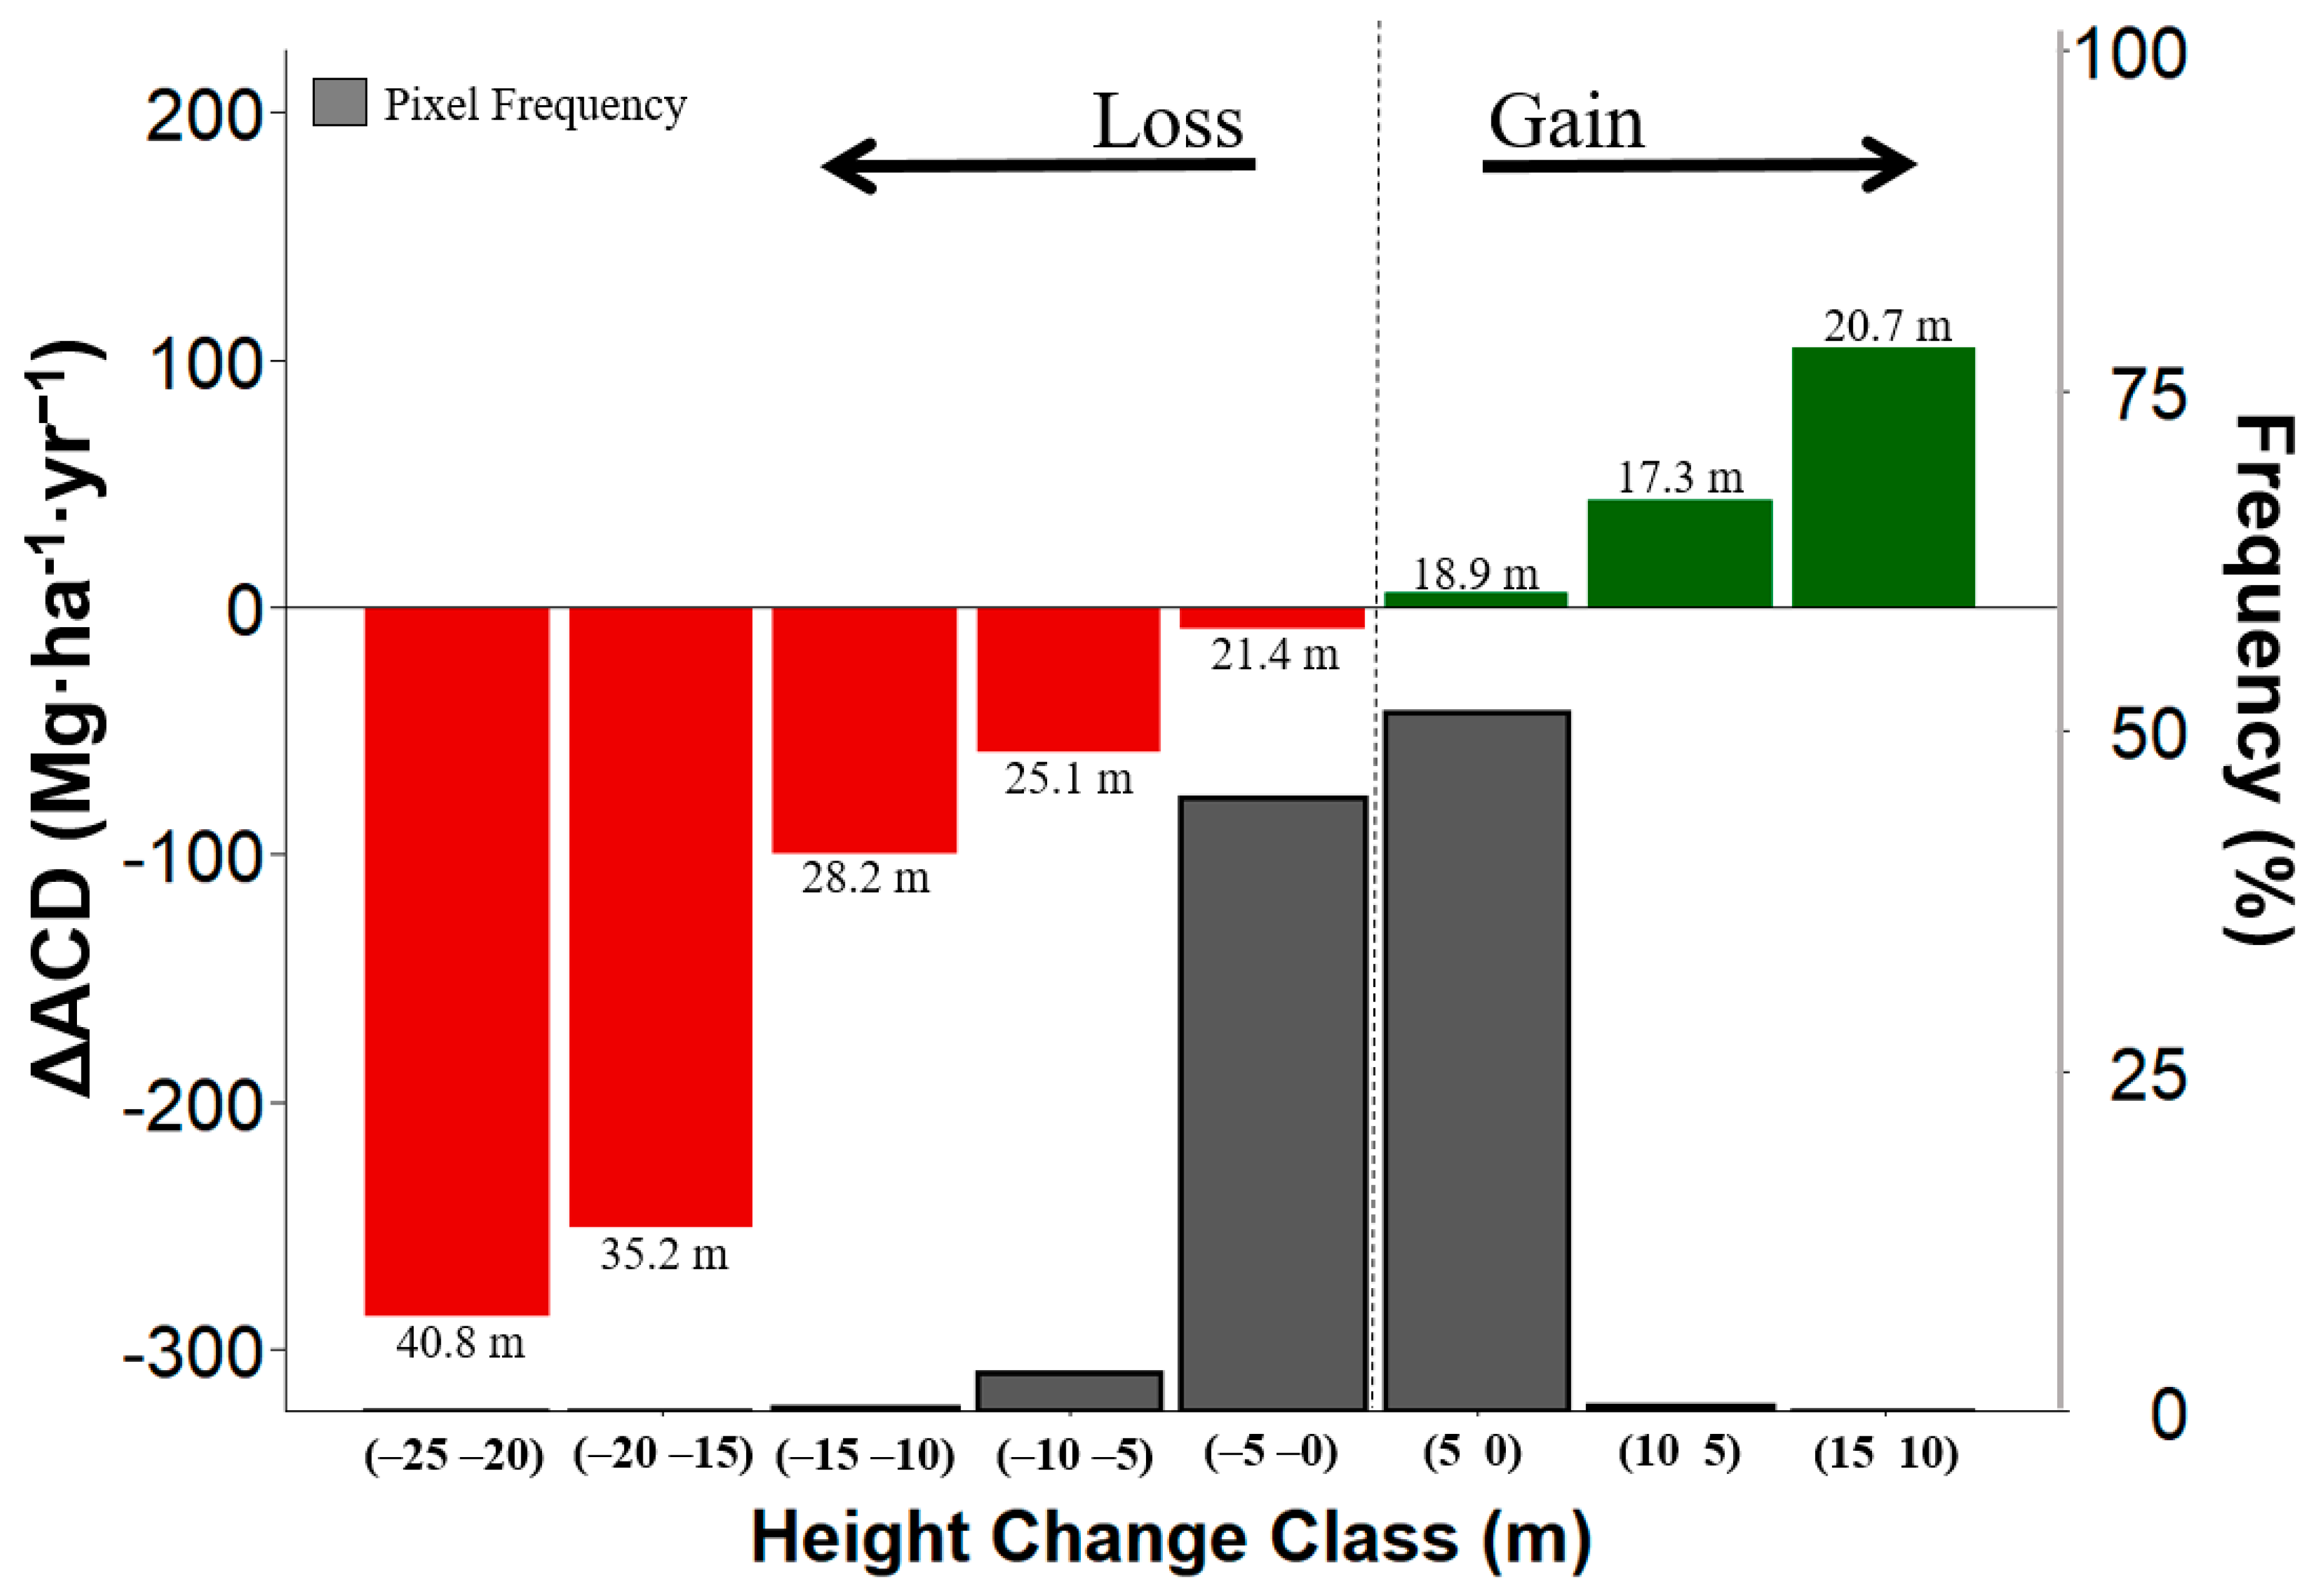
As tree growth and tree mortality are related to the increase and decrease of forest canopy height (CHM), we investigated the relationship between changes in forest canopy heights (ΔCHM) that likely lead to changes in aboveground carbon stocks (ΔACD).
Following the guidelines by the IPCC [46], we used the stock-difference method (SDM), where changes in carbon stock (∆Carbon) are the difference between carbon stocks for a given forest area estimated at two time points (Equation (2)):
Δ C a r b o n = C a r b o n t 1 C a r b o n t 2 t 2 t 1
where ΔCarbon is the annual change in carbon stocks in biomass (Mg·C·ha−1·yr−1), Carbont1 is the carbon stock at time 1 (Mg·C·ha−1), and Carbont2 is the carbon stock at time 2 (Mg·C·ha−1).
We followed the same procedure to assess ΔCHM, where ΔCHM (m·y−1) is the change of CHM (m) for each period between CHMt1 (m·y−1) and CHMt2 (m·y−1). This approach was applied to all LiDAR datasets, fixing a base year to make the time differences through time consistent. We also considered a specific time window between two periods. Therefore, the month of data collection was also taken into account for the calculations. For instance, LiDAR data from 2012 to 2016 did not have exactly a 4-year interval, but, 3 years and 8 months. The calculations used this specific time window to avoid any under or over estimation of canopy height and carbon stocks. In order to simplify the presentation of the results, we used as a proxy three different time intervals: 1 year (2013–2012), 4 years (2016–2012), and 6 years (2018–2012). After the normalization of the results by the time, we evaluated the dynamics and annual changes in canopy height and carbon stocks in the HMTF. We assumed that differences in data acquisition should not have a significant effect on the measured height due to the low variability of leaf area index (LAI) in the studied HMTF [31] and to the high pulse density of LiDAR (>30 points per sq. meter). We also tested how changes in canopy height can lead to changes in carbon stocks using a linear regression model of losses and recovery trajectories of ACD and canopy structure through time.
On one hand, forest recovery is usually associated with an increase of forest canopy height and carbon gains. On the other hand, forest degradation is related to the decrease of forest height and carbon losses. Therefore, to have a better understanding of the processes related to forest recovery and disturbances in the HMTF, we separated changes related to forest recovery (CHM and ACD gains) and disturbances (CHM and ACD losses) for each time interval. We also evaluated the values of net for carbon and height to determine if the HMTF has been acting as a source or sink of carbon. Finally, to observe how vertical structural changes could affect the annual carbon dynamics over the HMTF, we stratified the canopy height from the CHM and calculated the mean carbon change per class of height change. This allowed us to evaluate which stratum of the CHM had the largest influence on carbon forest dynamics.

3. Results

The LiDAR acquisitions (2012, 2013, 2016, and 2018) are described in terms of vertical distribution of canopy height in Figure 2. Multi-temporal differences in forest structure (given by the CHM) and ACD can be observed throughout the years. Mean canopy height showed a slight increase from 2012 (18 ± 8.1 m) to 2013 (19.1 ± 8 m) and 2016 (19.4 ± 7.8 m), and decreased again in 2018 (18.1 ± 8.6 m). The vertical distribution of CHM showed a clear reduction for 2018 in the height classes between 7 and 22 m. The reduction of the vertical canopy elements is also reflected in the ACD. LiDAR-based estimates of ACD showed progressive loss in the studied period from 77.9 Mg·C·ha−1 in 2012 to 53.1 Mg·C·ha−1 in 2018, thus generating a decrease of 31.8% (Figure 2).
We found a strong multi-temporal correlation between changes in forest structure and carbon dynamics (Figure 3a). As expected, changes in forest height (ΔCHM) were strongly correlated with changes in carbon (ΔACD) for all time intervals. The coefficient of determination (R2) values for one (2012–2013), four (2012–2016), and six (2012–2018) years of intervals were 0.85, 0.75, and 0.90, respectively (Figure 3b). The relative standard error (RSE) values were 0.92 m (2012–2013), 0.51 m (2012–2016), and 0.34 m (2012–2018). The associated uncertainty of these relationships is given by randomly selected pixels across all the years analyzed. We found a fairly strong relationship, with R2 = 0.87 and RSE = 0.55. Slope and intercept coefficients also presented values different from zero (p < 0.0001).
To illustrate some process of forest dynamics (related to tree mortality, branches losses, growth/regrowth), represented here as structural changes in the canopy height over the HMTF, we showed the spatial variation of CHM at 1 m spatial resolution for each year (Figure 4a). We also presented the multi-temporal approach that was used to calculate the changes between the periods (2012–2013, 2012–2016, and 2012–2018) (Figure 4b). The values in Figure 4 are absolute values, not normalized by the period of analysis. The images are shown with the resolution of 1 × 1 m, making them not directly comparable with Figure 3. From inspection of Figure 4b, we observed that losses of larger canopies within the HMTF limits could be great contributors for carbon dynamics.
Table 1 shows a summary of all the estimated gains and losses in carbon stocks and canopy height for the three time intervals with a fixed reference year (2012). It also provides the percentage areas for gains and losses in the HMTF. The last two columns show the net height and net carbon differences per interval. For the intervals of 1 and 6 years, we observed losses in the CHM of −1.72 ± 2.3 and −1.24 ± 1.1 m·yr−1, respectively. For the same periods, the ACD losses were −5.28 and −3.04 Mg·C·ha−1·yr−1. The average of net height for the three time intervals of LiDAR data indicated that this particular HMTF lost 0.57 m·yr−1 in mean forest canopy height and 1.38 Mg·C·ha−1·yr−1 in forest carbon between 2012 and 2018, which also reflected the reduction of forest cover over time.
Figure 5 shows the distribution of changes in height (a) and carbon (b) for different time intervals. Each interval is represented by a different color. Variations in height (ΔCHM) and carbon (ΔACD) changes were observed between the different studied intervals. Results showed a significant effect on the balance of ΔCHM and ΔACD. Long intervals between ALS data analysis (4 and 6 years) reduced the variability of the probability distribution function (PDF) of ΔCHM (Figure 5a) and ΔACD (Figure 5b). For short intervals of analyses (1 year), the range of the PDF of ΔCHM and ΔACD was larger. The ranges (minimum and maximum) of ΔCHM for 4 and 6 years (long intervals) and for 1 year (short interval) were ±12 and ±8 m·yr−1, respectively (Figure 5a). The ranges (minimum and maximum) of ΔACD for long and short intervals were approximately ±50 and ±100 Mg·C·ha−1·yr−1, respectively (Figure 5b).
Considering all the time intervals between the LiDAR surveys (1, 4, and 6 years), we found that the largest carbon losses were associated with trees having ≈21 m height. These forest canopy locations lost on average 0–5 m of their total height considering all years of analysis. This represents a mean carbon loss of 8.92 Mg·ha−1·yr−1 covering about 45% of the HMTF (Figure 6).
Forest canopy areas of average height of 28 m in 2012 lost 10–15 m in height over the years of observation. These areas also accounted for the highest carbon loss (99.68 Mg·ha−1·yr−1). However, the frequency of this occurrence was not significant, observed only for 0.02% of the HMTF area. For the tallest trees (40 m), we found a reduction in height between 20 and 25 m considering all the time intervals. Despite the high carbon losses from these tallest trees, the frequency of affected pixels was very low, reaching less than 1% of the HMTF fragment. The growth of trees (indicate here as gain) followed a similar pattern. The majority of trees that gained up to 5 m in height were ≈18 m tall in 2012 and represented 51.32% of the HMTF. Their contribution to carbon sequestration was on average 36.38 Mg·ha−1·yr−1. For the 17-m tall trees, our results showed that these trees have gained between 5 and 10 m when considering all the LiDAR time intervals. However, the frequency of pixels in this class was only 0.4% across the HMTF.

4. Discussion

4.1. Forest Dynamics of Tree Heights and Carbon

The time-series approach used here with small-footprint ALS data allowed the determination of annual rates of gains and losses in carbon stocks and the assessment of the forest dynamics in the HMTF. We separated the increase and decrease of the forest canopy (e.g., tree height), likely related to processes of tree growth and mortality. This allowed us to estimate carbon sources and sinks of this HMTF, considering large scales patches of forest (≈670 ha). It also highlighted the importance of tree canopy height over large areas for forest monitoring and carbon accounting.
Tropical forests play an important role in the global carbon cycle. They can act with a neutral contribution to the global carbon budget due to the interaction between intact and secondary forests, which can take as much carbon as is released through deforestation and degradation [47]. Although several studies of forest succession based on chronosequence statistics of forest carbon-age allometry [25,27] suggested that undisturbed and secondary forests have been accumulating carbon, we found that the reduction of pristine tropical forests and the increase of HMTF could have a great influence on the carbon cycle in the tropical environment. For all time intervals under analysis, our results showed that the rates of carbon stock changes were all negative, yielding average annual carbon loss rates of −1.34 Mg·C·ha−1·yr−1. Thus, they indicate that this HMTF is acting more as a source of carbon than a sink. Expansion of degraded forests are likely to occur in the Amazon forest in the future due to land cover and land use change and extreme climatic events [12]. The increase of HMTF areas across the Amazon will be critical for climate change mitigation efforts, conservation, and policy efforts mainly focused on deforestation alone.
Our results showed that annual growth rates (CHM gain) were on average 0.73 m·yr−1 (mean annual gain considering all time intervals, values derived from Table 1). However, increases (gains) and decreases (losses) of tree canopy height suggest that the balance of ΔCHM is small and negative, ranging from −0.50 to −0.77 m·yr−1 (Table 1). Tree mortality processes have been found to lead to changes in forest composition, structure, and function [48,49,50]. Moreover, human-induced disturbances (e.g., selective logging, fires, or forest fragmentation) can affect the overall dynamics of tropical forests (Fisher et al., 2016). As forest disturbances and recovery are usually associated with the increase and decrease of tree canopy height, we investigated the CHM derived from the ALS data as an indicator of the annual aboveground carbon gains and losses of the HMTF.
Our results indicated that changes in tree canopy height were strongly associated with changes in carbon stocks (Figure 3), regardless of the studied time interval. We also found a low uncertainty (RSE) for large time intervals (2012 to 2018) in comparison with short intervals (2012 to 2013). Close inspection of the multi-temporal LiDAR data suggests that the mortality of large individual trees may exert a large influence on the carbon balance for this HMTF (Figure 4). While we acknowledge that LiDAR alone may not be sufficient to constrain small changes or all functions of carbon allocation within a forest system, including understory forest carbon stocks and changes in allocation strategy into belowground biomass to grow root system, the focus of our study was to analyze the dynamics of aboveground carbon and height. The multi-temporal approach used here brings new perspectives to evaluate forest dynamics, focusing on aboveground carbon stocks covering a large area of HMTF. The approach allows us to observe landscape-scale processes, something that has been challenging using plot-based data alone.

4.2. Effects of the Time Intervals of LiDAR Surveys on Forest Dynamics

The significant variations in ΔCHM and ΔACD found here are likely related to the time intervals between the ALS surveys. Overall, we observed a prevalence of negative values indicating height and carbon losses in the data. When considering areas that have changes in terms of gain and loss, we found that areas that have gained carbon were higher than areas of losses for the time intervals analyzed. Nevertheless, the overall amounts of changes in tree height and carbon were all negative (Figure 4, Table 1).
Long sampling intervals (e.g., 6 years) can easily have missed tree fall gaps and other disturbances [51] related to forest mortality, while short sampling intervals can overlook the important contribution of forest regeneration on the carbon dynamics. While there is a growing body of literature arguing that tropical forests are changing [34,37,52], with findings suggesting gains in aboveground biomass [53] and faster tree turnover [54,55], the causes of these increases are widely being debated [47]. Some studies suggest that the causes may be related with methodological problems, including sampling biases, amount, and locations of permanent plots and the heterogeneous intervals between repeated plot measurements [56,57,58,59].
This ‘sampling effect’ was reflected in our results, for instance, when evaluating the R2 of the different intervals (Figure 3a). They did not present a stable pattern between periods. This fact indicates that the window of analysis, considering different time intervals, may play an important role on studies evaluating forest and/or carbon dynamics. By analyzing the ΔCHM and ΔACD distributions, we observed two trends. First, a clear distinction between shorter (1 year) and longer time intervals (4 and 6 years). This may be an indication that annual changes in canopy structure were affected by the period of normalization, showing the sensitivity of the approach when analyzing temporal patterns of forest dynamics. Second, the distributions for the 6-year time interval were more influenced by the greater reduction in forested area and canopy height, resulting also in carbon losses (Table 1). Therefore, in this case, the spread of the distribution seems to be more affected by the biophysical changes rather than by the normalization method.
Our approach was limited by the availability of repeated LiDAR data acquisitions over the same study area, which means that our analyses were based on a short time series. Another constraint of the study was the absence of a reference site over non-disturbed forests with available LiDAR data acquisition at the same time interval of the HMTF data analysis. However, because our time series is relatively short (6 years), it is also expected that non-disturbed forests have stable carbon dynamics over this short period of time [60]. Further studies should therefore consider control sites and HMTFs at longer time series and larger areas than those studied here. In spite of these limitations, our multi-temporal LiDAR acquisitions provide a more comprehensive study of temporal forest changes than many conventional field-based approaches, which often focus on just two time points. The analysis of long-term trends derived from annual change estimates is more robust than approaches based on just two time points, even when the time interval is long, given the uncertainty inherent in all estimates. The utility of multi-temporal LiDAR data for monitoring forest ecosystems provide unique opportunities for measuring forest dynamics over time [61,62]. We hope to extend this study using the new Global Ecosystem Dynamics Investigation (GEDI), which will produce high-resolution laser ranging observations of the 3D structure over tropical ecosystems.

4.3. Implications of Persistent Carbon Loss in HMTFs

In this study, we described a robust method using multi-temporal and high-spatial resolution airborne LiDAR data to monitor changes in canopy height and, therefore, aboveground forest carbon stocks. Although more studies of forest dynamics in HMTF are necessary to reduce the current remaining uncertainties in the carbon cycle, our results highlight the persistent effects of carbon losses likely related to processes of tree mortality. Our results demonstrate that high-resolution LiDAR data can be used to assess forest dynamics in HMTFs. The time-series approach allows the calculations of annual growth rates and gains and losses in carbon storage [3], which is key to increase the accuracy of current Earth System Models (ESM) and the projections of future climate scenarios.
Persistent carbon losses driven by tree mortality have been reported over forest regions worldwide [63,64,65,66,67]. In this study, we considered the balance of changes in height and carbon in the HMTF of the Brazilian Amazon. Our results showed unambiguous losses of carbon stocks and canopy height. The patch of HMTF we have studied intensively is therefore likely a source of carbon when carbon stocks are concerned. This suggests that this area is suffering from persistent carbon losses associated with decreasing tree canopy height.
Our multi-temporal approach using ALS data reveals important changes in forest structure and dynamics: (i) increases (gains) and decreases (losses) of tree canopy height suggest that the balance of ΔCHM is small but negative (i.e., a loss), ranging from −0.50 to −0.77 m·yr−1; and (ii) the ΔACD balance is large and also negative, ranging from −1.20 to −2.00 Mg·C·ha−1·yr−1 (Table 1). The reduction in canopy height found over all time intervals demonstrates a direct effect on the structure of the forest. This pattern was also found in the net carbon analysis, demonstrating persistent carbon losses from the HMTF studied here.
These results have direct implications for the study of tropical carbon emission scenarios in global carbon cycle, since forest loss and forest degradation result in additional carbon emissions being responsible for about 10% of all anthropogenic carbon emissions [68]. One important aspect is to understand how tree mortality processes occur in different tropical regions. Our results for the HMTF in Tapajos showed that most trees in canopies between 21 and 25 m in height were more affected by canopy height losses of up to 10 m (Figure 5). This class of trees was an important contributor to the carbon dynamics across the entire HMTF site, affecting ≈48% of the area. Understanding the impacts of forest losses derived from forest disturbances is essential to better comprehend the carbon cycle in the tropics. This will require improved monitoring, quantitative analysis, and scenario modeling over areas that are or have been exposed to disturbances.
The drivers leading to persistent carbon losses in forested regions are still poorly understood. Climate change and associated increases in disturbances, such as droughts, insect outbreaks, and fires [12,69,70], have also been pointed out as contributors to the carbon losses in forested regions. From 2015 to 2016, the HMTF studied here was affected by widespread fires, as consequence of a strong El Nino event that lead to extreme drought over the region [20,71]. The drought and related fires may have been the major disturbance that affected the area and contributed to the reduction of forest cover between 2016 and 2018 (Figure 2). While there is extensive literature on the relationship between drought and tree mortality in the Amazon [72,73,74], the timing of mortality response to drought is still uncertain [20]. The occurrence of fires over the area could also explain the significant decrease of CHM observed in 2018 when compared with the other years (Figure 2). Reduction in forest biomass caused by fires can have persistent effects and enhance mortality rates of all trees [71,75]. Many studies have investigated the vulnerability of tropical forests to fire (Barlow et al., 2003, Silva et al., 2018), showing that the baseline of fire impacts is related with impoverishment of large areas of forests. This leads to a rapid collapse of old-growth trees [60]. Areas affected by fires may also promote the development of secondary successions and the widespread of pioneer species, which could explain the increase in the density of small trees (<10 m) in 2018 compared to previous years (Figure 2). The drought-mortality response can be also species-specific. Trees with lower water use efficiency are particularly prone to drought-induced mortality (e.g., [11,76]). As this is a trait largely present in pioneer species, which are in great abundance over disturbed forests, the HMTF may be more exposed and vulnerable to fires and drought-induced mortality than preserved areas, directly affecting the resilience of these forests.

5. Conclusions

The findings presented here showed persistent carbon losses (negative carbon budget) in the HMTF of eastern Amazon. These losses are likely related to effects of forest disturbances and tree mortality on forest recovery rates. This has a direct implication on the discussion whether human-modified tropical forests are likely to become a source rather than a sink of carbon, contributing to exacerbate anthropogenic climate change. An approach is described here to show how multi-temporal and high-spatial resolution LiDAR data acquisitions can be used to measure forest dynamics. This quantitative evidence raises concerns that the effects of canopy height losses on the carbon stocks of HMTF are in fact larger than previously thought. As forest loss is responsible for about 10% of the total anthropogenic greenhouse gas emissions, and HMTFs are likely to expand across the Amazon biome in the near future, such carbon source conditions, directly associated with disturbances and forest degradation, may be essential when considering climate projections and carbon accounting methods.
Our results showed that multi-temporal LiDAR data provided valuable information to obtain annual growth rates, gains, and losses in carbon stocks across a large patch of HMTF (≈670 ha). The rates of change in tree height varied between −0.41 and −1.39 m·yr−1, leading to a carbon source of −1.48 Mg·C·ha−1·yr−1 for this site of HMTF. We concluded also that the effects from different time intervals could play an important role on the evaluation of carbon dynamics. This is especially important when considering LiDAR imaging over small areas, such as those from aerial surveys. While long sampling intervals (e.g., 6 years) can miss tree fall gaps and other disturbances (including tree mortality), short sampling intervals can overlook the important contribution of forest regeneration on the carbon dynamics.

Author Contributions

Conceptualization, Y.M.d.M., L.S.G., F.E.-S. and H.B.; Methodology, Y.M.d.M., L.S.G., and F.E.-S.; Formal analysis, Y.M.d.M., R.D., M.G., E.G.S.; Writing—review and editing, Y.M.d.M., H.B., L.S.G., R.D., F.E.-S., E.G.S., M.G., P.d.C.B., R.C.O., Y.E.S. All authors have read and agreed to the published version of the manuscript.

Funding

This research was funded by the Royal Society, Newton International Fellowship (Y.M.d.M.), grant number NF170036. H.B. was supported by the UK Natural Environment Research Council through the National Centre for Earth Observation. R.D. was supported by The Sao Paulo Research Foundation (FAPESP), grant number 2015/22987-7. P.d.C.B. was supported by European Union’s Horizon 2020 research and innovation programme under the Marie Skłodowska-Curie grant agreement no 660020.

Acknowledgments

Y.M.d.M. was supported by a research grant from the Royal Society through the Newton International Fellowship funding, grant number NF170036. The authors would like to acknowledge the Sustainable Landscapes Brazil project supported by the Brazilian Agricultural Research Corporation (EMBRAPA), the US Forest Service, and USAID, and the US Department of State for the LiDAR data. The author also would like to acknowledge Jos Barlow, from Lancaster University, for reading and providing insightful suggestions on the manuscript. Comments by the anonymous reviewers were highly appreciated.

Conflicts of Interest

The authors declare no conflict of interest.

References

  1. Gloor, E. The fate of Amazonia. Nat. Clim. Chang. 2019, 9, 355–356. [Google Scholar] [CrossRef]
  2. Andresen, E.; Arroyo-Rodríguez, V.; Escobar, F. Tropical Biodiversity: The Importance of Biotic Interactions for Its Origin, Maintenance, Function, and Conservation. In Ecological Networks in the Tropics; Springer: New York, NY, USA, 2018; pp. 1–13. [Google Scholar]
  3. Baccini, A.; Walker, W.; Carvalho, L.; Farina, M.; Sulla-Menashe, D.; Houghton, R.A. Tropical forests are a net carbon source based on aboveground measurements of gain and loss. Science 2017, 358, 230–234. [Google Scholar] [CrossRef] [PubMed] [Green Version]
  4. Berenguer, E.; Ferreira, J.; Gardner, T.A.; Aragao, L.E.O.C.; De Camargo, P.B.; Cerri, C.E.; Durigan, M.; De Oliveira, R.C.; Vieira, I.C.G.; Barlow, J. A large-scale field assessment of carbon stocks in human-modified tropical forests. Glob. Chang. Biol. 2014, 20, 3713–3726. [Google Scholar] [CrossRef] [PubMed] [Green Version]
  5. Parrotta, J.A.; Wildburger, C.; Mansourian, S. Understanding Relationships between Biodiversity, Carbon, Forests and People: The Key to Achieving REDD+ Objectives. A Global Assessment Report Prepared by Global Forest Panel on Biodiversity, Forest Management, and REDD+; International Union of Forest Research Organizations (IUFRO): Vienna, Austria, 2012; Volume 31, 161p, ISBN 9783902762177. [Google Scholar]
  6. Maxwell, S.L.; Evans, T.; Watson, J.E.M.; Morel, A.; Grantham, H.; Duncan, A.; Harris, N.; Potapov, P.; Runting, R.K.; Venter, O.; et al. Degradation and forgone removals increase the carbon impact of intact forest loss by 626%. Sci. Adv. 2019, 5, eaax2546. [Google Scholar] [CrossRef] [PubMed] [Green Version]
  7. Barlow, J.; Haugaasen, T.; Peres, C.A. Effects of ground fires on understorey bird assemblages in Amazonian forests. Biol. Conserv. 2002, 105, 157–169. [Google Scholar] [CrossRef]
  8. Longo, M.; Keller, M.; dos-Santos, M.N.; Leitold, V.; Pinagé, E.R.; Baccini, A.; Saatchi, S.; Nogueira, E.M.; Batistella, M.; Morton, D.C. Aboveground biomass variability across intact and degraded forests in the Brazilian Amazon. Glob. Biogeochem. Cycles 2016, 30, 1639–1660. [Google Scholar] [CrossRef] [Green Version]
  9. Rappaport, D.I.; Morton, D.C.; Longo, M.; Keller, M.; Dubayah, R.; Dos-Santos, M.N. Quantifying long-term changes in carbon stocks and forest structure from Amazon forest degradation. Environ. Res. Lett. 2018, 13, 065013. [Google Scholar] [CrossRef]
  10. Bustamante, M.M.C.; Roitman, I.; Aide, T.M.; Alencar, A.; Anderson, L.O.; Aragão, L.; Asner, G.P.; Barlow, J.; Berenguer, E.; Chambers, J.; et al. Toward an integrated monitoring framework to assess the effects of tropical forest degradation and recovery on carbon stocks and biodiversity. Glob. Chang. Biol. 2016, 22, 92–109. [Google Scholar] [CrossRef]
  11. Phillips, O.L.; Higuchi, N.; Vieira, S.; Baker, T.R.; Chao, K.-J.; Lewis, S.L. Changes in Amazonian Forest Biomass, Dynamics, and Composition, 1980–2002; American Geophysical Union: Washington, DC, USA, 2009; pp. 373–387. ISBN 9781118670347. [Google Scholar]
  12. Anderson, L.O.; Neto, G.R.; Cunha, A.P.; Fonseca, M.G.; De Moura, Y.M.; Dalagnol, R.; Wagner, F.H.; De Aragão, L.E.O.E.C. Vulnerability of Amazonian forests to repeated droughts. Philos. Trans. R. Soc. B Biol. Sci. 2018, 373, 20170411. [Google Scholar] [CrossRef]
  13. Aragão, L.E.O.C.; Anderson, L.O.; Fonseca, M.G.; Rosan, T.M.; Vedovato, L.B.; Wagner, F.H.; Silva, C.V.J.; Silva Junior, C.H.L.; Arai, E.; Aguiar, A.P.; et al. 21st Century drought-related fires counteract the decline of Amazon deforestation carbon emissions. Nat. Commun. 2018, 9, 536. [Google Scholar] [CrossRef]
  14. Foley, J.A.; Asner, G.P.; Costa, M.H.; Coe, M.T.; DeFries, R.; Gibbs, H.K.; Howard, E.A.; Olson, S.; Patz, J.; Ramankutty, N.; et al. Amazonia revealed: Forest degradation and loss of ecosystem goods and services in the Amazon Basin. Front. Ecol. Environ. 2007, 5, 25–32. [Google Scholar] [CrossRef]
  15. Hansen, M.; Potapov, P.; Moore, R.; Hancher, M.; Turubanova, S.; Tyukavina, A.; Thau, D.; Stehman, S.; Goetz, S.; Loveland, T.; et al. High-resolution global maps of 21st-century forest cover change. Science 2013, 342, 850–853. [Google Scholar] [CrossRef] [PubMed] [Green Version]
  16. Boucher, D.; Roquemore, S.; Fitzhugh, E. Brazil’s Success in Reducing Deforestation. Trop. Conserv. Sci. 2013, 6, 426–445. [Google Scholar] [CrossRef] [Green Version]
  17. National Institute for Space Research, E.O.C.T. DEGRAD. Available online: http://www.obt.inpe.br/OBT/assuntos/programas/amazonia/degrad (accessed on 9 December 2019).
  18. Putz, F.E.; Redford, K.H. The Importance of Defining “Forest”: Tropical Forest Degradation, Deforestation, Long-term Phase Shifts, and Further Transitions. Biotropica 2010, 42, 10–20. [Google Scholar] [CrossRef]
  19. Hunter, M.O.; Keller, M.; Morton, D.; Cook, B.; Lefsky, M.; Ducey, M.; Saleska, S.; de Oliveira, R.C.; Schietti, J. Structural Dynamics of Tropical Moist Forest Gaps. PLoS ONE 2015, 10, e0132144. [Google Scholar] [CrossRef]
  20. Leitold, V.; Morton, D.C.; Longo, M.; dos-Santos, M.N.; Keller, M.; Scaranello, M. El Niño drought increased canopy turnover in Amazon forests. New Phytol. 2018, 219, 959–971. [Google Scholar] [CrossRef] [Green Version]
  21. Drake, J.B.; Dubayah, R.O.; Knox, R.G.; Clark, D.B.; Blair, J.B. Sensitivity of large-footprint lidar to canopy structure and biomass in a neotropical rainforest. Remote Sens. Environ. 2002, 81, 378–392. [Google Scholar] [CrossRef]
  22. Strahler, A.H.; Jupp, D.L.; Woodcock, C.E.; Schaaf, C.B.; Yao, T.; Zhao, F.; Yang, X.; Lovell, J.; Culvenor, D.; Newnham, G.; et al. Retrieval of forest structural parameters using a ground-based lidar instrument (Echidna®). Can. J. Remote Sens. 2008, 34, S426–S440. [Google Scholar] [CrossRef] [Green Version]
  23. Wulder, M.A.; White, J.C.; Nelson, R.F.; Næsset, E.; Ørka, H.O.; Coops, N.C.; Hilker, T.; Bater, C.W.; Gobakken, T. Lidar sampling for large-area forest characterization: A review. Remote Sens. Environ. 2012, 121, 196–209. [Google Scholar] [CrossRef] [Green Version]
  24. Sun, G.; Ranson, K.; Kimes, D.; Blair, J.; Kovacs, K. Forest vertical structure from GLAS: An evaluation using LVIS and SRTM data. Remote Sens. Environ. 2008, 112, 107–117. [Google Scholar] [CrossRef]
  25. Chazdon, R.L.; Guariguata, M.R. Natural regeneration as a tool for large-scale forest restoration in the tropics: Prospects and challenges. Biotropica 2016, 48, 716–730. [Google Scholar] [CrossRef]
  26. Poorter, L.; Rozendaal, D.M.A.; Bongers, F.; de Almeida-Cortez, J.S.; Almeyda Zambrano, A.M.; Álvarez, F.S.; Andrade, J.L.; Villa, L.F.A.; Balvanera, P.; Becknell, J.M.; et al. Wet and dry tropical forests show opposite successional pathways in wood density but converge over time. Nat. Ecol. Evol. 2019, 3, 928–934. [Google Scholar] [CrossRef]
  27. Poorter, L.; Bongers, F.; Aide, T.M.; Almeyda Zambrano, A.M.; Balvanera, P.; Becknell, J.M.; Boukili, V.; Brancalion, P.H.S.; Broadbent, E.N.; Chazdon, R.L.; et al. Biomass resilience of Neotropical secondary forests. Nature 2016, 530, 211–214. [Google Scholar] [CrossRef] [PubMed]
  28. Cox, P.M.; Pearson, D.; Booth, B.B.; Friedlingstein, P.; Huntingford, C.; Jones, C.D.; Luke, C.M. Sensitivity of tropical carbon to climate change constrained by carbon dioxide variability. Nature 2013, 494, 341. [Google Scholar] [CrossRef] [PubMed]
  29. National Institute for Space Research, B. PRODES. Available online: http://www.obt.inpe.br/OBT/assuntos/programas/amazonia/prodes (accessed on 9 December 2019).
  30. Hilker, T.; Lyapustin, A.I.; Tucker, C.J.; Hall, F.G.; Myneni, R.B.; Wang, Y.; Bi, J.; De Moura, Y.M.; Sellers, P.J. Vegetation dynamics and rainfall sensitivity of the Amazon. Proc. Natl. Acad. Sci. USA 2014, 111, 16041–16046. [Google Scholar] [CrossRef] [PubMed] [Green Version]
  31. Wu, J.; Guan, K.; Hayek, M.; Restrepo-Coupe, N.; Wiedemann, K.T.; Xu, X.; Wehr, R.; Christoffersen, B.O.; Miao, G.; da Silva, R.; et al. Partitioning controls on Amazon forest photosynthesis between environmental and biotic factors at hourly to interannual timescales. Glob. Chang. Biol. 2017, 23, 1240–1257. [Google Scholar] [CrossRef] [PubMed]
  32. Cox, P.M.; Betts, R.A.; Collins, M.; Harris, P.P.; Huntingford, C.; Jones, C.D. Amazonian forest dieback under climate-carbon cycle projections for the 21st century. Theor. Appl. Climatol. 2004, 78, 137–156. [Google Scholar] [CrossRef]
  33. Malhi, Y.; Aragão, L.E.O.C.; Galbraith, D.; Huntingford, C.; Fisher, R.; Zelazowski, P.; Sitch, S.; McSweeney, C.; Meir, P. Exploring the likelihood and mechanism of a climate-change-induced dieback of the Amazon rainforest. Proc. Natl. Acad. Sci. USA 2009, 106, 20610–20615. [Google Scholar] [CrossRef] [Green Version]
  34. Phillips, O.L.; Lewis, S.L.; Baker, T.R.; Chao, K.-J.; Higuchi, N. The changing Amazon forest. Philos. Trans. R. Soc. Lond. B. Biol. Sci. 2008, 363, 1819–1827. [Google Scholar] [CrossRef] [Green Version]
  35. McDowell, N.; Allen, C.D.; Anderson-Teixeira, K.; Brando, P.; Brienen, R.; Chambers, J.; Christoffersen, B.; Davies, S.; Doughty, C.; Duque, A.; et al. Drivers and mechanisms of tree mortality in moist tropical forests. New Phytol. 2018, 219, 851–869. [Google Scholar] [CrossRef] [Green Version]
  36. Pan, Y.; Birdsey, R.A.; Fang, J.; Houghton, R.; Kauppi, P.E.; Kurz, W.A.; Phillips, O.L.; Shvidenko, A.; Lewis, S.L.; Canadell, J.G.; et al. A large and persistent carbon sink in the world’s forests. Science 2011, 333, 988–993. [Google Scholar] [CrossRef] [PubMed] [Green Version]
  37. Lewis, S.L.; Phillips, O.L.; Baker, T.R.; Malhi, Y.; Lloyd, J. Tropical Forests and Atmospheric Carbon Dioxide: Current Knowledge & Potential Future Scenarios; Oxford University Press: Oxford, UK, 2005; 260p. [Google Scholar]
  38. de Geociências, IBGE Diretoria. Manual técnico da vegetação brasileira; de Geociências, IBGE Diretoria: Rio de Janeiro, Brazil, 1992. [Google Scholar]
  39. Galvão, L.S.; dos Santos, J.R.; da Silva, R.D.; da Silva, C.V.; Moura, Y.M.; Breunig, F.M. Following a site-specific secondary succession in the Amazon using the Landsat CDR product and field inventory data. Int. J. Remote Sens. 2015, 36, 574–596. [Google Scholar] [CrossRef]
  40. Da Silva, R.D.; Galvão, L.S.; Dos Santos, J.R.; De, J.; Silva, C.V.; De Moura, Y.M. Spectral/textural attributes from ALI/EO-1 for mapping primary and secondary tropical forests and studying the relationships with biophysical parameters. GIScience Remote Sens. 2014, 51, 677–694. [Google Scholar] [CrossRef]
  41. Aragão, L.E.O.C.; Malhi, Y.; Barbier, N.; Lima, A.; Shimabukuro, Y.; Anderson, L.; Saatchi, S. Interactions between rainfall, deforestation and fires during recent years in the Brazilian Amazonia. Philos. Trans. R. Soc. B Biol. Sci. 2008, 363, 1779–1785. [Google Scholar] [CrossRef]
  42. LAStools—Efficient Tools for LiDAR Processing. Available online: https://rapidlasso.com/lastools/ (accessed on 8 July 2018).
  43. McGaughey, R.J. FUSION/LDV LIDAR Analysis and Visualization Software; United States Department of Agriculture (USDA): Washington, DC, USA, 2014; p. 119.
  44. Team, R.C. R: A Language and Environment for Statistical Computing. Available online: https://www.gbif.org/tool/81287/r-a-language-and-environment-for-statistical-computing (accessed on 9 December 2019).
  45. Espírito-Santo, F.D.B.; Shimabukuro, Y.E.; Aragão, L.E.O.eC.d.; Machado, E.L.M. Análise da composição florística e fitossociológica da floresta nacional do Tapajós com o apoio geográfico de imagens de satélites. Acta Amaz. 2005, 35, 155–173. [Google Scholar] [CrossRef]
  46. Eggleston, H.S.; Buendia, L.; Miwa, K.; Ngara, T.; Tanabe, K. 2006 IPCC Guidelines for National Greenhouse Gas Inventories (Miscellaneous)|ETDEWEB. Available online: https://www.osti.gov/etdeweb/biblio/20880391 (accessed on 9 December 2019).
  47. Mitchard, E.T.A. The tropical forest carbon cycle and climate change. Nature 2018, 559, 527–534. [Google Scholar] [CrossRef]
  48. Gonzalez-Akre, E.; Meakem, V.; Eng, C.; Tepley, A.J.; Bourg, N.A.; McShea, W.; Davies, S.J.; Anderson-Teixeira, K. Patterns of tree mortality in a temperate deciduous forest derived from a large forest dynamics plot. Ecosphere 2016, 7, e01595. [Google Scholar] [CrossRef] [Green Version]
  49. Phillips, O. Recent Changes in Amazon Forest Biomass and Dynamics. In Biodiversidad y cambio climatico en Colombia: Avances, perspectivas y reflexiones; Gonzalez-Pinto, A.L., Ed.; Jardin Botanico Jose Celestino Mutis: Bogota D.C., Colombia, 2018; pp. 13–24. ISBN 9789588576350. [Google Scholar]
  50. Chambers, J.Q.; Asner, G.P.; Morton, D.C.; Anderson, L.O.; Saatchi, S.S.; Espírito-Santo, F.D.B.; Palace, M.; Souza, C. Regional ecosystem structure and function: Ecological insights from remote sensing of tropical forests. Trends Ecol. Evol. 2007, 22, 414–423. [Google Scholar] [CrossRef]
  51. Pugh, T.A.M.; Lindeskog, M.; Smith, B.; Poulter, B.; Arneth, A.; Haverd, V.; Calle, L. Role of forest regrowth in global carbon sink dynamics. Proc. Natl. Acad. Sci. USA 2019, 116, 4382–4387. [Google Scholar] [CrossRef] [Green Version]
  52. Davidson, E.A.; de Araújo, A.C.; Artaxo, P.; Balch, J.K.; Brown, I.F.; Bustamante, M.M.; Coe, M.T.; DeFries, R.S.; Keller, M.; Longo, M.; et al. The Amazon basin in transition. Nature 2012, 481, 321–328. [Google Scholar] [CrossRef]
  53. Baker, T.R.; Phillips, O.L.; Malhi, Y.; Almeida, S.; Arroyo, L.; Di Fiore, A.; Erwin, T.; Higuchi, N.; Killeen, T.J.; Laurance, S.G.; et al. Increasing biomass in Amazonian forest plots. In Proceedings of the Philosophical Transactions of the Royal Society B: Biological Sciences; Royal Society: London, UK, 2004; Volume 359, pp. 353–365. [Google Scholar]
  54. Phillips, O.L.; Baker, T.R.; Arroyo, L.; Higuchi, N.; Killeen, T.J.; Laurance, W.F.; Lewis, S.L.; Lloyd, J.; Malhi, Y.; Monteagudo, A.; et al. Pattern and process in Amazon tree turnover, 1976–2001. Philos. Trans. R. Soc. Lond. B. Biol. Sci. 2004, 359, 381–407. [Google Scholar] [CrossRef] [PubMed]
  55. Laurance, S.G.W.; Laurance, W.F.; Nascimento, H.E.M.; Andrade, A.; Fearnside, P.M.; Rebello, E.R.G.; Condit, R. Long-term variation in Amazon forest dynamics. J. Veg. Sci. 2009, 20, 323–333. [Google Scholar] [CrossRef]
  56. Feeley, K.J.; Joseph Wright, S.; Nur Supardi, M.N.; Kassim, A.R.; Davies, S.J. Decelerating growth in tropical forest trees. Ecol. Lett. 2007, 10, 461–469. [Google Scholar] [CrossRef] [PubMed]
  57. Chave, J.; Olivier, J.; Bongers, F.; Châtelet, P.; Forget, P.M.; Van Der Meer, P.; Norden, N.; Riéra, B.; Charles-Dominique, P. Above-ground biomass and productivity in a rain forest of eastern South America. J. Trop. Ecol. 2008, 24, 355–366. [Google Scholar] [CrossRef] [Green Version]
  58. Fisher, J.I.; Hurtt, G.C.; Thomas, R.Q.; Chambers, J.Q. Clustered disturbances lead to bias in large-scale estimates based on forest sample plots. Ecol. Lett. 2008, 11, 554–563. [Google Scholar] [CrossRef]
  59. Sheil, D. A critique of permanent plot methods and analysis with examples from Budongo Forest, Uganda. For. Ecol. Manag. 1995, 77, 11–34. [Google Scholar] [CrossRef]
  60. Barlow, J.; Peres, C.A. Fire-mediated dieback and compositional cascade in an Amazonian forest. In Proceedings of the Philosophical Transactions of the Royal Society B: Biological Sciences; Royal Society: London, UK, 2008; Volume 363, pp. 1787–1794. [Google Scholar]
  61. Dubayah, R.; Goetz, S.J.; Blair, J.B.; Fatoyinbo, T.E.; Hansen, M.; Healey, S.P.; Hofton, M.A.; Hurtt, G.C.; Kellner, J.; Luthcke, S.B.; et al. The Global Ecosystem Dynamics Investigation. In Proceedings of the 2014 American Geophysical Union (AGU) Fall Meeting, San Francisco, CA, USA, 15–19 December 2014. [Google Scholar]
  62. Henry, M.; Réjou-Méchain, M.; Jara, M.C.; Wayson, C.; Piotto, D.; Westfall, J.; Fuentes, J.M.M.; Guier, F.A.; Lombis, H.C.; López, E.C.; et al. An overview of existing and promising technologies for national forest monitoring. Ann. For. Sci. 2015, 72, 779–788. [Google Scholar] [CrossRef] [Green Version]
  63. Phillips, O.L.; van der Heijden, G.; Lewis, S.L.; López-González, G.; Aragão, L.E.O.C.; Lloyd, J.; Malhi, Y.; Monteagudo, A.; Almeida, S.; Dávila, E.A.; et al. Drought-mortality relationships for tropical forests. New Phytol. 2010, 187, 631–646. [Google Scholar] [CrossRef] [Green Version]
  64. Peng, C.; Ma, Z.; Lei, X.; Zhu, Q.; Chen, H.; Wang, W.; Liu, S.; Li, W.; Fang, X.; Zhou, X. A drought-induced pervasive increase in tree mortality across Canada’s boreal forests. Nat. Clim. Chang. 2011, 1, 467–471. [Google Scholar] [CrossRef]
  65. Brienen, R.J.W.; Phillips, O.L.; Feldpausch, T.R.; Gloor, E.; Baker, T.R.; Lloyd, J.; Lopez-Gonzalez, G.; Monteagudo-Mendoza, A.; Malhi, Y.; Lewis, S.L.; et al. Long-term decline of the Amazon carbon sink. Nature 2015, 519, 344–348. [Google Scholar] [CrossRef] [Green Version]
  66. McDowell, N.G.; Williams, A.P.; Xu, C.; Pockman, W.T.; Dickman, L.T.; Sevanto, S.; Pangle, R.; Limousin, J.; Plaut, J.; Mackay, D.S.; et al. Multi-scale predictions of massive conifer mortality due to chronic temperature rise. Nat. Clim. Chang. 2016, 6, 295–300. [Google Scholar] [CrossRef]
  67. Senf, C.; Pflugmacher, D.; Zhiqiang, Y.; Sebald, J.; Knorn, J.; Neumann, M.; Hostert, P.; Seidl, R. Canopy mortality has doubled in Europe’s temperate forests over the last three decades. Nat. Commun. 2018, 9, 4978. [Google Scholar] [CrossRef] [PubMed]
  68. Le Quéré, C.; Moriarty, R.; Andrew, R.M.; Canadell, J.G.; Sitch, S.; Korsbakken, J.I.; Friedlingstein, P.; Peters, G.P.; Andres, R.J.; Boden, T.A.; et al. Global Carbon Budget 2015. Earth Syst. Sci. Data 2015, 7, 349–396. [Google Scholar] [CrossRef] [Green Version]
  69. Schowalter, T.D. Insect Responses to Major Landscape-Level Disturbance. Annu. Rev. Entomol. 2012, 57, 1–20. [Google Scholar] [CrossRef] [PubMed]
  70. Alencar, A.; Asner, G.P.; Knapp, D.; Zarin, D. Temporal variability of forest fires in eastern Amazonia. Ecol. Appl. 2011, 21, 2397–2412. [Google Scholar] [CrossRef] [PubMed]
  71. Silva, C.V.J.; Aragão, L.E.O.C.; Barlow, J.; Espirito-Santo, F.; Young, P.J.; Anderson, L.O.; Berenguer, E.; Brasil, I.; Brown, I.F.; Castro, B.; et al. Drought-induced Amazonian wildfires instigate a decadal-scale disruption of forest carbon dynamics. Philos. Trans. R. Soc. B Biol. Sci. 2018, 373, 20180043. [Google Scholar] [CrossRef] [Green Version]
  72. Nepstad, D.C.; Tohver, I.M.; Ray, D.; Moutinho, P.; Cardinot, G. Mortality of large trees and lianas following experimental drought in an Amazon forest. Ecology 2007, 88, 2259–2269. [Google Scholar] [CrossRef]
  73. Phillips, O.L.; Aragão, L.E.O.C.; Lewis, S.L.; Fisher, J.B.; Lloyd, J.; López-gonzález, G.; Malhi, Y.; Monteagudo, A.; Peacock, J.; Quesada, C.A.; et al. Drought Sensitivity of the Amazon Rainforest. Science 2009, 323, 1344–1347. [Google Scholar] [CrossRef] [Green Version]
  74. Meir, P.; Woodward, F.I. Amazonian rain forests and drought: Response and vulnerability. New Phytol. 2010, 187, 553–557. [Google Scholar] [CrossRef]
  75. Cochrane, M.A.; Schulze, M.D. Fire as a Recurrent Event in Tropical Forests of the Eastern Amazon: Effects on Forest Structure, Biomass, and Species Composition1. Biotropica 1999, 31, 2–16. [Google Scholar] [CrossRef]
  76. Feldpausch, T.R.; Phillips, O.L.; Brienen, R.J.W.; Gloor, E.; Lloyd, J.; Lopez-Gonzalez, G.; Monteagudo-Mendoza, A.; Malhi, Y.; Alarcón, A.; Dávila, E.Á.; et al. Amazon forest response to repeated droughts. Glob. Biogeochem. Cycles 2016, 30, 964–982. [Google Scholar] [CrossRef]
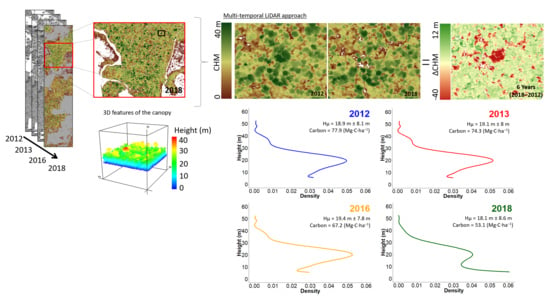
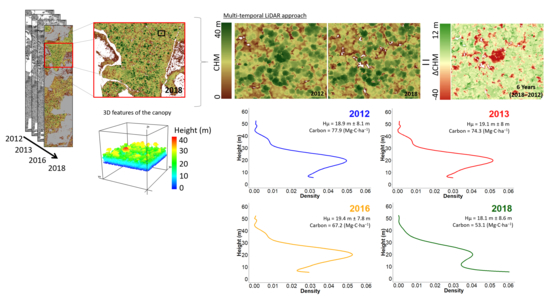
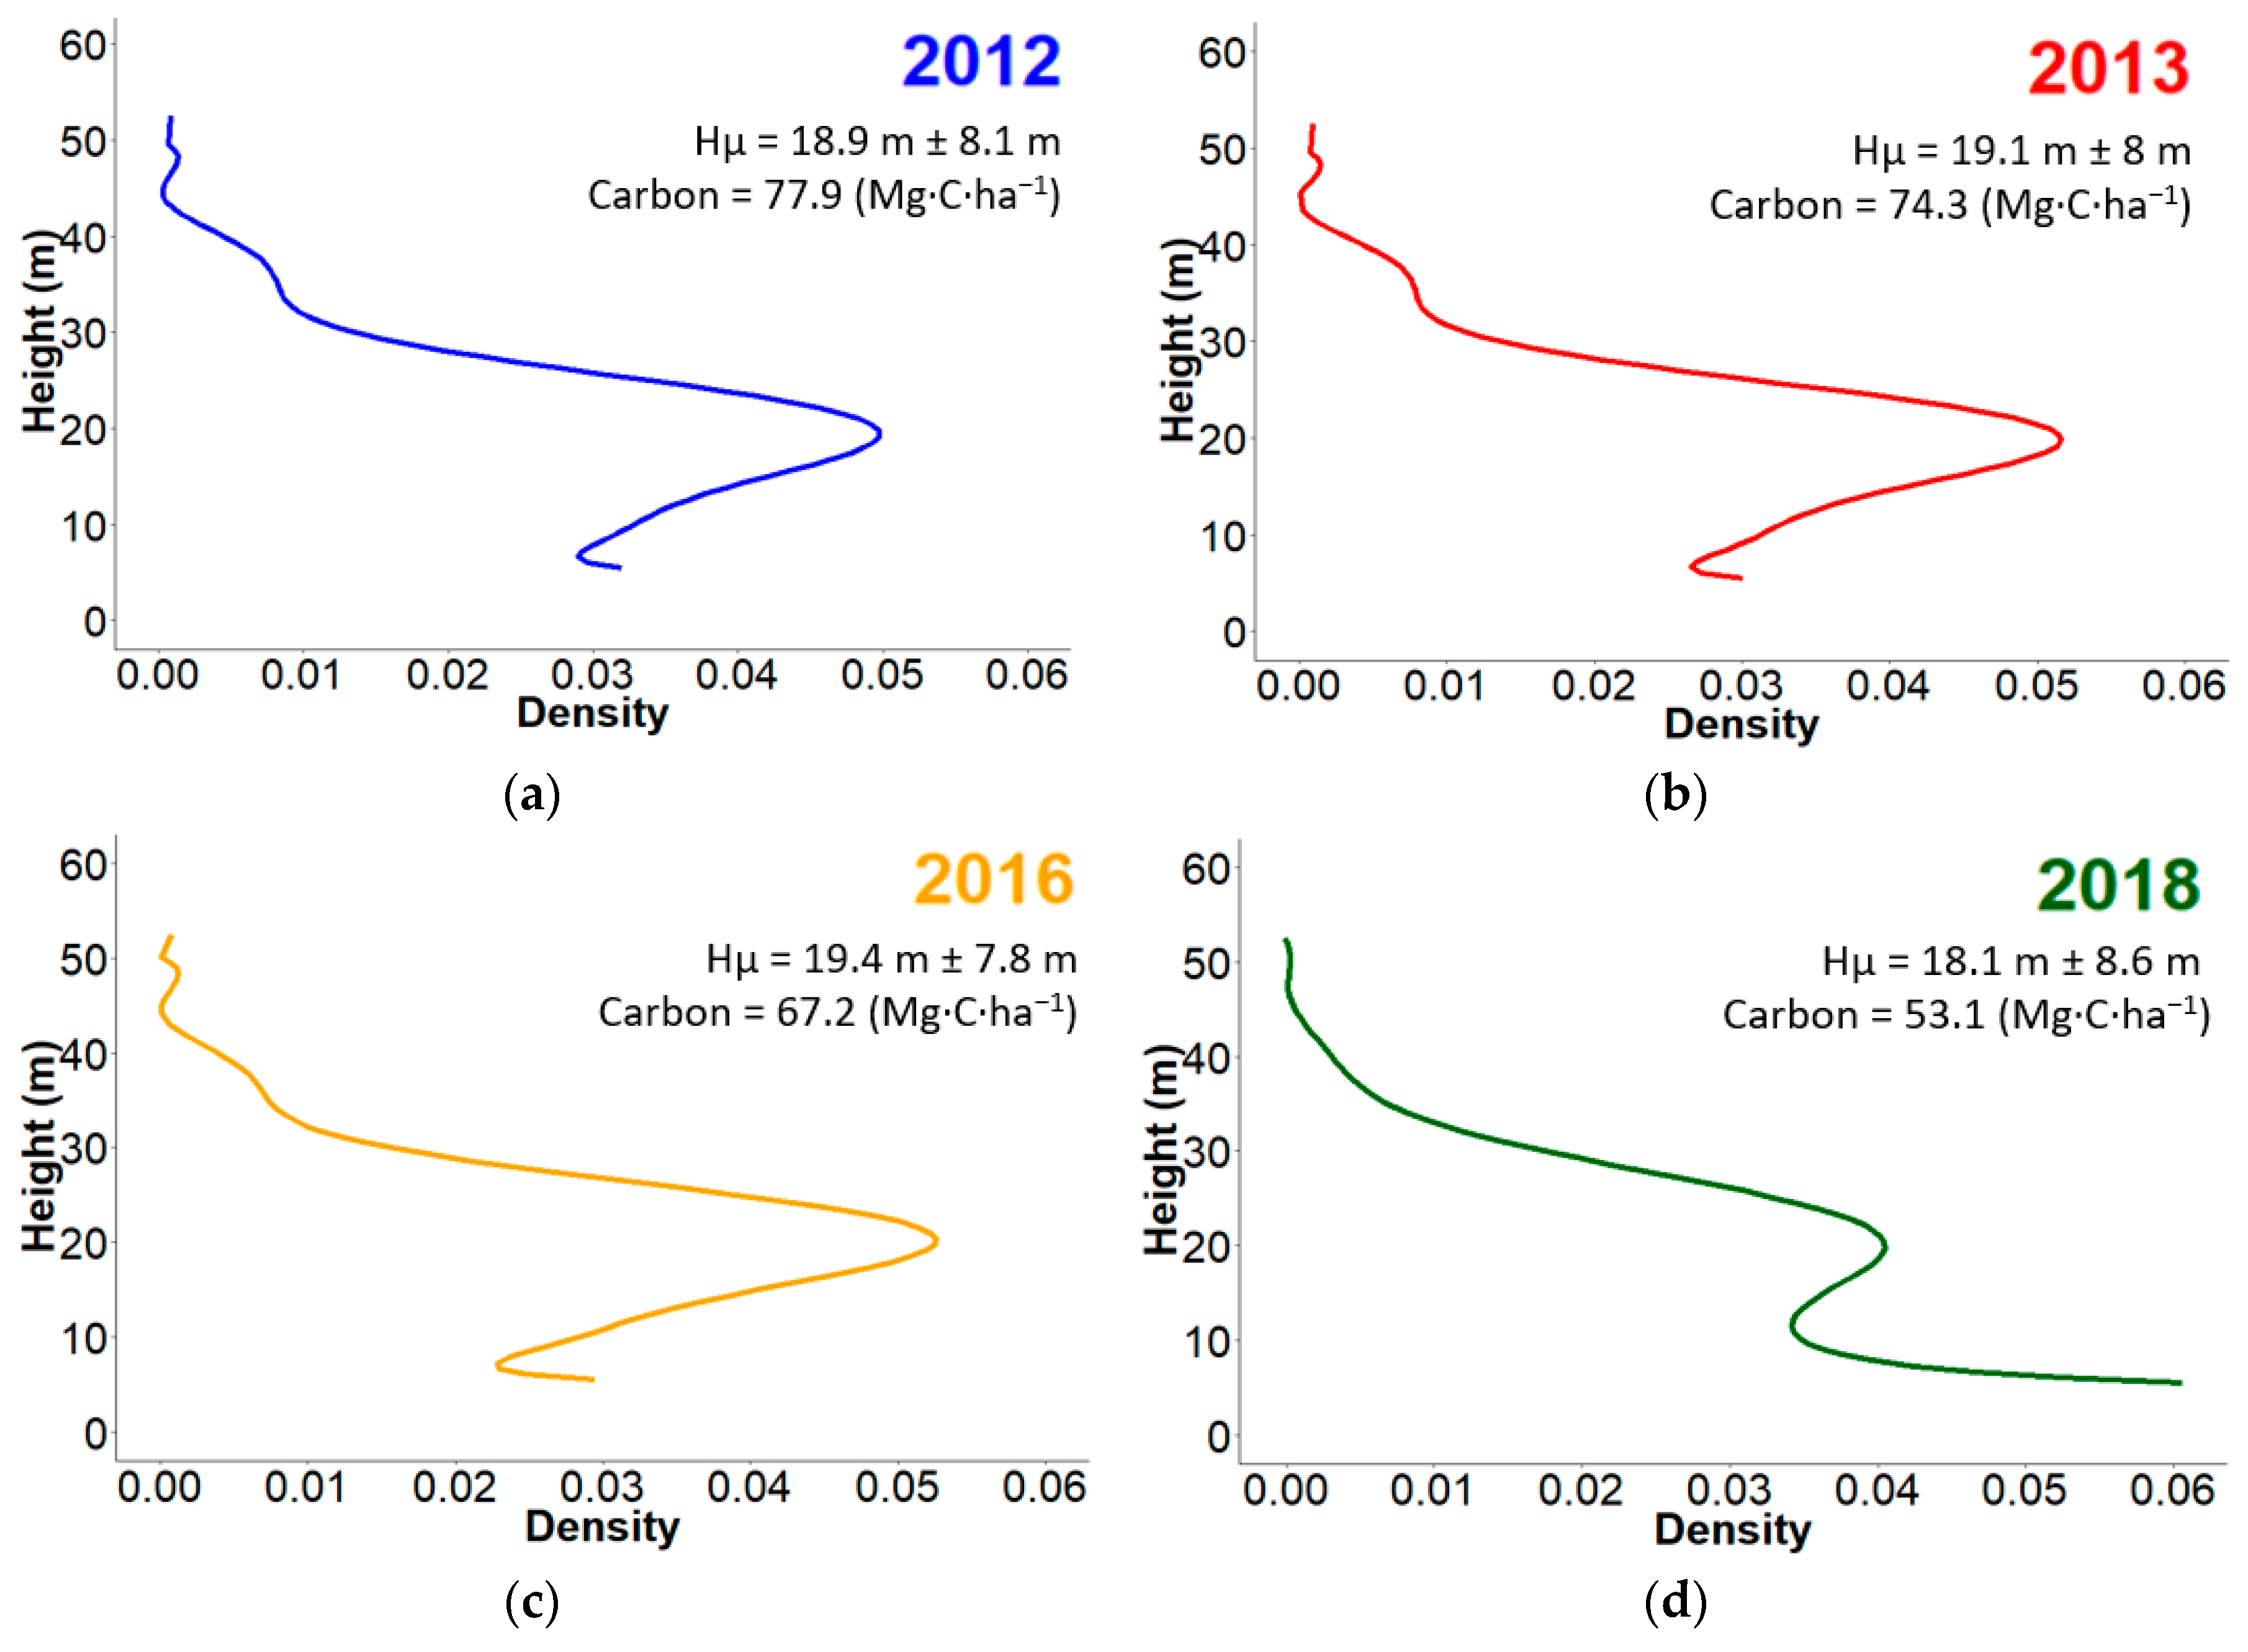
Figure 1. Location of the study area in the Pará state, Brazil and the multi-temporal Light Detection and Ranging (LiDAR) flights (left). The inset presents a zoom on the Canopy Height Model (CHM) for 2018, showing the distribution and spatial variation in terms of canopy height across the human-modified tropical forest (HMTF). Below the inset, a sample of a three-dimension image of the CHM is shown.
Remotesensing 12 00430 g001
Figure 2. Vertical distribution of canopy elements derived from LiDAR CHM for (a) 2012, (b) 2013, (c) 2016, and (d) 2018. Mean canopy height and standard deviation are shown for each year, as well as the Aboveground Carbon Density (ACD).
Remotesensing 12 00430 g002
Figure 3. The scatter plots on the top shows the correlation between changes in height and changes in carbon for the periods analyzed (a). The coefficient of determination (R2) and the relative standard error (RSE) is presented for each period. Figure (b) shows the relative uncertainty, in which data were randomly selected across all the years analyzed. This approach was used to demonstrate the spread of the distribution around its expected value. The red line is the loess trends fit to the relation between ΔCarbon and ΔHeight. The equation, R2, and RSE are also shown in the plot.
Remotesensing 12 00430 g003
Figure 4. Example of forest dynamics showing temporal changes in LiDAR CHM for a small area (6.1 ha) within the limits of the HMTF. The CHM image for all the years is presented in (a). The forest dynamics, described by changes in CHM using 2012 as a base year, is shown in (b). Notable differences are expressed in (b), especially for the apparent loss of large canopies between 2012 and 2018.
Remotesensing 12 00430 g004
Figure 5. Frequency distribution of pixel counts of gains and losses in (a) net height and (b) net carbon density for different time intervals in the HMTF area. Each color represents a period and all the values are normalized by the respective time interval. The dashed line separates the positive (gain) and negative (loss) values.
Remotesensing 12 00430 g005
Figure 6. Average changes in aboveground forest carbon stocks within classes of height changes between years for all the LiDAR data intervals. These changes in height indicate how many meters any tree canopy area gained or lost on average during the period analyzed. It also shows the mean canopy height (value below and above the red and green bars, respectively) that have undergone some change in the canopy (in terms of gain and loss). In this way, we detected, on average, the height of the trees that were more severely affected by losses. The grey bars represent the frequency in which we found the results, measured by the number of pixels.
Remotesensing 12 00430 g006
Table 1. Comparison of the estimated gain and losses in carbon and tree height for all the time intervals analyzed. Percentage of areas of gain and loss are provided. Net height and net carbon are also presented for each period.
Period (Years)Area (%)CHM Gain (m·yr−1)Carbon Gain (Mg·C·ha·yr−1)Area (%)CHM Loss (m·yr−1)Carbon Loss (Mg·C·ha·yr−1)Net Height (m·yr−1) Net Carbon (Mg·C·ha·yr−1)
1 year (2012–2013)56.31.22 ± 1.34.0743.6−1.72 ± 2.3−5.28−0.50−1.20
4 years (2012–2016)56.80.52 ± 0.41.4743.1−0.97 ± 1.2−2.40−0.45−0.83
6 years (2012–2018)47.90.47 ± 0.31.0452.0−1.24 ± 1.1−3.04−0.77−2.00
Average Net −0.57−1.34

