Evaluation and Application of Satellite Precipitation Products in Studying the Summer Precipitation Variations over Taiwan


Abstract
:
1. Introduction
2. Data and Methods
2.1. Data
2.2. Statistical Methods Applied for Comparison
3. Results
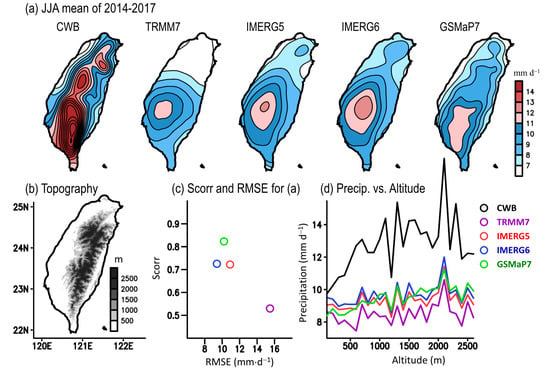
3.1. Mean Status
3.2. Day-to-Day and Interannual Variation
3.3. Diurnal Variation
- The first EOF mode of the CWB data explains about 62.6% of the total variability of diurnal precipitation. Among the four SPPs, IMERG6 (GSMaP7) has the number of percentage more (less) close to the CWB data.
- Spatially (Figure 5a), the first EOF mode of the CWB data shows two maximum centers: one in central-west Taiwan and the other in northern Taiwan. For the SPPs, all of them are able to show two maximum centers in Figure 5a. However, the locations of the maximum centers in GSMaP7 are apparently shifted to the west compared to the CWB data.
- Temporally (Figure 5b), the first EOF mode of the CWB data shows the timing of diurnal precipitation maximum occurred between 15–18 h. For the SPPs, all of them are able to capture similar feature in Figure 5b, even though their amplitudes of diurnal variation are weaker than the CWB data. Among the four SPPs, GSMaP7 underestimates the most in the amplitude of diurnal variation of precipitation.
3.4. Potential Applications
4. Discussions
5. Conclusions
Author Contributions
Funding
Acknowledgments
Conflicts of Interest
References
- Huffman, G.J.; Bolvin, D.T.; Neklin, E.J.; Wolff, D.B.; Adler, R.F.; Gu, G.J.; Hong, Y.; Bowman, K.P.; Stocker, E.F. The TRMM Multisatellite Precipitation Analysis (TMPA): Quasi-global, multiyear, combined-sensor precipitation estimates at fine scales. J. Hydrometeorol. 2007, 8, 38–55. [Google Scholar] [CrossRef]
- Hou, A.Y.; Kakar, R.K.; Neeck, S.; Azarbarzin, A.A.; Kummerow, C.D.; Kojima, M.; Oki, R.; Nakamura, K.; Iguchi, T. The Global Precipitation Measurement Mission. Bull. Am. Meteor. Soc. 2014, 95, 701–722. [Google Scholar] [CrossRef]
- Huffman, G.J.; Bolvin, D.T.; Nelkin, E.J.; Stocker, E.F.; Tan, J. V06 IMERG Release Notes; NASA/GSFC: Greenbelt, MD, USA, 2019.
- Mega, T.; Ushio, T.; Takahiro, M.; Kubota, T.; Kachi, M.; Oki, R. Gauge-Adjusted Global Satellite Mapping of Precipitation. IEEE Trans. Geosci. Remote Sens. 2019, 57, 1928–1935. [Google Scholar] [CrossRef]
- Tian, Y.; Peters-Lidard, C.D.; Choudhury, B.J.; Garcia, M. Multitemporal Analysis of TRMM-Based Satellite Precipitation Products for Land Data Assimilation Applications. J. Hydrometeorol. 2007, 8, 1165–1183. [Google Scholar] [CrossRef]
- Libertino, A.; Sharma, A.; Lakshmi, V.; Claps, P. A global assessment of the timing of extreme rainfall from TRMM and GPM for improving hydrologic design. Environ. Res. Lett. 2016, 11, 5. [Google Scholar] [CrossRef]
- Sungmin, O.; Foelsche, U.; Kirchengast, G.; Fuchsberger, J.; Tan, J.; Petersen, W.A. Evaluation of GPM IMERG Early, Late, and Final rainfall estimates using WegenerNet gauge data in southeastern Austria. Hydrol. Earth Syst. Sci. 2017, 21, 6559–6572. [Google Scholar] [CrossRef] [Green Version]
- Lu, D.; Yong, B. Evaluation and Hydrological Utility of the Latest GPM IMERG V5 and GSMaP V7 Precipitation Products over the Tibetan Plateau. Remote Sens. 2018, 10, 2022. [Google Scholar] [CrossRef] [Green Version]
- Wang, C.; Tang, G.; Han, Z.; Guo, X.; Hong, Y. Global intercomparison and regional evaluation of GPM IMERG Version-03, Version-04 and its latest Version-05 precipitation products: Similarity, difference and improvements. J. Hydrol. 2018, 564, 342–356. [Google Scholar] [CrossRef]
- Lu, X.Y.; Tang, G.Q.; Wang, X.Q.; Liu, Y.; Ji, L.H.; Xie, G.H.; Li, S.; Zhang, Y.X. Correcting GPM IMERG precipitation data over the Tianshan Mountains in China. J. Hydrol. 2019, 575, 1239–1252. [Google Scholar] [CrossRef]
- Mazzoglio, P.; Laio, F.; Balbo, S.; Boccardo, P.; Disabato, F. Improving an Extreme Rainfall Detection System with GPM IMERG data. Remote Sens. 2019, 11, 677. [Google Scholar] [CrossRef] [Green Version]
- Salles, L.; Frédéric, S.; Roig, H.; Almeida, T.; Olivetti, D.; Ferreira, W. Seasonal effect on spatial and temporal consistency of the new GPM-based IMERG-v5 and GSMaP-v7 satellite precipitation estimates in Brazil’s central plateau region. Water 2019, 11, 668. [Google Scholar] [CrossRef] [Green Version]
- Prakash, S.; Mitra, A.K.; Pai, D.S.; AghaKouchak, A. From TRMM to GPM: How well can heavy rainfall be detected from space? Adv. Water Resour. 2016, 88, 1–7. [Google Scholar] [CrossRef]
- Tan, M.L.; Duan, Z. Assessment of GPM and TRMM Precipitation Products over Singapore. Remote Sens. 2017, 9, 720. [Google Scholar] [CrossRef] [Green Version]
- Derin, Y.; Anagnostou, E.; Berne, A.; Borga, M.; Boudevillain, B.; Buytaert, W.; Chang, C.-H.; Chen, H.; Delrieu, G.; Hsu, Y.C.; et al. Evaluation of GPM-era Global Satellite Precipitation Products over Multiple Complex Terrain Regions. Remote Sens. 2019, 11, 2936. [Google Scholar] [CrossRef] [Green Version]
- Sahlu, D.; Nikolopoulos, E.I.; Moges, S.A.; Anagnostou, E.N.; Hailu, D. First evaluation of the day-1 IMERG over the upper Blue Nile Basin. J. Hydrometeorol. 2016, 17, 2875–2882. [Google Scholar] [CrossRef]
- Tang, G.; Zeng, Z.; Long, D.; Guo, X.; Yong, B.; Zhang, W.; Hong, Y. Statistical and Hydrological Comparisons between TRMM and GPM Level-3 Products over a Midlatitude Basin: Is Day-1 IMERG a Good Successor for TMPA 3B42V7? J. Hydrometeorol. 2016, 17, 121–137. [Google Scholar] [CrossRef]
- Tan, M.L.; Santo, H. Comparison of GPM IMERG, TMPA 3B42 and PERSIANN-CDR satellite precipitation products over Malaysia. Atmos. Res. 2017, 202, 63–76. [Google Scholar] [CrossRef]
- Xu, R.; Tian, F.; Yang, L.; Hu, H.; Lu, H.; Hou, A. Ground validation of GPM IMERG and TRMM 3B42V7 rainfall products over southern Tibetan Plateau based on a high-density rain-gauge network. J. Geophys. Res. Atmos. 2017, 122, 910–924. [Google Scholar] [CrossRef]
- Jiang, S.; Ren, L.; Xu, C.Y.; Yong, B.; Yuan, F.; Liu, Y.; Yang, X.; Zeng, X. Statistical and hydrological evaluation of the latest Integrated Multi-satellitE Retrievals for GPM (IMERG) over a midlatitude humid basin in South China. Atmos. Res. 2018, 214, 418–429. [Google Scholar] [CrossRef]
- Jiang, L.G.; Bauer-Gottwein, P. How do GPM IMERG precipitation estimates perform as hydrological model forcing? Evaluation for 300 catchments across Mainland China. J. Hydrol. 2019, 572, 486–500. [Google Scholar] [CrossRef]
- Wu, Y.; Zhang, Z.; Huang, Y.; Jin, Q.; Chen, X.; Chang, J. Evaluation of the GPM IMERG v5 and TRMM 3B42 v7 Precipitation Products in the Yangtze River Basin, China. Water. 2019, 10, 1459. [Google Scholar] [CrossRef] [Green Version]
- Chen, S.Y.; Huang, W.R. Evaluation on the performance of TRMM, CMORPH, and PERSIANN in depicting the diurnal precipitation variation in Taiwan. Atmos. Sci. 2017, 45, 167–191. (In Chinese) [Google Scholar]
- Huang, W.R.; Chang, Y.H.; Liu, P.Y. Assessment of IMERG precipitation over Taiwan at multiple timescales. Atmos. Res. 2018, 214, 239–249. [Google Scholar] [CrossRef]
- Kishtawal, C.M.; Krishnamurti, T.N. Diurnal variation of summer rainfall over Taiwan and its detection using TRMM observations. J. Appl. Meteor. Climatol. 2001, 40, 331–344. [Google Scholar] [CrossRef]
- Yeh, N.C.; Chuang, Y.C.; Peng, H.S.; Hsu, K.L. Bias Adjustment of Satellite Precipitation Estimation Using Ground-Based Observation: Mei-Yu Front Case Studies in Taiwan. Asia-Pac. J. Atmos. Sci. 2019. [Google Scholar] [CrossRef] [Green Version]
- Gelaro, R.; McCarty, W.; Suárez, M.J.; Todling, R.; Molod, A.; Takacs, L.; Randles, C.A.; Darmenov, A.; Bosilovich, M.G.; Reichle, R.; et al. The Modern-Era Retrospective Analysis for Research and Applications, Version 2 (MERRA-2). J. Clim. 2017, 30, 5419–5454. [Google Scholar] [CrossRef]
- Tan, J.; Huffman, G.J. Computing Morphing Vectors for Version 06 IMERG; NASA/GSFC: Greenbelt, MD, USA, 2019.
- Ushio, T.; Sasashige, K.; Kubota, T.; Shige, S.; Okamoto, K.; Aonashi, K.; Inoue, T.; Takahashi, N.; Iguchi, T.; Kachi, M.; et al. A Kalman filter approach to the Global Satellite Mapping of Precipitation (GSMaP) from combined passive microwave and infrared radiometric data. J. Meteorol. Soc. Jpn. 2009, 87A, 137–151. [Google Scholar] [CrossRef] [Green Version]
- Huang, W.R.; Chang, Y.H.; Cheng, C.T.; Hsu, H.H.; Tu, C.Y.; Kitoh, A. Summer Convective Afternoon Rainfall Simulation and Projection using WRF Driven by Global Climate Model. Part I: Over Taiwan. Terr. Atmos. Ocean. 2016, 27, 659–671. [Google Scholar] [CrossRef] [Green Version]
- Cressman, G.P. An operational objective analysis system. Mon. Weather Rev. 1959, 87, 367–374. [Google Scholar] [CrossRef]
- Hong, J.S.; Cao, J.H. Objective analysis of the rain gauge observations by using the Cressman analysis method. Atmos. Sci. 2011, 39, 201–213. (In Chinese) [Google Scholar]
- Huffman, G.J.; Bolvin, D.T.; Braithwaite, D.; Hsu, K.; Joyce, R.; Kidd, C.; Nelkin, E.J.; Sorooshian, S.; Tan, J.; Xie, P. Algorithm Theoretical Basis Document (ATBD) Version 5.1: NASA Global Precipitation Measurement (GPM) Integrated Multi-SatellitE Retrievals for GPM (IMERG); NASA/GSFC: Greenbelt, MD, USA, 2017.
- Kubota, T.; Shige, S.; Hashizume, H.; Ushio, T.; Aonashi, K.; Kachi, M.; Okamoto, K. Global precipitation map using satellite-borne microwave radiometers by the GSMaP Project: Production and validation. IEEE Trans. Geosci. Remote Sens. 2007, 45, 2259–2275. [Google Scholar] [CrossRef]
- Wilks, D.S. Statistical Methods in the Atmospheric Sciences, 1st ed.; Academic Press: Cambridge, MA, USA, 1995; p. 467. [Google Scholar]
- Wang, C. On the Calculation and Correction of Equitable Threat Score for Model Quantitative Precipitation Forecasts for Small Verification Areas: The Example of Taiwan. Weather Forecast. 2014, 29, 788–798. [Google Scholar] [CrossRef]
- Wang, C.; Kung, C.; Lee, C.; Chen, T.J. Development and Evaluation of Mei-Yu Season Quantitative Precipitation Forecasts in Taiwan River Basins Based on a Conceptual Climatology Model. Weather Forecast. 2012, 27, 586–607. [Google Scholar] [CrossRef]
- Wang, C.; Huang, S.; Chen, S.; Chang, C.; Tsuboki, K. Cloud-Resolving Typhoon Rainfall Ensemble Forecasts for Taiwan with Large Domain and Extended Range through Time-Lagged Approach. Weather Forecast. 2016, 31, 151–172. [Google Scholar] [CrossRef]
- Yang, T.H.; Yang, S.C.; Ho, J.Y.; Lin, G.F.; Hwang, G.D.; Lee, C.S. Flash flood warnings using the ensemble precipitation forecasting technique: A case study on forecasting floods in Taiwan caused by typhoons. J. Hydrol. 2015, 520, 367–378. [Google Scholar] [CrossRef]
- Levizzani, V.; Bauer, P.; Turk, F.J. Measuring Precipitation from Space: EURAINSAT and the Future; Springer Netherlands: Heidelberg, Germany, 2007; p. 724. [Google Scholar]
- Hannachi, A.; Jolliffe, I.; Stephenson, D. Empirical orthogonal functions and related techniques in atmospheric science: A review. Int. J. Climatol. 2007, 27, 1119–1152. [Google Scholar] [CrossRef]
- Shige, S.; Kida, S.; Ashiwake, H.; Kubota, T.; Aonashi, K. Improvement of TMI rain retrievals in mountainous areas. J. Appl. Meteor. Climatol. 2013, 52, 242–254. [Google Scholar] [CrossRef] [Green Version]
- Sun, Q.; Miao, C.; Duan, Q.; Ashouri, H.; Sorooshian, S.; Hsu, K.L. A review of global precipitation data sets: Data sources, estimation, and intercomparisons. Rev. Geophys. 2018, 56, 79–107. [Google Scholar] [CrossRef] [Green Version]
- Teo, C.-K.; Koh, T.-Y.; Lo, J.; Bhatt, B. Principal Component Analysis of Observed and Modeled Diurnal Rainfall in the Maritime Continent. J. Clim. 2011, 24, 4662–4675. [Google Scholar] [CrossRef]
- Huang, W.R.; Wang, S.S.-Y. Future changes in propagating and non-propagating diurnal rainfall over East Asia. Clim. Dyn. 2017, 49, 375–389. [Google Scholar] [CrossRef] [Green Version]
- Huang, W.R.; Chang, Y.H. Characteristics and mechanisms of the diurnal variation of winter precipitation in Taiwan. Int. J. Climatol. 2018, 38, 3058–3068. [Google Scholar] [CrossRef]
- Tan, J.; Huffman, G.J.; Bolvin, D.T.; Nelkin, E.J. Diurnal Cycle of IMERG V06 Precipitation. Geophys. Res. Lett. 2019, 46, 13584–13592. [Google Scholar] [CrossRef]
- Derin, Y.; Yilmaz, K.K. Evaluation of Multiple Satellite-Based Precipitation Products over Complex Topography. J. Hydrometeor. 2014, 15, 1498–1516. [Google Scholar] [CrossRef] [Green Version]
- Wang, Z.; Duan, A.; Yang, S.; Ullah, K. Atmospheric moisture budget and its regulation on the variability of summer precipitation over the Tibetan Plateau. J. Geophys. Res. Atmos. 2016, 122, 614–630. [Google Scholar] [CrossRef]
- Chen, J.; Bordoni, S. Intermodel spread of East Asian summer monsoon simulations in CMIP5. Geophys. Res. Lett. 2014, 41, 1314–1321. [Google Scholar] [CrossRef] [Green Version]
- Prasanna, V.; Annamalai, H. Moist dynamics of extended monsoon breaks over South Asia. J. Clim. 2012, 25, 3810–3831. [Google Scholar] [CrossRef]
- Unnikrishnan, C.K.; Rajeevan, M. Atmospheric water budget over the South Asian summer monsoon region. Meteorol. Atmos. Phys. 2018, 130, 175–190. [Google Scholar] [CrossRef]


| TRMM7 | IMERG5 | IMERG6 | GSMaP7 | |
|---|---|---|---|---|
| Spatial Resolution | 0.25° × 0.25° | 0.1° × 0.1° | 0.1° × 0.1° | 0.1° × 0.1° |
| Temporal Resolution | 3 Hour | Half Hour | Half Hour | Hour |
| Coverage | 50°S–50°N | 60°S–60°N | 60°S–60°N | 60°S–60°N |
| Period | 1998/1–2019/10 | 2014/3–2018/6 | 2000/6–present | 2014/3–present |
| TRMM7 | IMERG5 | IMERG6 | GSMaP7 | |
|---|---|---|---|---|
| Scorr for Figure 5a | 0.83 | 0.88 | 0.89 | 0.74* |
| RMSE for Figure 5a | 0.17 | 0.16 | 0.14 | 0.20* |
| Tcorr for Figure 5b | 0.92 | 0.94 | 0.94 | 0.85* |
| RMSE for Figure 5b | 0.26 | 0.24 | 0.23 | 0.35* |
| TRMM7 | IMERG5 | IMERG6 | GSMaP7 | |
|---|---|---|---|---|
| Scorr for Figure 8a | 0.78 | 0.82 | 0.84 | 0.54* |
| RMSE for Figure 8a | 12.08 | 8.82 | 8.48 | 21.08* |
| Scorr for Figure 8b | 0.74 | 0.79 | 0.83 | 0.69* |
| RMSE for Figure 8b | 8.28 | 7.67 | 6.92 | 12.67* |
© 2020 by the authors. Licensee MDPI, Basel, Switzerland. This article is an open access article distributed under the terms and conditions of the Creative Commons Attribution (CC BY) license (http://creativecommons.org/licenses/by/4.0/).
Share and Cite
Huang, W.-R.; Liu, P.-Y.; Chang, Y.-H.; Liu, C.-Y. Evaluation and Application of Satellite Precipitation Products in Studying the Summer Precipitation Variations over Taiwan. Remote Sens. 2020, 12, 347. https://doi.org/10.3390/rs12030347
Huang W-R, Liu P-Y, Chang Y-H, Liu C-Y. Evaluation and Application of Satellite Precipitation Products in Studying the Summer Precipitation Variations over Taiwan. Remote Sensing. 2020; 12(3):347. https://doi.org/10.3390/rs12030347
Chicago/Turabian StyleHuang, Wan-Ru, Pin-Yi Liu, Ya-Hui Chang, and Chian-Yi Liu. 2020. "Evaluation and Application of Satellite Precipitation Products in Studying the Summer Precipitation Variations over Taiwan" Remote Sensing 12, no. 3: 347. https://doi.org/10.3390/rs12030347