Article

Sentinel-1 Data for Underground Processes Recognition in Bucharest City, Romania

1
Groundwater Engineering Research Center, Technical University of Civil Engineering Bucharest, 020396 Bucharest, Romania
2
Romanian Space Agency, 010362 Bucharest, Romania
3
Geological Survey of Norway, 7491 Trondheim, Norway
*
Author to whom correspondence should be addressed.
Remote Sens. 2020, 12(24), 4054; https://doi.org/10.3390/rs12244054
Submission received: 29 September 2020 / Revised: 4 December 2020 / Accepted: 5 December 2020 / Published: 11 December 2020
(This article belongs to the Special Issue Applications of SAR Images for Urban Areas)

Abstract

:
Urban areas are strongly influenced by the different processes affecting the underground and implicitly the terrestrial surface. Land subsidence can be one of the effects of the urban processes. The identification of the vulnerable areas of the city, prone to subsidence, can be of great help for a sustainable urban planning. Using Sentinel-1 data, by the PSI (persistent scatterer interferometry) technique, a vertical displacements map of Bucharest city has been prepared. It covers the time interval 2014–2018. Based on this map, several subsidence areas have been identified. One of them, holding a thick layer of debris from urban constructions, was analyzed in detail, on the basis of an accurate local geological model and by correlating the local displacements with the urban groundwater system hydraulic heads. The properties of the anthropogenic layer have been characterized by complementary geotechnical and hydrogeological studies. A dynamic instability pattern, highlighted by PSI results, has been put into evidence when related to this type of anthropogenic layer. This thick anthropogenic layer and its connections to the urban aquifer system have to be further analyzed, when the procedures of urban planning and design invoke constructive operations modifying the aquifer dynamics.

Graphical Abstract

1. Introduction

In the context of continuous urban development and population growth, urban areas are strongly influenced by the different processes affecting the underground and implicitly the terrestrial surface [1,2,3,4,5,6,7]. One of these is the groundwater flow when considering its interaction with the urban environment [5,8,9]. In many cases, mostly because of the groundwater pumping, the effect triggering land subsidence can be observed at the ground surface [1,10,11,12,13,14,15,16]. On an extensive scale, the vertical displacements of the ground surface integrate different hydrological, hydrogeological, geological, geotechnical phenomena, as well as other anthropogenic interventions [9,17,18,19]. To study these, in specific urban areas located on alluvial deposits, features of different domains might be considered, among which (a) the surface water resources, their urban adaptation, and precipitations influence; (b) the geology including an accurate lithological and stratigraphic analysis as well as the related geotechnical parameters (e.g., thickness, compressibility) [19]; (c) types of aquifers and their connection to the surface waters as well as the correspondent volumes of groundwater pumping; (d) the behavior of constructions, foundations, and other infrastructure elements [3,20,21,22,23]; (e) the tectonic activity [24,25] and others.
Land subsidence can, in many cases, be underrated. If it is associated with other severe natural or anthropogenic phenomena, it can lead to serious infrastructure damages [11], threat to human life or loss of historical or strategic infrastructures [23,24]. Consequently, the identification of the vulnerable areas in the city, prone to subsidence, can be of great support for sustainable urban planning [6]. Monitoring of vulnerable large urban areas for ground displacements was not possible until recent decades, as the available methods consisted of punctual in-situ measurements, implying a heavy demand of equipment, time, and human resources [26,27,28]. Space-borne remote sensing techniques, and more specifically the Synthetic Aperture Radar Interferometry (InSAR) techniques, made possible regional land monitoring, allowing the identification of new unknown areas susceptible of land subsidence [27]. The best monitoring solutions are considering the combination between monitoring techniques and complementary data characterizing the studied area [28]. Thus, different monitoring combinations were set up for characterizing natural and anthropic land subsidence worldwide [3,18,19,25].
Bucharest, the capital of Romania, is a dynamic city with a growing population of over 2.1 million in 2019 and a surface area of about 240 km2 [29]. Both the population and surface coverage are expanding. There is a great deal of infrastructure under development. This is generating changes in the subsurface and consequently affecting the surface [8]. Bucharest is situated in the south-eastern part of Romania, in the central part of the Moesic platform [30]. It is crossed by two modified rivers: Dambovita River which was channelized in 1883 and further in the late 1970s, and Colentina River which was remodeled in a series of lakes connected with the shallow aquifer [31], as illustrated by Figure 1.
From the hydrogeological point of view, the city of Bucharest lies on a Quaternary sedimentary aquifer system composed by three units [8,30]. The shallow and unconfined aquifer have a direct interaction with the urban infrastructure elements. It is mainly made of gravel and sands. This unit is covered by another aquitard unit known as ‘superficial deposits’. Between the shallow and the middle aquifer unit is located a clayey aquitard called ‘intermediary deposits’. The middle confined aquifer unit, found at depths between 20–50 m, is mainly made of sandy materials. The two aquifer layers could be considered as belonging to the same urban aquifer system as they sporadically communicate hydraulically through geological openings or improper executed boreholes or wells. Moreover, deep infrastructure elements could activate new hydraulic contacts. The deepest Quaternary aquifer strata is separated from the urban aquifer system by a sequence of marl and clay layers, with slim sandy intercalations, having a thickness from 110 m in the north to about 40 m to the south [8]. Groundwater abstraction from the shallow aquifer was ended in 2000. Lately, the uncontrolled number of permanent or temporary dewatering systems increased tremendously. Infrastructure changes at the surface and in the subsurface of Bucharest, due to city growth, has changed and disturbed the groundwater recharge and flow [8]. These continous changes have triggered subsidence in distinct parts of the city.
Previous studies, which used multi-temporal radar interferometry techniques (MTI) [32,33,34] revealed several areas proving ground instability. In Bucharest city, identified mechanisms of ground surface displacement regroups [34,35] ‘natural long-term trends’ overlaid by ‘short-term patterns’ trigerred especially by recent city dynamics. Long-term ground deformation patterns of Bucharest have been accurately studied by Armas et al. (2017) [35] by using multitemporal InSAR and multivariate dynamic analyses, developing a comparative analysis with the evolution trends of their neighboring areas for old large industrial parks. Most of short-term patterns include geotechnical and hydrogeological aspects and are due to inadequately studied athropogenic ground disturbances of soil matrix or urban hydrogeological systems. Consequently, they trigger significant damage of existing underground and above-ground structures [36], local floods, damage to sites of historical interest, drying of supply wells or penetration of pollutants into deep aquifers.
The construction of subway stations, deep basements, underground parking lots, sewerage or water supply infrastructure works, requires the execution of groundwater depletion or drainage works [6,20]. These can most often be temporary (during the execution of the work) or permanent (for example to prevent seepage as well as the occurrence of underpressures) [20]. Problems that may occur when carrying out depletion or drainage work include risks related to soil mechanical effects (e.g., hydrodynamic entrainment), hydraulic rupture of the excavation base and differentiated settlements.
Dewatering works can cause suffosion and internal erosion as well as material losses from the slopes due to groundwater pumping in open excavations or by entraining fine particles from the ground into the wells. Consequently, these phenomena can lead to subsidence of the surrounding area and of the ground located under the adjacent buildings.
In this study, the Persistent Scatterer Interferometry (PSI) was used to analyze the trends of the ground instability in Bucharest city. For the time period 2014–2018, using the new satellite mission Sentinel-1. One selected area, named Barbu Vacarescu (Figure 1), outlined on the basis of this dataset, has been analysed in detail. The area, delineated by Lacul Tei Boulevard, Barbu Vacarescu Street, and Opanez Street as is shown in Figure 1.
A comprehensive analysis on the behavior of the anthropogenic thick layer of debris from urban constructions, situated in Barbu Vacarescu area (Figure 1), represents the focus of this study. This has been built starting from the already existing Bucharest city scale hydrogeological model, based on a 3D geological model spatially intersected with the city main infrastructure elements, as well as the local hydrogeological model covering a part of the area analyzed in this study [30]. In the scope of the current study, an accurate geological model has been developed, its necessity being outlined by the results of the PSI ground surface displacements distribution and patterns as well as the accurate image on the area groundwater dynamics revealed by the two existing models. This local geological model, including extensive complementary data on the anthropogenic layer and new acquired borehole geological and lithological information have the needed accuracy to correlate the area PSI displacements with the urban groundwater system information.
Since 2006, a pronounced decrease of the water level of the Circului Lake, located in the Barbu Vacarescu area has been observed. As this lake is naturally recharged by the upper shallow aquifer of the Bucharest city, a hydrogeological analysis of the local aquifer system behavior has been performed [37]. This area has a water supply system consisting of low-pressure pipes with a length of about 180 km. Similar to the most of the world’s cities, the groundwater recharge in Bucharest is mostly made from the water supply network losses and, in a lower percentage, from the interaction with the sewer system. In this modeling study, several urban groundwater modeling scenarios were developed to simulate Circului Lake disturbance [37,38].
The study [38], took into account the drastic reduction (Figure 2) of the water supply losses due to the improvement of the water distribution network in the study area. During 2014–2019, a decrease of the annual precipitations has been registered [39]. This also contributed to the decrease of the hydraulic head in both shallow (unconfined) and middle (confined) layers. The same study [38], put into evidence the area permanent dewatering systems installed to decrease the hydraulic head in both aquifer strata respectively the unconfined aquifer layer and the confined one. The dewatering systems are reducing the groundwater seepage into the deep foundations of the buildings.
The study [38], put into evidence that the decrease of the area groundwater hydraulic head is a consequence of several hydrological and hydraulic factors influencing the hydrological balance: climate change manifested through reduced precipitation, reduction of water supply losses, decrease of precipitation infiltration, and the presence of alleged dewatering systems. Figure 3 shows the decrease of the water level in Circului Lake between 2006 and 2015.
The measured hydraulic head decrease trend has been modeled [37], the results of the calibrated local hydrogeological model Figure 3 being representative for the entire local aquifer behavior. It is likely that factors supporting these results, considering the decrease of the groundwater level in the area, were anthropogenic as well as natural causes. As mentioned before, the reduced precipitation is one of the causes, however the strong diminishing of the water supply network losses from 0.42 m3/s in 2006 to 0.17 m3/s in 2014 represents a stronger trigger [38]. Recent punctual measurements mentioned in this paper, are proving the modeled results.
As area ground surface displacements have been observed on the basis of PSI previous investigations [32,33], the possible connection to its high groundwater dynamics has been further analyzed. Earlier studies revealed an instability trend for Barbu Vacarescu area [32], with vertical downward movement of 18.6 mm/year in the time period 1992–1999, 11.3 mm/year in the time period 2003–2009, and 13.3 mm/year in the time period 2011–2012 [33]. Looking on the different vertical displacements maps obtained for different time intervals, the instability trend is mainly given by the changes of the persistent scatterers’ location indicating the ground displacements and not by the predominance of the subsidence persistent scatterers in the bounded area. This reveals the presence of a factor prone to subsidence for specific triggers.

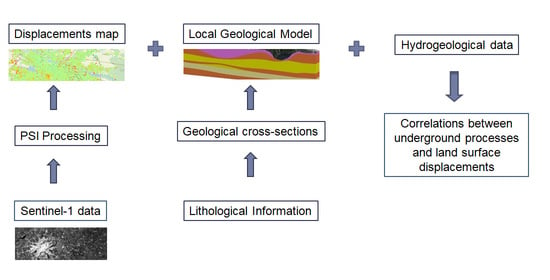
2. Materials and Methods

To demonstrate the connection between the urban aquifer system, geological settings, and the vertical ground displacements, several datasets have been analyzed and correlated. The purpose of the analysis was to understand the main geological, hydrogeological, and geotechnical processes characterizing the area within the urban fabric context, the link between them, and their connection to the short-term ground deformation phenomenon. The analysis zone covers a slightly larger surface than the identified subsidence area (Figure 4), including Circului Park green area in southern part and western parts. The western part covers facilities of a sports club called Dinamo Sports Club and a green area named Cinema Park Floreasca.

2.1. SAR Data

In the last decades, with the launch of the Synthetic Aperture Radar (SAR), emerged missions providing long time series acquisitions and new techniques for vertical ground displacements on a centimeter–millimeter scale. The first technique was the Interferometric Synthetic Aperture Radar (InSAR) [40,41], followed by Differential InSAR (DInSAR) [17,40,42,43] and the multi-temporal differential InSAR (MTI) [15,44,45,46,47]. The basic principle of the InSAR techniques, of detecting the subtle changes at the Earth’s surface, consists in using two radar acquisitions from approximately the same position, at different time points. The phase difference between the two acquisitions indicates the magnitude of the ground displacement [48] along the line-of-sight (LOS) [49]. LOS represents the line connecting the sensor and the target from the ground [50].
On April 2014, the C-band imaging radar mission Sentinel-1, part of the European Union’s Earth Observation Program, Copernicus [51], launched its first satellite, Sentinel-1A, followed by the launch of Sentinel-1B on April 2016. The data from this mission and from the other Sentinel missions are freely and openly available on Copernicus Open Access Hub [52]. For this study, data covering the time span October 2014–April 2018 were used from an ascending and a descending orbit. Table 1 presents the technical details of these acquisitions.
The displacements map for Bucharest city were produced in this study by the Norwegian Ground Motion Service, using the data described in Table 1, by applying the standard PSI technique. This is a multi-temporal InSAR method for vertical ground displacement assessment [48]. Considering a long temporal series of more than 15–20 SAR scenes acquired over the same area, from the “n” SAR scenes, a series of “n-1” interferograms are generated, considering a master scene [54]. A set of phase stable radar targets, named persistent scatterers (PS), with smaller dimensions than the pixel resolution, are identified and are used to indicate the displacement time series [48,50,54,55,56]. One of the limitations of this method is related to the vegetated areas where, due to decorrelation, only a limited number of PS points can be identified [50].
PSI processing was done on a high-performance computing cluster (HPCC) using software developed by the KSAT-GMS partnership (NORCE-formerly NORUT, PPO.labs and Kongsberg Satellite Services) [57,58]. The used processing chain and software are those used for InSAR Norway (the Public National Norwegian Ground Motion Service, www.insar.no), based on Sentinel-1 data, as described by Dehls et al. (2019) [58]. The digital elevation model (DEM) used to remove the initial topographic phase is the SRTM v4.1. After PSI processing, time series of PS points datasets were generated, indicating the displacements in both ascending LOS and descending LOS. Some of the products generated for each PS point are: the mean displacement velocity, the time evolution of the displacement magnitude of each acquisition with respect to the reference acquisition, and the coherence. For the performed analyzes, mainly the PS points having a coherence value greater than 0.7 were used. Based on the ascending and descending geometry of the two PS points data-sets and the LOS displacements values, the vertical and horizontal (only east–west direction) components of displacements were computed, considering the approach proposed by Dalla Via et Al. (2012) [59]
De = (Dd cosθa − Da cosθd)/sin(θa + θd)
Dv = (Dd sinθa + Da sinθd)/sin(θa + θd)
where De is the horizontal displacement, Dv is the vertical displacement, Dd is the descending LOS displacement, Da is the ascending LOS displacement, and θa and θd are the look angles for both orbits modes.
For the combination of ascending and descending PS points, the nearest neighbor vector approach was used [60]. For each PS point from the ascending orbit, the nearest spatial PS point from the descending orbit was assigned. After the join between the two data-sets, the horizontal and vertical displacements were computed using Equation 1. The approach was based on GIS softwares, using tools and functionalities of the ESRI’s ArcMap software package and of the free and open source QGIS software.

2.2. Development of the Urban Geological Model for the Study Area

A better understanding of the local geology in relationship to the urban infrastructure (anthropogenic layers, deep foundations, tunnels, excavations, and others) could have been achieved only by generating an accurate local geological model for the study zone (Figure 4). As geological information framework, has been used a data-set coming from an interdisciplinary research project that set up the concept and a first realisation of the hydrogeological model of the entire Bucharest city [61]. Data and knowledge have been acquired with the collaboration of different institutions, companies and experts [61]. The city-scale 3D geological model has been developed, after compiling about 1800 boreholes, by stratigraphical litho-correlation using in-house research software [62]. It focuses the Quaternary sedimentary deposits of the first 70 m below ground level and it was used to identify, delineate, and describe the existing hydrogeological units composing the urban aquifer system. Pumping tests and grain size distribution analysis have been performed to hydraulically characterize these units.
To develop the local Barbu Vacarescu urban geological model (1200 × 1200 m), additional data acquisition steps have been achieved focusing mainly the characterisation of the anthropogenic layer and the 3D delineation of a massive clay shallow strata. Then, a local scale geological interpretation on the basis of the borehole logs description of the old and new identified wells has been performed to generate a local high-accuracy model. The operational steps were the folowing:
  • Collection of data consisting of lithological information from 16 boreholes with depths from 15 m up to 170 m; the 3D position of the boreholes was precisely measured;
  • After analyzing the lithological and stratigraphical information of the boreholes, six geological cross-sections were generated, based on a digital elevation model (DEM) of the area;
  • From the geological cross-sections, suplimentary interpolation points were used to generate the geological model;
  • The structural units of the Quaternary deposits have been identified to generate the geological model.
Figure 5 presents one of the geological cross-sections used to generate the geological model. It crosses the area of interest from the southwest to northeast, through three boreholes, with depths from 29 m up to 40 m. The location of the boreholes is shown in Figure 4.
The generated local model, developed by litho-stratigraphic correlation using in-house software [62], outlines the following lithological units, from top to down (as shown by the geological cross-section from Figure 5):
  • Urban soil (anthropogenic material) layer, with depths up to approximately 12 m;
  • Clay, sandy clay, and sandy silty clay layer with thicknesses up to 10 m;
  • Sand and gravel layer with thicknesses up to 14 m;
  • Discontinuous clay layer with thicknesses up to 5.3 m;
  • Discontinuous sand and gravel layer with thicknesses up to 6 m;
  • Sand layer with thicknesses up to 12 m;
  • Clay layer with thicknesses up to 11.6 m.
The extension and the thickness of the anthropogenic material layer are well marked in the geological model and will be presented in the following sections. The anthropogenic stratum 3D geometry has been defined with a high accuracy, by using complementary hydrogeological and geotechnical studies within the geological modeling process [61,62].

2.3. Hydrogeological Data Assemblage

Hydraulic head time series were available for the Circului Park green area. The series include data corresponding to the monitoring boreholes for both shallow aquifer and middle aquifer strata. Table 2 mentions these boreholes and the corresponding monitored aquifer strata. Figure 6 illustrates the location of the monitoring boreholes in the study area. The hydraulic-head measurements cover the time period February 2013 to July 2019. A large dataset was available for 2015 by means of 15 measurement campaigns that were conducted during the entire year. All these boreholes are part of the Urban Groundwater Monitoring System (UGMS) of Bucharest city [31].
The amount of hydrogeological time series datasets, available for the study area, where relatively limited. The lack of data is specific for most of densely built urban areas as continuous data collection in urban settings is difficult and costly. Reasons come from the access in densely populated areas, vandalism, property rights of the land where the borehole is placed, and the needed human and equipment resources. Except for very specific works, where monitoring boreholes are required for certain time periods, the monitoring wells do not last over time. However, urban subsurface data collection, management, and availability are still seldom well planned. Consequently, using it in urban analysis and planning remains a challenge for many European cities.
In the middle of Circului Park, where the artificial lake is located, the boreholes are distributed around it (Figure 6). The particularity of this lake is that although it is an artificial lake, it is naturally recharged by the upper shallow aquifer.
Beside the monitoring boreholes from Circului Park, located inside Barbu Vacarescu area, one hydraulic head time series was available for a specific borehole monitoring the aquifer (TrEiff), marked in Figure 6. The monitoring period was between March 2011 and May 2016. Most of the measurements were taken between 2011 and 2012. Only one hydraulic head measurement has been taken in 2016. Data from two other boreholes situated in the vicinity of this borehole were used as complementary information.

2.4. Data Analysis

Based on the results of the vertical displacements map and on the current developed geological model, an analysis of vertical displacements and their causes has been made for the entire area as well as particularly for some specific sectors of the area. The data for the TrEiff monitoring borehole inside Barbu Vacarescu area described in Section 2.3, was recorded for a particular geotechnical study [63]. Other data collected for that study were included in this study.
As the boreholes and the PS points have different spatial distributions, to correlate the information between the vertical displacements and the hydraulic head, a buffer zone of 100 m around the boreholes was marked to delineate the PS points considered for the analysis.
Spatial analyses and final maps were made using ArcGIS software packages. For the vertical displacement maps, the stability interval was considered between −1.5 mm/year and 1.5 mm/year. The stable PS points are marked in green colour on the map. PS points indicating subsidence are marked in red colour for values higher than −3.5 mm/year and orange for values between −1.5 mm/year and −3.5 mm/year. PS points indicating the presence of positive vertical displacements are marked in dark blue for values higher than 3.5 mm/year and light blue for values between 1.5 mm/year and 3.5 mm/year.

3. Results

Considering Bucharest city and its neighborhoods, the PS points density for Sentinel-1 data for the used time span 2014–2018 is approximately 1050 PS/km2. For the specific study area, which was used for the generation of the geological model, the PS density from the Sentinel-1 data increases to 2000 PS/km2. The obtained displacements reach values between −23,7 mm/yr and +33 mm/yr, for the 131 Ascending (131A) orbit time series acquisitions, and values between −21 mm/yr and +23.3 mm/yr for the LOS 109 Descending (109D) orbit time series acquisitions. The vertical displacements computed by using data from both ascending and descending orbits reach values between −13.05 mm/yr and +17.24 mm/yr, with a mean value of −0.27 mm/yr and a standard deviation of ± 0.91 mm/yr. The datasets from the two orbits, 131A and 109D, were self-consistent.

3.1. Bucharest City Vertical Displacements Map

The vertical displacements map of Bucharest, obtained using Sentinel-1 data, could reveal different trends at city scale. Figure 7 presents the vertical displacement trends for Bucharest city and the subsidence areas which were identified in this study. Most areas show no vertical displacements. There are several areas indicating a vertical downward movement (Figure 7). There might be areas with inconsistent trends; hence, a longer temporal series is needed for an accurate interpretation.
Within the PANGEO project [32], the areas of instability for Bucharest city were identified on the basis of PSI velocity maps generated from ERS1-ERS2 and Envisat ASAR data for the time period 1992–2009. Some of these areas showed subsidence trends. Later, these instability areas were monitored in the SYRIS project, between 2011–2012 [33], and the velocity maps were enriched with a dataset from the TerraSAR-X sensor.
The current analysis revealed the existence of several areas showing the same subsidence trend as in the previous studies. The Barbu Vacarescu area is one of the areas where the subsidence trend seems to be continuous, even though the maximum annual velocities are not very high and areas with stability trend are also included (Figure 7).
Besides these above-mentioned zones, there are some areas where new buildings and underground infrastructures are currently under construction, or construction works were finished just before the beginning of the monitoring period 2014–2018. In the previous studies, these were stable and now they are affected by subsidence. A more detailed analysis of these areas, (including the building development) shows that some of them were previously stable, as observed from the PSI data. For the others, these previous studied areas were covered by vegetation making it impossible the generation of the PS points. Hence, these vegetated areas might have had a subsidence trend, generated by the beginning of the construction activity, or there might be an older problem which could not be revealed due to the previous land cover and vegetation conditions.
Based on the displacements map, a detailed analysis was made for the Barbu Vacarescu area, as shown in Figure 8. The main reasons are related to the presence of the persistent subsidence through all time periods of the available SAR data, since 1992 [32,33] and the availability of the hydrogeological, lithological, and geotechnical data which characterize this area. Considering the connections between the different processes and phenomena characterizing the subsurface, some vertical displacement patterns are highlighted.

3.2. The Barbu Vacarescu Urban Area

Barbu Vacarescu is one of the areas where subsidence has been revealed by all the existing SAR time series, since 1992 [32,33]. The distribution of the PS points can be seen in Figure 8. Velocity values for the selected area with the generated geological model are between −10.72 mm/yr (red points) and +3.88 mm/yr (blue points) with a standard deviation of ±1.11 mm/yr.

3.2.1. Subsidence Analysis of the Anthropogenic and Geological Deposits in the Barbu Vacarescu Area

The studied area is extensively covered by a deep anthropogenic stratum as it is illustrated in Figure 9. This urban soil layer is largely composed by urban waste due to the presence of a former quarry exploitation for aggregate construction material that has been later filled by other types of anthropogenic materials [32]. The former quarry exploitation was filled gradually between 1950 and 1977 [64]. A period of 10 to 15 years is the indicative consolidation time for the anthropogenic material layer having clay layer base strata [65]. Consolidation time depends also on the anthropogenic material layer thickness [65,66]. Unless the consolidation time ended and the area is considered stable, changes of the urban aquifer system dynamics or modifications of the stress state due to the building loads, foundations, tunnels, or other infrastructure elements, can induce ground displacements [66].
It can be observed that in the left side of the Barbu Vacarescu Street, the anthropogenic material layer is missing or on a small zone is very thick. The vertical ground velocity map shows this area as being a stable one. Regarding the area from the right side of the street, which also represents our area of interest, the anthropogenic material layer has thicknesses from 5 m to 11.7 m. It also fits with the presence of the PS points indicating subsidence up to −10.72 mm/yr. The southern limit of the interest area is Lacul Tei Boulevard, bordering the Circului Park (Figure 9a). In this green area, due to the presence of vegetation, only a few PSs points could be generated. It can be assumed that the park area has the same subsidence trend as the entire studied area, as the anthropogenic material layer is present in the park’s subsurface.
The trend of several PS points displacements of the analyzed area is shown by Figure 10. Both locations indicate an approximately linear tendency of subsidence with a mean annual value of −5.2 mm ± 1.4 mm and cumulative values of about–35 mm for the time span October 2014–April 2018. The high heterogeneity of the urban antropogenic material is highlighted by Figure 10 indicating that the highest level of subsidence is over an area with thick anthropogenic material, however much of that area appears to be stable.

3.2.2. Relationship between Ground Surface Displacements and the Urban Aquifer System Dynamics in the Barbu Vacarescu Area

Hydraulic-head measurements corresponding to Circului Park have been used in this study in conjunction with the vertical displacements to identify the possible connection between the urban aquifer system dynamics and the terrain surface movements. Technical details on the boreholes are presented in Section 2.3. The main steps to analyse the hydraulic head data against the vertical displacements of the Circului Park are further described. A 100 m buffer zone for the PS data was generated around each existing borehole, and a spatial query operation has been applied to identify the corresponding PS points. The buffer spatial query has been used in order to simplify the data representation. If PS points were found inside this buffer zone, the specific borehole and the corresponding PS points were included in the analysis. As for example for the boreholes PC1LC and FC1LC no PS points closer than 100 m could be found, due to fact that the area is covered with vegetation and therefore no PS points were obtained. Consequently, these boreholes were not included in the analysis. After verifying the available hydraulic head temporal series of F15C, data from this monitoring borehole could not be considered due to existing inconsistencies.
A further spatial analysis was based on the data from the boreholes FM1LC, FM2LC, and F14M. FM1LC and FM2LC are placed in the same location, respectively monitoring the confined middle aquifer and the shallow aquifer. These two points are part of the Bucharest city groundwater monitoring system as reported by Gaitanaru et al. (2017) [31]. A double tube monitoring well was designed to measure the hydraulic head for both the upper (unconfined) and middle (unconfined) aquifer strata.
Only two PS points are situated at a distance less than 100 m for FM1LC and FM2LC. Figure 11 illustrates them, their PS codes being 333,807 and 333,808 respectively.
For the F14M monitoring borehole, the analysis was made for the middle-confined aquifer strata, as more than 60 PS points are within the 100 m buffer zone. The selected PS points can be seen in Figure 12.
In Figure 12, the blue line illustrates the groundwater hydraulic head variation for the FM1LC (middle confined aquifer strata) and FM2LC boreholes (shallow unconfined strata) and a correlation with the vertical ground movement of PS data points (green lines). For borehole FM1LC, two time periods stand out respectively between June 2015 to September 2015 with a decrease of the hydraulic head and between December 2017 and March 2018 with an increase of the hydraulic head (Figure 12). The mean annual velocity for the average between the two PS points is −0.26 mm ± 1.71 mm. For borehole FM2LC, the decrease in hydraulic head between March 2016 and November 2017 show a small change in vertical ground movement of PS data. However, the rapid increase in hydraulic head from January to March 2018 corresponds to a rapid change in the PS data (Figure 12). As average, these changes in ground movement (PS data) are small (millimetres). The groundwater hydraulic head, registered in the two boreholes, corresponds to the general behavior of the Bucharest aquifer system. The middle confined aquifer shows a little higher hydraulic head than the shallow unconfined one. It can be also observed that the shallow strata show a more intense dynamic due to its generally higher hydraulic conductivity, its recharge from precipitation as well as its closer hydraulic interaction with the surface water and with the city infrastructure elements. In several places, where those two aquifer strata communicate naturally or artificially, the groundwater hydraulic head values are undistinguishable [53].
For both boreholes penetrating respectively the shallow aquifer (FM2LC) and the confined middle aquifer (FM1LC), the hydraulic head has a descending trend while the area neighboring the PS points show a slightly ascending trend. However, as the annual value of the vertical displacements for the same time period is less than −1.5 mm, for these two mentioned PS points the area can be interpreted as stable. Consequently, Figure 12 does not show a correlation between vertical displacements and the hydraulic head variation.
On the contrary, for F14M borehole penetrating the middle confined aquifer, Figure 13 shows the correspondence of the two types of data. Here, a decrease in hydraulic head corresponds to vertical negative ground displacements (subsidence). This strengthens the hypothesis that the Circului Park area, or parts of it, has the same behavior as the study area situated in the north side of the park.
A good correspondence is registered between the hydraulic head variation of FM2LC borehole in the shallow aquifer and the water level in Circului Lake which has a direct connection with the shallow aquifer and is representative for the area aquifer hydraulic head trend since 2006.

3.2.3. Study Case of a Building Situated in the Barbu Vacarescu Area

In 2011, a stability-geotechnical expertise has been made for a building situated inside the study area Barbu Vacarescu [63], triggered by signs of instability. Degradations occurred after the beginning of construction works in a neighboring property located in the north eastern area. The construction works involved modifications of an existing building (Figure 14).
The geological stratification mapped in the construction site is in accordance with the geological model (Figure 9). Hence, the top layer is an anthropogenic material layer with thicknesses of approximately 9 m. The anthropogenic material is a mixture of silts, clay, silty clay, biodegradable waste, and demolition waste. This urban soil stratum is very compressible and has weak shear-strength parameters [63]. The mechanical properties of this anthropogenic layer induce a difficult process of building foundation development. This stratum is very sensitive to static and especially to dynamic conditions (e.g., vibrations, earthquakes). The anthropogenic material stratum lays on a macro granular alluvium package consisting of sand and gravel [63].
The monitoring borehole TrEiff, described in Section 2.3, was drilled close to the boundary between the two properties, near the new building.
In the case of the displacements map generated from 109D orbit scenes, several PS points were available inside the studied zone. These points are marked in Figure 14. For the 131A displacements map, no PS point was identified inside the studied zone.
The main difference between the two buildings, the one showing instability and the one under-construction, is related to the foundation system. The affected building from the Turnul Eiffel Street has a slab type foundation, which is a shallow type foundation, located in the anthropogenic material stratum. The building from the neighboring property (under construction) has a pile type foundation. Conceptually, the slab type foundation is floating into the anthropogenic material stratum and the general stability of the building is assured. Of course, the displacements of the ground foundation should be limited. In August 2010, the construction works started on the second mentioned building (located on Kepler Street) with the execution of the pile foundation. The pile foundation is a deep foundation type, used to transfer the loads of the building through the anthropogenic material layer onto a deeper, stronger, more compact, and less compressible layer [67]. This process induced ground deformations causing subsequently an instability effect on the neighboring buildings. Due to this, the construction works were stopped several times by the authorities, first in September 2010 and secondly in February 2011. After the second interruption, for a long period, the works did not continue.
In 2011, a borehole located on the street with the building under construction intercepted seepage water at 4.6 m. In another borehole on the street of the affected building, seepage water was intercepted at 2.5 m. The pipes leakage modified considerably the local hydrogeological conditions in the studied area. The shallow aquifer, located at depths of about 9–10 m, shows continous variations in hydraulic head with an increase from 2011 to mid of 2012 and then a decrease until June 2016. This was intercepted by the borehole drilled close to the boundary between the two properties (Figure 14). The alternation in hydraulic head is clearly affecting the ground stability as indicated by PS data in Figure 15.
The graph of Figure 15 shows the ground surface subsidence trend that occurs in the same period of time when the hydraulic head decreasing trend is detected.
Hydraulic head measurements were available for 2011–2016, while displacements time series are available for 2014–2018 time period. Although there is an overlapping period of two years of common measurements, there is only one measurement for hydraulic head in the period August 2012–May 2016.
Analysis of the combined datasets hydraulic head and the PS points time series is shown in Figure 15. As it can be observed, the relationship between displacements and hydraulic head variations is based on limited measurements, however the area hydraulic head evolution follows the general decreasing trend for the period 2006–2015, modeled and illustrated in Figure 3 [37]. The modeled aquifer hydraulic head decreasing trend is confirmed by the area wells as well as by the measurement took in TrEiff borehole on May 2016.

4. Discussion and Conclusions

One of the main advantages of the SAR techniques consists in detecting ground displacements and so improving considerably large area monitoring capability. This allows identifying specific areas affected by vertical displacements which were unknown before applying SAR monitoring and shows the evolution of areas where subsidence or uplift could occur. This is the case for the Barbu Vacarescu area, which was identified as having a subsidence trend in the SAR time series analyzed since 1992. When analyzing the PSI vertical displacements maps between 1992 and 2018, it can be clearly observed that the instability trend of this area is mainly shown by the changes of the location of the PS points indicating ground displacements and not by the predominance of the subsidence affected areas in the bounded area. As the common characteristic for the entire area is the presence of the stratum made of anthropogenic constructions waste, the particularities being given by local geotechnical differences or by local groundwater dynamics, it can be concluded that this PS points displacement pattern put into evidence this type of urban ground layer.
For the SAR data used in this study, when looking back at the previous European C-band SAR missions, ERS 1&2 and ENVISAT ASAR, the technological improvements of the Sentinel-1 mission are impressive. The Sentinel-1 comprises a better coverage and a revisit time of 12 days for one satellite, and 6 days when considering both satellites of the mission. This allows a more complex and complete analysis considering the number of available PS points for the same area and their registered variations at a finer rate.
As a limitation of this monitoring technique, most of the areas with continuous ground displacements trends are affected by these movements for a long period of time, many going back to the industrialization period of the 1970s–1980s years. For SAR temporal series, the data availability is restricted to 1992 until present. This makes a historical analysis of the vertical displacements very difficult, as other monitoring methods were used only if it was a high interest for a specific area.
The ground movement recorded by radar satellites and the InSAR techniques does not display the cause but allows highlighting different geological, hydrogeological, or geotechnical problems that influence the ground surface and subsurface. Hence, considering the correlation between the hydraulic head data and the PSI vertical displacements, some aspects can be highlighted for the Circului Park area. Displacements dissimilarity trend observed for the PS points correlated to boreholes FM1LC/FM2LC and F14M might be due to the differences of the land use of the north-eastern (close to FM1LC and FM2LC boreholes) and of the south-eastern (close to F14M borehole) vicinities of the Circului Park. The north-eastern side of Circului Park, is a residential area built in the period of 1980s–1990s. The consolidation process of the anthropogenic material layer ended and the ground is stabilized, as no other changes of the stress state occurred meantime. On the other hand, the south-eastern side is a more dynamic area, with new buildings made both during 2000–2010 time period as well as during 2013–2016. The dewatering systems needed for the building foundation implementation process, the presence of the anthropogenic material layer, the stress state due to the buildings load, may led to compaction of the subsurface and to vertical displacements.
Ground weakening that occurred for the buildings analyzed in the Barbu Vacarescu area, has a combination of sources. The solutions related to foundation techniques, the presence of the urban anthropogenic material stratum, the construction activity, the seepage from the losses of the water supply system which existed before the start of construction works, the variations of the aquifer hydraulic head, have led to ground displacements and consequently to the degradation of the building described in the second study case (Turnul Eiffel Street). Solving the leakage problems from the water supply system and introducing a drainage control conducting to the hydraulic heads steadiness remain the zone main stabilization solutions. Considering the monitoring data and the performed technical analyses, it was concluded that there are still continuous small deformations of the ground, due to milimetrical settlements and uplifts induced by the hydraulic head variations. In the case of cyclicality, negative effects could occur on buildings with a slab type foundation.
Expanding our analysis of the regional patterns of subsidence is the compulsory subsequent step of this study. Focussing on small areas is usually effective, however in the densely populated urban environment it is rather complicated to develop efficient groundwater monitoring systems. In such environments the hydraulic data will always be inadequate and they cannot be quantitatively compared with the InSAR data. The bulk of this study is based upon only a very few PS, out of more than a million that were produced for the entire urban area of Bucharest city. The lack of data and long time-series makes it difficult to obtain a quantitative analysis. Therefore, a general correlation is highlighted.
The high heterogeneity of the urban antropogenic material can affect seriously the ground stability in urban areas. In our case study (Figure 10), one of the highest levels of subsidence is located in an area with thick anthropogenic material, even a considerable part of that area appears to be stable. This emphasizes the need of developing more accurate spatial models to manage the anthropogenic strata information. From a construction and urban hydrogeology point of view, it can be concluded that the presence of the thick anthropogenic material layer and its connections with the shallow aquifer have to be very well considered when new construction projects are designed as the water pumping from deeper aquifer units and other man-made factors may induce local area destabilization.
Subsidence in cities, such as in Bucharest, may have multiple causes. However, changes in hydraulic head caused by pipe leakage, the behavior of the anthropogenic construction debris stratum, or the severe diminishing of water percolation due to the urban fabric extension, play an important role. These phenomena contribute directly to urban groundwater dynamics and consequently to ground stabilization. A better understanding of the linked complex geological and hydrogeological processes relating to the urban water cycle and ground subsidence will provide improvements on urban subsurface planning and urban development.
A future recommendation is to use complex urban monitoring stations composed of a corner reflector and surface sensors as well as subsurface components comprising downhole equipments and sensors. This monitoring device could improve urban displacements data achievement procedures. The corner reflector providing high intensity InSAR data, supports the acquisition of remote sense deformation time series. At each spatial location where the station is situated, a large range of other relevant parameters are being recorded using in-situ techniques. Regrouped in the same urban monitoring station centered arround an inclinometric tube, the facilities are able to measure horizontal and vertical subsurface ground displacements, groundwater hydraulic heads, and other groundwater physical and chemical parameters [68].

Author Contributions

Conceptualization, A.R.; Formal analysis, A.R.; Funding acquisition, C.R.G.; Investigation, A.R., T.G. and C.R.G.; Methodology, A.R.; Project administration, C.R.G.; Supervision, C.R.G.; Writing–original draft, A.R.; Writing–review & editing, A.R., G.V., T.G. and C.R.G. All authors have read and agreed to the published version of the manuscript.

Funding

This work is part of the INXCES (INnovations for eXtreme Climatic EventS, https://inxces.eu/) project 2016-2019 funded by WaterJPI WaterWorks 2014. It was partly funded by the Romanian National Authority for Scientific Research and Innovation, CCCDI-UEFISCDI grant number 48/2013 Cofound-202-INXCES, with PNCDI III. The authors acknowledge the funding received by ERA-PLANET (www.era-planet.eu), trans-national project SMURBS (www.smurbs.eu) (grant agreement no. 689443), funded under the EU Horizon 2020 Framework Programme.

Acknowledgments

The authors are thankful to John Dehls (NGU) for Sentinel-1 data processing in the frame of Norwegian Ground Motion Services and for the valuable comments he made on this manuscript. S. Manea (UTCB) is gratefully acknowledged for the valuable contribution on study case building.

Conflicts of Interest

The authors declare no conflict of interest.

References

  1. Abidin, H.Z.; Andreas, H.; Gumilar, I.; Wibowo, I.R.R. On correlation between urban development, land subsidence and flooding phenomena in Jakarta. Proc. IAHS 2015, 370, 15–20. [Google Scholar] [CrossRef] [Green Version]
  2. Auvinet, G.; Méndez, E.; Juárez, M. Recent information on Mexico City subsidence. In Proceedings of the 19th International Conference on Soil Mechanics and Geotechnical Engineering, Seoul, Korea, 17–21 September 2017; pp. 3295–3298. [Google Scholar]
  3. Heleno, S.I.N.; Oliveira, L.G.S.; Henriques, M.J.; Falcao, A.P.; Lima, J.N.P.; Cooksley, G.; Ferretti, A.; Fonseca, A.M.; Lobo-Ferreira, J.P.; Fonseca, J.F.B.D. Persistent Scatterers Interferometry detects and measures ground subsidence in Lisbon. Remote. Sens. Environ. 2011, 115, 2152–2167. [Google Scholar] [CrossRef] [Green Version]
  4. Ding, X.L.; Liu, G.X.; Li, Z.W.; Li, Z.L.; Chen, Y.Q. Ground Subsidence Monitoring in Hong Kong with Satellite SAR Interferometry. Photogramm. Eng. Remote. Sens. 2004, 70, 1151–1156. [Google Scholar] [CrossRef]
  5. Wakode, H.B.; Baier, K.; Jha, R.; Azzam, R. Impact of urbanization on groundwater recharge and urban water balance for the city of Hyderbad, India. Int. Soil Water Conserv. Res. 2018, 6, 51–62. [Google Scholar] [CrossRef]
  6. Aslan, G.; Cakır, Z.; Ergintav, S.; Lasserre, C.; Renard, F. Analysis of Secular Ground Motions in Istanbul from a Long-Term InSAR Time-Series (1992–2017). Remote. Sens. 2018, 10, 408. [Google Scholar] [CrossRef] [Green Version]
  7. Perissin, D.; Wang, Z.; Lin, H. Shanghai subway tunnels and highways monitoring through Cosmo-SkyMed Persistent Scatterers. ISPRS J. Photogramm. 2012, 73, 58–67. [Google Scholar] [CrossRef]
  8. Gogu, C.R.; Gaitanaru, D.; Boukhemacha, M.A.; Serpescu, I.; Litescu, L.; Zaharia, V.; Moldovan, A.; Mihailovici, M.J. Urban Hydrogeology studies in Bucharest City, Romania. Procedia Eng. 2017, 209, 135–142. [Google Scholar] [CrossRef]
  9. Venvik, G.; Bang-Kittilsen, A.; Boogaard, F.C. Risk assessment for areas prone to flooding and subsidence: A case study from Bergen, West Norway. Hydrol. Res. 2020, 51, 322–338. [Google Scholar] [CrossRef]
  10. Radutu, A.; Nedelcu, I.; Gogu, C.R. An overview of ground surface displacements generated by groundwater dynamics, revealed by InSAR techniques. Procedia Eng. 2017, 209, 119–126. [Google Scholar] [CrossRef]
  11. Chaussard, E.; Wdowinski, S.; Cabral-Cano, E.; Amelung, F. Land subsidence in central Mexico detected by ALOS InSAR time-series. Remote. Sens. Environ. 2014, 140, 94–106. [Google Scholar] [CrossRef]
  12. Castellazzi, P.; Arroyo-Domínguez, N.; Martel, R.; Calderhead, A.I.; Normand, J.C.L.; Gárfias, J.; Rivera, A. Land subsidence in major cities of Central Mexico: Interpreting InSAR-derived land subsidence mapping with hydrological data. Int. J. Appl. Earth Obs. 2016, 47, 102–111. [Google Scholar] [CrossRef]
  13. Motagh, M.; Shamshiri, R.; Haghighi, M.H.; Wetzel, H.-U.; Akbari, B.; Nahavandchi, H.; Roessner, S.; Arabi, S. Quantifying groundwater exploration induced subsidence in the Rafsanjan plain, southeastern Iran, using InSAR timeseries and in situ measurements. Eng. Geol. 2017, 218, 134–151. [Google Scholar] [CrossRef]
  14. Yan, Y.; Doin, M.-P.; Lopez-Quiroz, P.; Tupin, F.; Fruneau, B.; Pinel, V.; Trouve, E. Mexico City Subsidence Measured by InSAR Time Series: Joint Analysis Using PS and SBAS Approaches. IEEE J. STARS 2012, 5, 1312–1326. [Google Scholar] [CrossRef] [Green Version]
  15. Ruiz-Constan, A.; Ruiz-Armenteros, A.M.; Lamas-Fernandez, F.; Martos-Rosillo, S.; Delgado, J.M.; Bekaert, D.P.S.; Sousa, J.J.; Gil, A.J.; Cuenca, M.C.; Hanssen, R.F.; et al. Multi-temporal InSAR evidence of ground subsidence induced by groundwater withdrawal: The Montellano aquifer (SW Spain). Environ. Earth Sci. 2016, 75, 1–16. [Google Scholar] [CrossRef]
  16. Galloway, D.L.; Burbey, T.L. Review: Regional land subsidence accompanying groundwater extraction. Hydrogeol. J. 2011, 19, 1459–1486. [Google Scholar] [CrossRef]
  17. Samsonov, S.V.; d’Oreye, N.; González, P.J.; Tiampo, K.F.; Ertolahti, L.; Clague, J.J. Rapidly accelerating subsidence in the Greater Vancouver region from two decades of ERS-ENVISAT-RADARSAT-2 DInSAR measurements. Remote. Sens. Environ. 2014, 143, 180–191. [Google Scholar] [CrossRef] [Green Version]
  18. Chen, M.; Tomas, R.; Li, Z.; Motagh, M.; Li, T.; Hu, L.; Gong, H.; Li, X.; Yu, Y.; Gong, X. Imaging Land Subsidence Induced by Groundwater Extraction in Beijing (China) Using Satellite Radar Interferometry. Remote. Sens. 2016, 8, 468. [Google Scholar] [CrossRef] [Green Version]
  19. Bock, Y.; Wdowinski, S.; Ferretti, A.; Novali, F.; Fumagalli, A. Recent subsidence of the Venice Lagoon from continuous GPS and interferometric synthetic aperture radar. Geochem. Geophys. Geosyst. 2012, 13, 3. [Google Scholar] [CrossRef]
  20. Serrano-Juan, A.; Pujades, E.; Vázquez-Suñé, E.; Crosetto, M.; Cuevas-González, M. Leveling vs. InSAR in urban underground construction monitoring: Pros and cons. Case of la sagrera railway station (Barcelona, Spain). Eng. Geol. 2017, 218, 1–11. [Google Scholar] [CrossRef]
  21. Declercq, P.-Y.; Walstra, J.; Gerard, P.; Pirard, E.; Perissin, D.; Meyvis, B.; Devleeschouwer, X. A Study of Ground Movements in Brussels (Belgium) Monitored by Persistent Scatterer Interferometry over a 25-Year Period. Geosci. J. 2017, 7, 115. [Google Scholar] [CrossRef] [Green Version]
  22. Castellazzi, P.; Garfias, J.; Martel, R.; Brouard, C.; Rivera, A. InSAR to support sustainable urbanization over compacting aquifers: The case of Toluca Valley, Mexico. Int. J. Appl. Earth Obs. 2017, 63, 33–44. [Google Scholar] [CrossRef]
  23. Stramondo, S.; Bozzano, F.; Marra, F.; Wegmuller, U.; Cinti, F.R.; Moro, M.; Saroli, M. Subsidence induced by urbanisation in the city of Rome detected by advanced InSAR technique and geotechnical investigations. Remote. Sens. Environ. 2008, 112, 3160–3172. [Google Scholar] [CrossRef]
  24. Polcari, M.; Albano, M.; Saroli, M.; Tolomei, C.; Lancia, M.; Moro, M.; Stramondo, S. Subsidence Detected by Multi-Pass Differential SAR Interferometry in the Cassino Plain (Central Italy): Joint Effect of Geological and Anthropogenic Factors? Remote. Sens. 2014, 6, 9676–9690. [Google Scholar] [CrossRef] [Green Version]
  25. Stramondo, S.; Saroli, M.; Tolomei, C.; Moro, M.; Doumaz, F.; Pesci, A.; Loddo, F.; Baldi, P.; Boschi, E. Surface movements in Bologna (Po Plain- Italy) detected by multitemporal DInSAR. Remote. Sens. Environ. 2007, 110, 304–316. [Google Scholar] [CrossRef]
  26. Poland, J.S. Guidebook to Studies of Land Subsidence due to Ground-Water Withdrawal; UNESCO: Paris, France, 1984. [Google Scholar]
  27. Bitelli, G.; Bonsignore, F.; Pellegrino, I.; Vittuari, L. Evolution of the techniques for monitoring at regional scale: The case of Emilia-Romagna region (Italy). Proc. IAHS 2015, 372, 315–321. [Google Scholar] [CrossRef] [Green Version]
  28. Radutu, A.; Gogu, R.C. Chronological reflection on monitoring urban areas subsidence due to groundwater extraction. In E3S Web of Conferences, Volume 85, Proceedings of the EENVIRO 2018 Conference: Sustainable Solutions for Energy and Environment, Cluj Napoca, Romania, 9–13 October 2018; Balan, M.C., Bode, F., Croitoru, C., Dogeanu, A., Georgescu, A., Georgescu, C., Nastase, I., Sandu, M., Eds.; EDP Sciences: Paris, France, 2019; p. 07015. [Google Scholar] [CrossRef] [Green Version]
  29. Direcția Regională de Statistică a Municipiului București. Available online: http://www.bucuresti.insse.ro/despre-bucuresti (accessed on 4 April 2020).
  30. Serpescu, I.; Radu, E.; Gogu, C.R.; Boukhemacha, M.A.; Gaitanaru, D.; Bica, I. 3D Geological model of Bucharest city quaternary deposits. In Proceedings of the 13th SGEM GeoConference on Sci and Technol in Geology, Exploration and Min, Albena, Bulgary, 16–22 June 2013; pp. 1–8. [Google Scholar] [CrossRef]
  31. Gaitanaru, D.; Gogu, C.R.; Boukhemacha, M.A.; Litescu, L.; Zaharia, V.; Moldovan, A.; Mihailovici, M.J. Bucharest city urban groundwater monitoring system. Procedia Eng. 2017, 209, 143–147. [Google Scholar] [CrossRef]
  32. Vîjdea, A.; Bindea, G. D7.1.33 GeoHazard Description for Bucharest. Report in the frame of FP7 PanGeo: Enabling Access to Geological Information in Support of GMES project; 2013. Available online: http://www.pangeoproject.eu (accessed on 20 September 2018).
  33. Poncos, V.; Teleaga, D.; Boukhemacha, M.A.; Toma, S.A.; Serban, F. Study of urban instability phenomena in Bucharest city based on Ps-InSAR. In Proceedings of the IEEE Geoscience and Remote Sensing Symposium, Quebec City, QC, Canada; 2014; pp. 429–432. [Google Scholar]
  34. Armaş, I.; Necşoiu, M.; Mendes, D.; Gheorghe, M.; Gheorghe, D. Ground displacement trends in an urban environment using Multi-Temporal InSAR analysis and two decades of multi-sensor satellite-based SAR Imagery. In Proceedings of the ESA SEOM Fringe 2015 Workshop, Frascati, Italy, 23–27 March 2015. [Google Scholar]
  35. Armas, I.; Mendes, D.; Popa, R.; Gheorghe, M.; Popovici, D. Long-term ground deformation patterns of Bucharest using multi-temporal InSAR and multivariate dynamic analyses: A possible transpressional system? Sci. Rep. 2017, 7, 43762. [Google Scholar] [CrossRef]
  36. Gheorghe, M.; Armas, I.; Dumitru, P.; Calin, A.; Badescu, O.; Necsoiu, M. Monitoring subway construction using Sentinel-1 data: A case study in Bucharest, Romania. Int. J. Remote. Sens. 2020, 41, 2644–2663. [Google Scholar] [CrossRef]
  37. Gogu, C.R.; Serpescu, I.; Perju, S.; Gaitanaru, D.; Bica, I. Urban Groundwater Modeling Scenarios to simulate Bucharest city lake disturbance. In Proceedings of the 15th SGEM GeoConference on Sci and Technol in Geology, Exploration and Min, Albena, Bulgary, 18–24 June 2015; Volume 2, pp. 834–840. [Google Scholar]
  38. CCIAS. Scientific Report on Research Project: Assessment and Monitoring of the Urban Impact (Urban Infrastructures) on the Aquatic Environment Represented by the Lake in Circului Park), Beneficiary: Park, Lakes and Recreation Administration Bucharest [in Romanian]; Technical University of Civil Engineering Bucharest: Bucharest, Romania, 2015; (unpublished). [Google Scholar]
  39. Romanian National Institute of Statistics. Romanian Statistical Yearbook. Available online: https://insse.ro/cms/ro/tags/anuarul-statistic-al-romaniei (accessed on 28 April 2020).
  40. Massonnet, D.; Feigl, K.L. Radar Interferometry and its application to changes in the Earth’s surface. Rev. Geophys. 1998, 36, 441–500. [Google Scholar] [CrossRef] [Green Version]
  41. Galloway, D.; Hudnut, K.W.; Ingebritsen, S.E.; Phillips, S.P.; Peltzer, G.; Rogez, F.; Rosen, P.A. Detection of aquifer systemc compaction and land subsidence using interferometric synthetic aperture radar, Antelope Valley, Mojave Desert, California. Water Resour. Res. 1998, 34, 2573–2585. [Google Scholar] [CrossRef]
  42. Gabriel, A.K.; Goldstein, R.M.; Zebker, H.A. Mapping small elevation changes over large areas: Differential radar interferometry. J. Geophys. Res. Solid Earth 1989, 94, 9183–9191. [Google Scholar] [CrossRef]
  43. Tesauro, M.; Berardino, P.; Lanari, R.; Sansosti, E.; Fornaro, G. Urban subsidence inside the city of Napoli (Italy) observed by satellite radar interferometry. Geophys. Res. Lett. 2000, 27, 1961–1964. [Google Scholar] [CrossRef]
  44. Gong, W.; Thiele, A.; Hinz, S.; Meyer, F.J.; Hooper, A.; Agram, P.S. Comparison os Small Baseline Interferometric SAR Processors for Estimating Ground Deformation. Remote. Sens. 2016, 8, 330. [Google Scholar] [CrossRef] [Green Version]
  45. Pepe, A.; Calo, F. A Review of Interferometric Synthetic Aperture RADAR (InSAR) Multi-Track Approaches for the Retrieval of Earth’s Surface Displacements. Appl. Sci. 2017, 7, 1264. [Google Scholar] [CrossRef] [Green Version]
  46. Sousa, J.J.; Ruiz, A.M.; Hooper, A.J.; Hanssen, R.F.; Perski, Z.; Bastos, L.C.; Gil, A.J.; Galindo-Zaldivar, J.; de Galdeano, C.S.; Alfaro, P.; et al. Multi-temporal InSAR for deformation monitoring of the Granada and Padul faults and the surrounding area (Betic Cordillera, southern Spain). Procedia Technol. 2014, 16, 886–896. [Google Scholar] [CrossRef] [Green Version]
  47. Miller, M.; Shirzaei, M. Spatiotemporal characterization of land subsidence and uplift in Phoenix using InSAR time series and wavelet transforms. J. Geophys. Res. Solid Earth 2015, 120, 5822–5842. [Google Scholar] [CrossRef] [Green Version]
  48. Ferretti, A.; Prati, C.; Rocca, F. Permanent Scatterers in SAR Interferometry. IEEE Trans. Geosci. Remote. Sens. 2001, 39, 8–20. [Google Scholar] [CrossRef]
  49. Ozer, I.; van Leijen, F.; Jonkman, S.; Hanssen, R. Applicability of satellite radar imaging to monitor the conditions of levees. J. Flood Risk Manag. 2019, 12, e12509. [Google Scholar] [CrossRef] [Green Version]
  50. Crosetto, M.; Monserrat, O.; Cuevas-Gonzales, M.; Devanthery, N.; Crippa, B. Persistent Scatter Interferometry: A Review. ISPRS J. Photogramm. 2016, 115, 78–89. [Google Scholar] [CrossRef] [Green Version]
  51. Potin, P.; Rosich, B.; Miranda, N.; Grimont, P. Sentinel-1 Mission Status. Procedia Comput. Sci. 2016, 100, 1297–1304. [Google Scholar] [CrossRef] [Green Version]
  52. Copernicus Open Access Hub. Available online: https://scihub.copernicus.eu/ (accessed on 28 April 2020).
  53. European Space Agency, Sentinel Online, Interferometric Wide Swath. Available online: https://sentinel.esa.int/web/sentinel/user-guides/sentinel-1-sar/acquisition-modes/interferometric-wide-swath (accessed on 28 April 2020).
  54. Ferretti, A.; Prati, C.; Rocca, C. Nonlinear Subsidence Rate Estimation Using Permanent Scatterers in Differential SAR Interferometry. IEEE Trans. Geosci. Remote. Sens. 2000, 38, 2202–2212. [Google Scholar] [CrossRef] [Green Version]
  55. Meisina, C.; Zucca, F.; Notti, D.; Colombo, A.; Cucchi, A.; Savio, G.; Giannico, C.; Bianchi, M. Geological Interpretation of PSInSAR Data at Regional Scale. Sensors 2008, 8, 7469–7492. [Google Scholar] [CrossRef] [PubMed] [Green Version]
  56. Zhao, Q.; Ma, G.; Wang, Q.; Yang, T.; Liu, M.; Gao, W.; Falabella, F.; Mastro, P.; Pepe, A. Generation of long-term InSAR ground displacement time-series through a novel multi-sensor data merging technique: The case study of the Shanghai coastal area. ISPRS J. Photogramm. 2019, 154, 10–27. [Google Scholar] [CrossRef]
  57. KSAT Ground Monitoring Services (KSAT-GMS). Available online: http://gms.ksat.no/ (accessed on 13 November 2020).
  58. Dehls, J.F.; Larsen, Y.; Marinkovic, P.; Lauknes, T.R.; Stodle, D.; Moldestad, D.A. INSAR.NO: A National InSAR Deformation Mapping/Monitoring Service in Norway- From Concept to Operations. In Proceedings of the IGARSS 2019- IEEE International Geoscience and Remote Sensing Symposium, Yokohama, Japan, 28 July–2 August 2019; pp. 5461–5464. [Google Scholar]
  59. Dalla Via, G.; Crosetto, M.; Crippa, B. Resolving vertical and east-west horizontal motion from differential interferometric synthetic aperture radar: The L’Aquila earthquake. J. Geophys. Res. 2012, 117, B02310. [Google Scholar] [CrossRef] [Green Version]
  60. Foumelis, M. Vector-based approach for combining ascending and descending persistent scatterers interferometric point measurements. Geocarto Int. 2016, 33, 38–52. [Google Scholar] [CrossRef]
  61. CCIAS. Hydrogeological flow model for the Moesic aquifer system (Bucharest Area). Research project: Sedimentary Media Modeling Platform For Groundwater Management In Urban Areas (SIMPA). Scientific Report, No 10 [in Romanian]; Technical University of Civil Engineering Bucharest: Bucharest, Romania, 2013; (unpublished). [Google Scholar]
  62. Gogu, R.C.; Velasco, V.; Vazquez-Sune, E.; Gaitanaru, D.; Chitu, Z.; Bica, I. Sedimentary media analysis platform for groundwater modeling in urban areas. In Advances in the Research of Aquatic Environment. Environmental Earth Sciences; Lambrakis, N., Stournaras, G., Katsanou, K., Eds.; Springer: Berlin, Heidelberg, 2011; Volume 2, pp. 489–496. [Google Scholar]
  63. Manea, S. Technical Expertise for a Building Situated on Turnul Eiffel Str.; 2016; (unpublished). (In Romanian) [Google Scholar]
  64. National Institute of Research and Development for Land Reclamation “ISPIF” Bucharest. Study on the Geotechnical Zoning of Bucharest City; 1977; (unpublished). (In Romanian) [Google Scholar]
  65. Stanciu, A.; Lungu, I. Tasarea Construcțiilor. In Fundații- Fizica și Mecanica Pământurilor, 1st ed.; Editura Tehnica: Bucharest, Romania, 2006; Volume 1, pp. 781–799. [Google Scholar]
  66. Chen, Y.; Zhao, W.; Huang, Y.; Jia, P. Investigation of Land Subsidence Based on the Column Element Settlement Model in a Soft-Soil Area. Geofluids 2019, 2019, 1–16. [Google Scholar] [CrossRef]
  67. Fellenius, B.H. Pile Foundations. In Foundation Engineering Handbook; Fang, H.Y., Ed.; Springer: Boston, MA, USA, 1991; pp. 511–536. [Google Scholar] [CrossRef]
  68. Gogu, C.R.; Gaitanaru, D.; Tormo, R.; Radutu, A. Report INXCES (Innovations for eXtreme Climatic EventS, https://inxces.eu/) submitted to Romanian National Authority for Scientific Research and Innovation, CCCDI-UEFISCDI grant number 48/2013 Cofound-202-INXCES, with PNCDI III; 2016; (unpublished). (In Romanian) [Google Scholar]
Figure 1. Bucharest map. Barbu Vacarescu Area is outlined in red. Map generated in Esri®ArcMap™ 10.3. Base map source: OpenStreetMap.
Remotesensing 12 04054 g001
Figure 2. Losses from the water supply network in the study area (modified after [38]).
Remotesensing 12 04054 g002
Figure 3. Water level in Circului Lake between 2006 and 2015 (modified after [38]).
Remotesensing 12 04054 g003
Figure 4. Barbu Vacarescu area. The red limit represents the identified subsidence area in this study. The blue rectangle represents the geological model limits. The black line indicates a geological cross-section presented in the upcoming sections. Map generated in Esri®ArcMap™ 10.3. Base map source: OpenStreetMap.
Remotesensing 12 04054 g004
Figure 5. Geological cross-section used to generate the geological model.
Remotesensing 12 04054 g005
Figure 6. Monitoring boreholes in the Circului Park area (purple circles), located in the southeastern corner of the study area (Figure 2) and the monitoring borehole inside Barbu Vacarescu area (yellow). Map generated in Esri®ArcMap™ 10.3. Base map source: ESRI World Imagery.
Remotesensing 12 04054 g006
Figure 7. Vertical displacements map of Bucharest city generated by using Sentinel-1 131 Ascending orbit acquisitions and Sentinel-1 109 Descending orbit acquisitions. Map generated in Esri®ArcMap™ 10.3. Base map source: OpenStreetMap.
Remotesensing 12 04054 g007
Figure 8. PSI in Barbu Vacarescu area (a) Red limit represents the identified subsidence area in the PANGEO project [26]; blue limit represents the subsidence area identified in this study. (b) Red limit represents the geological model area; blue limit represents the subsidence area identified in this study. Map generated in Esri®ArcMap™ 10.3. Base map source: ESRI World Imagery.
Remotesensing 12 04054 g008
Figure 9. The Barbu Vacarescu area: (a) The thickness of the anthropogenic layer and the corresponding PS points. The geological cross-section is indicated along profile AA’ crossing the Barbu Vacarescu area and Circului Park from SE to NW. Map generated in Esri®ArcMap™ 10.3. Base map source: ESRI World Imagery; (b) geological model following geological cross-section AA’ giving the lithological strata of the subsurface.
Remotesensing 12 04054 g009
Figure 10. PSI displacement trends in Barbu Vacarescu area. The graphs show the displacements in mm (y-axis) of selected points over time (x-axis). Accumulated subsidence for both selected areas is approximately −35 mm subsidence over a 4-year time period.
Remotesensing 12 04054 g010
Figure 11. PS points situated within the 100 m buffer zone from FM1LC/FM2LC and F14M monitoring boreholes. Close-related to FM1LC/FM2LC borehole PS points codes: 333807 and 333808. Map generated in Esri®ArcMap™ 10.3. Base map source: ESRI World Imagery.
Remotesensing 12 04054 g011
Figure 12. Correlation between displacements of PS points and hydraulic head of boreholes FM1LC and FM2LC. Left y-axis indicates displacements, right y-axis indicates hydraulic head variation, and x-axis indicates the time scale. Light and dark green dots represent the variations of the displacements in PS points 333807 and 333808. Light and dark green lines are the linear trends for the vertical displacements. Dark blue line represents the hydraulic head variation for borehole FM1LC in the confined middle aquifer. Light blue line represents the hydraulic head variation for borehole FM2LC in the shallow aquifer. Blue dotted lines represent the hydraulic head variation trend.
Remotesensing 12 04054 g012
Figure 13. Correlation between displacements of PS points and hydraulic head. Left y-axis indicates displacements, right y-axis indicates hydraulic head variation, and the x-axis indicates the time scale. Red circles represent the variation of the displacements considering the mean of the PS points inside the 100 m buffer. Red line is the linear trend of the displacements of the PS points. Blue line represents the hydraulic head variation for the borehole F14M in the confined middle aquifer. The blue dotted line is the hydraulic head variation trend.
Remotesensing 12 04054 g013
Figure 14. Study case on a building situated in the Barbu Vacarescu area. Blue color line limit marks the area of the stability-geotechnical expertise. Green color line is the limit of the affected building. Purple color line is the limit of the building under construction. PSI velocity map is generated from Sentinel-1 109 Descending orbit data. Codes of PS points situated inside the studied area are marked on the map. Map generated in Esri®ArcMap™ 10.3. Base map source: ESRI World Imagery.
Remotesensing 12 04054 g014
Figure 15. Comparison between the evolution of hydraulic head data for TrEiff borehole and displacements (left y-axis indicates displacements, right y-axis indicates hydraulic head variation, x-axis indicates time): PS points from 109 Descending orbit.
Remotesensing 12 04054 g015
Table 1. Characteristics of the Synthetic Aperture Radar (SAR) datasets
SatelliteAcquisition ModeOrbit TypeTrackNumber of AcquisitionsTime Span
Sentinel 1Interferometric
Wide Swath (IW)
Ascending13111514 October 2014/26 April 2018
Descending10915313 October 2014/25 April 2018
Technical details about Interferometric Wide Swatch (IW) acquisition mode are described in [53].
Table 2. Monitoring boreholes in the Circului Park, Figure 6 shows location.
No.Borehole CodeAquifer Stratum
1F15CShallow
2PC1LCShallow
3FC1LCShallow
4FM2LCShallow
5FM1LCMiddle
6F14MMiddle
Publisher’s Note: MDPI stays neutral with regard to jurisdictional claims in published maps and institutional affiliations.

