Change Points Detected in Decadal and Seasonal Trends of Outlet Glacier Terminus Positions across West Greenland


Abstract
:
1. Introduction
2. Data and Methods
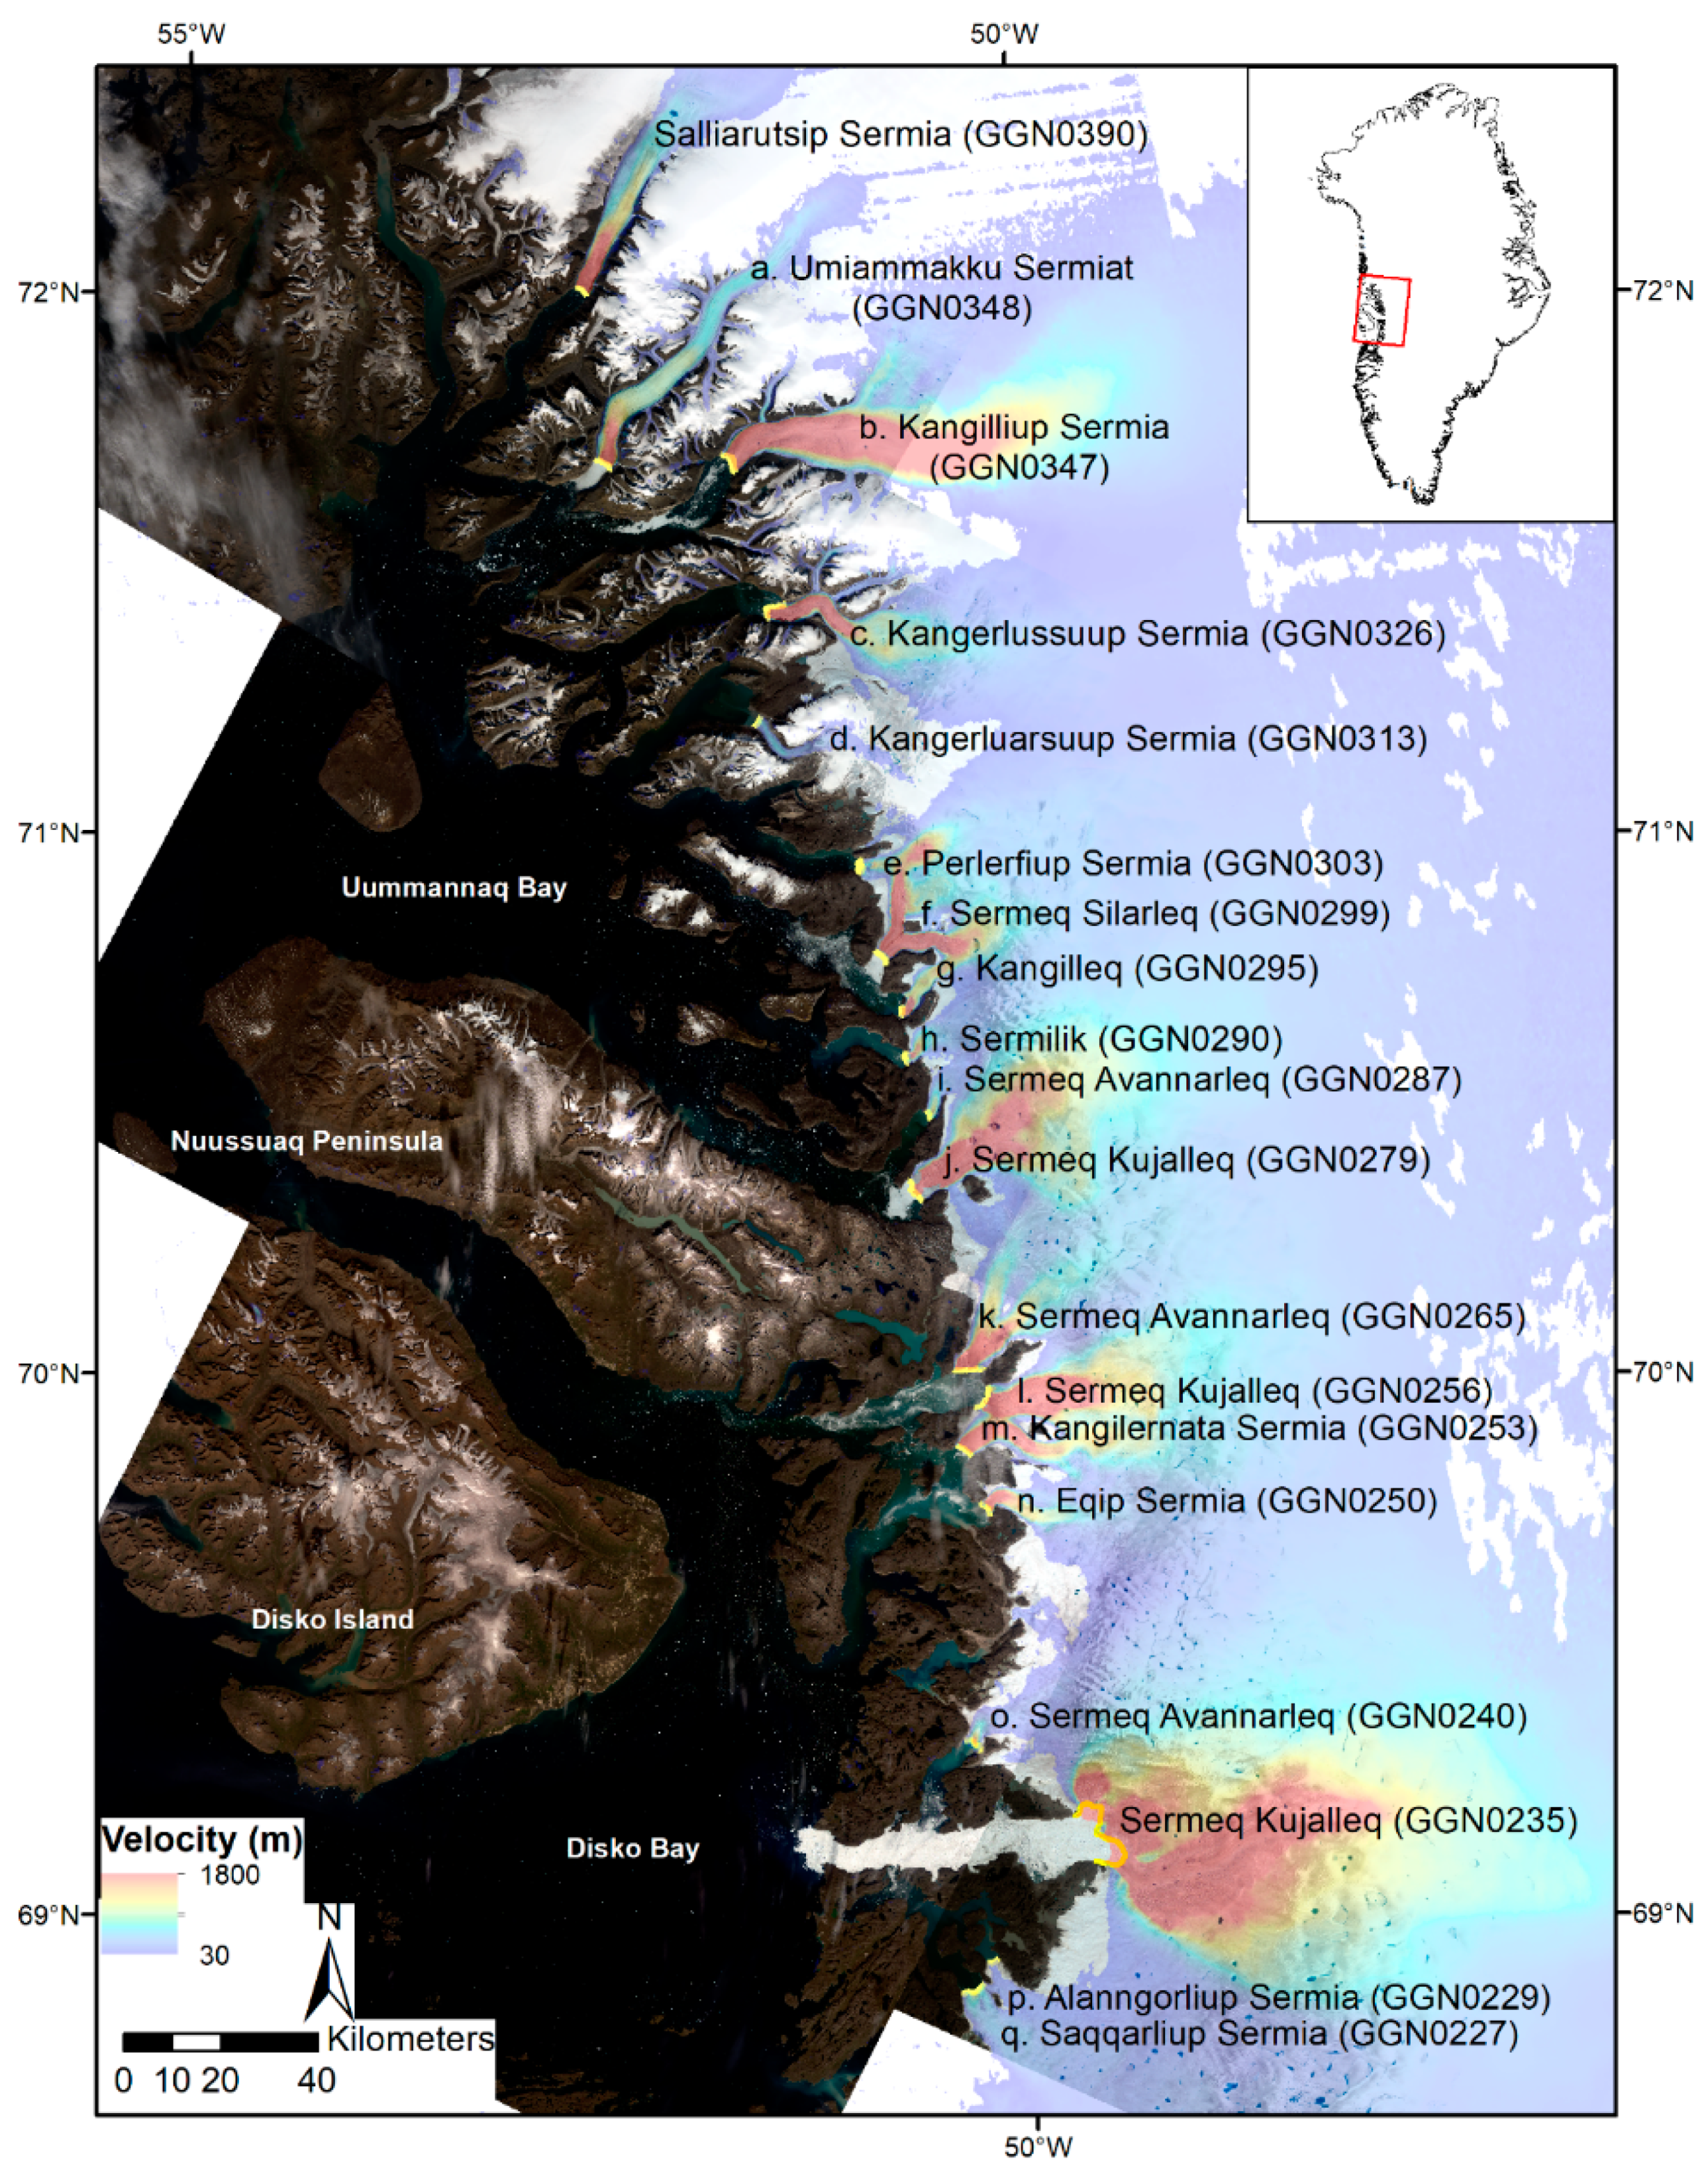
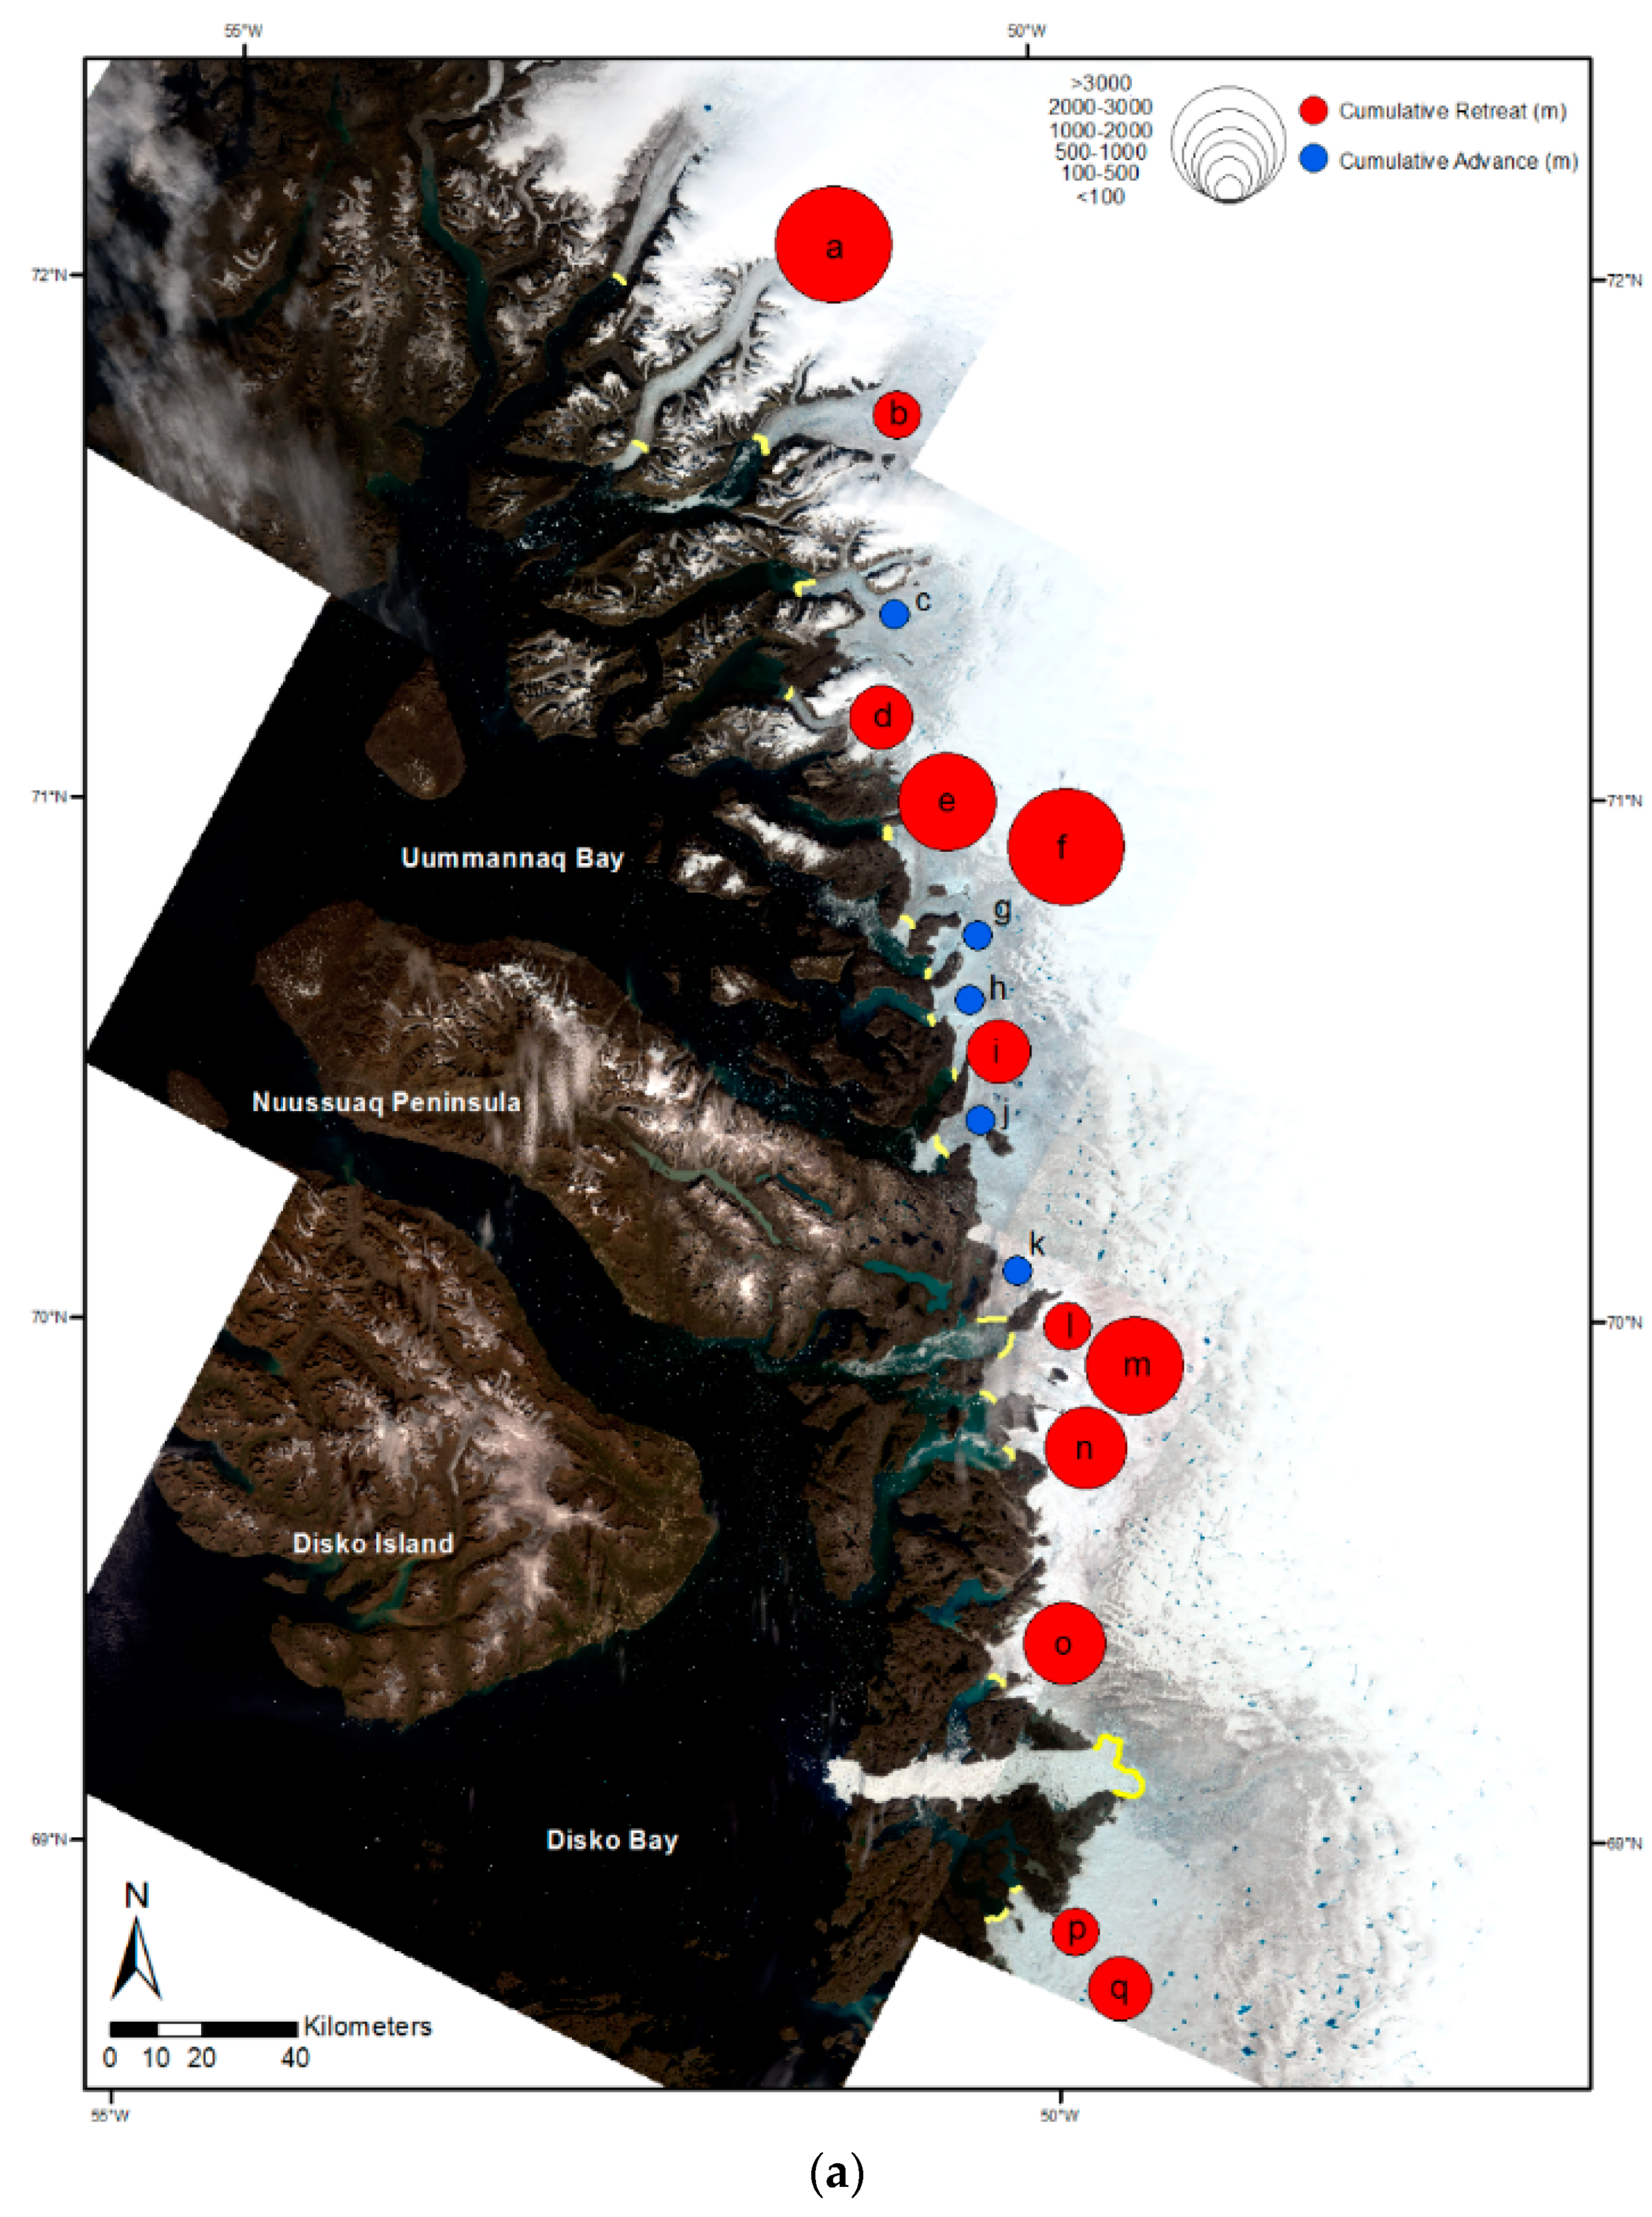
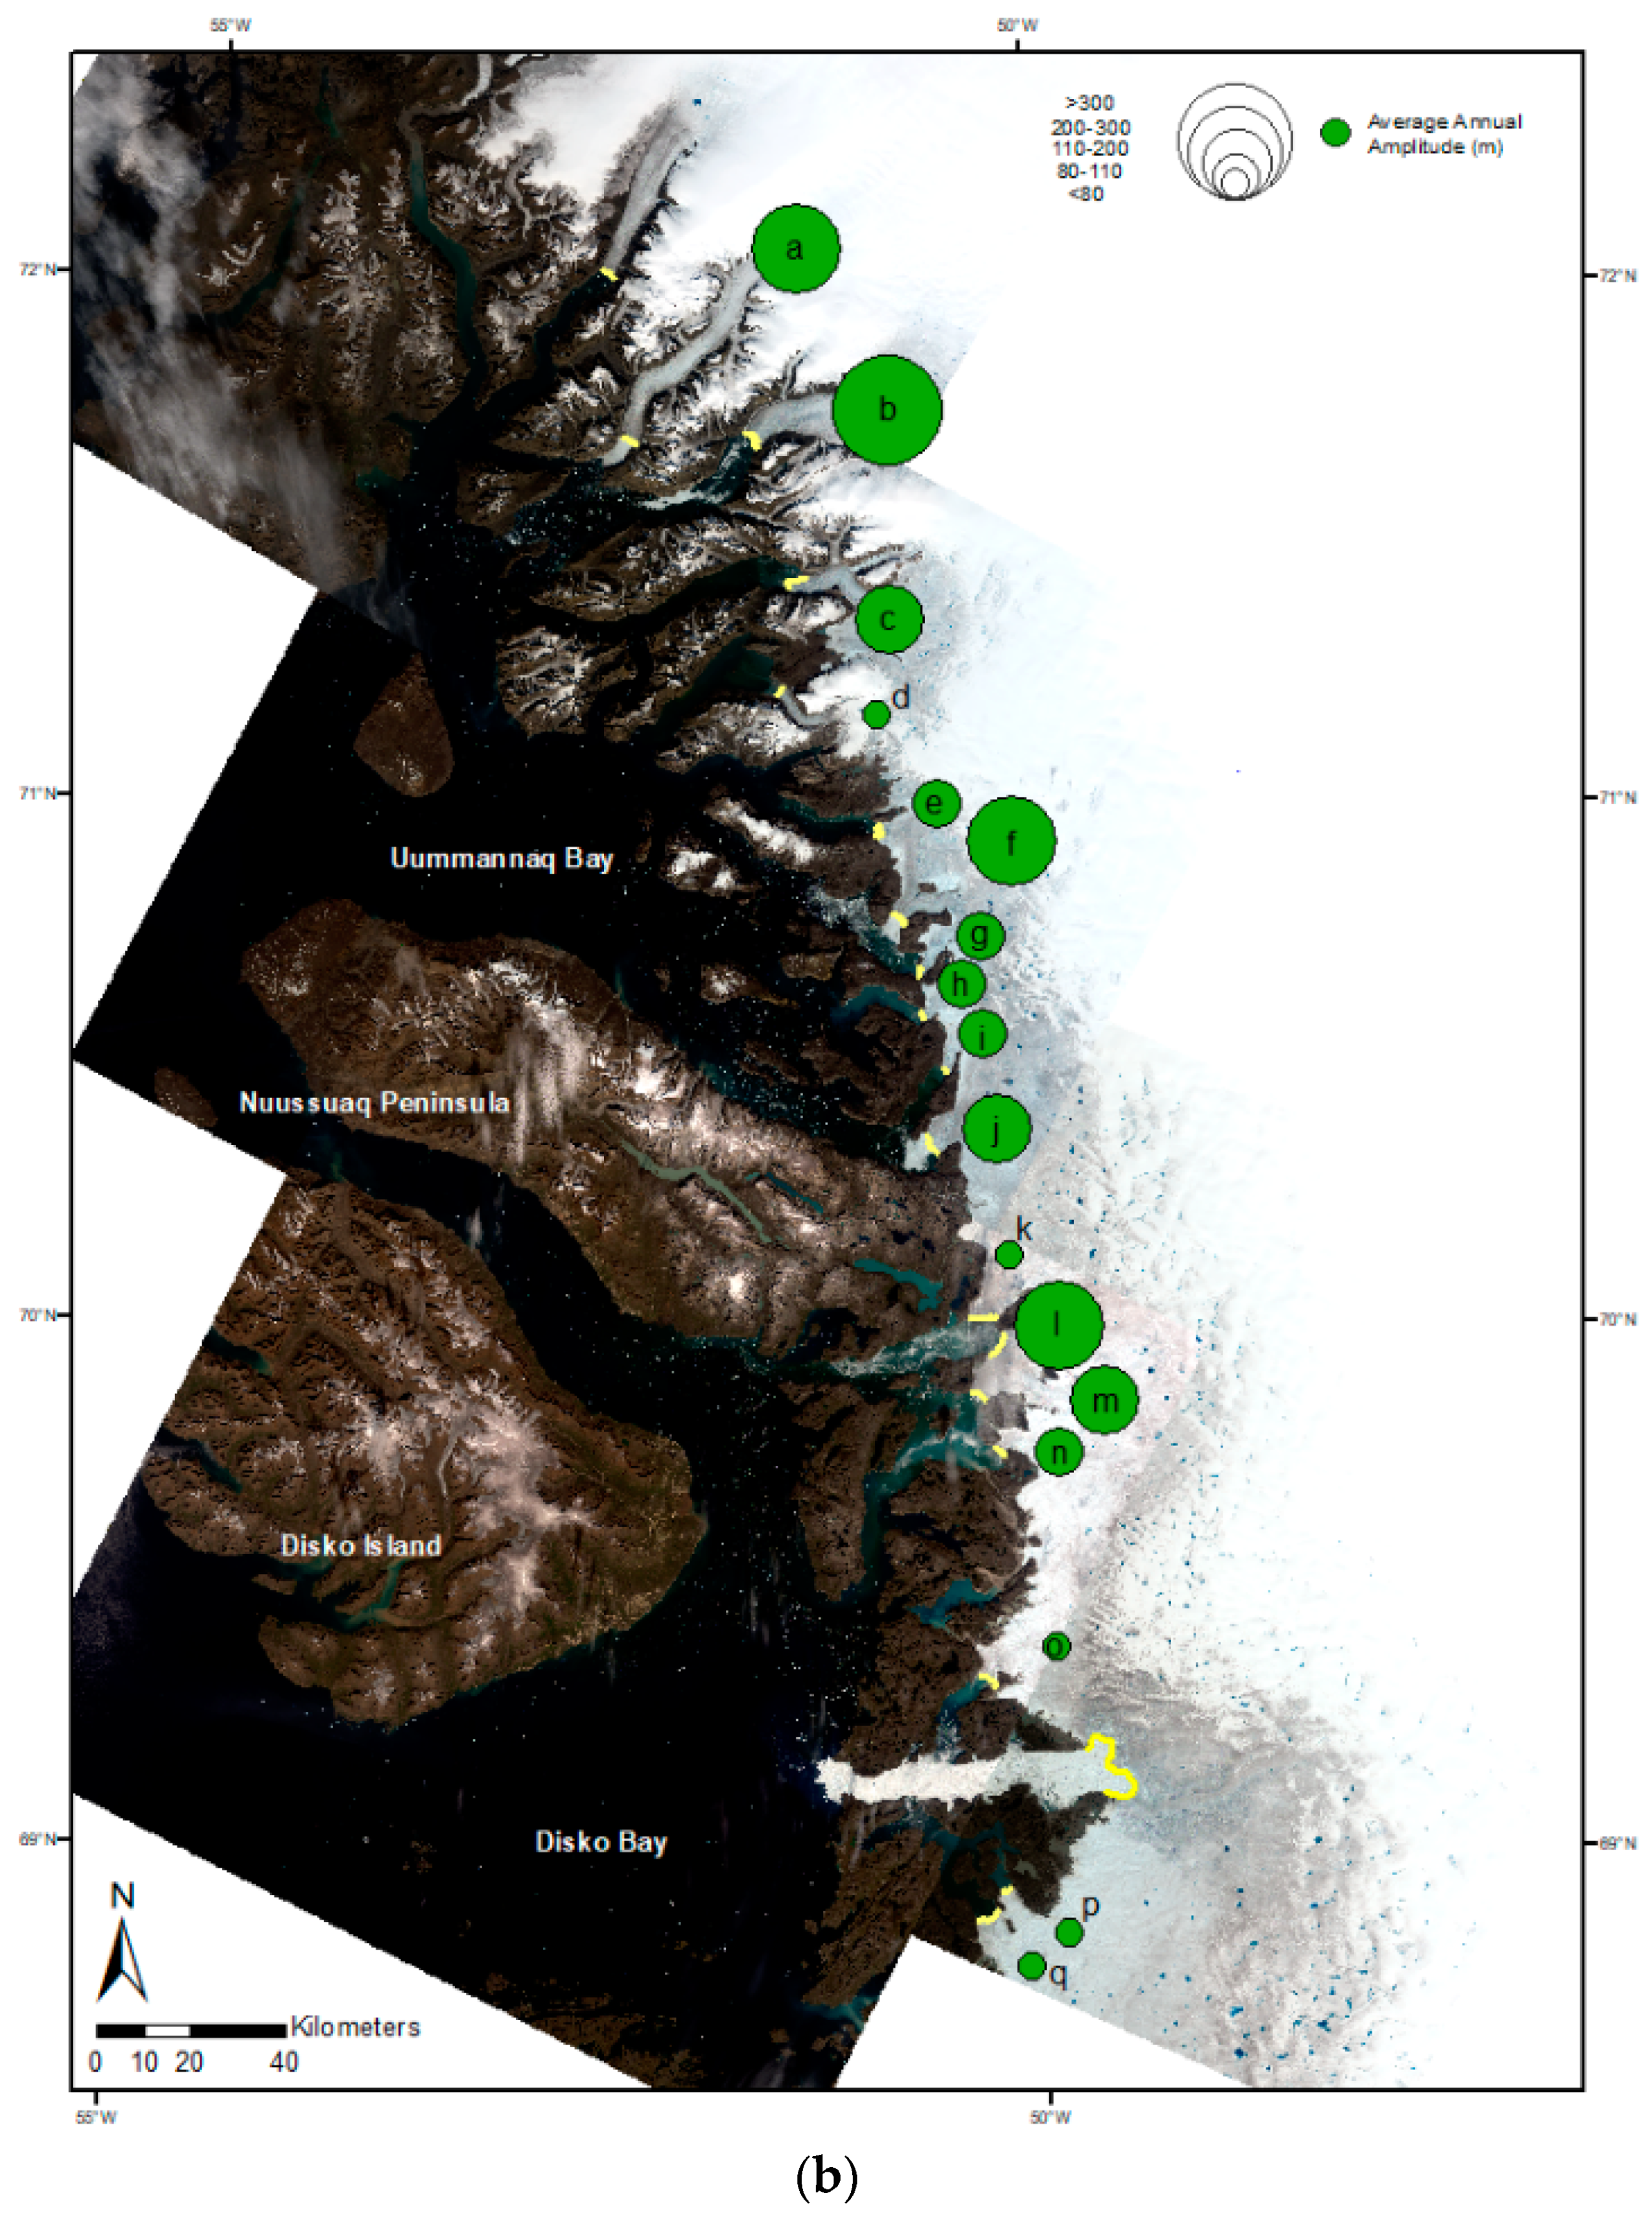
2.1. Study Area
2.2. Data
2.3. Retreat Calculation
2.4. Change Point Analysis
2.5. DBEST Parameter Rationale and Error Estimation
2.6. Annual Amplitude in Terminus Position
3. Results
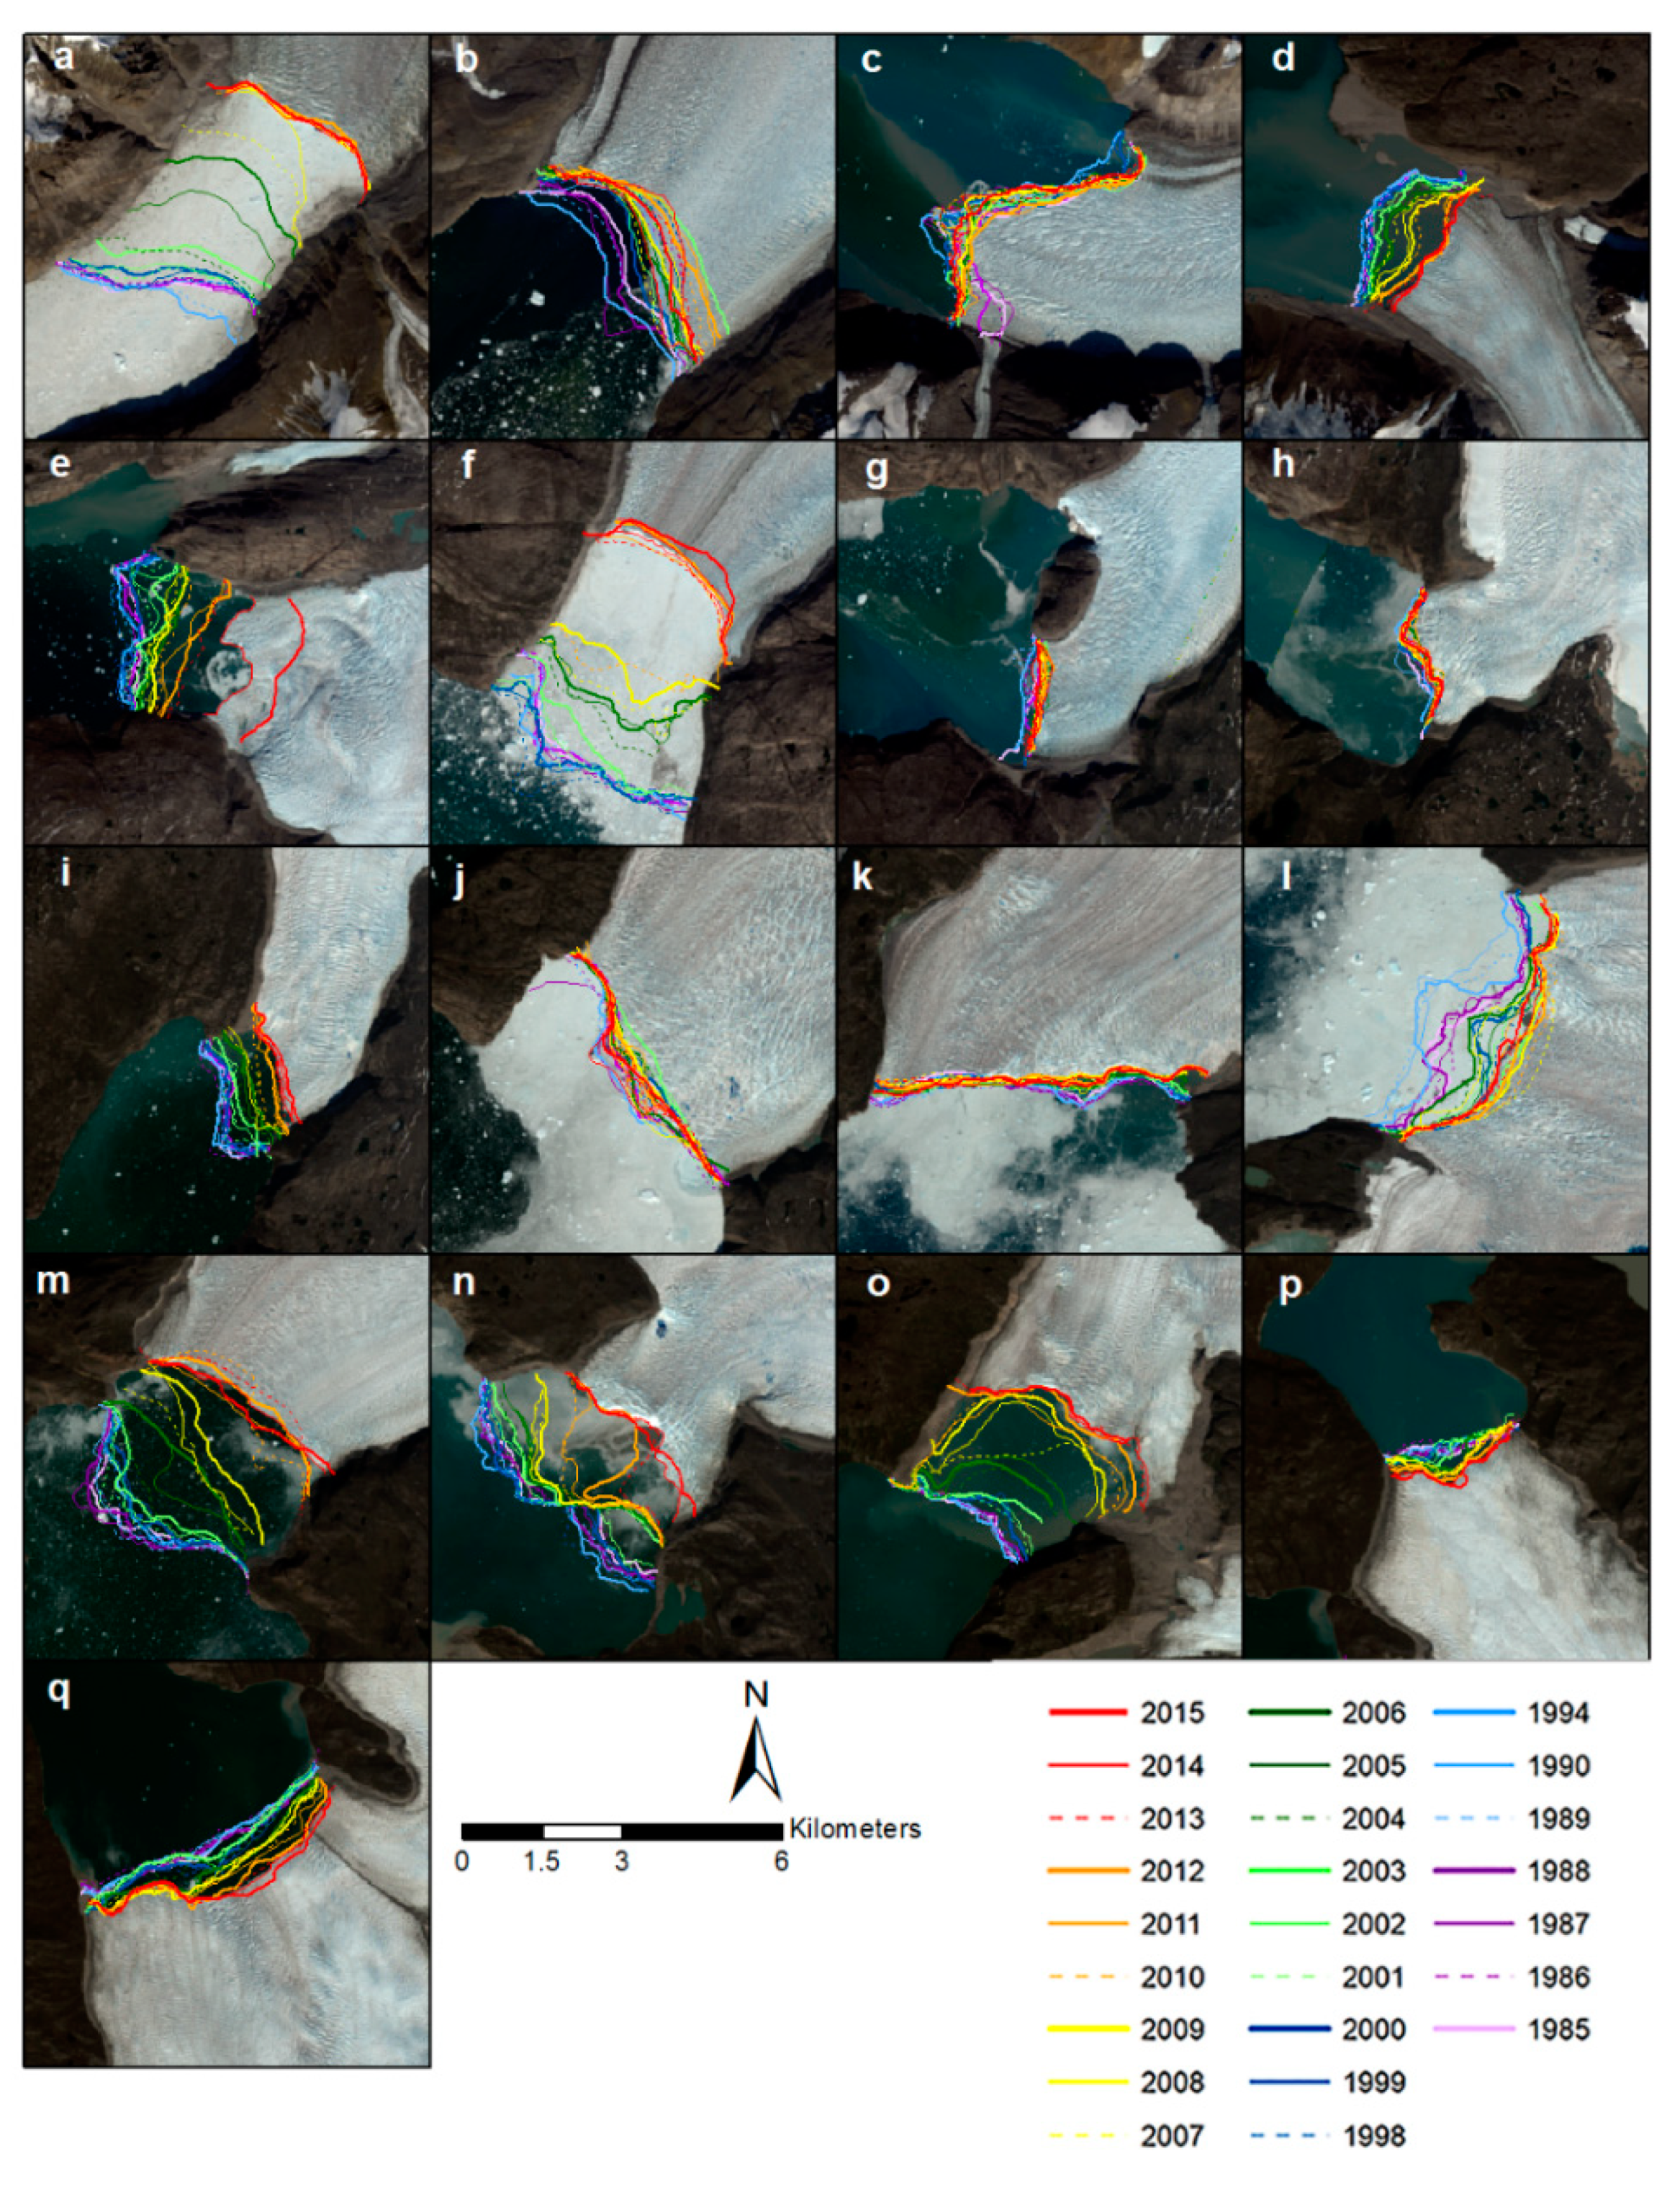
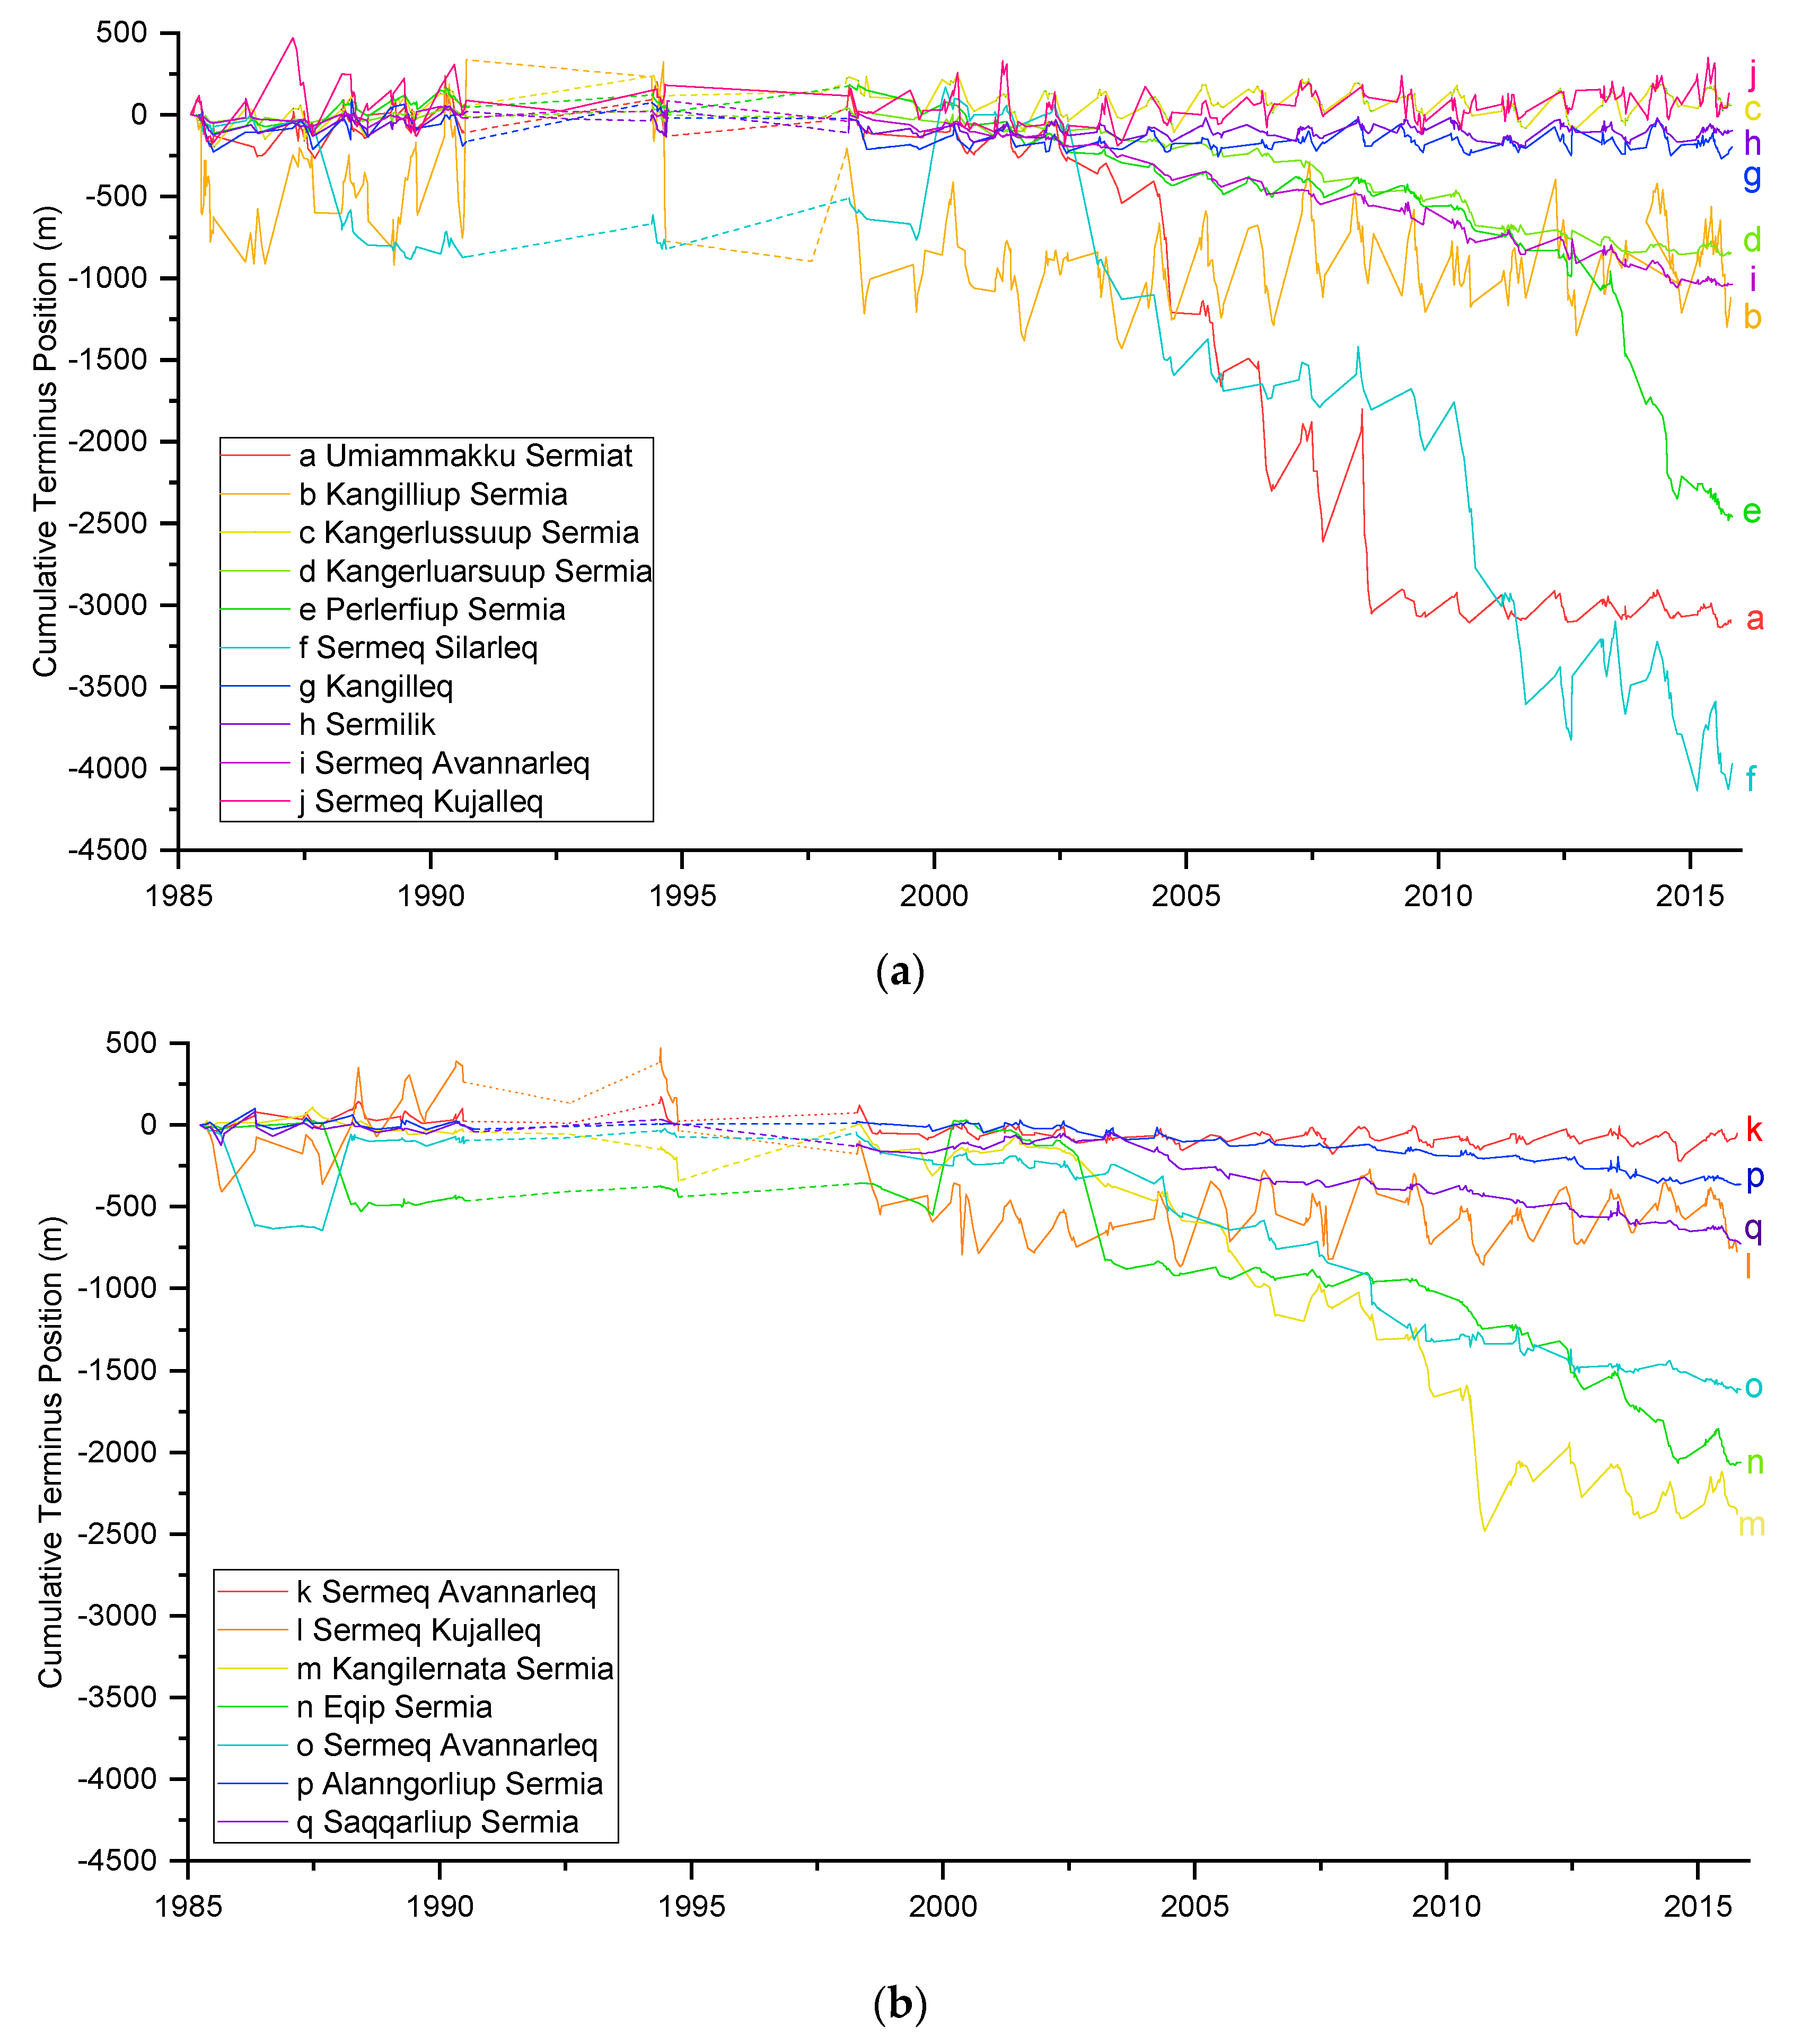
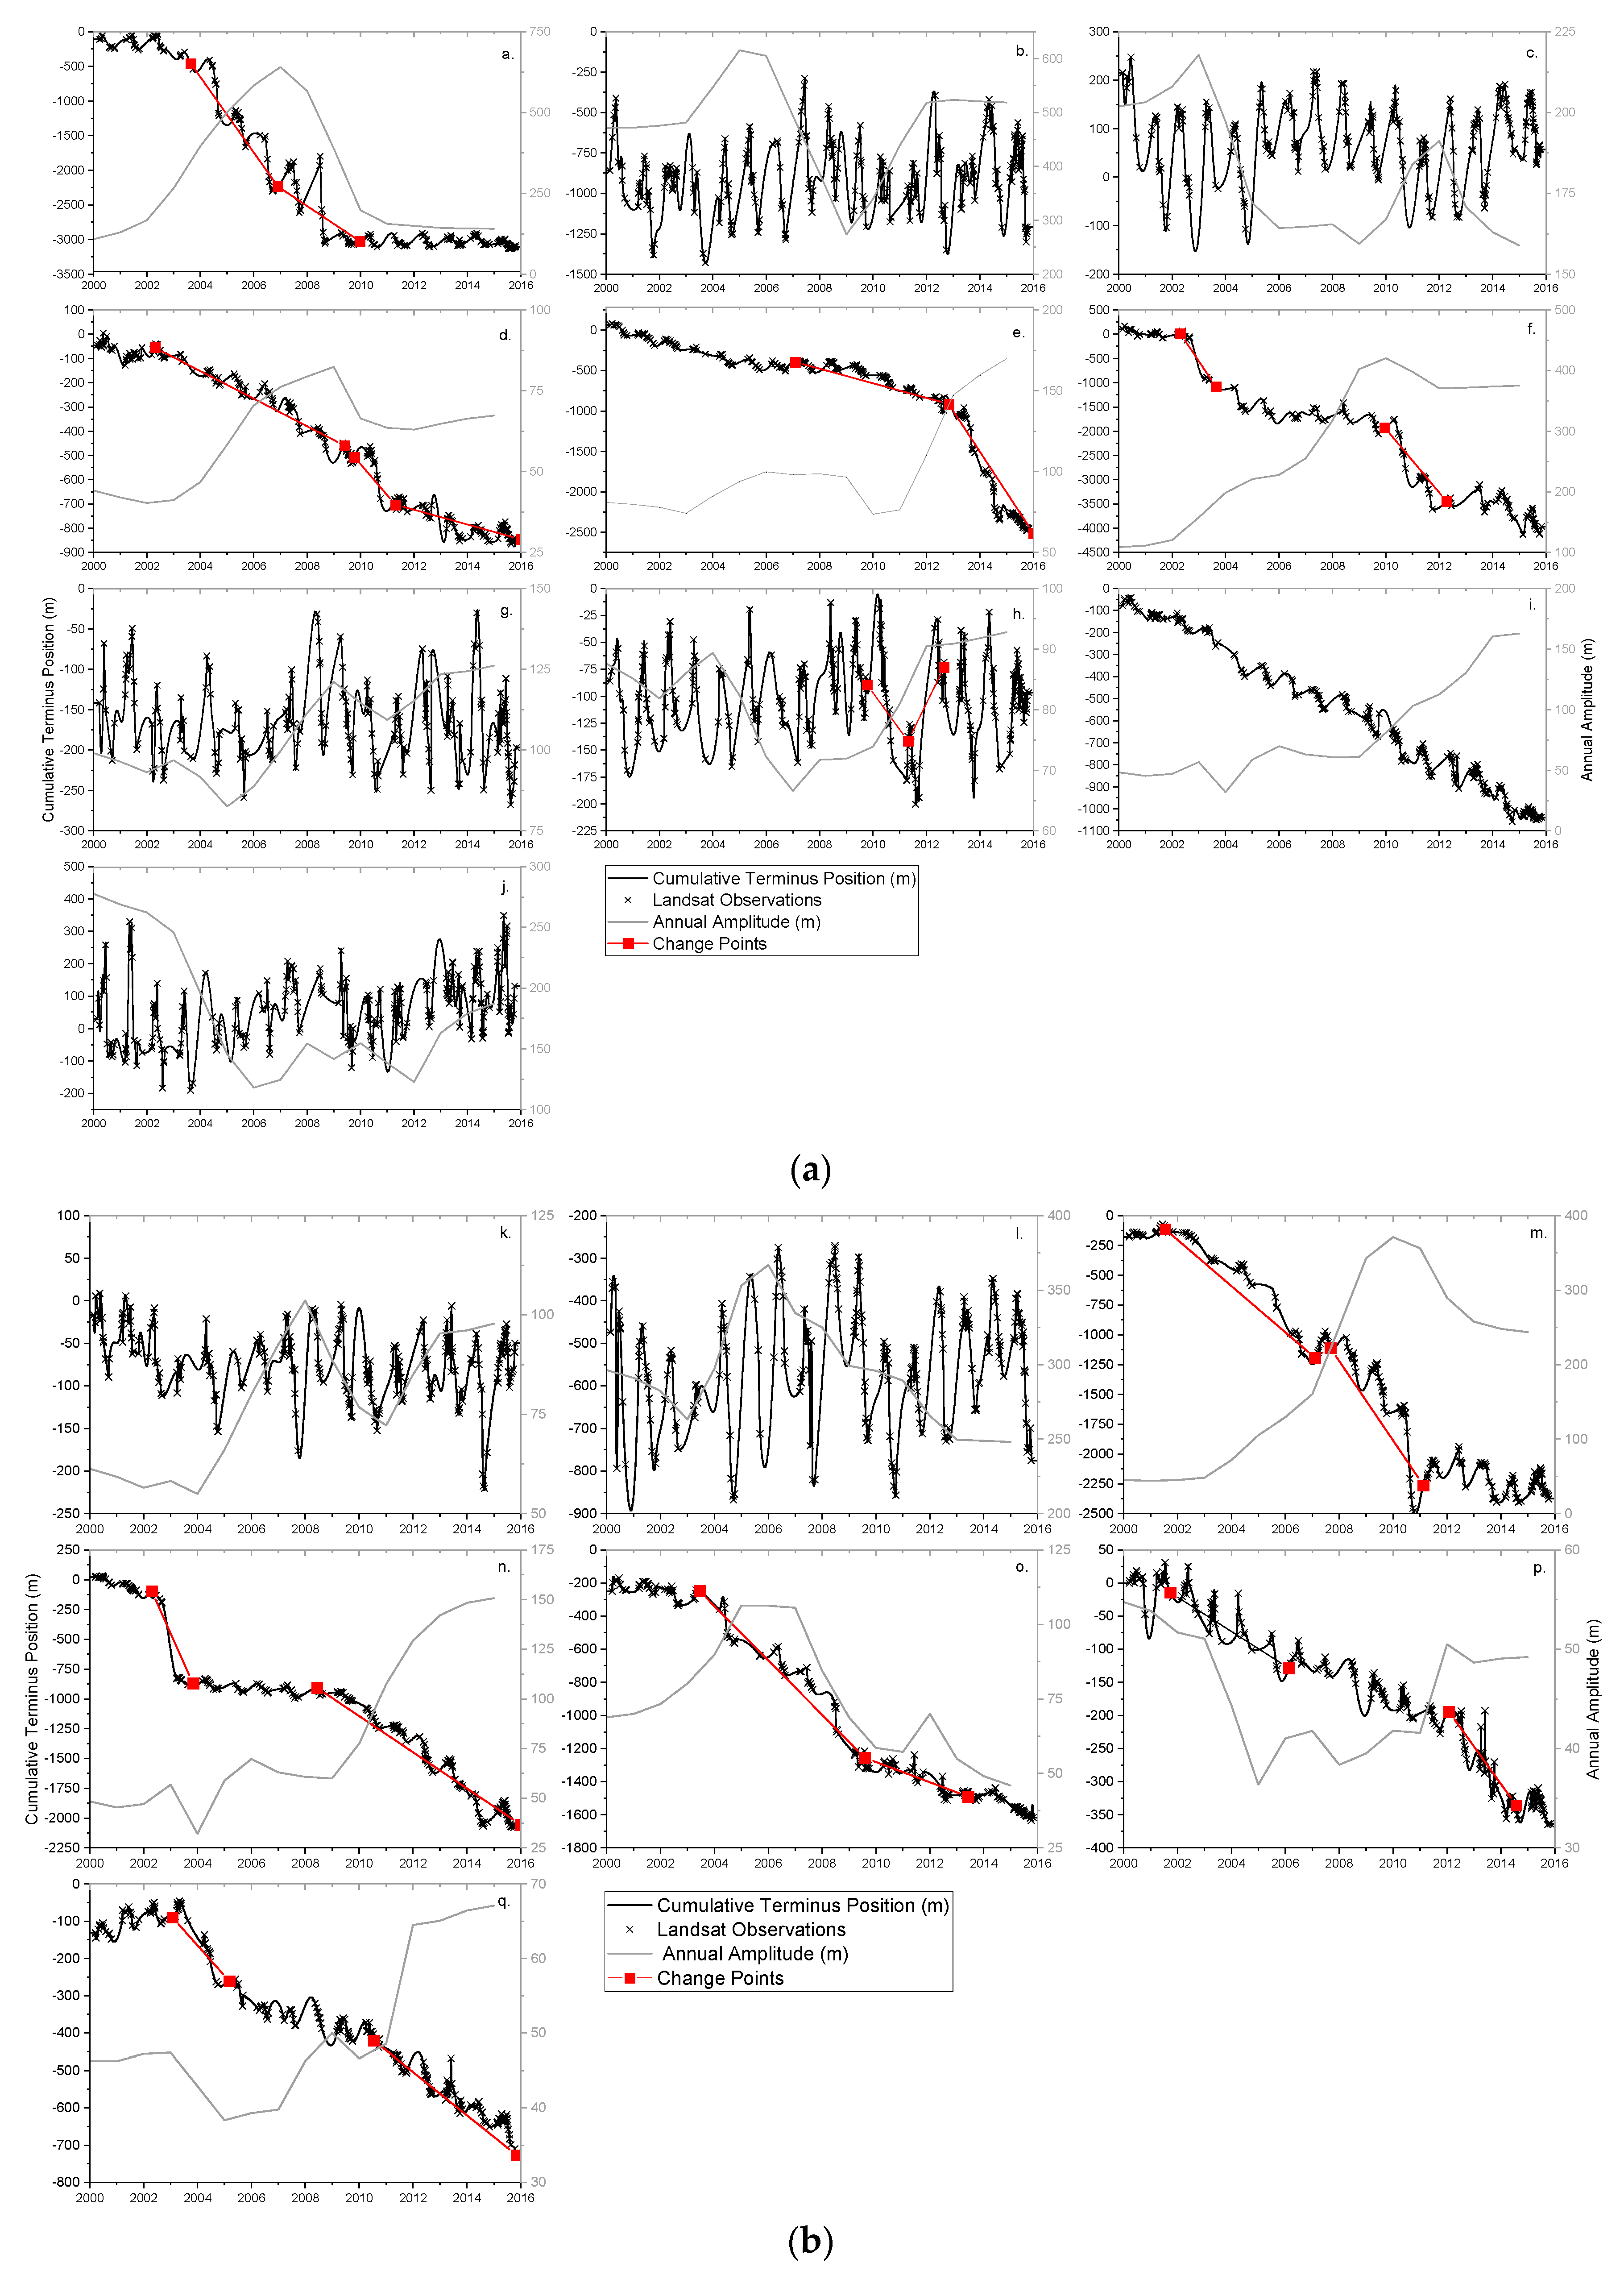
3.1. Cumulative Terminus Change
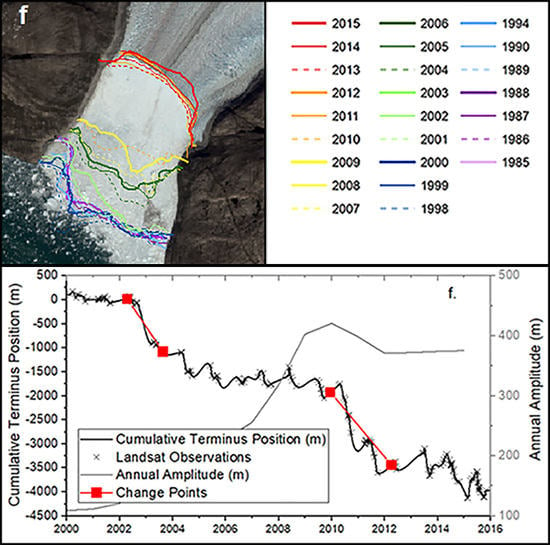
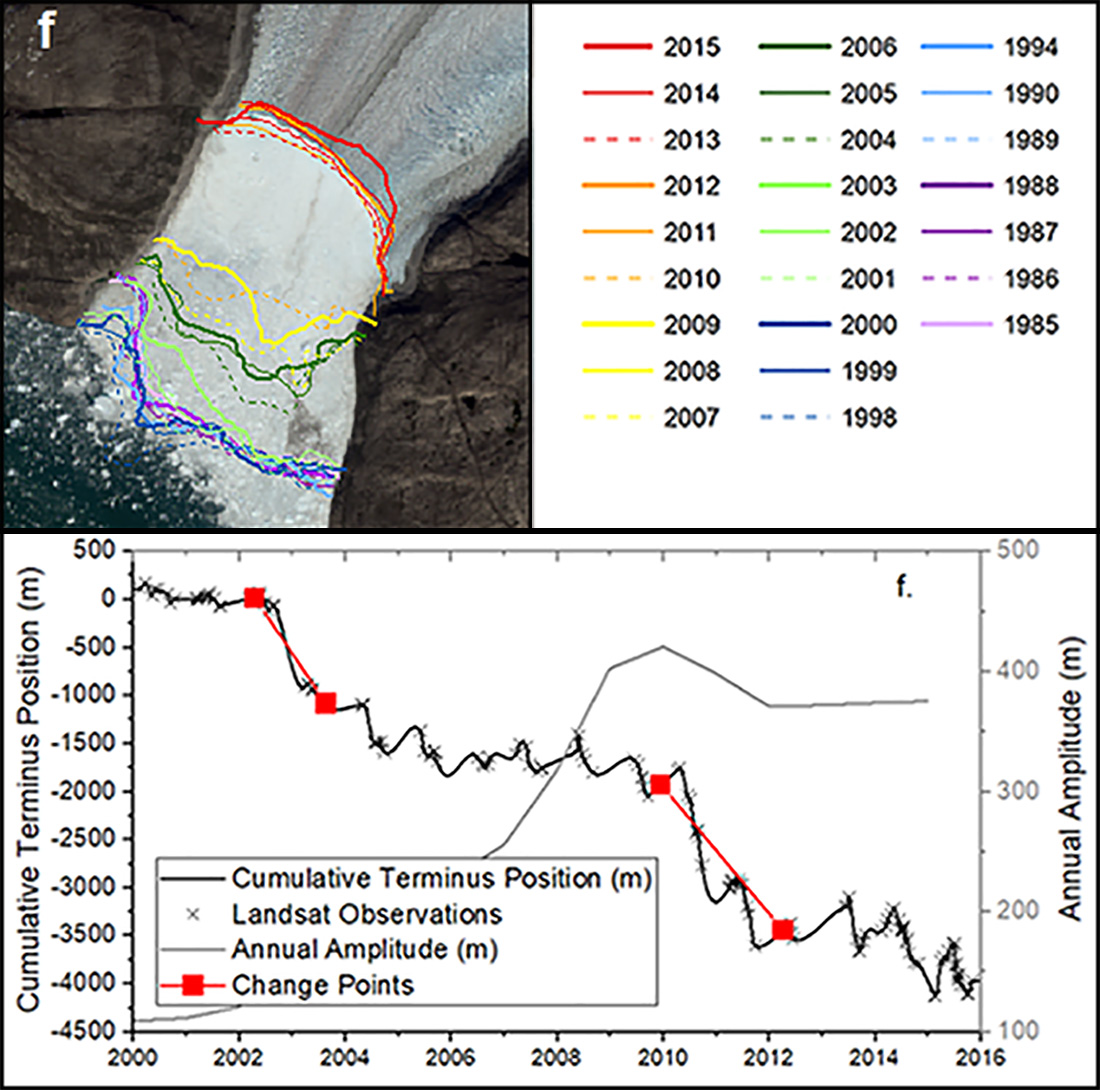
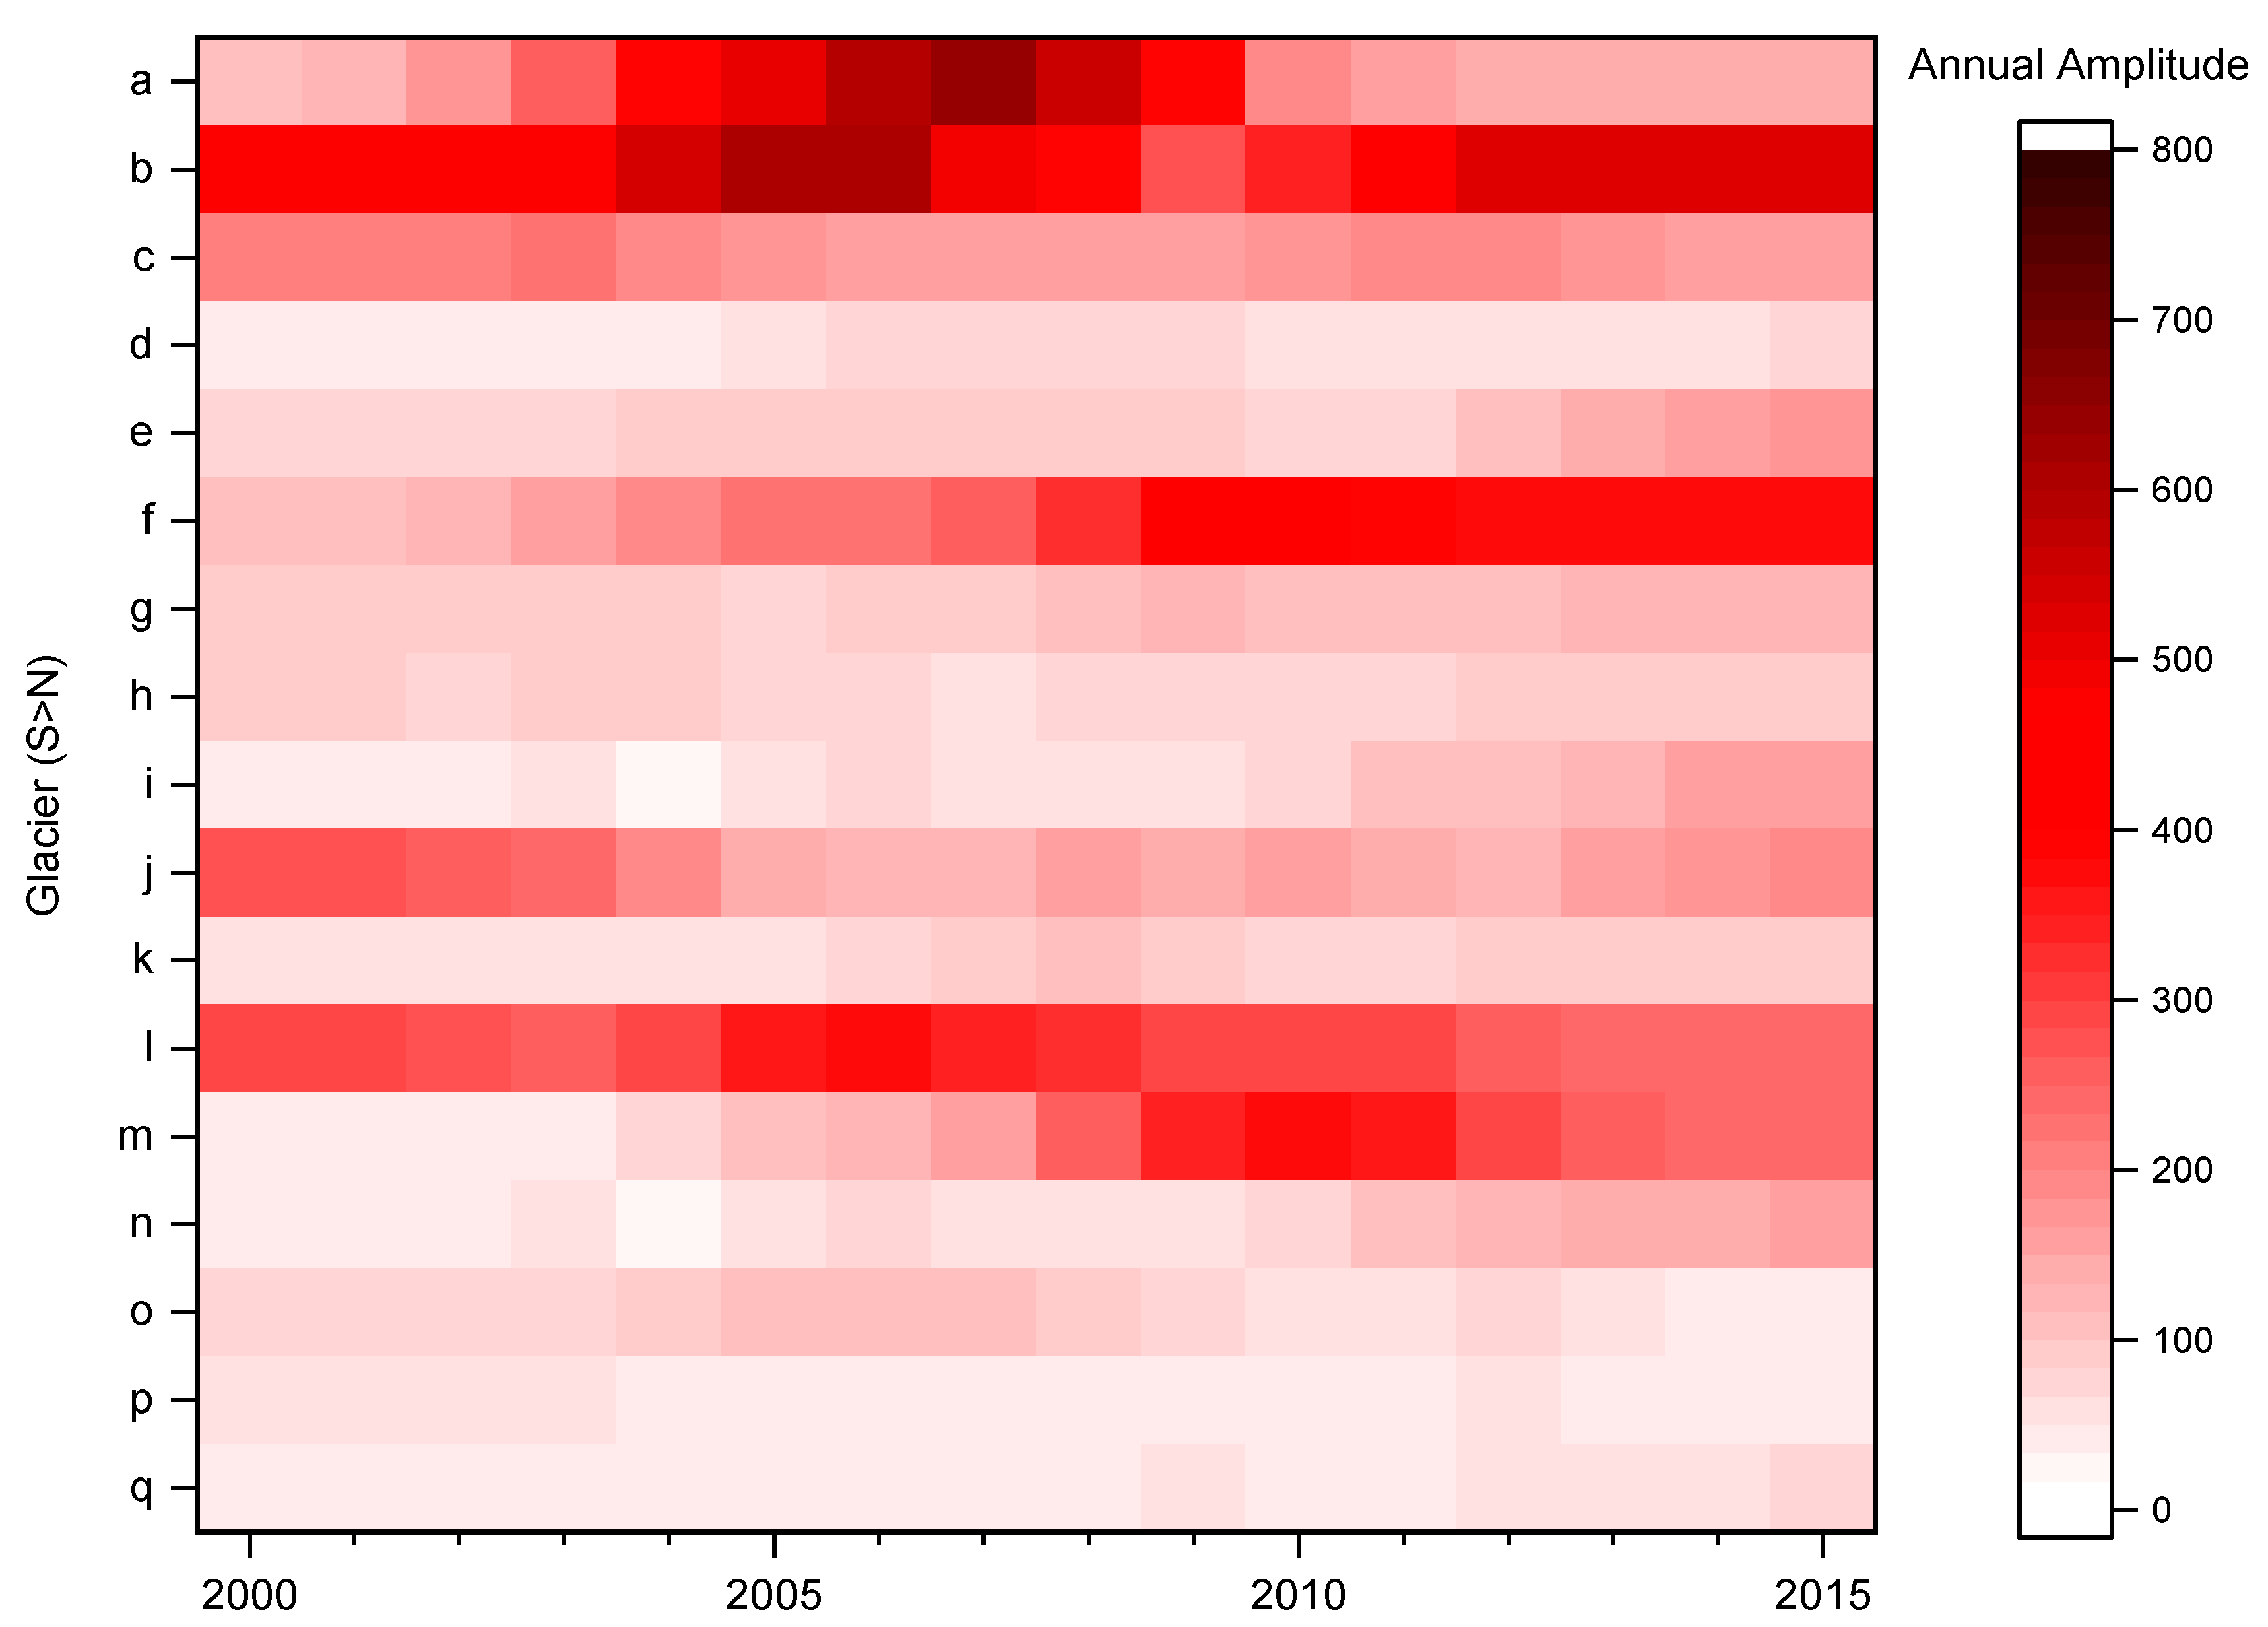
3.2. Annual Amplitude in Terminus Position
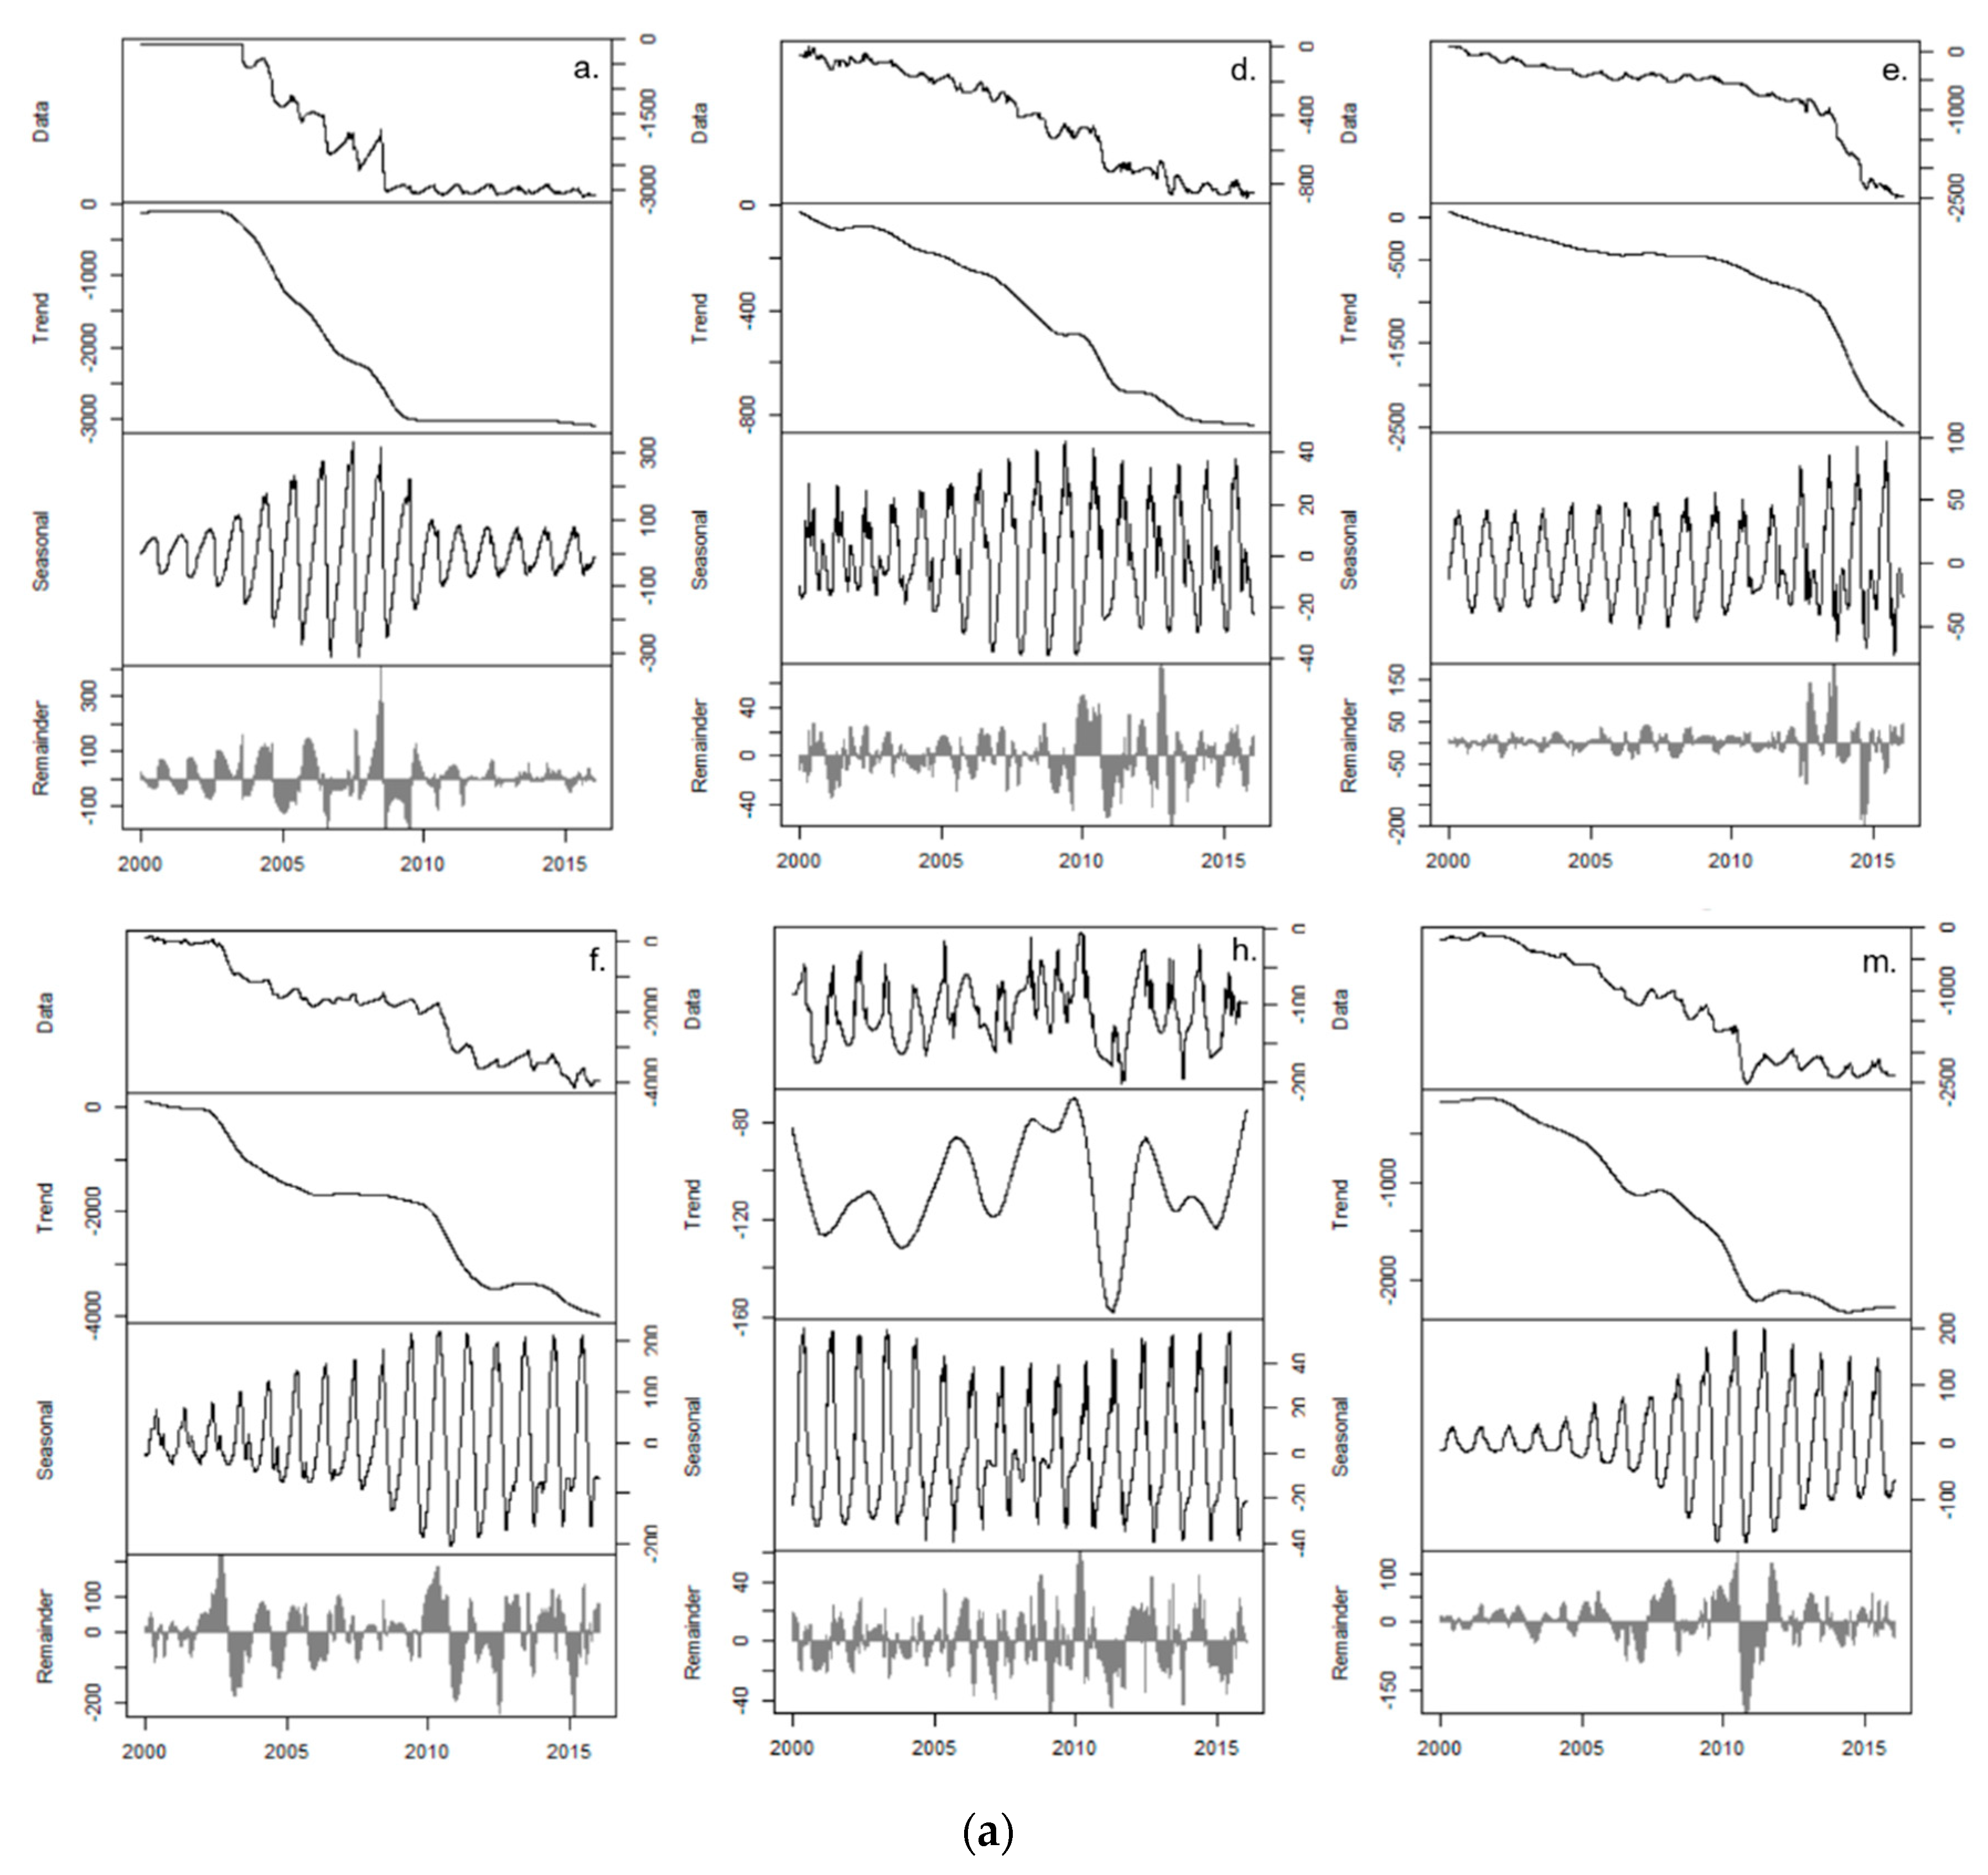
3.3. Change Points Analysis
4. Discussion
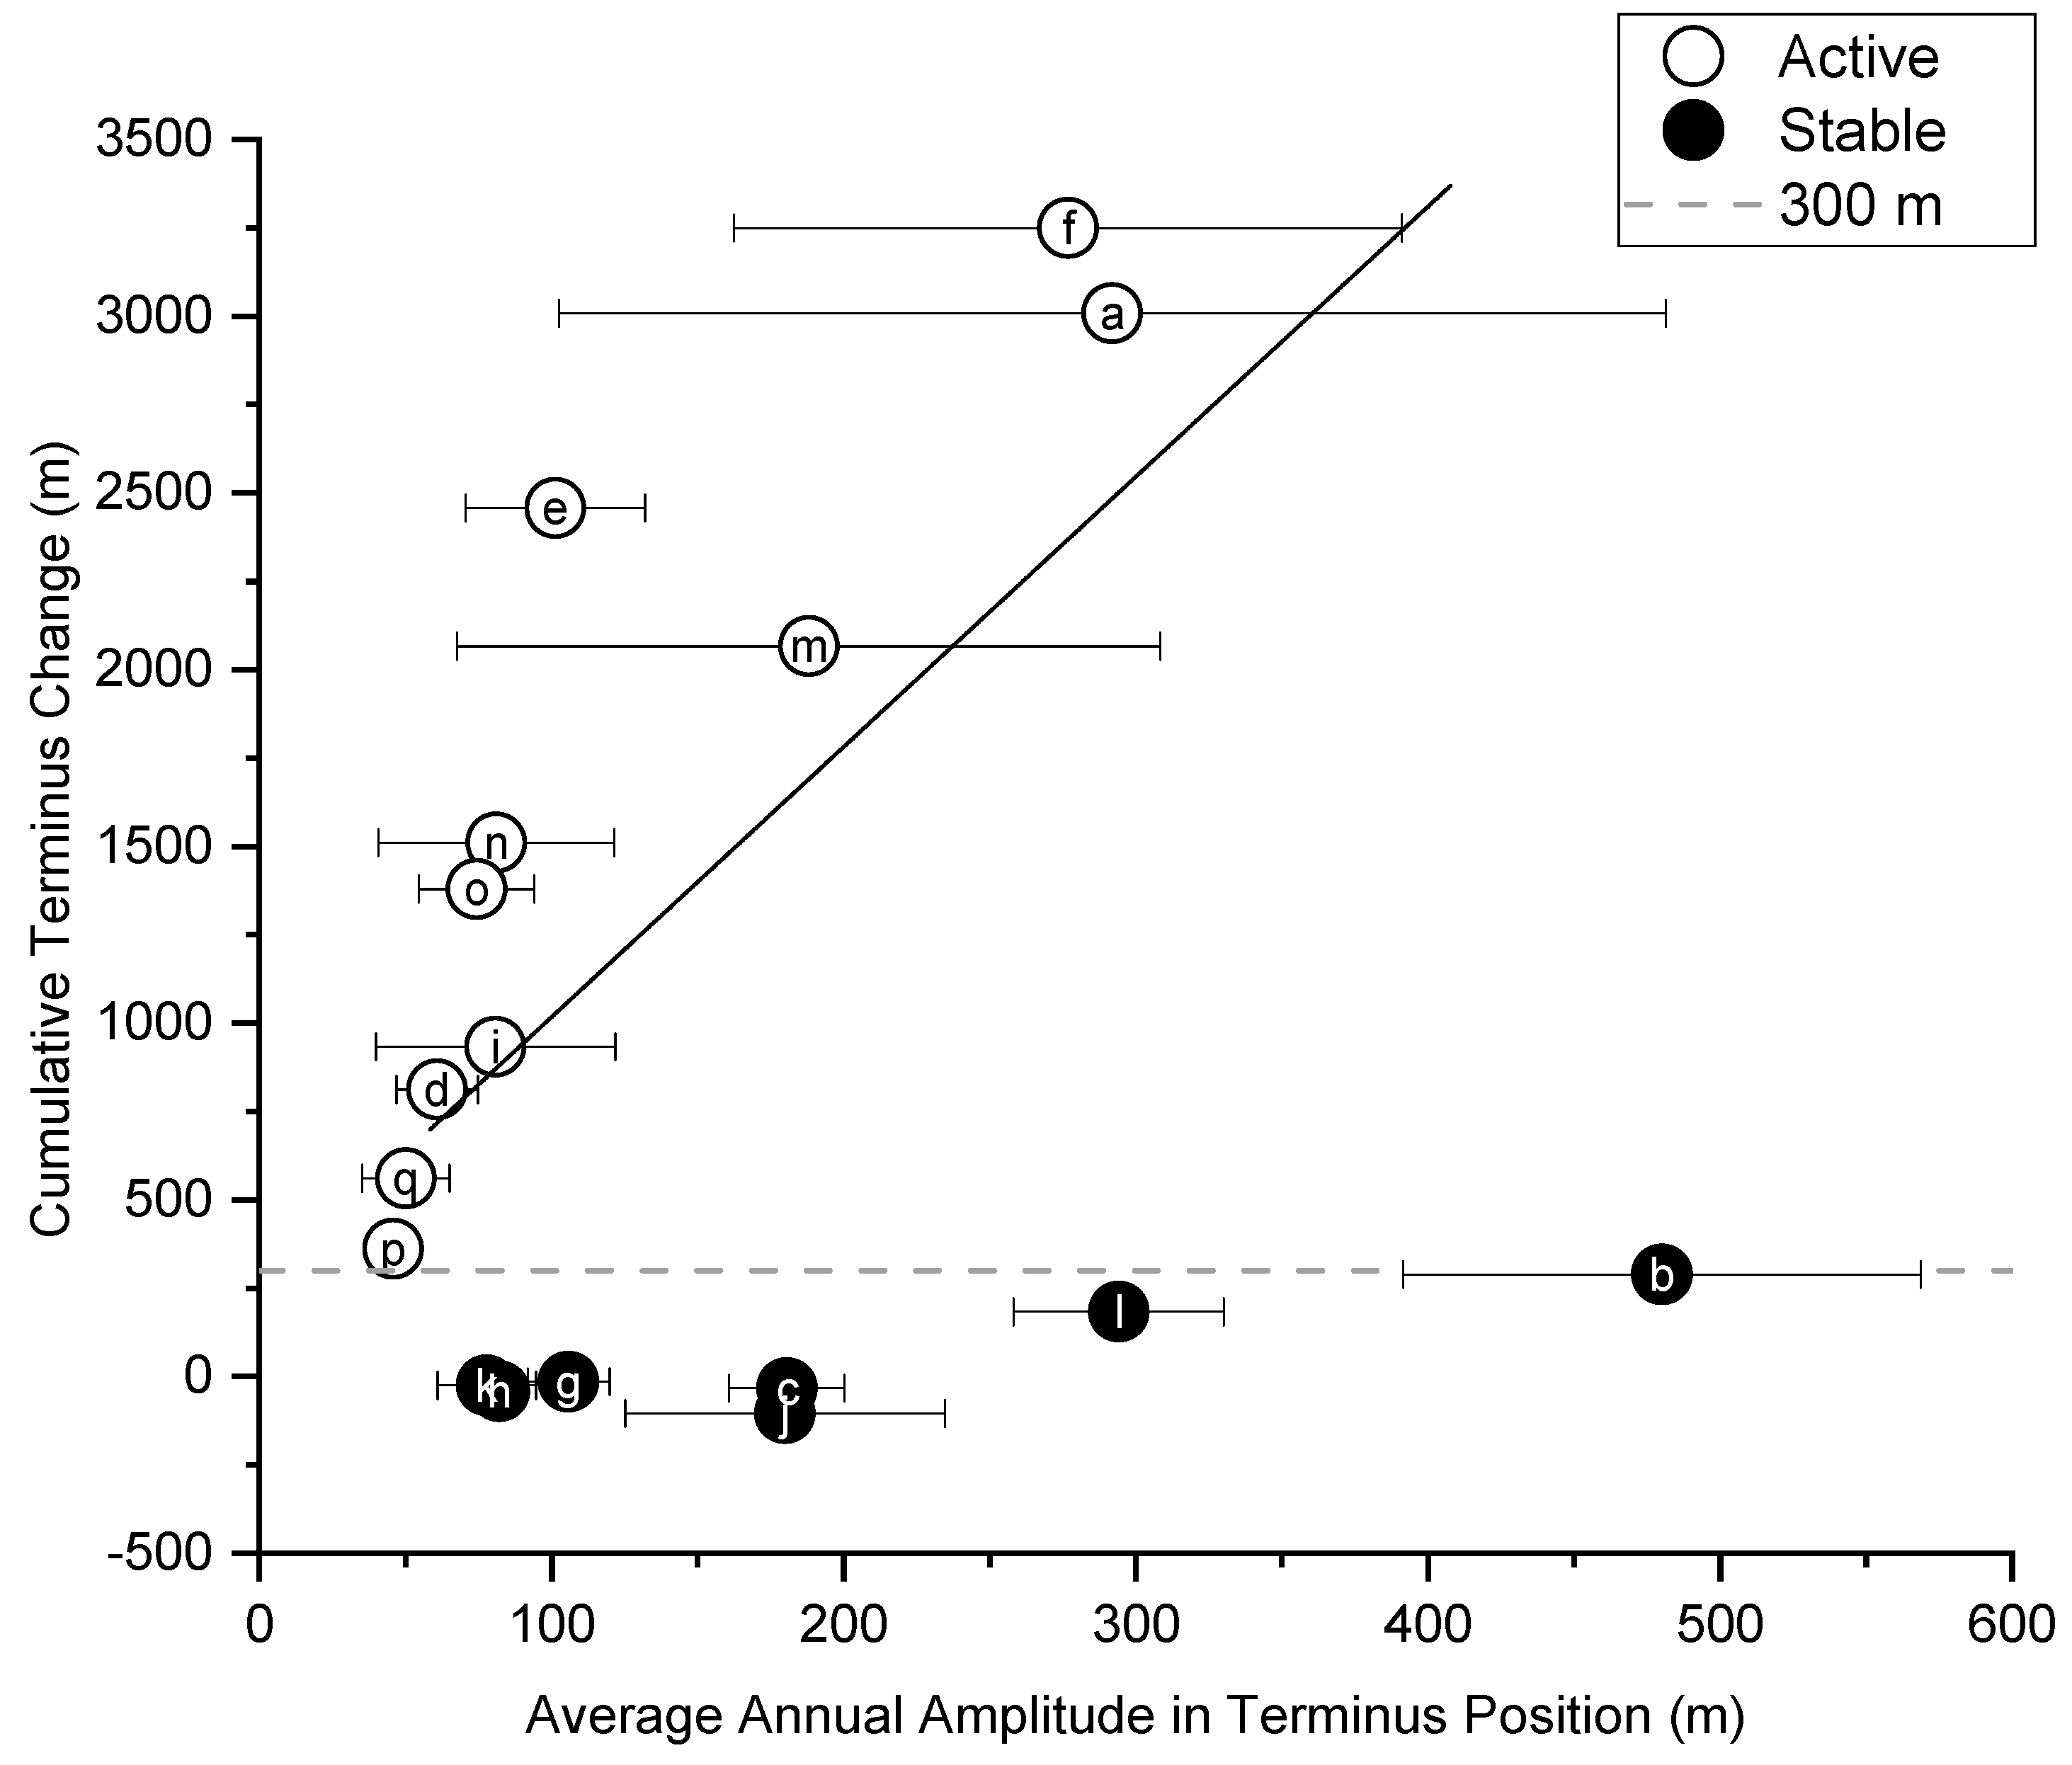
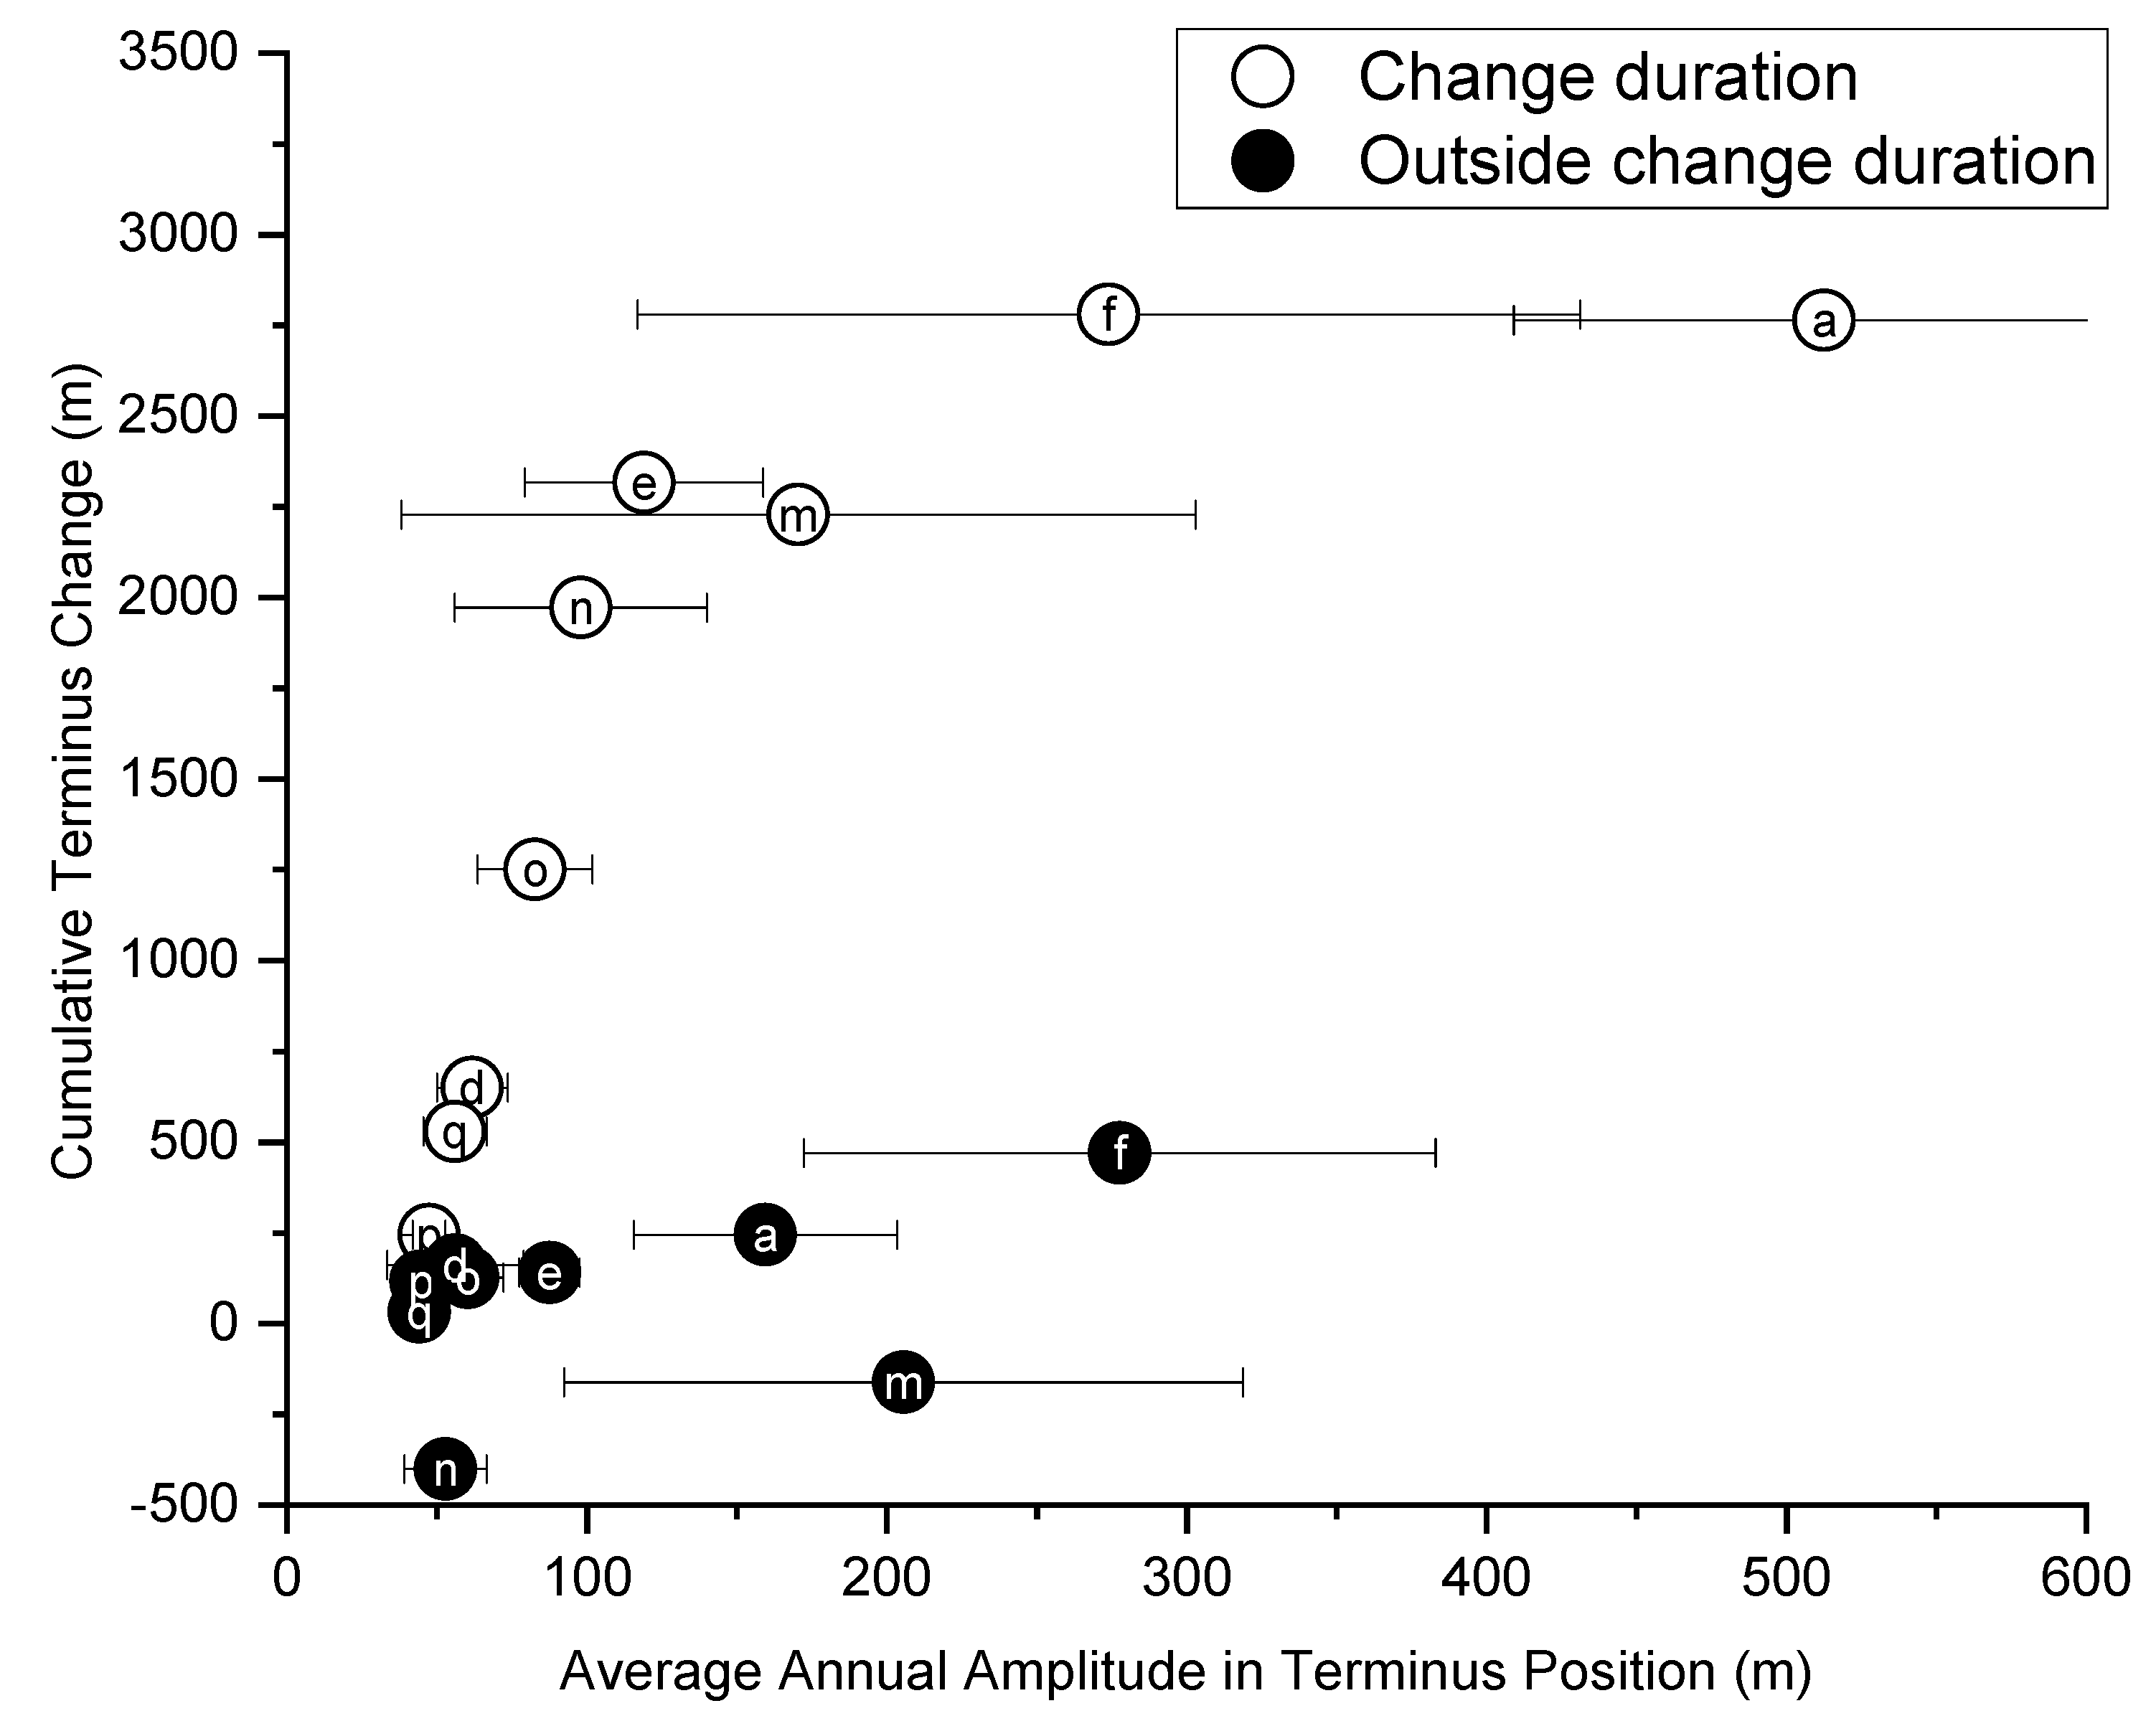
4.1. Cumulative Terminus Retreat and Annual Amplitude in Terminus Position
4.2. Change Point Analysis
4.2.1. Active Glaciers—Uummannaq Bay
4.2.2. Active Glaciers—Disko Bay
4.2.3. Stable Glaciers—Disko and Uummannaq Bays
5. Conclusions
Author Contributions
Funding
Acknowledgments
Conflicts of Interest
Appendix A

| Reference Letter | Official Glacier Name | Old Greenlandic Name | Foreign Name | ID | Lat | Lon | # of Observations 1985–2015 | # of Observations 1985–1999 | # of Observations 2000–2015 |
|---|---|---|---|---|---|---|---|---|---|
| * | Salliarutsip Sermia | Sagdliarutsip Sermia | Inngia Isbræ | GGN0390 | 72.0373 | −52.6054 | |||
| a | Umiammakku Sermiat | Umiámáko Sermiat | Umiammakku Isbræ | GGN0348 | 71.8063 | −52.3578 | 301 | 96 | 205 |
| b | Kangilliup Sermia | Kangigdliup Sermia | Rink Isbræ | GGN0347 | 71.7723 | −51.4951 | 352 | 102 | 250 |
| c | Kangerlussuup Sermia | GGN0326 | 71.4588 | −51.3101 | 324 | 119 | 205 | ||
| d | Kangerluarsuup Sermia | Kangerdluarssûp Sermia | GGN0313 | 71.2493 | −51.4707 | 313 | 85 | 228 | |
| e | Perlerfiup Sermia | Perdlerfiup Sermia | GGN0303 | 70.9909 | −50.9227 | 343 | 91 | 252 | |
| f | Sermeq Silarleq | Sermeq Silardleq | GGN0299 | 70.8268 | −50.7627 | 234 | 89 | 145 | |
| g | Kangilleq | Kangigdleq | GGN0295 | 70.7184 | −50.6523 | 265 | 62 | 203 | |
| h | Sermilik | Sermilik | Sermilik Isbræ | GGN0290 | 70.6333 | −50.6167 | 334 | 85 | 249 |
| i | Sermeq Avannarleq | Sermeq Avangnardleq | Lille Gletsjer | GGN0287 | 70.5454 | −50.4896 | 333 | 96 | 237 |
| j | Sermeq Kujalleq | Sermeq Kujatdleq | Store Gletsjer | GGN0279 | 70.4054 | −50.5364 | 317 | 72 | 245 |
| Average Uummannaq Bay | 312 ± 37 | 90 ± 16 | 222 ± 33 | ||||||
| k | Sermeq Avannarleq | Sermeq Avangnardleq | GGN0265 | 70.0853 | −50.2468 | 292 | 65 | 227 | |
| l | Sermeq Kujalleq | Sermeq Kujatdleq | GGN0256 | 69.9960 | −50.1596 | 294 | 64 | 230 | |
| m | Kangilernata Sermia | Kangilernata Sermia | GGN0253 | 69.9009 | −50.3420 | 266 | 54 | 212 | |
| n | Eqip Sermia | Eqip Sermia | GGN0250 | 69.8080 | −50.1851 | 305 | 68 | 237 | |
| o | Sermeq Avannarleq | Sermeq Avangnardleq | GGN0240 | 69.3833 | −50.2667 | 265 | 64 | 201 | |
| * | Sermeq Kujalleq | Sermeq Kujatdleq | Jakobshavn Isbræ | GGN0235 | 69.1833 | −49.8000 | |||
| p | Alanngorliup Sermia | Alángordliup Sermia | GGN0229 | 68.9167 | −50.2000 | 247 | 48 | 199 | |
| q | Saqqarliup Sermia | Sarqardliup Sermia | GGN0227 | 68.8667 | −50.2833 | 257 | 47 | 210 | |
| Average Disko Bay | 275 ± 22 | 59 ± 9 | 217 ± 15 | ||||||
| Average Overall | 297 ± 35 | 77 ± 20 | 220 ± 26 | ||||||
| Glacier | Timing Error (days) | Magnitude Error (m) |
|---|---|---|
| a | mean (1.6, 2.6) =2.1 | mean (4.5, 5.0) = 4.8 |
| d | mean (5.1, 2.8, 10.3) = 6.1 | mean (1.7, 2.3, 2.0) = 2.0 |
| e | mean (5.8, 1.6) = 3.7 | mean (4.4, 3.5) = 4.0 |
| f | mean (1.4, 1.4) = 1.4 | mean (6.0, 5.8) = 5.9 |
| h | mean (1.0, 1.0) = 1.0 | mean (0.4, 0.4) = 0.4 |
| m | mean (5.3, 3.6) = 4.5 | mean (5.7, 6.9) = 6.3 |
| n | mean (3.5, 1.2) = 2.4 | mean (3.2, 3.7) = 3.4 |
| o | mean (3.5, 7.9) = 5.7 | mean (3.1, 3.3) = 3.2 |
| p | mean (3.7, 1.8) = 2.7 | mean (0.5, 0.5) = 0.5 |
| q | mean (1.4, 2.2) = 1.8 | mean (0.8, 0.6) = 0.7 |


References
- Howat, I.M.; Box, J.E.; Ahn, Y.; Herrington, A.; McFadden, E.M. Seasonal variability in the dynamics of marine-terminating outlet glaciers in Greenland. J. Glaciol. 2010, 56, 601–613. [Google Scholar] [CrossRef] [Green Version]
- McFadden, E.M.; Howat, I.M.; Joughin, I.; Smith, B.E.; Ahn, Y. Changes in the dynamics of marine terminating outlet glaciers in west Greenland (2000–2009). J. Geophys. Res. Earth Surf. 2011, 116, 1–16. [Google Scholar] [CrossRef]
- Moon, T.; Joughin, I.; Smith, B.; Howat, I.M. 21st-Century Evolution of Greenland Outlet Glacier Velocities. Science 2012, 336, 576–578. [Google Scholar] [CrossRef] [PubMed] [Green Version]
- Catania, G.A.; Stearns, L.A.; Sutherland, D.A.; Fried, M.J.; Bartholomaus, T.C.; Morlighem, M.; Shroyer, E.; Nash, J. Geometric Controls on Tidewater Glacier Retreat in Central Western Greenland. J. Geophys. Res. Earth Surf. 2018, 123, 2024–2038. [Google Scholar] [CrossRef]
- Howat, I.M.; Joughin, I.; Scambos, T.A. Rapid Discharge from Greenland Outlet Glaciers. Science 2007, 315, 1559–1561. [Google Scholar] [CrossRef] [Green Version]
- Howat, I.M.; Eddy, A. Multi-decadal retreat of Greenland’s marine-terminating glaciers. J. Glaciol. 2011, 57, 389–396. [Google Scholar] [CrossRef] [Green Version]
- Felikson, D.; Bartholomaus, T.C.; Catania, G.A.; Korsgaard, N.J.; Kjær, K.H.; Morlighem, M.; Noël, B.; van den Broeke, M.; Stearns, L.A.; Shroyer, E.L.; et al. Inland thinning on the Greenland ice sheet controlled by outlet glacier geometry. Nat. Geosci. 2017, 10, 366–369. [Google Scholar] [CrossRef]
- Rignot, E.; Kanagaratnam, P. Changes in the velocity structure of the Greenland ice sheet. Science 2006, 311, 986–990. [Google Scholar] [CrossRef] [Green Version]
- Moon, T.; Joughin, I.; Smith, B. Seasonal to multiyear variability of glacier surface velocity, terminus position, and sea ice/ice mélange in northwest Greenland. J. Geophys. Res. Earth Surf. 2015, 120, 813–833. [Google Scholar] [CrossRef]
- Fried, M.J.; Catania, G.A.; Stearns, L.A.; Sutherland, D.A.; Bartholomaus, T.C.; Shroyer, E.; Nash, J. Reconciling Drivers of Seasonal Terminus Advance and Retreat at 13 Central West Greenland Tidewater Glaciers. J. Geophys. Res. Earth Surf. 2018, 123, 1590–1607. [Google Scholar] [CrossRef]
- Rignot, E.; Fenty, I.; Xu, Y.; Cai, C.; Velicogna, I.; Cofaigh, C.Ó.; Dowdeswell, J.A.; Weinrebe, W.; Catania, G.; Duncan, D. Bathymetry data reveal glaciers vulnerable to ice-ocean interaction in Uummannaq and Vaigat glacial fjords, west Greenland. Geophys. Res. Lett. 2016, 43, 2667–2674. [Google Scholar] [CrossRef] [Green Version]
- Carr, J.R.; Bell, H.; Killick, R.; Holt, T. Exceptional retreat of Novaya Zemlya’s marine-terminating outlet glaciers between 2000 and 2013. Cryosphere 2017, 11, 2149–2174. [Google Scholar] [CrossRef] [Green Version]
- Seale, A.; Christoffersen, P.; Mugford, R.I.; O’Leary, M. Ocean forcing of the Greenland Ice Sheet: Calving fronts and patterns of retreat identified by automatic satellite monitoring of eastern outlet glaciers. J. Geophys. Res. Earth Surf. 2011, 116, 1–16. [Google Scholar] [CrossRef]
- Bevan, S.L.; Luckman, A.J.; Murray, T. Glacier dynamics over the last quarter of a century at Helheim, Kangerdlugssuaq and 14 other major Greenland outlet glaciers. Cryosphere 2012, 6, 923–937. [Google Scholar] [CrossRef] [Green Version]
- Schild, K.M.; Hamilton, G.S. Seasonal variations of outlet glacier terminus position in Greenland. J. Glaciol. 2013, 59, 759–770. [Google Scholar] [CrossRef]
- Jensen, T.S.; Box, J.E.; Hvidberg, C.S. A sensitivity study of annual area change for Greenland ice sheet marine terminating outlet glaciers: 1999–2013. J. Glaciol. 2016, 62, 72–81. [Google Scholar] [CrossRef] [Green Version]
- Thomas, Z. Using natural archives to detect climate and environmental tipping points in the Earth System. Quat. Sci. Rev. 2016, 152, 60–71. [Google Scholar] [CrossRef]
- Robel, A.A.; Roe, G.H.; Haseloff, M. Response of Marine-Terminating Glaciers to Forcing: Time Scales, Sensitivities, Instabilities, and Stochastic Dynamics. J. Geophys. Res. Earth Surf. 2018, 123, 1–23. [Google Scholar] [CrossRef]
- Dakos, V.M.; Scheffer, M.; van Nes, E.H.; Brovkin, V.; Petoukhov, V.; Held, H. Slowing down as an early warning signal for abrupt climate change. Proc. Natl. Acad. Sci. USA 2008, 105, 14308–14312. [Google Scholar] [CrossRef] [Green Version]
- Livina, V.N.; Lenton, T.M. A recent tipping point in the Arctic sea-ice cover: Abrupt and persistent increase in the seasonal cycle since 2007. Cryosphere 2013, 7, 275–286. [Google Scholar] [CrossRef] [Green Version]
- Wagner, T.J.W.; Eisenman, I. False alarms: How early warning signals falsely predict abrupt sea ice loss. Geophys. Res. Lett. 2015, 42, 10333–10341. [Google Scholar] [CrossRef] [Green Version]
- Lenton, T.; Held, H.; Kriegler, E.; Hall, J.W.; Lucht, W.; Rahmstorf, S.; Schellnhuber, H.J. Tipping elements in the Earth’s climate system. Proc. Natl. Acad. Sci. USA 2008, 105, 1786–1793. [Google Scholar] [CrossRef] [PubMed] [Green Version]
- Hill, E.; Carr, J.R.; Stokes, C.R.; Gudmundsson, G.H. Dynamic changes in outlet glaciers in northern Greenland from 1948 to 2015. Cryosphere. 2018, 12, 3243–3263. [Google Scholar] [CrossRef] [Green Version]
- Bunce, C.; Carr, J.R.; Niewnow, P.W.; Ross, N. Ice front change of marine-terminating outlet glaciers in northwest and southeast Greenland during the 21st century. J. Glaciol. 2018, 246, 523–535. [Google Scholar] [CrossRef] [Green Version]
- Jamali, S.; Jönsson, P.; Eklundh, L.; Ardö, J.; Seaquist, J. Detecting changes in vegetation trends using time series segmentation. Remote Sens. Environ. 2015, 156, 182–195. [Google Scholar] [CrossRef]
- Rignot, E.; Fenty, I.; Xu, Y.; Cai, C.; Kemp, C. Under- cutting of marine-terminating glaciers in West Greenland. Geophys. Res. Lett. 2015, 42, 5909–5917. [Google Scholar] [CrossRef] [PubMed]
- Bjørk, A.A.; Kruse, L.M.; Michaelsen, P.B. Brief communication: Getting Greenland’s glaciers right—A new data set of all official Greenlandic glacier names. Cryosphere 2015, 9, 2215–2218. [Google Scholar] [CrossRef] [Green Version]
- Stroeve, J.C.; Mioduszewski, J.R.; Rennermalm, A.; Boisvert, L.N.; Tedesco, M.; Robinson, D. Investigating the Local Scale Influence of Sea Ice on Greenland Surface Melt. Cryosphere 2017, 11, 2363–2381. [Google Scholar] [CrossRef] [Green Version]
- Bindschadler, R. Landsat Coverage at High Latitudes. Photogram. Eng. Remote Sens. 2003, 69, 1333–1339. [Google Scholar] [CrossRef]
- Joughin, I.; Smith, B.; Howat, I.; Scambos, T.; Moon, T. Greenland Flow Variability from Ice-Sheet-Wide Velocity Mapping. J. Glaciol. 2010, 56, 415–430. [Google Scholar] [CrossRef] [Green Version]
- Paul, F.; Barrand, N.E.; Baumann, S.; Berthier, E.; Bolch, T.; Casey, K.; Frey, H.; Joshi, S.P.; Konovalov, V.; Le Bris, R.; et al. On the accuracy of glacier outlines derived from remote sensing data. Ann. Glaciol. 2013, 54, 171–182. [Google Scholar] [CrossRef] [Green Version]
- Moon, T.; Joughin, I. Changes in ice front position on Greenland’s outlet glaciers from 1992–2007. J. Geophys. Res. Earth Surf. 2008, 113, 1–10. [Google Scholar] [CrossRef] [Green Version]
- Lea, J.D.; Mair, W.F.; Rea, B.R. Evaluation of existing and new methods of tracking glacier terminus change. J. Glaciol. 2014, 60, 323–332. [Google Scholar] [CrossRef] [Green Version]
- Akima, H. A New Method of Interpolation and Smooth Curve Fitting Based on Local Procedures. J. Assoc. Comp. Mach. 1970, 17, 589–608. [Google Scholar] [CrossRef]
- Cleveland, R.B.; Cleveland, W.S.; McRae, J.E.; Terpenning, I. STL: A seasonal trend decomposition procedure based on loess. J. Off. Stat. 1990, 6, 3–73. [Google Scholar]
- Schwarz, G.E. Estimating the dimension of a model. Ann. Stat. 1978, 6, 461–464. [Google Scholar] [CrossRef]
- Box, J.E.; Decker, D.T. Greenland marine-terminating glacier area changes: 2000-2010. Ann. Glaciol. 2011, 52, 91–98. [Google Scholar] [CrossRef] [Green Version]
- Nick, F.M.; Vieli, A.; Howat, I.M.; Joughin, I. Large-scale changes in Greenland outlet glacier dynamic triggered at the terminus. Nat. Geosci. 2009, 2, 110–114. [Google Scholar] [CrossRef]
- Rosenau, R.; Scheinert, M.; Dietrich, R. A processing system to monitor Greenland outlet glacier velocity variations at decadal and seasonal time scales utilizing the Landsat imagery. Remote Sens. Environ. 2015, 169, 1–19. [Google Scholar] [CrossRef]
- Carr, J.R.; Vieli, A.; Stokes, C. Influence of sea ice decline, atmospheric warming, and glacier width on marine-terminating outlet glacier behavior in northwest Greenland at seasonal to interannual timescales. J. Geophys. Res. Earth Surf. 2013, 118, 1210–1226. [Google Scholar] [CrossRef] [Green Version]
- Walsh, K.M.; Howat, I.M.; Ahn, Y.; Enderlin, E.M. Changes in the marine-terminating glaciers of central east Greenland, 2000–2010. Cryosphere 2011, 6, 211–220. [Google Scholar] [CrossRef] [Green Version]
- Fried, M.J.; Catania, G.A.; Bartholomaus, T.C.; Duncan, D.; Davis, M.; Stearns, L.A. Distributed subglacial discharge drives significant submarine melt at a Greenland tidewater glacier. Geophys. Res. Lett. 2015, 42, 9328–9336. [Google Scholar] [CrossRef] [Green Version]
- Sulak, D.J.; Sutherland, D.A.; Enderlin, E.M.; Stearns, L.A.; Hamilton, G.S. Iceberg properties and distributions in three Greenlandic fjords using satellite imagery. Ann. Glaciol. 2017, 58, 1–15. [Google Scholar] [CrossRef] [Green Version]
- Holland, D.M.; Thomas, R. Acceleration of Jakobshavn Isbrae triggered by warm subsurface ocean waters. Nat. Lett. 2008, 1, 659–664. [Google Scholar] [CrossRef]
- Straneo, F.; Sutherland, D.A.; Holland, D.; Gladish, C.; Hamilton, G.S.; Johnson, H.L.; Rignot, E.; Xu, Y.; Koppes, M. Characteristics of ocean waters reaching Greenland’s glaciers. Ann. Glaciol. 2012, 53, 202–210. [Google Scholar] [CrossRef] [Green Version]
- Rignot, E.; Koppes, M.; Velicogna, I. Rapid submarine melting of the calving faces of West Greenland glaciers. Nat. Geogr. 2010, 3, 187–191. [Google Scholar] [CrossRef]
- Frey, K.; York, A. Marine-terminating outlet glacier terminus positions, Disko and Uummannaq Bay, West Greenland, 1985–2015. Arctic Data Center 2018. [Google Scholar] [CrossRef]
- Morlighem, M.; Williams, C.N.; Rignot, E.; An, L.; Arndt, J.E.; Bamber, J.L.; Catania, G.; Chauché, N.; Dowdeswell, J.A.; Dorschel, B.; et al. BedMachine v3: Complete bed topography and ocean bathymetry mapping of Greenland from multibeam echo sounding combined with mass conservation. Geophys. Res. Lett. 2017, 44, 11051–11061. [Google Scholar] [CrossRef] [Green Version]


| Setting Parameter | Description | Set Value |
|---|---|---|
| Data type | Cyclical for time series with a seasonal cycle, and non-cyclical for time series without seasonal cycle | Cyclical |
| Seasonality | The seasonality period for cyclical data | 365 days |
| First level shift threshold | The lowest absolute difference in data (and means of data) before and after an abrupt event | 2.675× std difference between Landsat observations |
| Duration | The lowest time period within which a change point persists | 2 years |
| Second level shift threshold and change magnitude | The lowest change magnitude for detection | 2.675× std annual amplitudes |
| Distance threshold | An internal fitting parameter computed by DBEST | Default (for all glaciers except a, f, h, and n with a set value of 200) |
| Alpha | statistical significance level used for testing significance of detected change points | 0.05 |
| Glacier | Total Cumulative Change 1985–2015 (m) | Total Cumulative Change 1985–1999 (m) | Total Cumulative Change 2000–2015 (m) | Fractional Change 2000–2015 | |
|---|---|---|---|---|---|
| a | Umiammakku Sermiat | 3107 | 99 | 3010 | 0.97 |
| b | Kangilliup Sermia | 1119 | 830 | 289 | 0.26 |
| c | Kangerlussuup Sermia | −57 | −25 | −32 | 0.56 |
| d | Kangerluarsuup Sermia | 845 | 33 | 812 | 0.96 |
| e | Perlerfiup Sermia | 2458 | 0 | 2458 | 1.00 |
| f | Sermeq Silarleq | 3970 | 720 | 3250 | 0.82 |
| g | Kangilleq | 197 | 212 | −15 | −0.08 |
| h | Sermilik | 97 | 139 | −42 | −0.43 |
| i | Sermeq Avannarleq | 1038 | 105 | 933 | 0.90 |
| j | Sermeq Kujalleq | −131 | −27 | −104 | 0.79 |
| Average Uummannaq Bay | 1264 ± 1437 | 208 ± 309 | 1056 ± 1339 | 0.84 ± 0.50 | |
| k | Sermeq Avannarleq | 50 | 74 | −24 | −0.49 |
| l | Sermeq Kujalleq | 775 | 593 | 184 | 0.24 |
| m | Kangilernata Sermia | 2376 | 309 | 2067 | 0.87 |
| n | Eqip Sermia | 2061 | 549 | 1512 | 0.73 |
| o | Sermeq Avannarleq | 1617 | 238 | 1379 | 0.85 |
| p | Alanngorliup Sermia | 363 | 1 | 362 | 1.00 |
| q | Saqqarliup Sermia | 727 | 166 | 561 | 0.77 |
| Average Disko Bay | 1139 ± 885 | 276 ± 226 | 863 ± 788 | 0.76 ± 0.52 | |
| Average Overall | 1213 ± 1172 | 236 ± 264 | 976 ± 1085 | 0.80 ± 0.48 | |
Publisher’s Note: MDPI stays neutral with regard to jurisdictional claims in published maps and institutional affiliations. |
© 2020 by the authors. Licensee MDPI, Basel, Switzerland. This article is an open access article distributed under the terms and conditions of the Creative Commons Attribution (CC BY) license (http://creativecommons.org/licenses/by/4.0/).
Share and Cite
York, A.V.; Frey, K.E.; Jamali, S.; Das, S.B. Change Points Detected in Decadal and Seasonal Trends of Outlet Glacier Terminus Positions across West Greenland. Remote Sens. 2020, 12, 3651. https://doi.org/10.3390/rs12213651
York AV, Frey KE, Jamali S, Das SB. Change Points Detected in Decadal and Seasonal Trends of Outlet Glacier Terminus Positions across West Greenland. Remote Sensing. 2020; 12(21):3651. https://doi.org/10.3390/rs12213651
Chicago/Turabian StyleYork, Ashley V., Karen E. Frey, Sadegh Jamali, and Sarah B. Das. 2020. "Change Points Detected in Decadal and Seasonal Trends of Outlet Glacier Terminus Positions across West Greenland" Remote Sensing 12, no. 21: 3651. https://doi.org/10.3390/rs12213651