Article

Does Ecological Water Replenishment Help Prevent a Large Wetland from Further Deterioration? Results from the Zhalong Nature Reserve, China

1
College of Geo-exploration Science and Technology, Jilin University, Changchun 130026, China
2
Northeast Institute of Geography and Agroecology, Chinese Academy of Sciences, Changchun 130102, China
3
School of Renewable Natural Resources, Louisiana State University Agricultural Center, Baton Rouge, LA 70803, USA
4
Zhalong National Nature Reserve of Heilongjiang Province, Qiqihar 161006, China
5
Jilin Provincial Key Laboratory of Changbai Mountain Meteorology & Climate Change, Changchun 130062, China
6
Institute of Meteorological Sciences of Jilin Province, Changchun 130062, China
*
Author to whom correspondence should be addressed.
Remote Sens. 2020, 12(20), 3449; https://doi.org/10.3390/rs12203449
Submission received: 3 September 2020 / Revised: 16 October 2020 / Accepted: 18 October 2020 / Published: 20 October 2020
(This article belongs to the Special Issue Remote Sensing of Wetlands)

Abstract

:
Ecological water replenishment (EWR) has been increasingly applied to the restoration and maintenance of wetland hydrological conditions across China since the beginning of the 21st century. However, little is known about whether EWR projects help protect and/or restore wetland ecohydrology. As one of the earliest and longest-running EWR projects in China, water has been released from the Nenjiang River into the Zhalong wetland since 2001. It is important to examine the ecohydrological effects of this EWR project. In this study, long time series remote sensing data were used to extract the water area, inundation frequency, and normalized difference vegetation index (NDVI) to explore how eco-hydrological conditions changed during the pre- (1984–2000) and post-EWR (2001–2018) periods in the Zhalong wetland. Results show that the inundation area decreased due to the reduced surface water inflow during the pre-EWR period. Similarly, monthly vegetation NDVI in the growing season generally exhibited a decreasing and an increasing trend during the pre- and post-EWR periods, respectively. In the post-EWR period, NDVI increased by 19%, 73%, 45%, 28%, 13% for the months of May through September, respectively. Due to EWR, vegetation growth in areas with low inundation frequency was better than in areas with high inundation frequency. We found that the EWR project, runoff, and precipitation contributed 25%, 11%, and 64% to changes in the NDVI, respectively, and 46%, 37%, and 17% to changes in inundation area, respectively. These results indicate that the EWR project has improved hydrological conditions in the Zhalong wetland. For further maximum benefits of EWR in the Zhalong wetlands, we suggest that implementing similar eco-hydrological projects in the future should focus on flood pulse management to increase the inundation area, improve hydrological connectivity, and create new habitats.

Graphical Abstract

1. Introduction

The hydrological regime is the key factor in wetland development, affecting vegetation and pedological dynamics [1,2,3,4]. Changes in hydrological conditions of a wetland ecosystem caused by climate change and human activities are likely to lead to habitat and ecosystem degradation [5]. Over the past century, land use change due to intensive agriculture and urban development has led to changes in wetland hydrological mechanisms [6,7]. Interactions between the inundation frequency and ecophysiological performance of vegetation may result in the diversification of plant traits and functional attributes along inundation gradients [8]. Unfortunately, water resource shortages and inundation regime changes lead to habitat change and vegetation degradation [9,10,11]. Simultaneously, the changes have caused a serious reduction in the frequency, extent, and duration of wetland inundation, resulting in considerable wetland loss and ecological function degradation [12]. It is necessary to restore a wetland’s hydrological regime to promote wetland vegetation health, functional services, and ecosystem integrity.
In the past decade, ecological water replenishment (EWR) has gained increasing attention from the wetland protection and restoration field. The goal of the concept is to help mitigate water shortages for natural wetland ecosystems and maintain the dynamic balance of wetland habitats. EWR is an important and well-recognized way to restore hydrological regimes, solving water shortage issues, and maintaining the stability and health of wetland ecosystems. For instance, large-scale flow diversion has increased flood frequency and volume, and stimulated greening of the riparian river in the Murray Darling Basin, Australia [13]. High flow replenishment played an important role in restoring the ecological integrity of wetlands in the Colorado River, United States [14,15]. In China, numerous EWR projects have been carried out—Hengshui Lake, Baiyangdian, Yellow River Delta, Nansihu Lake, and Wuliangsuhai Wetland—to recharge water resources and improve the ecological status and functions of wetlands [16,17,18]. The Zhalong wetland, recognized as an internationally important wetland, is the largest existing national nature reserve of rare birds and wetland ecological types famed for its cranes and other large waterfowl species. With climate change and the large-scale conversion of wetlands into agricultural cropland, the Zhalong wetland faced severe drought, water shortage and habitat loss for endangered waterbirds, including red-crowned cranes Grus japonensis [19,20]. In 2001, an EWR project was initiated to introduce water from the Nenjiang River into the Zhalong wetland with the aim being to restore the hydrological conditions in the area.
A major concern of EWR projects is to examine if and to what extent they could enhance ecohydrology conditions in wetlands, such as vegetation growth, inundation regime, and hydroperiod. However, there is a lack of long-term monitoring and effective evaluation for judging the ecological effectiveness of EWR projects. To address the problem, a few studies have been conducted to obtain the spatiotemporal distribution of wetland vegetation using remote sensing images. The normalized difference vegetation index (NDVI) has been frequently applied in characterizing changes in vegetation conditions of wetlands associated with EWR [21]. Based on NDVI, Wang et al. (2012) explored the relationship between the functional characteristics of wetland vegetation and the disturbance of water levels [22]; and Wan et al. (2018) described spatial patterns of major vegetation types and related the response of vegetation to changing hydrological conditions [23]. Shen et al. (2019) investigated the spatial degradation pattern of wetlands in the Zoige Plateau to discern how vegetation conditions respond to EWR in wetlands [24]. In addition, inundation frequency has been used to characterize the hydrological changes of wetlands to EWR. Wu et al. (2019) found that integrating LiDAR (Light Detection and Ranging) data and multi-temporal aerial imagery can accurately describe the current inundation state of wetlands [25]. Thomas et al. (2015) mapped inundation in the heterogeneous floodplain wetlands of the Macquarie Marshes and quantified the hydrological dynamics across the wetland [26]. To date, NDVI and inundation frequency have not been combined to analyze the changing characteristics of wetland ecohydrological conditions, especially the ecohydrological effects of EWR.
This study aims to investigate the long-term effect of the implementation of an ecological water replenishment project on ecohydrological conditions for a large wetland area. The overarching research question is whether an EWR project can help protect and/or restore wetland hydrology, and if so, to what extent. In 2001, using the Zhalong wetland in China as a case study, we investigated the vegetation and inundation frequency to evaluate the effects of EWR. The specific objectives of this study were to (1) determine the change trend of NDVI as influenced by inundation frequency during the pre- (1984–2000) and post– (2001–2018) implementation period of EWR; (2) to quantify the response of vegetation to inundation frequency; and (3) to analyze key factors affecting spatial and seasonal variation in wetland vegetation including inundation frequency, volume of EWR, precipitation and runoff. Findings from this study can be useful for assessing the effectiveness of ecohydrological projects for wetland protection and restoration, not only for the Zhalong wetland but also for other wetlands worldwide.

2. Materials and Methods

2.1. Study Area

The Zhalong wetland is located in the lower reaches of the Wuyuer River, Northeast China, extending between 46°52′N and 47°32′N, and 123°47E and 124°37′E (Figure 1). It has a total area of 2100 km2 and is the largest national nature reserve in Northeast China. The wetland is important for a number of wildlife species, especially several endangered cranes (e.g., red-crowned crane and Siberian white-naped crane Antigone vipio) and waterfowl species (e.g., herons) [27,28]. The wetland can be characterized by a temperate continental monsoon climate with an average annual temperature of 2–4 °C and an average annual precipitation of 426 mm [29]. Inflow from the upper Wuyuer River presents the main water source for the wetland area. In the lower reaches, the Wuyuer River loses its obvious channel and overflows to form a large area of permanent and seasonal freshwater marshes, which are mainly characterized by numerous small shallow lakes, vast reed marshes, and meadow steppe. Wetland reeds flourish and become a habitat for rare birds, such as red-crowned cranes. Reed marsh is the dominant vegetation type, covering 70% to 80% of the wetland.
After the flood in the Nenjiang River basin in 1998, the Wuyuer River suffered severe drought for three consecutive years [30]. The severe drought led to a continuous decline in the water level and water area in the Zhalong wetland. Most of the water area fragmented into smaller areas and bogs, or even dried out. Consequently, the area of reed decreased and fires were frequent, and the habitat suitable for cranes was largely lost.
To prevent the ecological environment from further deterioration in the Zhalong wetland, EWR began in 2001. Water was released from the Nenjiang River into Dong Sheng reservoir and was then allocate into the Zhalong wetland. By 2018, a total of 27.86 × 10⁸ m3 of water had been replenished to Zhalong Wetland, with an annual maximum of 3.43 × 10⁸ m3 and an annual average of 1.55 × 10⁸ m3.

2.2. Data Collection

In this study, a total of 420 scenes of global surface water (GSW) [31] from the European Commission’s Joint Research Centre (JRC) Monthly Water History v1.1 were downloaded from Google Earth Engine (GEE) (https://code.earthengine.google.com/) for the period 1984–2018 and analyzed before V.1.2 was released. GSW has a 30 m spatial resolution with a global coverage. When mapping GSW, a total of 40,124 control points were used globally for accuracy verification during GSW mapping, confirming that the classifier produced less than 1% of false water detections, and missed less than 5% of water. Inundation frequency products have also been produced. GSW has been used to estimate the volume of lakes and reservoirs [32,33] and to evaluate areas inundated by surface water [34]. This product corresponds to the frequency with which water is found in a specific location from year-to-year, and is derived from all the Landsat scenes between 1984 and 2019.
Landsat 5/7/8 data were collected for 1984–2018 to calculate monthly NDVI based GEE. Yearly precipitation data from two meteorological stations were download from China Meteorological Data Network (http://data.cma.cn/) for the 1984–2018 period. Yearly runoff data were obtained for the Long’anqiao gauge station for 1984–2018 and EWR water volume replenishment for the Zhalong wetland data were collected for 2001–2018 from the Zhalong National Nature Reserve in Heilongjiang Province to analyze the cause of dynamic changes of the water surface area in the Zhalong wetland.

2.3. Characterizing Inundation Frequency

A time series of monthly images for 1984–2018 were used to calculate the water appearance frequency (WAF), adapted from Borro et al. (2014), Wu et al. (2016), and Inman et al. (2020) to represent the average inundation state of seasonal wetlands. The index can be expressed as follows [35,36,37]
W A F j = i = 1 N I j N 100 %
where WAFj is the water presence frequency of jth pixels in a time period, N is the number of total time series of water surface area maps, i is the corresponding ith water map, Ij is the corresponding pixel value of the ith water map. This WAF ranges from 0 to 100%. A WAF value close to 100% indicates a high frequency water body with a greater regularity of appearance, whereas a WAF value near 0% indicates a low frequency water body with highly irregular appearance. To characterize the spatiotemporal appearance of the wetland, the inundation frequency during the pre- and post-EWR periods in the Zhalong wetland were calculated. We classified the inundation events into five categories (i.e., WAF): 0–10%, 10–20%, 20–30%, 30–50%, 50–100% to investigate the distribution of flood events. We then conducted a statistical test, which showed a significant difference (p < 0.01) among categories. The inundation frequency categories of 0–20%, 20–50%, and 50–100% were classified as low inundation, medium inundation, and high inundation areas, respectively.
To analyze the change of inundation frequency during the pre- and post-EWR period in the Zhalong wetland, we determined the inundation frequency of five categories (0–10%, 10–20%, and 20–30%, 30–50%, and 50–100%) with corresponding values of 1, 2, 3, 4, and 5. The inundation frequency in the post-EWR period minus the inundation frequency in the pre-EWR period was then calculated. The lowest possible value was that the inundation frequency in zone 5 changed to a zone with no inundation (0), with a corresponding conversion value of 0−5 =−5. The maximum possible value would be obtained when a zone with no inundation changed to a region of inundation frequency 5, with the corresponding conversion value of 5−0 = 5. In this way, the difference value is –5, 5, where –5 to –1 indicates that the inundation frequency decreased and values from 1–5 indicate that the inundation frequency increased. We reclassified values from −5 to −1 and 1–5 in to three categories, respectively, the corresponding A, B, C, and D, E, F. The corresponding values of A, B, C, are from (−5–4), (−3–2), and −1, respectively. The corresponding values of D, E, F, are 1, (2–3), (4–5), respectively. A, B and C indicate different degrees of inundation frequency, namely, high, medium and low. The categories D, E and F indicate different degrees from low inundation frequency transfer to high inundation frequency, which are low, medium, and high.

2.4. Trend Analysis of NDVI and Climatic Factors

The least squares method [38,39] was applied at the pixel scale over the period 1984–2018. The NDVI of each month from May to September was used to calculate the change trend from 1984 to 2018. A Student’s T test was operated to examine the significance of NDVI change trend. The results were classified into five classes [38] (Table 1). The NDVI trend patterns demonstrated spatial heterogeneity from 1984 to 2018 in the Zhalong wetland.

Relative Abundance

We used relative abundance (RA) [2] to quantitatively analyze the vegetation growth response to inundation frequency. The RA is given by
R A = V E G i W A F j 100 %
where RA is the relative proportion of vegetation growth at different inundation frequencies, VEGi is the area of ith vegetation growth classes, WAFj is the area of jth inundation frequency. VEG is represented by the mean of NDVI for each month from 2001 to 2018, minus those from 1984 to 2000 during the growing season (May–September). Based on the Otsu algorithm [40], we divided the VEG into five classes, namely, <–0.05, –0.05–0, 0–0.05, 0.05–0.1, and >0.1, with the corresponding levels of level V (very poor), level IV (poor), level III (fair), level II (good), and level I (excellent) [41].

3. Result

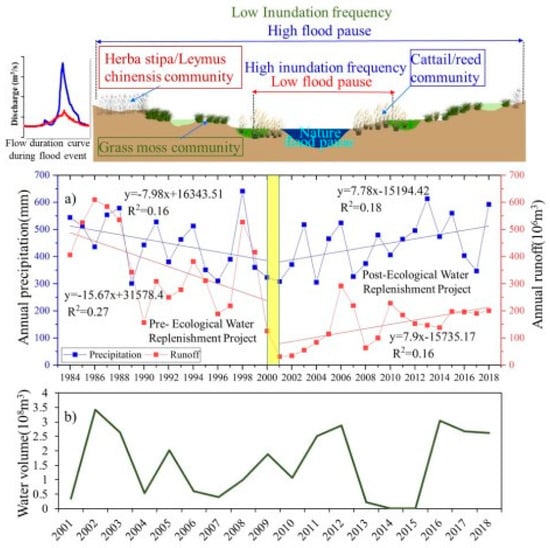
3.1. Inundation Regime Changes

3.1.1. Characteristics of Water Surface Area Dynamics

The water surface area of the Zhalong wetland was lower during the post-EWR period (2001–2018) than that during the pre-EWR period (1984–2000). However, the change trend of the water surface area during the two periods differed, as there was a downward trend during the former period and an upward trend afterwards (Figure 2). The water area varied from 446 to 744 km2 and from 290 to 602 km2 during the early and late periods, respectively.

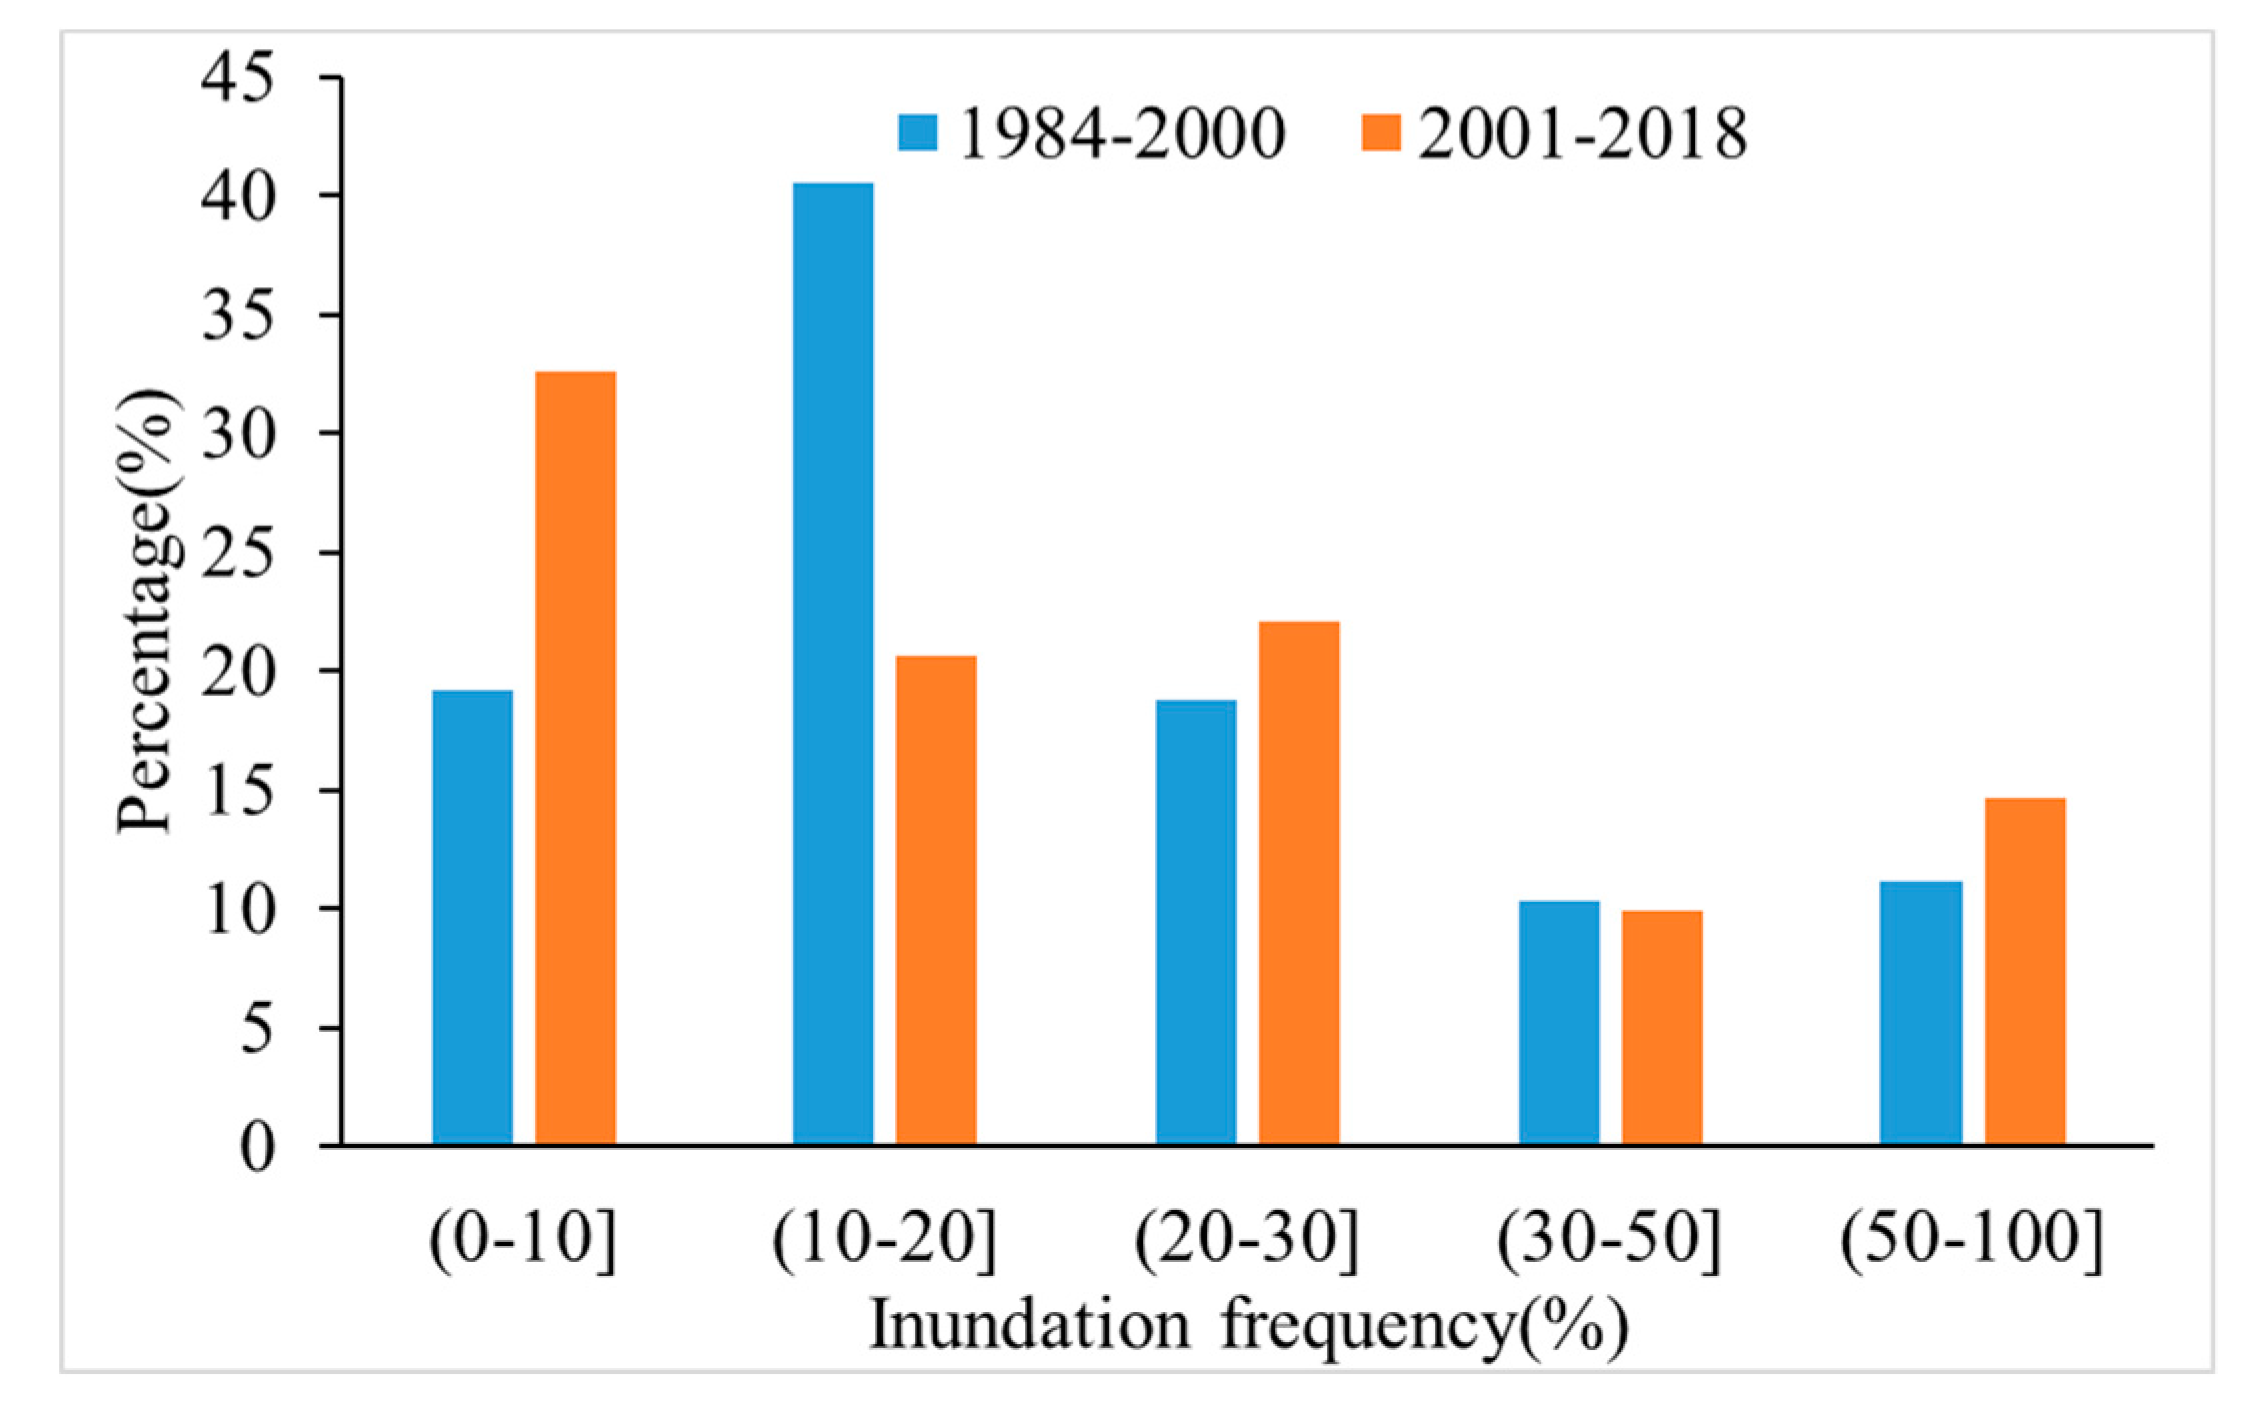
3.1.2. Changes of Inundation Frequency

Most water bodies of the Zhalong wetland were located in the central and southern area. During the pre-EWR period, most inundations occurred in the 10–20% WAF category. During the post-EWR period, most inundations occurred in the 0–10% WAF category (Figure 3 and Figure 4). The high inundation frequency area was large lakes and ponds. It can be seen from Figure 3 that the variation of inundation frequency differed among regions: Lakes and ponds presented no change, while the inundation frequency in the central area of the wetland changed a lot.
During the pre-EWR period, areas with inundation frequency in the 10–20% and 20–30% classes accounted for 41% and 19% of the total inundation area, respectively. During the post-EWR period, areas with an inundation frequency of 0–10% and 10–30% accounted for 33% and 22% of the total inundation area, respectively (Figure 4). By transfer matrix analysis (Table 2), the areas with inundation frequency in the 0–10% class during the post-EWR had mostly changed from an inundation frequency of 10–20% to 20–30% in the pre-EWR period. However, the inundation frequency area with medium inundation frequency (30–50%) showed little change. The area of high inundation frequency (50–100%) increased by 4%. These results indicated that the EWR had no significant improvement effect on the low-inundated frequency area, but did maintain and restore the water area with higher inundation frequencies in the Zhalong wetland.

3.2. Changes of Vegetation Pre- and Post-Ecological Water Replenishment

According to the least squares method, the variation trend of NDVI in each month of the growing season in the Zhalong wetland during the pre-and post-ecological water replenishment were analyzed (Figure 5). The NDVI of the Zhalong wetland in May, June, and July showed a significant decreasing trend in the pre-EWR (Figure 5, left panel). The proportion of pixels with a decreasing trend was higher than that with an increasing trend. Here, “proportion" is the relative abundance of pixels with increasing or decreasing trends. There was no clear trend either way in August and September. On the contrary, in the post-EWR period, the NDVI in each month mainly showed an increasing trend. Specifically, during the pre-EWR period, the most obvious decreasing trend was in May, and the proportion of pixels with a significant decrease was the largest, at 26%. The proportion of significant increases in each month was less than that of significant decreases, and the smallest proportion of pixels showing an increase was in May, with a value of 2%. During the post-EWR period, the proportion of pixels that showed a significant increase in each month was relatively large, and the highest proportion was found in June (73%). However, the proportion that showed a significant decrease was relatively low in each month. The NDVI results indicate that EWR played an important role in vegetation restoration in most areas of the Zhalong wetland during the growing season.
The implementation of EWR since 2001 for the Zhalong wetland has increased vegetation growth. The NDVI of the Zhalong wetland in the post-EWR was significantly greater (p < 0.01) than during the pre-EWR period in May, June and September. The area of the NDVI difference >0.1 between the two periods accounted for most of the study area. As can be clearly seen from Figure 6 and Figure 8, the area of inundation frequency transformed from high to low overall exhibited a better vegetation condition, which accounts for more than 60% of the area with inundation frequency transformed from high to low. In contrast, areas where the inundation frequency transformed from low to high exhibited a poorer vegetation condition.

3.3. Relative Contribution of Hydrological Factors to Changes in Vegetation NDVI and Water Area

Runoff into the Zhalong wetland through Long’anqiao has decreased significantly since the early 1980s (Figure 7a). Specifically, the annual runoff reduced to less than 6 × 10⁸ m3 in the 1980s, rapidly decreased to less than 5 × 10⁸ m3 at the beginning of 1990s and decreased further to less than 3 × 10⁸ m3 over recent years. The corresponding trend of precipitation in the Zhalong wetland basically remained unchanged.
A multiple regression model was used to determine the contribution of water volume of EWR, runoff, and precipitation to the variability in vegetation NDVI and water area [42,43]. The multiple regression models were as follows:
Y1 = 0.025X1 + 0.011X2 + 0.06X3, R2 = 0.52, and F = 0.04
Y2 = 0.29X1 + 0.23X2 + 0.11X3, R2 = 0.48, and F = 0.04
In these two models, Y1 is the maximum NDVI value from 2001 to 2018, and X1, X2, and X3 are the annual volume of EWR, annual runoff and annual precipitation from 2001 to 2018, respectively. Y2 represented the annual water area from 2001 to 2018. Then, the individual contributions of these three factors to vegetation NDVI and water area change were quantified by calculating the ratio of the absolute value of the coefficient value of each factor to its sum. Based on the analysis, the volume of EWR, runoff and precipitation contributed 25%, 11%, and 64% to vegetation NDVI change and 46%, 37%, 17% to water area change, respectively.

4. Discussion

4.1. Eco-Hydrological Response of Wetlands to Ecological Water Replenishment

We found that the water area of the Zhalong wetland increased during the post-EWR period, and EWR could maintain the area with a high inundation frequency. However, EWR did not improve areas with low inundation frequency. This result may be due to changes in the water source of the Zhalong wetland. Upstream runoff accounted for 60% of water resources, and this plays an important role in maintaining the ecosystem health of the Zhalong wetland [30]. The main reason for the significant decrease in runoff is that a large area of reed marsh wetland was developed into agriculture in the lower reaches of the Wuyuer River [44]. The water intake from the Wuyuer River used for agricultural irrigation directly induced runoff into the Zhalong wetland, leading to long-term water shortages and drought, and eventually to a rapid degradation of wetland functions [45]. These results indicate that the drought and water shortage of the Zhalong wetland was mainly caused by the sharp decline of upstream inflow of water. Although the runoff and precipitation showed an increasing trend during the post-EWR period, their relative contribution to the water area accounted for 37% and 17%, respectively; this was significantly lower than the contribution from EWR (47%). This finding demonstrates that EWR has been the key factor for the increase in water area in the Zhalong wetland over the past two decades. EWR for the Zhalong wetland preserved a high stability of the high-inundation frequency areas and relieved the intensity of dry periods in low-inundation areas to some extent. Therefore, EWR efficiently curbed degradation of the Zhalong wetland by providing the most basic ecological water requirement. However, the current replenishment plan is far from sufficient to further improve eco-hydrological conditions in the Zhalong wetland.

4.2. Vegetation Response to Inundation Frequency Variation

We found that vegetation dynamics in the Zhalong wetland exhibited great spatiotemporal heterogeneity in both the pre- and post-EWR periods. In addition, most of the areas with excellent and good vegetation growth were located in areas with lower inundation frequency (Figure 8). Simultaneously, a small number of areas were located in places with inundation frequencies that were transformed from low to high (low degree of transfer) inundation frequency. It was generally recognized that the role of the inundation regime—its extent, frequency and duration—is critical to the pattern of vegetation processes [26]. The tolerance and sensitivity of vegetation growth to inundation frequency differed. Other studies also showed roughly similar results, that is, that changes of the inundation regime, and differences in inundation regulate vegetation and extend into low inundation frequency areas [46,47]. As the main vegetation type of Zhalong wetland, reed is mainly distributed in the area with relatively low inundation frequency, and the most suitable inundation frequency for this habitat is 5–25% [48]. Vegetation dynamics in the Zhalong wetland were partially driven by changes in inundation frequency associated with EWR. Mauchamp et al. believed that the increased biomass of reed plants under partial flooding was a response to moderate environmental stress [49]. Engloner et al. also found that the plant height of reeds in a wet environment was significantly higher than in a dry environment [50]. The rise of the water level and the increased distribution of flooded areas caused by water replenishment significantly promoted the growth of reeds in the Zhalong wetland, similar to previous research results [30]. Dynamic variation of inundation frequency significantly enhanced biomass accumulation and growth, whereas persistent inundation largely decreased biomass production and growth [49]. These findings correspond with the process of eco-hydrological restoration in Zhalong wetland because manmade hydrological regimes are important factors affecting flora. Based on this, we conclude that there were two reasons for the improvement of NDVI in the Zhalong wetland: (i) Vegetation further expanded to the area with low inundation frequency; and (ii) alleviating drought conditions through EWR and increasing alternation of drying and wetting promoted vegetation growth.

4.3. Strategies for Scientific Ecological Water Replenishment

Surface water sources in the Zhalong wetland mainly come from the inflow of the upper Wuyuer River, the EWR project, and direct atmospheric water input to the wetland area. However, we found that there was no significant change in the amount of yearly precipitation, and an obvious decreasing trend of upstream inflow. An effective solution to further improve the current eco-hydrological condition of the Zhalong wetland is to make a scientific and reasonable decision on EWR. Although the current EWR successfully improved and alleviated the severe ecosystem degradation, based on the above results in the Zhalong wetland, several problems still occur and some have worsened. In the post-EWR period, the inundation frequency of a large area transformed from medium to low. This means that managers should focus on the actual alteration of flood pulse patterns, which are responsible for sustaining floodplain wetlands, as water only reaches floodplain wetlands when the flow levels increase above the embankment or embankment breaching happens (Figure 9).
The Zhalong wetland provides an ideal habitat and breeding ground for many birds and rare waterfowl, and it is also a posting station for transnational migratory birds such as red-crowned cranes. However, the number of red-crowned cranes and other waterbirds in the Zhalong wetland is declining due to frequent droughts. Wetland loss in the area is the major factor affecting habitat change for endangered species [19]. To protect the cranes, management should focus on improving the hydrological regime in different periods to maintain suitable habitats for waterbirds. This can be achieved by increasing the inundation frequency and water levels during the breeding period. In a study on habitat requirements for red-crowned cranes in the breeding period, Na et al. [29] highlighted several key requirements including potential nest sites (emergent marsh), habitat composition (the area percentage of emergent marsh in species home range), water depth, vegetation cover, and distance to human disturbance. Future studies are needed to elucidate how optimum habitats at the landscape scale can be created through an ecological water replenishment project.

5. Conclusions

This study assessed the long-term effectiveness of the implementation of an eco-hydrological project on wetland conditions in the 2100 km2 Zhalong Nature Reserve, China. The project, locally known as an ecological water replenishment (EWR) project, has being implemented since 2001 by introducing water from a river into the large wetland area. Here, we analyzed changes in water surface area, inundation frequency, and NDVI of the wetland to examine whether the EWR project could help protect and/or restore wetland hydrology, and if so, to what extent. We found that during the pre-EWR period from 1984 to 2000, a significant decrease in surface water inflow caused the inundation area in the Zhalong wetland to shrink, and this was accompanied with continuous degradation of wetland vegetation growth. In the post-EWP period from 2001 to 2018, the inundation area showed an increasing trend and vegetation NDVI in the Zhalong wetland increased by 19%, 73%, 66%, 28%, and 13% for the months May through October, respectively. The increase was significant during the summer months (i.e., from June to August), which is especially important for creating breeding habitats for endangered red-crowned cranes in East Asia. The EWR project seemed to have no significant improvement on areas with lower inundation frequency (<50%), but had a strong effect on areas with higher inundation frequency (>50%). We found that the EWR project, runoff, and precipitation contributed 25%, 11%, and 64% to the observed NDVI change and 46%, 37%, and 17% to the observed inundation area change, respectively. Based on these findings, we conclude that the EWR project has improved hydrological conditions in the Zhalong wetland, and that using inundation frequency combined with NDVI is a useful approach to evaluate the effectiveness of an eco-hydrological project for restoring wetland hydrology. Therefore, we suggest that implementing similar eco-hydrological projects in the future should focus on flood pulse management to increase the inundation area, improve hydrological connectivity, and create habitats for wetland species, in order to achieve the ecological benefits of water replenishment.

Author Contributions

L.C. and G.Z. conceived the idea of the study; L.C. carried out data analysis and wrote the first manuscript draft; G.Z. supervised the research project and contributed to oversight of the data collection; Y.J.X. and Y.W. contributed critical conceptual review and manuscript revisions at all stages; All authors have read and agreed to the published version of the manuscript.

Funding

This research was supported by the National Key R&D Program of China (Grant: 2017YFC0406003) and National Natural Science Foundation of China (Grant: 41877160) and Key Research and Development Program of Jilin (No. 20200403002SF). During the preparation of the manuscript, Y.J.X. received funding support from a US Department of Agriculture Hatch Fund project (project number: LAB94230). The statements, findings, and conclusions are those of the authors and do not necessarily reflect the views of the funding agencies.

Acknowledgments

We acknowledge obtaining data from Google Earth Engine and China Meteorological Data Network. We would like to express our gratitude to both the editors and reviewers for their efforts and suggestions.

Conflicts of Interest

The authors declare no conflict of interest.

References

  1. Mitsch, W.J.; Gosselink, J.G. Wetlands, 4th ed.; John Wiley & Sons, Inc.: New York, NY, USA, 2007. [Google Scholar]
  2. Todd, M.J.; Muneepeerakul, R.; Pumo, D.; Azaele, S.; Miralles-Wilhelm, F.; Rinaldo, A.; Rodriguez-Iturbea, I. Hydrological drivers of wetland vegetation community distribution within Everglades National Park, Florida. Adv. Water Resour. 2010, 33, 1279–1289. [Google Scholar] [CrossRef]
  3. Lang, M.W.; Kim, V.; McCarty, G.W.; Li, X.; Yeo, I.-Y.; Huang, C.; Du, L. Improved Detection of Inundation below the Forest Canopy using Normalized LiDAR Intensity Data. Remote Sens. 2020, 12, 707. [Google Scholar] [CrossRef] [Green Version]
  4. Torbick, N.; Persson, A.; Olefeldt, D.; Frolking, S.; Salas, W.; Hagen, S.; Crill, P.; Li, C. High Resolution Mapping of Peatland Hydroperiod at a High-Latitude Swedish Mire. Remote Sens. 2012, 4, 1974–1994. [Google Scholar] [CrossRef] [Green Version]
  5. Barzen, J.; Engels, M.; Burnham, J.; Harris, J.; Wu, G. Potential Impacts of Poyang Lake Projects on the Quantity and Distribution of Wintering Waterbirds; International Crane Foundation: Baraboo, WI, USA, 2009. [Google Scholar]
  6. Euliss, N.H.; Mushet, D.M. Water-level fluctuation in wetlands as a function of landscape condition in the prairie pothole region. Wetlands 1996, 16, 587–593. [Google Scholar] [CrossRef]
  7. Van der Kamp, G.; Stolte, W.J.; Clark, R.G. Drying out of small prairie wetlands after conversion of their catchments from cultivation to permanent brome grass. Hydrol. Sci. J. 1999, 44, 387–397. [Google Scholar] [CrossRef]
  8. Boutin, C.; Keddy, P.A. A functional classification of wetland plants. J. Veg. Sci. 1993, 4, 591–600. [Google Scholar] [CrossRef]
  9. Kingsford, R.T. Ecological impacts of dams, water diversions and river management on floodplain wetlands in Australia. Austral. Ecol. 2000, 25, 109–127. [Google Scholar] [CrossRef]
  10. Foti, R.; Del Jesus, M.; Rinaldo, A.; Rodriguez-Iturbe, I. Hydroperiod regime controls the organization of plant species in wetlands. Proc. Natl. Acad. Sci. USA 2012, 109, 19596–19600. [Google Scholar] [CrossRef] [Green Version]
  11. Muster, S.; Heim, B.; Abnizova, A.; Boike, J. Water body distributions across scales: A remote sensing based comparison of three arctic tundra wetlands. Remote Sens. 2013, 5, 1498–1523. [Google Scholar] [CrossRef] [Green Version]
  12. Mcginness, H.M.; Arthur, A.D.; Davies, M. Flood regimes driving vegetation and bird community transitions in semiarid floodplain woodlands. Ecohydrology 2018, 11, e1954. [Google Scholar] [CrossRef]
  13. Nagler, P.L.; Doody, T.M.; Glenn, E.P.; Jarchow, C.J.; Barreto-Muñoz, A.; Didan, K. Wide-area estimates of evapotranspiration by red gum (Eucalyptus camaldulensis) and associated vegetation in the Murray-Darling River Basin, Australia. Hydrol. Process. 2016, 30, 1376–1387. [Google Scholar] [CrossRef]
  14. Kendy, E.; Flessa, K.W.; Schlatter, K.J.; de la Parra, C.A.; Hinojosa Huerta, O.M.; Carrillo-Guerrero, Y.K.; Guillen, E. Leveraging environmental flows to reform water management policy: Lessons learned from the 2014 Colorado River Delta pulse flow. Ecol Eng. 2017, 106, 683–694. [Google Scholar] [CrossRef]
  15. Shafroth, P.B.; Schlatter, K.J.; Gomez-Sapiens, M.; Lundgren, E.; Grabau, M.R.; Ramírez-Hernández, J.; Rodriguez-Burgeueno, J.E.; Flessa, K.W. A large-scale environmental flow experiment for riparian restoration in the Colorado River Delta. Ecol. Eng. 2017, 106, 645–660. [Google Scholar] [CrossRef]
  16. Liu, Y.; Cheng, W.Q.; Yin, J.M.; Wang, X.Y. Ecological water level and supplementing water plan in Baiyangdian wetland. J. Agric. Univ. Hebei 2010, 33, 107–109, 118. (In Chinese) [Google Scholar]
  17. Liu, B.; Peng, X.K.; Shu, L.C.; Peng, B.; Wang, R.L. An Analysis of Effect of Three Water Ecological Diversions on Groundwater of Qingshuigou Wetlands in the Yellow River Delta. Wetl. Sci. 2015, 13, 393–399. (In Chinese) [Google Scholar]
  18. Guo, Z.L.; Zhang, Y.G.; Liu, L. Discussion about the Strategy of Ecological Water Supplement to Hengshui Lake Wetland of Hebei. Wetl. Sci. Manag. 2019, 15, 27–30. (In Chinese) [Google Scholar]
  19. Han, M.; Sun, Y.N.; Xu, S.G. Characteristics and driving factors of marsh changes in Zhalong wetland of China. Environ. Monit. Assess. 2007, 127, 363–381. [Google Scholar] [CrossRef] [PubMed]
  20. Li, Z.Q.; Wang, Z.; Ge, C. Time Budgets of Wintering Red-Crowned Cranes: Effects of Habitat, Age and Family Size. Wetlands 2013, 33, 227–232. [Google Scholar] [CrossRef]
  21. Wu, C.; Chen, W. Indicator system construction and health assessment of wetland ecosystem-Taking Hongze Lake Wetland, China as an example. Ecol. Indic. 2020, 112, 106164. [Google Scholar] [CrossRef]
  22. Wang, L.; Dronova, I.; Gong, P.; Yang, W.B.; Li, Y.R.; Liu, Q. A new time series vegetation-water index of phenological-hydrological trait across species and functional types for Poyang Lake wetland ecosystem. Remote Sens. Environ. 2012, 125, 49–63. [Google Scholar] [CrossRef]
  23. Wan, R.; Dai, X.; Shankman, D. Vegetation Response to Hydrological Changes in Poyang Lake, China. Wetlands 2019, 39, 99–112. [Google Scholar] [CrossRef]
  24. Shen, G.; Yang, X.; Jin, Y.; Xu, B.; Zhou, Q. Remote sensing and evaluation of the wetland ecological degradation process of the Zoige Plateau Wetland in China. Ecol. Indic. 2019, 104, 48–58. [Google Scholar] [CrossRef]
  25. Wu, Q.S.; Lane, C.R.; Li, X.C.; Zhao, K.G.; Zhou, Y.Y.; Clinton, N.; DeVries, B.; Golden, H.E.; Lang, M.W. Integrating LiDAR data and multi-temporal aerial imagery to map wetland inundation dynamics using Google Earth Engine. Remote Sens. Environ. 2019, 228, 1–13. [Google Scholar] [CrossRef] [Green Version]
  26. Thomas, R.F.; Kingsford, R.T.; Lu, Y.; Cox, S.J.; Sims, N.C.; Hunter, S.J. Mapping inundation in the heterogeneous floodplain wetlands of the Macquarie Marshes, using Landsat Thematic Mapper. J. Hydrol. 2015, 524, 194–213. [Google Scholar] [CrossRef]
  27. Feng, X.Q.; Zhang, G.X.; Jun Xu, Y. Simulation of hydrological processes in the Zhalong wetland within a river basin, Northeast China, Hydrol. Earth Syst. Sci. 2013, 17, 2797–2807. [Google Scholar] [CrossRef] [Green Version]
  28. Mao, D.; Wang, Z.; Du, B.; Li, L.; Tian, Y.; Jia, M.; Zeng, Y.; Song, K.; Jiang, M.; Wang, Y. National wetland mapping in China: A new product resulting from object-based and hierarchical classification of Landsat 8 OLI images. Isprs J. Photogramm. 2020, 164, 11–25. [Google Scholar] [CrossRef]
  29. Na, X.; Zang, S.; Wu, C.; Tian, Y.; Li, W. Hydrological Regime Monitoring and Mapping of the Zhalong Wetland through Integrating Time Series Radarsat-2 and Landsat Imagery. Remote Sens. 2018, 10, 702. [Google Scholar] [CrossRef] [Green Version]
  30. Luo, J.M.; Wang, Y.J.; Liu, F.G.; Bo, L.; Wang, Z.L. Influence of the runoff variation in Wuyuer River catchment from 1951 to 2015 on the succession of the Zhalong saline marsh. J. Water Resour. Water Eng. 2018, 29, 1–6. (In Chinese) [Google Scholar]
  31. Pekel, J.; Cottam, A.; Gorelick, N.; Belward, A. High-resolution mapping of global surface water and its long-term changes. Nature 2016, 540, 418–422. [Google Scholar] [CrossRef]
  32. Busker, T.; de Roo, A.; Gelati, E.; Schwatke, C.; Adamovic, M.; Bisselink, B.; Pekel, J.; Cottam, A. A global lake and reservoir volume analysis using a surface water dataset and satellite altimetry. Hydrol. Earth Syst. Sic. 2019, 23, 669–690. [Google Scholar] [CrossRef] [Green Version]
  33. Bhagwat, T.; Klein, I.; Huth, J.; Leinenkugel, P. Volumetric Analysis of Reservoirs in Drought-Prone Areas Using Remote Sensing Products. Remote Sens. 2019, 11, 1974. [Google Scholar] [CrossRef] [Green Version]
  34. Fuentes, I.; Padarian, J.; van Ogtrop, F.; Vervoort, R.W. Comparison of surface water volume estimation methodologies that couple surface reflectance data and digital terrain models. Water 2019, 11, 780. [Google Scholar] [CrossRef] [Green Version]
  35. Borro, M.; Morandeira, N.; Salvia, M.; Minotti, P.; Perna, P.; Kandus, P. Mapping shallow lakes in a large South American floodplain: A frequency approach on multi temporal Landsat TM/ETM data. J. Hydrol. 2014, 512, 39–52. [Google Scholar] [CrossRef]
  36. Wu, G.; Liu, Y. Mapping Dynamics of inundation patterns of two largest river-connected lakes in China: A comparative study. Remote Sens. 2016, 8, 560. [Google Scholar] [CrossRef] [Green Version]
  37. Inman, V.L.; Lyons, M.B. Automated Inundation Mapping Over Large Areas Using Landsat Data and Google Earth Engine. Remote Sens. 2020, 12, 1348. [Google Scholar] [CrossRef] [Green Version]
  38. Jiang, L.; Bao, A.; Guo, H.; Ndayisaba, F. Vegetation dynamics and responses to climate change and human activities in Central Asia. Sci. Total Environ. 2017, 599, 967–980. [Google Scholar] [CrossRef] [PubMed]
  39. Chu, H.H.; Venevsky, S.; Wu, C.; Wang, M.H. NDVI-based vegetation dynamics and its response to climate changes at Amur-Heilongjiang River Basin from 1982 to 2015. Sci. Total Environ. 2019, 650, 2051–2062. [Google Scholar] [CrossRef]
  40. Otsu, N. A Threshold Selection Method from Gray-Level Histograms. IEEE Trans. Syst. Man Cybern. 1979, 9, 62–66. [Google Scholar] [CrossRef] [Green Version]
  41. Yang, W.; You, Q.; Fang, N.; Xu, L.; Zhou, Y.; Wu, N.; Ni, C.; Liu, Y.; Liu, G.; Yang, T.; et al. Assessment of wetland health status of Poyang Lake using vegetation-based indices of biotic integrity. Ecol. Indic. 2018, 90, 79–89. [Google Scholar] [CrossRef]
  42. Wu, Y.F.; Zhang, G.X.; Shen, H.; Xu, Y.J.; Batur, B. Attribute analysis of aridity variability in north Xinjiang, China. Adv. Meteorol. 2016, 2016, 1–11. [Google Scholar] [CrossRef] [Green Version]
  43. Mao, D.H.; He, X.Y.; Wang, Z.M.; Tian, Y.L.; Xiang, H.X.; Yu, H.; Man, W.; Jia, M.M.; Ren, C.Y.; Zheng, H.F. Diverse policies leading to contrasting impacts on land cover and ecosystem services in Northeast China. J. Clean Prod. 2019, 240, 117961. [Google Scholar] [CrossRef]
  44. Xu, C.C.; Chen, Y.N.; Yang, Y.H.; Hao, Y.M. Hydrology and water resources variation and its response to regional climate change in Xinjiang. J. Geogr. Sci. 2010, 20, 599–612. [Google Scholar] [CrossRef]
  45. Feng, X.Q.; Zhang, G.X.; Xu, Y.J. Hydrological Responses to Climate Change in Nenjiang River Basin, Northeastern China. Water Res. Manag. 2011, 25, 677–689. [Google Scholar] [CrossRef]
  46. Auble, G.T.; Friedman, J.M.; Scot, M.L. Relating riparian vegetation to presentand future streamflows. Ecol. Appl. 1994, 4, 544–554. [Google Scholar] [CrossRef]
  47. De Jager, N.R.; Thomsen, M.; Yin, Y. Threshold effects of flood duration on thevegetation and soils of the Upper Mississippi River floodplain, USA. For. Ecol. Manag. 2012, 270, 135–146. [Google Scholar] [CrossRef]
  48. Wang, R.N.; Peng, W.Q.; Liu, X.B. Wu, W.Q.; Han, Z.; Jiang, C.L. Analysis of responses of typical vegetation in Nanji Wetland National Nature Reserve of Poyang Lake to water depth and submergence frequency. J. China Inst. Water Resour. Hydropower Res. 2018, 6, 528–535. (In Chinese) [Google Scholar]
  49. Mauchamp, A.; Blanch, S.; Grillas, P. Effects of submergence on the growth of Phragmites australis seedlings. Aquat. Bot. 2001, 69, 147–164. [Google Scholar] [CrossRef]
  50. Engloner, A.I. Annual Growth Dynamics and Morphological Differences of Reed (Phragmites australis [Cov.] Trin. ex Steudel) in Relation to Water Supply. Flora 2004, 199, 256–262. [Google Scholar] [CrossRef]
Figure 1. Geographical location of the Zhalong wetland in northeast China and ecological water replenishment project.
Remotesensing 12 03449 g001
Figure 2. Time series (1984–2018) of annual water surface area. The red and green boxplots illustrate the median and inter-quartile range and the whiskers indicate minimum and maximum values.
Remotesensing 12 03449 g002
Figure 3. Spatial distribution of variation of inundation frequency during the (a) pre- and (b) post-ecological water replenishment (EWR) periods.
Remotesensing 12 03449 g003
Figure 4. Percentage of the five categories of inundation frequency in the pre- and post-ecological water replenishment.
Remotesensing 12 03449 g004
Figure 5. Spatial distribution of averaged NDVI in the growing season pre- (left panel) and post- (right panel) ecological water replenishment period.
Remotesensing 12 03449 g005aRemotesensing 12 03449 g005b
Figure 6. Spatial distribution of vegetation growth from May to September (ae). (f) The inundation frequency transformation from the pre- to post-ecological water replenishment period.
Remotesensing 12 03449 g006
Figure 7. Time series of annual (a) runoff, precipitation, and (b) replenishment volume in the Zhalong wetland.
Remotesensing 12 03449 g007
Figure 8. Relative abundance of vegetation growth, namely, the percentage of NDVI difference at different levels in different inundation frequency transfer regions.
Remotesensing 12 03449 g008
Figure 9. Conceptual representation of high and low inundation frequency areas of wetlands under high and low flood pulse conditions.
Remotesensing 12 03449 g009
Table 1. Division of the degrees of variation of the normalized difference vegetation index (NDVI) change trend.
SNDVINDVI Trend DescriptionT-Test
≥0.001Significant improvementp < 0.01
0.0001–0.001Slight improvementp < 0.05
−0.0001–0.0001Stable or non-vegetated
−0.001−0.0001Slight degradationp < 0.05
−0.001 ≤Significant degradationp < 0.01
Table 2. Area transfer matrix of inundation frequency (%). Vertically, the table is a classification of inundation frequency during the pre-ecological water replenishment period; horizontally, the table shows the classification of inundation frequency during the post-ecological water replenishment period.
Post-EWRNon-Water0–1010–2020–3030–5050–100Total (km2)
Pre-EWR
Non-water1560.0825.3419.088.364.880.891618.62
0–103.1528.6330.179.163.691.9576.75
10–2015.2952.1335.7245.2810.042.20160.66
20–3012.0053.0820.2650.2013.943.42152.91
30–504.1720.888.5511.3410.927.1162.98
50–1000.392.682.763.497.4075.5192.22
Total (km2)1595.09182.75116.54127.8250.8791.082164.15
Publisher’s Note: MDPI stays neutral with regard to jurisdictional claims in published maps and institutional affiliations.

