Next Issue
Volume 12, November-1
Previous Issue
Volume 12, October-1
 
 
remotesensing-logo

Journal Browser

Journal Browser

Remote Sens., Volume 12, Issue 20 (October-2 2020) – 196 articles

Cover Story (view full-size image): 
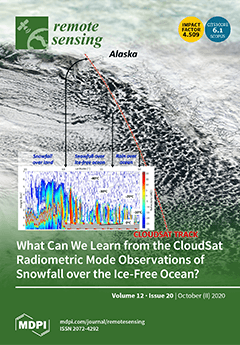
The CloudSat 94 GHz radar provides the most complete snowfall climatology over polar regions, but accurate quantitative snowfall estimates derived from radar reflectivity (front cover) remain challenging. This work explores the value of the CloudSat 94 GHz Brightness Temperature, a novel product developed from the processing of the radar noise floor level, combined with path-integrated attenuation, a standard product derived from the reduction in the radar surface return. Results demonstrate that over ice-free ocean, where surface emissivity and backscattering are well predictable, the synergistic use of these two observables provides crucial information on the presence/amount of supercooled layers and on snow density, with potential for better constraining snowfall retrieval. View this paper
  • Issues are regarded as officially published after their release is announced to the table of contents alert mailing list.
  • You may sign up for e-mail alerts to receive table of contents of newly released issues.
  • PDF is the official format for papers published in both, html and pdf forms. To view the papers in pdf format, click on the "PDF Full-text" link, and use the free Adobe Reader to open them.
Order results
Result details
Section
Select all
Export citation of selected articles as:
21 pages, 6124 KiB  
Article
Upscaling Household Survey Data Using Remote Sensing to Map Socioeconomic Groups in Kampala, Uganda
by Lisa-Marie Hemerijckx, Sam Van Emelen, Joachim Rymenants, Jac Davis, Peter H. Verburg, Shuaib Lwasa and Anton Van Rompaey
Remote Sens. 2020, 12(20), 3468; https://doi.org/10.3390/rs12203468 - 21 Oct 2020
Cited by 7 | Viewed by 5438
Abstract
Sub-Saharan African cities are expanding horizontally, demonstrating spatial patterns of urban sprawl and socioeconomic segregation. An important research gap around the geographies of urban populations is that city-wide analyses mask local socioeconomic inequalities. This research focuses on those inequalities by identifying the spatial [...] Read more.
Sub-Saharan African cities are expanding horizontally, demonstrating spatial patterns of urban sprawl and socioeconomic segregation. An important research gap around the geographies of urban populations is that city-wide analyses mask local socioeconomic inequalities. This research focuses on those inequalities by identifying the spatial settlement patterns of socioeconomic groups within the Greater Kampala Metropolitan Area (Uganda). Findings are based on a novel dataset, an extensive household survey with 541 households, conducted in Kampala in 2019. To identify different socioeconomic groups, a k-prototypes clustering method was applied to the survey data. A maximum likelihood classification method was applied on a recent Landsat-8 image of the city and compared to the socioeconomic clustering through a fuzzy error matrix. The resulting maps show how different socioeconomic clusters are located around the city. We propose a simple method to upscale household survey responses to a larger study area, to use these data as a base map for further analysis or urban planning purposes. Obtaining a better understanding of the spatial variability in socioeconomic dynamics can aid urban policy-makers to target their decision-making processes towards a more favorable and sustainable future. Full article
(This article belongs to the Special Issue Remote Sensing Application to Population Mapping)
Show Figures

Graphical abstract

16 pages, 7133 KiB  
Article
A Quantitative Analysis of Surface Changes on an Abandoned Forest Road in the Lejowa Valley (Tatra Mountains, Poland)
by Joanna Fidelus-Orzechowska, Dariusz Strzyżowski, Jarosław Cebulski and Dominika Wrońska-Wałach
Remote Sens. 2020, 12(20), 3467; https://doi.org/10.3390/rs12203467 - 21 Oct 2020
Cited by 6 | Viewed by 2388
Abstract
The main aim of this research was to determine the magnitude of geomorphologic changes within a section of a forest road. The research was carried out in the Lejowa Valley in the Tatra Mountains. The measurements of the surface of the road were [...] Read more.
The main aim of this research was to determine the magnitude of geomorphologic changes within a section of a forest road. The research was carried out in the Lejowa Valley in the Tatra Mountains. The measurements of the surface of the road were performed using a RIEGL VZ-4000 terrestrial laser scanner (TLS). TLS models for 2017, 2018, and 2019 served as the basis for the determination of quantitative and spatial relief transformations. The net annual change on the studied road within the first period equaled −884 m3 ha−1 year−1, and for the second period −370 m3 ha−1 year−1. Changes across the accumulation fan ranged from −265 m3 ha−1 year−1 to +36 m3 ha−1 year−1. The average rate of erosion on the studied abandoned road is similar, and sometimes even greater than that on roads which are still in use. Our research shows that improper road location may lead to irreversible changes to the natural environment. The planning of a forest road must take into account natural conditions, otherwise progressive relief transformations may lead to significant surface changes and the road may be excluded from use. Full article
Show Figures

Graphical abstract

20 pages, 8777 KiB  
Article
Three-Dimensional Time Series Movement of the Cuolangma Glaciers, Southern Tibet with Sentinel-1 Imagery
by Liye Yang, Chaoying Zhao, Zhong Lu, Chengsheng Yang and Qin Zhang
Remote Sens. 2020, 12(20), 3466; https://doi.org/10.3390/rs12203466 - 21 Oct 2020
Cited by 10 | Viewed by 2615
Abstract
Many debris-covered glaciers are broadly distributed across High Mountain Asia and have made a number of contributions to water circulation for Qinghai-Tibet Plateau (QTP). The formation of large supraglacial lakes poses risks for glacier lake outburst floods (GLOFs). Therefore, it is important to [...] Read more.
Many debris-covered glaciers are broadly distributed across High Mountain Asia and have made a number of contributions to water circulation for Qinghai-Tibet Plateau (QTP). The formation of large supraglacial lakes poses risks for glacier lake outburst floods (GLOFs). Therefore, it is important to monitor the movement of glaciers and to analyze their spatiotemporal characteristics. In this study we take Cuolangma glaciers in the central Himalayas as study targets, where glacier No.1 is a lake-terminating debris-covered glacier and glacier No.2 is a land-terminating debris-covered glacier. The 3D deformation time series is firstly estimated by using the Pixel Offset-Small Baseline Subsets (PO-SBAS) based on the ascending and descending Sentinel-1 datasets spanning from January to December 2018. Then the horizontal and vertical time series displacements are obtained to show their spatiotemporal features. The velocities of glacier No.1 in horizontal and vertical direction were up to 16.0 ± 0.04 m/year and 3.4 ± 0.42 m/year, respectively, and the ones of the glacier No.2 were 12.0 ± 0.07 m/year and 2.0 ± 0.27 m/year, respectively. Next, the correlation between the precipitation and the surface velocity suggests that the glacier velocity does not show a clear association with daily precipitation alone. Finally, the debris-covered glaciers evolution is evaluated which shows that the tongue of the glacier No.1 is wasting away and the transition of glacier No.2 from land-terminating to lake-terminating is a probable scenario in the later period of glacier wastage. This research can significantly serve for glacier multidimensional monitoring and the mitigation of hazardous disaster caused by debris-covered glaciers in the central Himalayas. Full article
(This article belongs to the Section Environmental Remote Sensing)
Show Figures

Graphical abstract

25 pages, 13116 KiB  
Article
Color and Laser Data as a Complementary Approach for Heritage Documentation
by Yahya Alshawabkeh
Remote Sens. 2020, 12(20), 3465; https://doi.org/10.3390/rs12203465 - 21 Oct 2020
Cited by 9 | Viewed by 2728
Abstract
Heritage recording has received much attention and benefits from recent developments in the field of range and imaging sensors. While these methods have often been viewed as two different methodologies, data integration can achieve different products, which are not always found in a [...] Read more.
Heritage recording has received much attention and benefits from recent developments in the field of range and imaging sensors. While these methods have often been viewed as two different methodologies, data integration can achieve different products, which are not always found in a single technique. Data integration in this paper can be divided into two levels: laser scanner data aided by photogrammetry and photogrammetry aided by scanner data. At the first level, superior radiometric information, mobility and accessibility of imagery can be actively used to add texture information and allow for new possibilities in terms of data interpretation and completeness of complex site documentation. In the second level, true orthophoto is generated based on laser data, the results are rectified images with a uniform scale representing all objects at their planimetric position. The proposed approaches enable flexible data fusion and allow images to be taken at an optimum time and position for radiometric information. Data fusion usually involves serious distortions in the form of a double mapping of occluded objects that affect the product quality. In order to enhance the efficiency of visibility analysis in complex structures, a proposed visibility algorithm is implemented into the developed methods of texture mapping and true orthophoto generation. The algorithm filters occluded areas based on a patch processing using a grid square unit set around the projected vertices. The depth of the mapped triangular vertices within the patch neighborhood is calculated to assign the visible one. In this contribution, experimental results from different historical sites in Jordan are presented as a validation of the proposed algorithms. Algorithms show satisfactory performance in terms of completeness and correctness of occlusion detection and spectral information mapping. The results indicate that hybrid methods could be used efficiently in the representation of heritage structures. Full article
(This article belongs to the Special Issue Sensors & Methods in Cultural Heritage)
Show Figures

Figure 1

20 pages, 5600 KiB  
Article
UAV-Based LiDAR for High-Throughput Determination of Plant Height and Above-Ground Biomass of the Bioenergy Grass Arundo donax
by Mauro Maesano, Sacha Khoury, Farid Nakhle, Andrea Firrincieli, Alan Gay, Flavia Tauro and Antoine Harfouche
Remote Sens. 2020, 12(20), 3464; https://doi.org/10.3390/rs12203464 - 21 Oct 2020
Cited by 26 | Viewed by 4440
Abstract
Replacing fossil fuels with cellulosic biofuels is a valuable component of reducing the drivers of climate change. This leads to a requirement to develop more productive bioenergy crops, such as Arundo donax with the aim of increasing above-ground biomass (AGB). However, direct measurement [...] Read more.
Replacing fossil fuels with cellulosic biofuels is a valuable component of reducing the drivers of climate change. This leads to a requirement to develop more productive bioenergy crops, such as Arundo donax with the aim of increasing above-ground biomass (AGB). However, direct measurement of AGB is time consuming, destructive, and labor-intensive. Phenotyping of plant height and biomass production is a bottleneck in genomics- and phenomics-assisted breeding. Here, an unmanned aerial vehicle (UAV) for remote sensing equipped with light detection and ranging (LiDAR) was tested for remote plant height and biomass determination in A. donax. Experiments were conducted on three A. donax ecotypes grown in well-watered and moderate drought stress conditions. A novel UAV-LiDAR data collection and processing workflow produced a dense three-dimensional (3D) point cloud for crop height estimation through a normalized digital surface model (DSM) that acts as a crop height model (CHM). Manual measurements of crop height and biomass were taken in parallel and compared to LiDAR CHM estimates. Stepwise multiple regression was used to estimate biomass. Analysis of variance (ANOVA) tests and pairwise comparisons were used to determine differences between ecotypes and drought stress treatments. We found a significant relationship between the sensor readings and manually measured crop height and biomass, with determination coefficients of 0.73 and 0.71 for height and biomass, respectively. Differences in crop heights were detected more precisely from LiDAR estimates than from manual measurement. Crop biomass differences were also more evident in LiDAR estimates, suggesting differences in ecotypes’ productivity and tolerance to drought. Based on these results, application of the presented UAV-LiDAR workflow will provide new opportunities in assessing bioenergy crop morpho-physiological traits and in delivering improved genotypes for biorefining. Full article
(This article belongs to the Special Issue Unmanned Aerial Systems for Surface Hydrology)
Show Figures

Graphical abstract

22 pages, 9245 KiB  
Article
Small-UAV Radar Imaging System Performance with GPS and CDGPS Based Motion Compensation
by Carlo Noviello, Giuseppe Esposito, Giancarmine Fasano, Alfredo Renga, Francesco Soldovieri and Ilaria Catapano
Remote Sens. 2020, 12(20), 3463; https://doi.org/10.3390/rs12203463 - 21 Oct 2020
Cited by 15 | Viewed by 2905
Abstract
The present manuscript faces the problem of performing high-resolution Unmanned Aerial Vehicle (UAV) radar imaging in sounder modality, i.e., into the vertical plane defined by the along-tack and the nadir directions. Data are collected by means of a light and compact UAV radar [...] Read more.
The present manuscript faces the problem of performing high-resolution Unmanned Aerial Vehicle (UAV) radar imaging in sounder modality, i.e., into the vertical plane defined by the along-tack and the nadir directions. Data are collected by means of a light and compact UAV radar prototype; flight trajectory information is provided by two positioning estimation techniques: standalone Global Positioning System (GPS) and Carrier based Differential Global Positioning System (CDGPS). The radar imaging is formulated as a linear inverse scattering problem and a motion compensation (MoCo) procedure, accounting for GPS or CDGPS positioning, is adopted. The implementation of the imaging scheme, which is based on the Truncated Singular Value Decomposition, is made efficient by the Shift and Zoom approach. Two independent flight tests involving different kind of targets are considered to test the imaging strategy. The results show that the CDGPS supports suitable imaging performance in all the considered test cases. On the other hand, satisfactory performance is also possible by using standalone GPS when the meter-level positioning error exhibits small variations during the radar integration time. Full article
(This article belongs to the Section Engineering Remote Sensing)
Show Figures

Graphical abstract

27 pages, 9897 KiB  
Article
Drought Stress Detection in Juvenile Oilseed Rape Using Hyperspectral Imaging with a Focus on Spectra Variability
by Wiktor R. Żelazny and Jan Lukáš
Remote Sens. 2020, 12(20), 3462; https://doi.org/10.3390/rs12203462 - 21 Oct 2020
Cited by 9 | Viewed by 2881
Abstract
Hyperspectral imaging (HSI) has been gaining recognition as a promising proximal and remote sensing technique for crop drought stress detection. A modelling approach accounting for the treatment effects on the stress indicators’ standard deviations was applied to proximal images of oilseed rape—a crop [...] Read more.
Hyperspectral imaging (HSI) has been gaining recognition as a promising proximal and remote sensing technique for crop drought stress detection. A modelling approach accounting for the treatment effects on the stress indicators’ standard deviations was applied to proximal images of oilseed rape—a crop subjected to various HSI studies, with the exception of drought. The aim of the present study was to determine the spectral responses of two cultivars, ‘Cadeli’ and ‘Viking’, representing distinctive water management strategies, to three types of watering regimes. Hyperspectral data cubes were acquired at the leaf level using a 2D frame camera. The influence of the experimental factors on the extent of leaf discolorations, vegetation index values, and principal component scores was investigated using Bayesian linear models. Clear treatment effects were obtained primarily for the vegetation indexes with respect to the watering regimes. The mean values of RGI, MTCI, RNDVI, and GI responded to the difference between the well-watered and water-deprived plants. The RGI index excelled among them in terms of effect strengths, which amounted to 0.96[2.21,0.21] and 0.71[1.97,0.49] units for each cultivar. A consistent increase in the multiple index standard deviations, especially RGI, PSRI, TCARI, and TCARI/OSAVI, was associated with worsening of the hydric regime. These increases were captured not only for the dry treatment but also for the plants subjected to regeneration after a drought episode, particularly by PSRI (a multiplicative effect of 0.33[0.16,0.68] for ‘Cadeli’). This result suggests a higher sensitivity of the vegetation index variability measures relative to the means in the context of the oilseed rape drought stress diagnosis and justifies the application of HSI to capture these effects. RGI is an index deserving additional scrutiny in future studies, as both its mean and standard deviation were affected by the watering regimes. Full article
(This article belongs to the Special Issue Spectroscopic Analysis of Plants and Vegetation)
Show Figures

Figure 1

18 pages, 56579 KiB  
Article
Raindrop-Aware GAN: Unsupervised Learning for Raindrop-Contaminated Coastal Video Enhancement
by Jinah Kim, Dong Huh, Taekyung Kim, Jaeil Kim, Jeseon Yoo and Jae-Seol Shim
Remote Sens. 2020, 12(20), 3461; https://doi.org/10.3390/rs12203461 - 21 Oct 2020
Cited by 3 | Viewed by 3183
Abstract
We propose an unsupervised network with adversarial learning, the Raindrop-aware GAN, which enhances the quality of coastal video images contaminated by raindrops. Raindrop removal from coastal videos faces two main difficulties: converting the degraded image into a clean one by visually removing [...] Read more.
We propose an unsupervised network with adversarial learning, the Raindrop-aware GAN, which enhances the quality of coastal video images contaminated by raindrops. Raindrop removal from coastal videos faces two main difficulties: converting the degraded image into a clean one by visually removing the raindrops, and restoring the background coastal wave information in the raindrop regions. The components of the proposed network—a generator and a discriminator for adversarial learning—are trained on unpaired images degraded by raindrops and clean images free from raindrops. By creating raindrop masks and background-restored images, the generator restores the background information in the raindrop regions alone, preserving the input as much as possible. The proposed network was trained and tested on an open-access dataset and directly collected dataset from the coastal area. It was then evaluated by three metrics: the peak signal-to-noise ratio, structural similarity, and a naturalness-quality evaluator. The indices of metrics are 8.2% (+2.012), 0.2% (+0.002), and 1.6% (−0.196) better than the state-of-the-art method, respectively. In the visual assessment of the enhanced video image quality, our method better restored the image patterns of steep wave crests and breaking than the other methods. In both quantitative and qualitative experiments, the proposed method more effectively removed the raindrops in coastal video and recovered the damaged background wave information than state-of-the-art methods. Full article
Show Figures

Graphical abstract

22 pages, 6514 KiB  
Article
Patch Pattern and Ecological Risk Assessment of Alpine Grassland in the Source Region of the Yellow River
by Jia Liu, Jianjun Chen, Qiaoting Qin, Haotian You, Xiaowen Han and Guoqing Zhou
Remote Sens. 2020, 12(20), 3460; https://doi.org/10.3390/rs12203460 - 21 Oct 2020
Cited by 14 | Viewed by 2492
Abstract
The source region of the Yellow River (SRYR) is an important water conservation and animal husbandry resource in China. It is of great significance to understand the patch pattern and ecological risk of alpine grassland in the SRYR for ecological environment management. This [...] Read more.
The source region of the Yellow River (SRYR) is an important water conservation and animal husbandry resource in China. It is of great significance to understand the patch pattern and ecological risk of alpine grassland in the SRYR for ecological environment management. This study first used 12 unmanned aerial vehicle (UAV) aerial images and eight moderate resolution imaging spectroradiometer (MODIS) vegetation index product MOD13Q1 images from July to August in 2019 to extract alpine grassland patch patterns in the SRYR, then constructed an ecological risk model based on the landscape vulnerability index and landscape disturbance index, and finally combined spatial self-reliance correlation and semi-variance analysis methods to explore the spatial distribution of ecological risks. The results showed that the patch fragmentation degree (Pi), area weighted shape index (AWMSI), and separation degree (Si) of the four grassland types in the SRYR are ordered as follows: alpine steppe > degraded meadow > alpine meadow > swamp meadow. Moreover, the greater the fractional vegetation cover (FVC), the greater the landscape dominance index (DOi), and the better the ecosystem stability. The spatial difference of ecological risk in the SRYR shows a situation of low risk in the east (ERImin=1.5355) and high risk in the west (ERImax = 70.6429). High FVC was found in low and mild low risk areas where the vegetation types are mainly swamp meadow and shrub, while low FVC was found in high and mild high-risk areas where the vegetation types are mainly alpine steppe and degraded meadow. The spatial distribution of ecological risk of the SRYR has obvious positive spatial correlation (Moran's I = 0.863), the spatial aggregation distribution is distinct, and the local space has significant high-high aggregation and low–low aggregation phenomena. The results of this study reveal that patch characteristics have good indicative significance for alpine grassland ecological protection and should be considered in future studies. In addition, the ecological risk in the SRYR is relatively high, especially in the western region, which should be taken seriously in future ecological management and governance. Full article
Show Figures

Graphical abstract

22 pages, 15554 KiB  
Article
Fusion Approach for Remotely-Sensed Mapping of Agriculture (FARMA): A Scalable Open Source Method for Land Cover Monitoring Using Data Fusion
by Nathan Thomas, Christopher S. R. Neigh, Mark L. Carroll, Jessica L. McCarty and Pete Bunting
Remote Sens. 2020, 12(20), 3459; https://doi.org/10.3390/rs12203459 - 21 Oct 2020
Cited by 4 | Viewed by 4816
Abstract
The increasing availability of very-high resolution (VHR; <2 m) imagery has the potential to enable agricultural monitoring at increased resolution and cadence, particularly when used in combination with widely available moderate-resolution imagery. However, scaling limitations exist at the regional level due to big [...] Read more.
The increasing availability of very-high resolution (VHR; <2 m) imagery has the potential to enable agricultural monitoring at increased resolution and cadence, particularly when used in combination with widely available moderate-resolution imagery. However, scaling limitations exist at the regional level due to big data volumes and processing constraints. Here, we demonstrate the Fusion Approach for Remotely-Sensed Mapping of Agriculture (FARMA), using a suite of open source software capable of efficiently characterizing time-series field-scale statistics across large geographical areas at VHR resolution. We provide distinct implementation examples in Vietnam and Senegal to demonstrate the approach using WorldView VHR optical, Sentinel-1 Synthetic Aperture Radar, and Sentinel-2 and Sentinel-3 optical imagery. This distributed software is open source and entirely scalable, enabling large area mapping even with modest computing power. FARMA provides the ability to extract and monitor sub-hectare fields with multisensor raster signals, which previously could only be achieved at scale with large computational resources. Implementing FARMA could enhance predictive yield models by delineating boundaries and tracking productivity of smallholder fields, enabling more precise food security observations in low and lower-middle income countries. Full article
Show Figures

Graphical abstract

19 pages, 4345 KiB  
Article
LEO Onboard Real-Time Orbit Determination Using GPS/BDS Data with an Optimal Stochastic Model
by Xuewen Gong, Jizhang Sang, Fuhong Wang and Xingxing Li
Remote Sens. 2020, 12(20), 3458; https://doi.org/10.3390/rs12203458 - 21 Oct 2020
Cited by 16 | Viewed by 2920
Abstract
The advancements of Earth observations, remote sensing, communications and navigation augmentation based on low Earth orbit (LEO) platforms present strong requirements for accurate, real-time and autonomous navigation of LEO satellites. Precise onboard real-time orbit determination (RTOD) using the space-borne data of multiple global [...] Read more.
The advancements of Earth observations, remote sensing, communications and navigation augmentation based on low Earth orbit (LEO) platforms present strong requirements for accurate, real-time and autonomous navigation of LEO satellites. Precise onboard real-time orbit determination (RTOD) using the space-borne data of multiple global navigation satellite systems (multi-GNSS) becomes practicable along with the availability of multi-GNSS. We study the onboard RTOD algorithm and experiments by using America’s Global Positioning System (GPS) and China’s regional BeiDou Navigation Satellite System (BDS-2) space-borne data of the FengYun-3C satellite. A new pseudo-ambiguity parameter, which combines the constant phase ambiguity, the orbit and clock offset error of the GPS/BDS broadcast ephemeris in the line-of-sight (LOS), is defined and estimated in order to reduce the negative effect of the LOS error on onboard RTOD. The analyses on the variation of the LOS error in the GPS/BDS broadcast ephemeris indicate that the pseudo-ambiguity parameter could be modeled as a random walk, and the setting of the power spectral density in the random walk model decides whether the pseudo-ambiguity can be estimated reasonably and the LOS error could be reduced or not. For different types of GPS/BDS satellites, the LOS errors show different variation characteristics, so the power spectral density should be set separately and differently. A numerical search approach is presented in this paper to find the optimal setting of the power spectral density for each type of GPS/BDS satellite by a series of tests. Based on the optimal stochastic model, a 3-dimensional (3D) real-time orbit accuracy of 0.7–2.0 m for position and 0.7–1.7 mm/s for velocity could be achieved only with dual-frequency BDS measurements and the broadcast ephemeris, while a notably superior orbit accuracy of 0.3–0.5 m for position and 0.3–0.5 mm/s for velocity is achievable using dual-frequency GPS/BDS measurements, due to the absorption effect of the estimated pseudo-ambiguity on the LOS error of the GPS/BDS broadcast ephemeris. Compared to using GPS-alone data, the GPS/BDS fusion only marginally improves the onboard RTOD orbit accuracy by about 1–3 cm, but the inclusion of BDS satellites increases the number of the tracked GNSS satellites and thus speeds up the convergence of the filter. Furthermore, the GPS/BDS fusion could help suppress the local orbit errors, ensure the orbit accuracy and improve the reliability and availability of the onboard RTOD when fewer GPS satellites are tracked in some anomalous arcs. Full article
Show Figures

Graphical abstract

28 pages, 8619 KiB  
Review
Estimation of LAI with the LiDAR Technology: A Review
by Yao Wang and Hongliang Fang
Remote Sens. 2020, 12(20), 3457; https://doi.org/10.3390/rs12203457 - 21 Oct 2020
Cited by 55 | Viewed by 11076
Abstract
Leaf area index (LAI) is an important vegetation parameter. Active light detection and ranging (LiDAR) technology has been widely used to estimate vegetation LAI. In this study, LiDAR technology, LAI retrieval and validation methods, and impact factors are reviewed. First, the paper introduces [...] Read more.
Leaf area index (LAI) is an important vegetation parameter. Active light detection and ranging (LiDAR) technology has been widely used to estimate vegetation LAI. In this study, LiDAR technology, LAI retrieval and validation methods, and impact factors are reviewed. First, the paper introduces types of LiDAR systems and LiDAR data preprocessing methods. After introducing the application of different LiDAR systems, LAI retrieval methods are described. Subsequently, the review discusses various LiDAR LAI validation schemes and limitations in LiDAR LAI validation. Finally, factors affecting LAI estimation are analyzed. The review presents that LAI is mainly estimated from LiDAR data by means of the correlation with the gap fraction and contact frequency, and also from the regression of forest biophysical parameters derived from LiDAR. Terrestrial laser scanning (TLS) can be used to effectively estimate the LAI and vertical foliage profile (VFP) within plots, but this method is affected by clumping, occlusion, voxel size, and woody material. Airborne laser scanning (ALS) covers relatively large areas in a spatially contiguous manner. However, the capability of describing the within-canopy structure is limited, and the accuracy of LAI estimation with ALS is affected by the height threshold and sampling size, and types of return. Spaceborne laser scanning (SLS) provides the global LAI and VFP, and the accuracy of estimation is affected by the footprint size and topography. The use of LiDAR instruments for the retrieval of the LAI and VFP has increased; however, current LiDAR LAI validation studies are mostly performed at local scales. Future research should explore new methods to invert LAI and VFP from LiDAR and enhance the quantitative analysis and large-scale validation of the parameters. Full article
(This article belongs to the Special Issue Remote Sensing of Biophysical Parameters)
Show Figures

Graphical abstract

23 pages, 1456 KiB  
Article
A Pseudo-Label Guided Artificial Bee Colony Algorithm for Hyperspectral Band Selection
by Chunlin He, Yong Zhang and Dunwei Gong
Remote Sens. 2020, 12(20), 3456; https://doi.org/10.3390/rs12203456 - 21 Oct 2020
Cited by 12 | Viewed by 2378
Abstract
Hyperspectral remote sensing images have characteristics such as high dimensionality and high redundancy. This paper proposes a pseudo-label guided artificial bee colony band selection algorithm with hypergraph clustering (HC-ABC) to remove redundant and noise bands. Firstly, replacing traditional pixel points by super-pixel centers, [...] Read more.
Hyperspectral remote sensing images have characteristics such as high dimensionality and high redundancy. This paper proposes a pseudo-label guided artificial bee colony band selection algorithm with hypergraph clustering (HC-ABC) to remove redundant and noise bands. Firstly, replacing traditional pixel points by super-pixel centers, a hypergraph evolutionary clustering method with low computational cost is developed to generate high-quality pseudo-labels; Then, on the basis of these pseudo-labels, taking classification accuracy as the optimized objective, a supervised band selection algorithm based on artificial bee colony is proposed. Moreover, a noise filtering mechanism based on grid division is designed to ensure the accuracy of pseudo-labels. Finally, the proposed algorithm is applied in 3 real datasets and compared with 6 classical band selection algorithms. Experimental results show that the proposed algorithm can obtain a band subset with high classification accuracy for all the three classifiers, KNN, Random Forest, and SVM. Full article
Show Figures

Graphical abstract

19 pages, 6363 KiB  
Article
Quasi-Active Thermal Imaging of Large Floating Covers Using Ambient Solar Energy
by Yue Ma, Leslie Wong, Benjamin Steven Vien, Thomas Kuen, Jayantha Kodikara and Wing Kong Chiu
Remote Sens. 2020, 12(20), 3455; https://doi.org/10.3390/rs12203455 - 21 Oct 2020
Cited by 8 | Viewed by 2139
Abstract
Melbourne Water Corporation has two large anaerobic lagoons at the Western Treatment Plant (WTP), Werribee, Victoria, Australia. The lagoons are covered using numerous sheets of high-density polyethylene (HDPE) geomembranes to prevent the emission of odorous gases and to harness biogas as a source [...] Read more.
Melbourne Water Corporation has two large anaerobic lagoons at the Western Treatment Plant (WTP), Werribee, Victoria, Australia. The lagoons are covered using numerous sheets of high-density polyethylene (HDPE) geomembranes to prevent the emission of odorous gases and to harness biogas as a source of renewable energy. Some of the content of raw sewage can accumulate and form into a solid mass (called “scum”). The development of a large body of solid scum that rises to the surface of the lagoon (called “scumbergs”) deforms the covers and may affect its structural integrity. Currently, there is no method able to effectively “see-through” the opaque covers to define the spread of the scum underneath the cover. Hence, this paper investigates a new quasi-active thermal imaging method that uses ambient solar radiation to determine the extent of the solid matter under the geomembrane. This method was devised by using infrared thermography and a pyranometer to constantly monitor the transient temperature response of the HDPE geomembrane using the time varying ambient solar radiation. Newton’s cooling law is implemented to define the resultant cooling constants. The results of laboratory-scale tests demonstrate the capability of the quasi-active thermography to identify the presence and the extent of solid matter under the cover. This paper demonstrates, experimentally, the importance of measuring the surface temperature of the cover and solar intensity profiles to obtain the cooling process when during variations in solar intensity during normal sunrise, sunset, daily transitioning from morning–afternoon–evening and cloud cover events. The timescale associated with these events are different and the results show that these daily transient temperature cycles of the geomembranes can be used to detect the extent of the accumulation of solid matter underneath the geomembrane. The conclusions from this work will be further developed for field trials to practically monitor the growth in the extent of the scum under the floating covers in WTP with the ambient solar energy. Full article
Show Figures

Graphical abstract

26 pages, 6004 KiB  
Article
A Quantitative Framework for Analyzing Spatial Dynamics of Flood Events: A Case Study of Super Cyclone Amphan
by Mohammad Mehedy Hassan, Kevin Ash, Joynal Abedin, Bimal Kanti Paul and Jane Southworth
Remote Sens. 2020, 12(20), 3454; https://doi.org/10.3390/rs12203454 - 21 Oct 2020
Cited by 26 | Viewed by 5675
Abstract
Identifying the flooding risk hotspot is crucial for aiding a rapid response and prioritizes mitigation efforts over large disaster impacted regions. While climate change is increasing the risk of floods in many vulnerable regions of the world, the commonly used crisis map is [...] Read more.
Identifying the flooding risk hotspot is crucial for aiding a rapid response and prioritizes mitigation efforts over large disaster impacted regions. While climate change is increasing the risk of floods in many vulnerable regions of the world, the commonly used crisis map is inefficient and cannot rapidly determine the spatial variation and intensity of flooding extension across the affected areas. In such cases, the Local Indicators of Spatial Association (LISA) statistic can detect heterogeneity or the flooding hotspot at a local spatial scale beyond routine mapping. This area, however, has not yet been studied in the context of the magnitude of the floods. The present study incorporates the LISA methodology including Moran’s I and Getis–Ord Gi* to identify the spatial and temporal heterogeneity of the occurrence of flooding from super cyclone Amphan across 16 coastal districts of Bangladesh. Using the Synthetic Aperture Radar (SAR) data from Sentinel-1 and a Support Vector Machine (SVM) classification, “water” and “land” were classified for the pre-event (16 May 2020) and post-events (22 May, 28 May, and 7 June 2020) of the area under study. A Modified Normalized Difference Water Index (MNDWI), and visual comparison were used to evaluate the flood maps. A compelling agreement was accomplished between the observed and predicted flood maps, with an overall precision of above 95% for all SAR classified images. As per this study, 2233 km2 (8%) of the region is estimated to have been inundated on 22 May. After this point, the intensity and aerial expansion of flood decreased to 1490 km2 by 28 May before it increased slightly to 1520 km2 (2.1% of the study area) on 7 June. The results from LISA indicated that the main flooding hotspots were located in the central part, particularly in the region off the north-east of the mangrove forest. A total of 238 Unions (smallest administrative units) were identified as high flooding hotspots (p < 0.05) on 22 May, but the number of flooding hotspots dropped to 166 in the second week (28 May) after Amphan subsided before it increased to a further 208 hotspots (p < 0.05) on 7 June due to incessant rainfall and riverbank failure in the south-west part of the study area. As such, an appropriate, timely, and cost-effective strategy would be to assess existing flooding management policies through the identified flooding hotspot regions. This identification would then allow for the creation of an improved policy to help curtail the destructive effects of flooding in the future. Full article
Show Figures

Graphical abstract

25 pages, 20453 KiB  
Article
A Phase Filtering Method with Scale Recurrent Networks for InSAR
by Liming Pu, Xiaoling Zhang, Zenan Zhou, Jun Shi, Shunjun Wei and Yuanyuan Zhou
Remote Sens. 2020, 12(20), 3453; https://doi.org/10.3390/rs12203453 - 21 Oct 2020
Cited by 17 | Viewed by 3500
Abstract
Phase filtering is a key issue in interferometric synthetic aperture radar (InSAR) applications, such as deformation monitoring and topographic mapping. The accuracy of the deformation and terrain height is highly dependent on the quality of phase filtering. Researchers are committed to continuously improving [...] Read more.
Phase filtering is a key issue in interferometric synthetic aperture radar (InSAR) applications, such as deformation monitoring and topographic mapping. The accuracy of the deformation and terrain height is highly dependent on the quality of phase filtering. Researchers are committed to continuously improving the accuracy and efficiency of phase filtering. Inspired by the successful application of neural networks in SAR image denoising, in this paper we propose a phase filtering method that is based on deep learning to efficiently filter out the noise in the interferometric phase. In this method, the real and imaginary parts of the interferometric phase are filtered while using a scale recurrent network, which includes three single scale subnetworks based on the encoder-decoder architecture. The network can utilize the global structural phase information contained in the different-scaled feature maps, because RNN units are used to connect the three different-scaled subnetworks and transmit current state information among different subnetworks. The encoder part is used for extracting the phase features, and the decoder part restores detailed information from the encoded feature maps and makes the size of the output image the same as that of the input image. Experiments on simulated and real InSAR data prove that the proposed method is superior to three widely-used phase filtering methods by qualitative and quantitative comparisons. In addition, on the same simulated data set, the overall performance of the proposed method is better than another deep learning-based method (DeepInSAR). The runtime of the proposed method is only about 0.043s for an image with a size of 1024×1024 pixels, which has the significant advantage of computational efficiency in practical applications that require real-time processing. Full article
(This article belongs to the Special Issue InSAR in Remote Sensing)
Show Figures

Graphical abstract

18 pages, 8184 KiB  
Article
Assessment of Global Ionospheric Maps Performance by Means of Ionosonde Data
by Gabriel O. Jerez, Manuel Hernández-Pajares, Fabricio S. Prol, Daniele B. M. Alves and João F. G. Monico
Remote Sens. 2020, 12(20), 3452; https://doi.org/10.3390/rs12203452 - 21 Oct 2020
Cited by 13 | Viewed by 2409
Abstract
This work presents a new method for assessing global ionospheric maps (GIM) using ionosonde data. The method is based on the critical frequency at the F2 layer directly measured by ionosondes to validate VTEC (vertical total electron content) values from GIMs. The [...] Read more.
This work presents a new method for assessing global ionospheric maps (GIM) using ionosonde data. The method is based on the critical frequency at the F2 layer directly measured by ionosondes to validate VTEC (vertical total electron content) values from GIMs. The analysis considered four different approaches to using foF2. The study was performed over one of the most challenging scenarios, the Brazilian region, considering four ionosondes (combined in six pairs) and thirteen GIM products available at CDDIS (Crustal Dynamics Data Information System). Analysis was conducted using daily, weekly, one year (2015), and four years (2014–2017) of data. Additional information from the ionosphere was estimated to complement the daily analysis, such as slab thickness and shape function peak. Results indicated that slab thickness and shape function peak could be used as alternative indicators of periods and regions where this method could be applied. The weekly analysis indicated the squared frequency ratio with local time correction as the best approach of using foF2, between the ones evaluated. The analysis of one-year data (2015) was performed considering thirteen GIMs, where CODG and UQRG were the two GIMs that presented the best performance. The four-year time series (2014–2017) were analyzed considering these two products. Regional and temporal ionospheric influences could be noticed in the results, with expected larger errors during the solar cycle peak in 2014 and at locations with pairs of ionosondes with the larger distance apart. Therefore, we have confirmed the viability of the developed approach as an assessment method to analyze GIMs quality based on ionosonde data. Full article
(This article belongs to the Section Atmospheric Remote Sensing)
Show Figures

Graphical abstract

20 pages, 5257 KiB  
Article
Mapping Soil Organic Carbon for Airborne and Simulated EnMAP Imagery Using the LUCAS Soil Database and a Local PLSR
by Kathrin J. Ward, Sabine Chabrillat, Maximilian Brell, Fabio Castaldi, Daniel Spengler and Saskia Foerster
Remote Sens. 2020, 12(20), 3451; https://doi.org/10.3390/rs12203451 - 20 Oct 2020
Cited by 27 | Viewed by 4779
Abstract
Soil degradation is a major threat for European soils and therefore, the European Commission recommends intensifying research on soil monitoring to capture changes over time and space. Imaging spectroscopy is a promising technique to create spatially accurate topsoil maps based on hyperspectral remote [...] Read more.
Soil degradation is a major threat for European soils and therefore, the European Commission recommends intensifying research on soil monitoring to capture changes over time and space. Imaging spectroscopy is a promising technique to create spatially accurate topsoil maps based on hyperspectral remote sensing data. We tested the application of a local partial least squares regression (PLSR) to airborne HySpex and simulated satellite EnMAP (Environmental Mapping and Analysis Program) data acquired in north-eastern Germany to quantify the soil organic carbon (SOC) content. The approach consists of two steps: (i) the local PLSR uses the European LUCAS (land use/cover area frame statistical survey) Soil database to quantify the SOC content for soil samples from the study site in order to avoid the need for wet chemistry analyses, and subsequently (ii) a remote sensing model is calibrated based on the local PLSR SOC results and the corresponding image spectra. This two-step approach is compared to a traditional PLSR approach using measured SOC contents from local samples. The prediction accuracy is high for the laboratory model in the first step with R2 = 0.86 and RPD = 2.77. The HySpex airborne prediction accuracy of the traditional approach is high and slightly superior to the two-step approach (traditional: R2 = 0.78, RPD = 2.19; two-step: R2 = 0.67, RPD = 1.79). Applying the two-step approach to simulated EnMAP imagery leads to a lower but still reasonable prediction accuracy (traditional: R2 = 0.77, RPD = 2.15; two-step: R2 = 0.48, RPD = 1.41). The two-step models of both sensors were applied to all bare soils of the respective images to produce SOC maps. This local PLSR approach, based on large scale soil spectral libraries, demonstrates an alternative to SOC measurements from wet chemistry of local soil samples. It could allow for repeated inexpensive SOC mapping based on satellite remote sensing data as long as spectral measurements of a few local samples are available for model calibration. Full article
Show Figures

Graphical abstract

20 pages, 4856 KiB  
Article
Changing Patterns of Lakes on The Southern Tibetan Plateau Based on Multi-Source Satellite Data
by Fangdi Sun, Ronghua Ma, Bin He, Xiaoli Zhao, Yuchao Zeng, Siyi Zhang and Shilin Tang
Remote Sens. 2020, 12(20), 3450; https://doi.org/10.3390/rs12203450 - 20 Oct 2020
Cited by 10 | Viewed by 2585
Abstract
More than 1100 lakes covering an area greater than 4500 km2 are located on the Tibetan Plateau, and these lakes are important regulators of several large and famous rivers in Asia. The determination of hydrological changes that have occurred in these lakes [...] Read more.
More than 1100 lakes covering an area greater than 4500 km2 are located on the Tibetan Plateau, and these lakes are important regulators of several large and famous rivers in Asia. The determination of hydrological changes that have occurred in these lakes can reflect climate change and supply scientific data to plateau environmental research. Data from high frequency (moderate-resolution imaging spectro-radiometer) MODIS images, altimetry, and the Hydroweb database collected during 2000–2015 were integrated in this study to delineate the detailed hydrological changes of 15 lakes in three basins—Inner Basin, Indus Basin, and Brahmaputra Basin—on the southern Tibetan Plateau. Seven of the 10 lakes in the Inner Basin presented increasing trends with various intensities, and the increasing rates in the area of four lakes (Nam Co, Selin Co, Zhari-namco, and Ngangze) were 1.62, 28.81, 2.27, and 3.70 km2/yr, respectively. The yearly increases in volume of the four lakes were 3.6, 9.44, 6, and 2.36 km3, respectively. A water balance equation was established for the four lakes based on lake volume changes to illustrate the contributions of precipitation, ground runoff, evaporation, and other factors. The results revealed that surface runoff was the major contributor to expansion, and lake surface evaporation was almost 2.76–3.86 times that of lake surface precipitation. The two lakes in Indus Basin, Rakshastal and Mapam Yumco, presented a slight retreat. As a representative of Brahmaputra Basin, Yamzho Yumco underwent a retreat of –3.49 km2/yr in area, –0.39 m/yr in level, and –0.19 km3/yr in volume. Decreasing precipitation, increasing evaporation, and the operation of a hydrological project were the main causes of its constant retreat. Full article
(This article belongs to the Special Issue Remote Sensing in Hydrology and Water Resources Management)
Show Figures

Graphical abstract

16 pages, 8573 KiB  
Article
Does Ecological Water Replenishment Help Prevent a Large Wetland from Further Deterioration? Results from the Zhalong Nature Reserve, China
by Liwen Chen, Sixin Liu, Yanfeng Wu, Y. Jun Xu, Shengbo Chen, Shiliang Pang, Zongting Gao and Guangxin Zhang
Remote Sens. 2020, 12(20), 3449; https://doi.org/10.3390/rs12203449 - 20 Oct 2020
Cited by 13 | Viewed by 2653
Abstract
Ecological water replenishment (EWR) has been increasingly applied to the restoration and maintenance of wetland hydrological conditions across China since the beginning of the 21st century. However, little is known about whether EWR projects help protect and/or restore wetland ecohydrology. As one of [...] Read more.
Ecological water replenishment (EWR) has been increasingly applied to the restoration and maintenance of wetland hydrological conditions across China since the beginning of the 21st century. However, little is known about whether EWR projects help protect and/or restore wetland ecohydrology. As one of the earliest and longest-running EWR projects in China, water has been released from the Nenjiang River into the Zhalong wetland since 2001. It is important to examine the ecohydrological effects of this EWR project. In this study, long time series remote sensing data were used to extract the water area, inundation frequency, and normalized difference vegetation index (NDVI) to explore how eco-hydrological conditions changed during the pre- (1984–2000) and post-EWR (2001–2018) periods in the Zhalong wetland. Results show that the inundation area decreased due to the reduced surface water inflow during the pre-EWR period. Similarly, monthly vegetation NDVI in the growing season generally exhibited a decreasing and an increasing trend during the pre- and post-EWR periods, respectively. In the post-EWR period, NDVI increased by 19%, 73%, 45%, 28%, 13% for the months of May through September, respectively. Due to EWR, vegetation growth in areas with low inundation frequency was better than in areas with high inundation frequency. We found that the EWR project, runoff, and precipitation contributed 25%, 11%, and 64% to changes in the NDVI, respectively, and 46%, 37%, and 17% to changes in inundation area, respectively. These results indicate that the EWR project has improved hydrological conditions in the Zhalong wetland. For further maximum benefits of EWR in the Zhalong wetlands, we suggest that implementing similar eco-hydrological projects in the future should focus on flood pulse management to increase the inundation area, improve hydrological connectivity, and create new habitats. Full article
(This article belongs to the Special Issue Remote Sensing of Wetlands)
Show Figures

Graphical abstract

20 pages, 5872 KiB  
Article
On the Frequency Sweep Rate Estimation in Airborne FMCW SAR Systems
by Carmen Esposito, Paolo Berardino, Antonio Natale and Stefano Perna
Remote Sens. 2020, 12(20), 3448; https://doi.org/10.3390/rs12203448 - 20 Oct 2020
Cited by 3 | Viewed by 2230
Abstract
Use of Frequency Modulated Continuous Wave (FMCW) Synthetic Aperture Radar (SAR) systems requires to accurately know the electronic parameters of the system. In particular, the use of an incorrect value of the Frequency Sweep Rate (FSR) introduces geometric distortions in the focused images. [...] Read more.
Use of Frequency Modulated Continuous Wave (FMCW) Synthetic Aperture Radar (SAR) systems requires to accurately know the electronic parameters of the system. In particular, the use of an incorrect value of the Frequency Sweep Rate (FSR) introduces geometric distortions in the focused images. Recently, a method, that we name FSR Estimate Through Corner reflectors (FSRETC), has been proposed to estimate the FSR value actually employed by the radar. The method is based on the use of the SAR image focused with the available erroneous FSR. Moreover, it exploits a number of Corner Reflectors (CRs) deployed over the illuminated area. In this work, we provide an assessment of the capabilities of the FSRETC algorithm. The overall analysis is performed through the use of a real dataset consisting of 10 acquisitions carried out in 2018 (5 acquisitions) and 2019 (5 acquisitions) with an airborne FMCW SAR system. The presented experimental analysis shows that even with a single acquisition, use of two CRs sufficiently far from each other in the range direction, allows achieving an accurate estimate of the searched FSR. Moreover, it is shown that the obtained estimate is very stable over the time. Therefore, the overall procedure can be applied only once, since the estimated values can be safely used for the subsequent missions, at least for the time interval considered in the work, that is, 14 months. In addition, the presented results pose the basis for an enhanced measurement strategy that allows effective application of the FSRETC algorithm through the use of only one CR. Full article
Show Figures

Graphical abstract

12 pages, 2591 KiB  
Technical Note
Remote Cross-Calibration of Wave Buoys Based on Significant Wave Height Observations of Altimeters in the Northern Hemisphere
by Jiuke Wang, Lotfi Aouf, Xianqiao Wang, Benxia Li and Juanjuan Wang
Remote Sens. 2020, 12(20), 3447; https://doi.org/10.3390/rs12203447 - 20 Oct 2020
Cited by 6 | Viewed by 2322
Abstract
Consistency between national wave buoy networks is extremely important for wave climate studies and verification of global operational wave forecasting systems; however, it is insufficiently investigated. The validation of altimeter significant wave heights (SWHs) with the wave buoy networks of China, Europe and [...] Read more.
Consistency between national wave buoy networks is extremely important for wave climate studies and verification of global operational wave forecasting systems; however, it is insufficiently investigated. The validation of altimeter significant wave heights (SWHs) with the wave buoy networks of China, Europe and the National Data Buoy Center (NDBC) show significant divergence in assessments. This reveals a negative bias and larger root mean square error and scatter index from the Chinese buoy network than from the European and NDBC buoy networks. A remote cross-calibration method is presented using the collocations between altimeters and buoys to match the buoy observations from different networks. The Chinese buoys are found to yield a negative bias of −0.127 m compared to European/NDBC buoy networks. The cross-calibration equation is achieved by regression of the SWHs between the Chinese and European/NDBC buoy networks. The use of this remote cross-calibration significantly reduces the inconsistency between the Chinese and European/NDBC buoys in the validation of SWH from altimeter HY2B. Full article
(This article belongs to the Section Ocean Remote Sensing)
Show Figures

Graphical abstract

26 pages, 77415 KiB  
Article
Thick Cloud Removal of Remote Sensing Images Using Temporal Smoothness and Sparsity Regularized Tensor Optimization
by Chenxi Duan, Jun Pan and Rui Li
Remote Sens. 2020, 12(20), 3446; https://doi.org/10.3390/rs12203446 - 20 Oct 2020
Cited by 25 | Viewed by 3453
Abstract
In remote sensing images, the presence of thick cloud accompanying shadow can affect the quality of subsequent processing and limit the scenarios of application. Hence, to make good use of such images, it is indispensable to remove the thick cloud and cloud shadow [...] Read more.
In remote sensing images, the presence of thick cloud accompanying shadow can affect the quality of subsequent processing and limit the scenarios of application. Hence, to make good use of such images, it is indispensable to remove the thick cloud and cloud shadow as well as recover the cloud-contaminated pixels. Generally, the thick cloud and cloud shadow element are not only sparse but also smooth along the spatial horizontal and vertical direction, while the clean element is smooth along the temporal direction. Guided by the above insight, a novel thick cloud removal method for remote sensing images based on temporal smoothness and sparsity regularized tensor optimization (TSSTO) is proposed in this paper. Firstly, the sparsity norm is utilized to boost the sparsity of the cloud and cloud shadow element, and unidirectional total variation (UTV) regularizers are applied to ensure the smoothness in different directions. Then, through thresholding, the cloud mask and the cloud shadow mask can be acquired and used to guide the substitution. Finally, the reference image is selected to reconstruct details of the repairing area. A series of experiments are conducted both on simulated and real cloud-contaminated images from different sensors and with different resolutions, and the results demonstrate the potential of the proposed TSSTO method for removing cloud and cloud shadow from both qualitative and quantitative viewpoints. Full article
(This article belongs to the Special Issue Remote Sensing Image Denoising, Restoration and Reconstruction)
Show Figures

Graphical abstract

23 pages, 7602 KiB  
Article
Understanding Ku-Band Ocean Radar Backscatter at Low Incidence Angles under Weak to Severe Wind Conditions by Comparison of Measurements and Models
by Qiushuang Yan, Chenqing Fan, Jie Zhang and Junmin Meng
Remote Sens. 2020, 12(20), 3445; https://doi.org/10.3390/rs12203445 - 20 Oct 2020
Cited by 3 | Viewed by 2185
Abstract
The rain-free normalized radar cross-section (NRCS) measurements from the Ku-band precipitation radars (PRs) aboard the tropical rainfall measuring mission (TRMM) and the global precipitation measurement (GPM) mission, along with simultaneous sea surface wind truth from buoy observations, stepped-frequency microwave radiometer (SFMR) measurements, and [...] Read more.
The rain-free normalized radar cross-section (NRCS) measurements from the Ku-band precipitation radars (PRs) aboard the tropical rainfall measuring mission (TRMM) and the global precipitation measurement (GPM) mission, along with simultaneous sea surface wind truth from buoy observations, stepped-frequency microwave radiometer (SFMR) measurements, and H*Wind analyses, are used to investigate the abilities of the quasi-specular scattering models, i.e., the physical optics model (PO) and the classical and improved geometrical optics models (GO and GO4), to reproduce the Ku-band NRCS at low incidence angles of 0–18° over the wind speed range of 0–45 m/s. On this basis, the limitations of the quasi-specular scattering theory and the effects of wave breaking are discussed. The results show that the return caused by quasi-specular reflection is affected significantly by the presence of background swell waves at low winds. At moderate wind speeds of 5–15 m/s, the NRCS is still dominated by the quasi-specular reflection, and the wave breaking starts to work but its contribution is very small, thus, the models are found in excellent agreement with the measurements. With wind speed increasing, the impact of wave breaking increases, whereas the role of standard quasi-specular reflection decreases. The wave breaking impact on NRCS is first visible at incidence angles near 18° as wind speed exceeds about 20 m/s, then it becomes dominant when wind speed exceeds about 37 m/s where the NRCS is insensitive to wind speed and depends linearly on incidence angle, which cannot be explained by the standard quasi-specular scattering theory. Full article
(This article belongs to the Section Ocean Remote Sensing)
Show Figures

Graphical abstract

18 pages, 2654 KiB  
Article
Towards DCS in the UV Spectral Range for Remote Sensing of Atmospheric Trace Gases
by Sandrine Galtier, Clément Pivard and Patrick Rairoux
Remote Sens. 2020, 12(20), 3444; https://doi.org/10.3390/rs12203444 - 20 Oct 2020
Cited by 16 | Viewed by 3037
Abstract
The development of increasingly sensitive and robust instruments and new methodologies are essential to improve our understanding of the Earth’s climate and air pollution. In this context, Dual-Comb spectroscopy (DCS) has been successfully demonstrated as a remote laser-based instrument to probe infrared absorbing [...] Read more.
The development of increasingly sensitive and robust instruments and new methodologies are essential to improve our understanding of the Earth’s climate and air pollution. In this context, Dual-Comb spectroscopy (DCS) has been successfully demonstrated as a remote laser-based instrument to probe infrared absorbing species such as greenhouse gases. We present here a study of the sensitivity of Dual-Comb spectroscopy to remotely monitor atmospheric gases focusing on molecules that absorb in the ultraviolet domain, where the most reactive molecules of the atmosphere (OH, HONO, BrO...) have their highest absorption cross-sections. We assess the achievable signal-to-noise ratio (SNR) and the corresponding minimum absorption sensitivity of DCS in the ultraviolet range. We propose a potential light source for remote sensing UV-DCS and discuss the degree of immunity of UV-DCS to atmospheric turbulences. We show that the characteristics of the currently available UV sources are compatible with the unambiguous identification of UV absorbing gases by UV-DCS. Full article
(This article belongs to the Special Issue Advances in Atmospheric Remote Sensing with Lidar)
Show Figures

Graphical abstract

28 pages, 29388 KiB  
Article
Glacier Ice Thickness Estimation and Future Lake Formation in Swiss Southwestern Alps—The Upper Rhône Catchment: A VOLTA Application
by Saeideh Gharehchahi, William H. M. James, Anshuman Bhardwaj, Jennifer L. R. Jensen, Lydia Sam, Thomas J. Ballinger and David R. Butler
Remote Sens. 2020, 12(20), 3443; https://doi.org/10.3390/rs12203443 - 20 Oct 2020
Cited by 15 | Viewed by 5795 | Correction
Abstract
Glacial lake formations are currently being observed in the majority of glacierized mountains in the world. Given the ongoing climate change and population increase, studying glacier ice thickness and bed topography is a necessity for understanding the erosive power of glacier activity in [...] Read more.
Glacial lake formations are currently being observed in the majority of glacierized mountains in the world. Given the ongoing climate change and population increase, studying glacier ice thickness and bed topography is a necessity for understanding the erosive power of glacier activity in the past and lake formation in the future. This study uses the available information to predict potential sites for future lake formation in the Upper Rhône catchment located in the Southwestern Swiss Alps. The study integrates the latest available glacier outlines and high-quality digital elevation models (DEMs) into the Volume and Topography Automation (VOLTA) model to estimate ice thickness within the extent of the glaciers. Unlike the previous ice thickness models, VOLTA calculates ice thickness distribution based on automatically-derived centerlines, while optimizing the model by including the valley side drag parameter in the force equation. In this study, a total ice volume of 37.17 ± 12.26 km3 (1σ) was estimated for the Upper Rhône catchment. The comparison of VOLTA performance indicates a stronger relationship between measured and predicted bedrock, confirming the less variability in VOLTA’s results (r2 ≈ 0.92) than Glacier Bed Topography (GlabTop) (r2 ≈ 0.82). Overall, the mean percentage of ice thickness error for all measured profiles in the Upper Rhône catchment is around ±22%, of which 28 out of 42 glaciers are underestimated. By incorporating the vertical accuracy of free-ice DEM, we could identify 171 overdeepenings. Among them, 100 sites have a high potential for future lake formation based on four morphological criteria. The visual evaluation of deglaciated areas also supports the robustness of the presented methodology, as 11 water bodies were already formed within the predicted overdeepenings. In the wake of changing global climate, such results highlight the importance of combined datasets and parameters for projecting the future glacial landscapes. The timely information on future glacial lake formation can equip planners with essential knowledge, not only for managing water resources and hazards, but also for understanding glacier dynamics, catchment ecology, and landscape evolution of high-mountain regions. Full article
(This article belongs to the Special Issue Applications of Remote Sensing in Glaciology)
Show Figures

Graphical abstract

18 pages, 9673 KiB  
Article
Ground Deformation and Its Causes in Abbottabad City, Pakistan from Sentinel-1A Data and MT-InSAR
by Naeem Shahzad, Xiaoli Ding, Songbo Wu and Hongyu Liang
Remote Sens. 2020, 12(20), 3442; https://doi.org/10.3390/rs12203442 - 20 Oct 2020
Cited by 11 | Viewed by 3846
Abstract
Land subsidence, as one of the engineering geological problems in the world, is generally caused by compression of unconsolidated strata due to natural or anthropogenic activities. We employed interferometric point target analysis (IPTA) as a multi-temporal interferometric synthetic aperture radar (MT-InSAR) technique on [...] Read more.
Land subsidence, as one of the engineering geological problems in the world, is generally caused by compression of unconsolidated strata due to natural or anthropogenic activities. We employed interferometric point target analysis (IPTA) as a multi-temporal interferometric synthetic aperture radar (MT-InSAR) technique on ascending and descending Sentinel-1A the terrain observation with progressive scans SAR (TOPSAR) images acquired between January 2015 and December 2018 to analyze the spatio-temporal distribution and cause of subsidence in Abbottabad City of Pakistan. The line of sight (LOS) average deformation velocities along ascending and descending orbits were decomposed into vertical velocity fields and compared with geological data, ground water pumping schemes, and precipitation data. The decomposed and averaged vertical velocity results showed significant subsidence in most of the urban areas in the city. The most severe subsidence was observed close to old Karakorum highway, where the subsidence rate varied up to −6.5 cm/year. The subsidence bowl profiles along W–E and S–N transects showed a relationship with the locations of some water pumping stations. The monitored LOS time series histories along an ascending orbit showed a close correlation with the rainfall during the investigation period. Comparative analysis of this uneven prominent subsidence with geological and precipitation data reflected that the subsidence in the Abbottabad city was mainly related to anthropogenic activities, overexploitation of water, and consolidation of soil layer. The study represents the first ever evidence of land subsidence and its causes in the region that will support the local government as well as decision and policy makers for better planning to overcome problems of overflowing drains, sewage system, littered roads/streets, and sinking land in the city. Full article
Show Figures

Graphical abstract

15 pages, 7684 KiB  
Article
Ground-based Assessment of Snowfall Detection over Land Using Polarimetric High Frequency Microwave Measurements
by Cezar Kongoli, Huan Meng, Jun Dong and Ralph Ferraro
Remote Sens. 2020, 12(20), 3441; https://doi.org/10.3390/rs12203441 - 20 Oct 2020
Cited by 2 | Viewed by 2416
Abstract
This paper explores the capability of high frequency microwave measurements at vertical and horizontal polarizations in detecting snowfall over land. Surface in-situ meteorological data were collected over Conterminous US during two winter seasons in 2014–2015 and 2015–2016. Statistical analysis of the in-situ data, [...] Read more.
This paper explores the capability of high frequency microwave measurements at vertical and horizontal polarizations in detecting snowfall over land. Surface in-situ meteorological data were collected over Conterminous US during two winter seasons in 2014–2015 and 2015–2016. Statistical analysis of the in-situ data, matched with Global Precipitation Measurement (GPM) Microwave Imager (GMI) measurements on board NASA/JAXA Core Observatory, showed that the polarization difference at 166 GHz had the highest correlation to measured snowfall rate compared to the single channel high frequency measurements and the polarization difference at 89 GHz. A logistic regression model applied to the match-up data, using the polarization difference at 166 and 89 GHz as predictors, yielded an overall snowfall classification rate of 69.0%, with the largest contribution coming from the polarization difference at 166 GHz. Logistic regression using the four single channels as predictors (at 89 and 166 GHz, horizontal and vertical polarizations) further indicated that the horizontal polarization at 166 GHz was the most important contributor. An overall classification rate of 73% was achieved by including the 183.31 ± 3 GHz and 183.31 ± 7 GHz vertical polarization channels in the final logistic regression model. Evaluation of the final algorithm demonstrated skill in snowfall detection of two significant events. Full article
(This article belongs to the Special Issue Satellite Hydrological Data Products and Their Applications)
Show Figures

Graphical abstract

11 pages, 3711 KiB  
Letter
(Quasi-)Real-Time Inversion of Airborne Time-Domain Electromagnetic Data via Artificial Neural Network
by Peng Bai, Giulio Vignoli, Andrea Viezzoli, Jouni Nevalainen and Giuseppina Vacca
Remote Sens. 2020, 12(20), 3440; https://doi.org/10.3390/rs12203440 - 20 Oct 2020
Cited by 33 | Viewed by 4297
Abstract
The possibility to have results very quickly after, or even during, the collection of electromagnetic data would be important, not only for quality check purposes, but also for adjusting the location of the proposed flight lines during an airborne time-domain acquisition. This kind [...] Read more.
The possibility to have results very quickly after, or even during, the collection of electromagnetic data would be important, not only for quality check purposes, but also for adjusting the location of the proposed flight lines during an airborne time-domain acquisition. This kind of readiness could have a large impact in terms of optimization of the Value of Information of the measurements to be acquired. In addition, the importance of having fast tools for retrieving resistivity models from airborne time-domain data is demonstrated by the fact that Conductivity-Depth Imaging methodologies are still the standard in mineral exploration. In fact, they are extremely computationally efficient, and, at the same time, they preserve a very high lateral resolution. For these reasons, they are often preferred to inversion strategies even if the latter approaches are generally more accurate in terms of proper reconstruction of the depth of the targets and of reliable retrieval of true resistivity values of the subsurface. In this research, we discuss a novel approach, based on neural network techniques, capable of retrieving resistivity models with a quality comparable with the inversion strategy, but in a fraction of the time. We demonstrate the advantages of the proposed novel approach on synthetic and field datasets. Full article
(This article belongs to the Section Remote Sensing Communications)
Show Figures

Graphical abstract

23 pages, 18200 KiB  
Article
Reconciling Flagging Strategies for Multi-Sensor Satellite Soil Moisture Climate Data Records
by Mendy van der Vliet, Robin van der Schalie, Nemesio Rodriguez-Fernandez, Andreas Colliander, Richard de Jeu, Wolfgang Preimesberger, Tracy Scanlon and Wouter Dorigo
Remote Sens. 2020, 12(20), 3439; https://doi.org/10.3390/rs12203439 - 20 Oct 2020
Cited by 7 | Viewed by 3368
Abstract
Reliable soil moisture retrievals from passive microwave satellite sensors are limited during certain conditions, e.g., snow coverage, radio-frequency interference, and dense vegetation. In these cases, the retrievals can be masked using flagging algorithms. Currently available single- and multi-sensor soil moisture products utilize different [...] Read more.
Reliable soil moisture retrievals from passive microwave satellite sensors are limited during certain conditions, e.g., snow coverage, radio-frequency interference, and dense vegetation. In these cases, the retrievals can be masked using flagging algorithms. Currently available single- and multi-sensor soil moisture products utilize different flagging approaches. However, a clear overview and comparison of these approaches and their impact on soil moisture data are still lacking. For long-term climate records such as the soil moisture products of the European Space Agency (ESA) Climate Change Initiative (CCI), the effect of any flagging inconsistency resulting from combining multiple sensor datasets is not yet understood. Therefore, the first objective of this study is to review the data flagging system that is used within multi-sensor ESA CCI soil moisture products as well as the flagging systems of two other soil moisture datasets from sensors that are also used for the ESA CCI soil moisture products: The level 3 Soil Moisture and Ocean Salinity (SMOS) and the Soil Moisture Active/Passive (SMAP). The SMOS and SMAP soil moisture flagging systems differ substantially in number and type of conditions considered, critical flags, and data source dependencies. The impact on the data availability of the different flagging systems were compared for the SMOS and SMAP soil moisture datasets. Major differences in data availability were observed globally, especially for northern high latitudes, mountainous regions, and equatorial latitudes (up to 37%, 33%, and 32% respectively) with large seasonal variability. These results highlight the importance of a consistent and well-performing approach that is applicable to all individual products used in long-term soil moisture data records. Consequently, the second objective of the present study is to design a consistent and model-independent flagging strategy to improve soil moisture climate records such as the ESA CCI products. As snow cover, ice, and frozen conditions were demonstrated to have the biggest impact on data availability, a uniform satellite driven flagging strategy was designed for these conditions and evaluated against two ground observation networks. The new flagging strategy demonstrated to be a robust flagging alternative when compared to the individual flagging strategies adopted by the SMOS and SMAP soil moisture datasets with a similar performance, but with the applicability to the entire ESA CCI time record without the use of modelled approximations. Full article
(This article belongs to the Section Remote Sensing in Geology, Geomorphology and Hydrology)
Show Figures

Graphical abstract

Previous Issue
Back to TopTop