1. Introduction
Instrument relative spectral response (RSR) characterization is an important element of pre-launch performance specification. Well-characterized spectral performance is critical to the reliable on-orbit operation of Earth-monitoring instruments, whether for routine measurements or for climate studies, and also lends confidence to radiometric calibration efforts and the products reliant on them [
1,
2]. The Clouds and the Earth’s Radiant Energy System (CERES) project, for instance, relies on RSR-dependent calibration adjustments and atmospheric transmissivity calculations to produce accurate cloud products for consistent flux measurements [
3,
4,
5,
6,
7]. As such, complete pre-launch evaluation of sensor geometric performance, including RSR co-registration and spatial response characterization, is a necessary requirement established to meet the goals of the remote sensing community [
8,
9,
10,
11,
12,
13]. Moeller et al. and Schwarting et al. conducted extensive laboratory RSR characterization efforts for the Visible Infrared Imaging Radiometer Suite (VIIRS) instrument series using Spectral Measurement Assembly (SpMA) and spherical integrating sphere (SIS) analyses. These laboratory instruments allowed for characterization of the full optical path and any optical or electronic cross talks for nearly all VIIRS bands [
1,
2,
14,
15,
16,
17,
18,
19].
Pre-launch, the VIIRS RSRs are specified by their band center, bandpass, extended bandpass, and out-of-band (OOB) response, which are determined from the complete integrated signal.
Figure 1 is a schematic recreated from several such figures of Moeller et al. and Schwarting et al. (e.g., “
Figure 1” in all listed Moeller et al. references) that illustrates the spectral performance specification metrics for VIIRS, in which the band center is the central wavelength between the 50% response-level bandpass bounds, and the extended bandpass is bound at 1% response levels with associated lower and upper wavelength (λ) thresholds, beyond which are the OOB regions [
1,
2,
16,
17,
18,
19]. Moeller et al. and Schwarting et al. conducted these characterization efforts for both the Suomi National Polar-Orbiting Partnership (S-NPP) VIIRS Government Team (GT, consisting of NASA, Aerospace Corp., MIT/Lincoln Lab, and Univ. Wisconsin) and industry (Northrop Grumman, NG) RSR products. The analysis was also performed for versions 1 and 2 (V1 and V2) of the first Joint Polar Satellite System (JPSS-1/NOAA-20) VIIRS RSRs, and V1 and V2 of the future JPSS-2 VIIRS RSRs. With laboratory measurements, they assessed spectral performance metrics with respect to their specified values, results of which are given in tables along with listed bandpass and extended bandpass limits [
1,
2,
16,
17,
18,
19].
Although the laboratory results are valuable, they cannot account for the highly varied spectral signatures measured by Earth-observing imagers because OOB contribution to the total scene radiance depends on the spectral shape of the at-sensor radiance. That is, it is difficult to tie the pre-launch spectral performance metrics to OOB behavior for specific Earth-viewed scenes. The OOB radiance signal is dependent on the Earth-reflected spectra and the extended bandpass specifications/measurements unique to each channel. The goal of this study is to quantify the OOB contribution to the total VIIRS signal as a function of instrument version, channel, extended bandpass definition, and Earth scene type. This knowledge is important for scene-dependent inter-calibration efforts, for environmental retrievals, and in regard to error consideration for cloud/aerosol property computations.
This article examines the VIIRS OOB contribution for the S-NPP VIIRS GT and NG RSR products, as well as the V2 releases of the NOAA-20 (V2.1 in the case of band M9) and JPSS-2 VIIRS RSRs. The reason both S-NPP VIIRS RSR products are studied is because despite the post-launch endorsement of the NG RSR release by the Government Team, the GT RSR release, which diverges from the NG RSR “primarily due to analysis differences that only affect the RSR at low response levels,” may still be of “investigative interest” to the remote sensing community as an “alternative high quality RSR” [
1,
2,
20]. For the NOAA-20 and JPSS-2 VIIRS, there is no distinction between GT and industry RSR releases because only the former carried out a pre-launch characterization effort [
17,
19,
21]. Users within the inter-calibration community and product teams that rely on VIIRS should find these results useful, even if only for assurance that OOB contribution is within acceptable tolerance for their specific application, which should often be the case especially for the newer VIIRS. Regardless, this work informs users on the impact of limiting spectral integration to published extended bandpass limits versus the full-band RSR for applications that rely on such techniques.
2. Data and Methodology
The Earth-view hyperspectral data used in this study were acquired from the Envisat Scanning Imaging Absorption Spectrometer for Atmospheric Chartography (SCIAMACHY) instrument for visible bands, and from the MetOp Infrared Atmospheric Sounding Interferometer (IASI) instrument for infrared (IR) bands [
22,
23,
24,
25]. Operating in a 10:00 AM local time sun-synchronous orbit, the SCIAMACHY instrument has a fine spectral resolution across eight channels covering 0.24–2.38 μm; however poor spectral quality in higher channels limits the usable wavelength upper range to ~1.75 μm. It has four 30 × 240 km
2 nadir fields of view (FOVs) divided along a 960 km swath with footprint-center viewing zenith angles (VZAs) ranging from ~7.5° to ~27.1°. The instrument performed daily solar irradiance measurements via a solar diffuser, remained stable over its lifetime of 1 March 2002–8 April 2012, and maintained an absolute on-orbit calibration accuracy of 2–6% [
22,
26,
27,
28]. The IASI instrument was the first operational interferometer in space measuring 3.6–15.5 μm across 8461 spectral bands with a spectral resolution of 0.5 cm
−1, has a 12 km FOV, and, operating on MetOp-A, has a local equator crossing time of 09:30 AM [
24,
25,
29]. The instrument has been relied upon by the Global Space-Based Inter-Calibration System (GSICS) international organization as an absolute calibration reference given the high confidence in IR hyperspectral sensor calibration and the capability of creating pseudo imager radiance signatures by convolving the hyperspectral data with imager RSRs. The imager-RSR-convolved IASI radiance values are used to radiometrically scale the imager to the IASI standard [
30,
31,
32,
33,
34,
35].
Many studies have employed RSR-integration techniques, involving either simulated or measured hyperspectral radiance information, for the purpose of spectral band adjustment factor (SBAF) computation. An SBAF is used to account for spectral differences between common instrument RSRs, which is an important step of the imager inter-calibration process [
36,
37,
38,
39,
40,
41,
42,
43]. The background and methodology of the specific SBAF computation pertinent to this work, which is dependent on measured Earth radiance spectra that are relevant to common inter-calibration techniques, were described in detail by Scarino et al. In short, pseudo radiance signatures for a reference and target satellite imager are computed by convolving many hyperspectral radiance footprints with the imager RSRs. A simple ratio of means or regression of the set of pseudo radiance pairs then constitutes the target/reference SBAF for the selected Earth scene. Therefore, applying the SBAF to the true reference radiance data will yield predicted target radiance data that are spectrally consistent with the true target radiance [
43]. An online tool (found through
https://satcorps.larc.nasa.gov or directly at
https://satcorps.larc.nasa.gov/SBAF) was developed to allow users to easily produce Earth-scene-specific SBAFs with the least uncertainty for their carefully chosen inter-calibration conditions [
43]. The tool has been recommended by GSICS and each month serves over 4000 requests from the international community.
This SBAF computation methodology was modified to allow for a simple assessment of the OOB contribution to the total signal [
43]. Instead of using distinct imagers for the pseudo radiance calculations, the same VIIRS RSR is used as both the reference and the target. The reference pseudo radiance values are integrated from either SCIAMACHY or IASI using the full-band VIIRS RSR (i.e., the extended bandpass plus OOB radiance
Ltotal), whereas the target pseudo radiance values are integrated only within the range of the extended bandpass (i.e., the in-band radiance
Lin). The OOB contribution is examined in terms of both the specified and measured lower and upper 1% extended bandpass limits for S-NPP VIIRS GT, S-NPP VIIRS NG, NOAA-20 VIIRS V2, and JPSS-2 VIIRS V2, which are provided by Moeller et al. and are also listed in
Table 1 [
1,
2,
17,
19].
Table 2 provides the version descriptions of the VIIRS RSR products used in this study. Note that in the case of S-NPP VIIRS RSR products, operational calibration of the VIIRS radiances does not employ either of the versions listed in
Table 2, but rather relies on Modulated RSR Release 1.0 [
44]. The impact of this discrepancy is discussed at length in
Section 4. The OOB contribution γ can be measured by the ratio of
Lin to
Ltotal, and then expressed as a percentage as follows:
Values of γ close to 0 suggest minimal OOB contribution for the evaluated scene type. Note that Moeller et al. define a maximum integrated out-of-band (MIOOB) response, described as the ratio of integrated out-of-band response to integrated in-band response, which is formulaically different than Equation (1) but leads to similar conclusions [
17].
It should be acknowledged that examination of OOB contribution with respect to the specified 1% extended bandpass limits is inherently contradictory, given that OOB is only defined in terms of the true measured limits. That is, because specified limits are provided by the manufacturer before the instrument is built, true determination of the 1% response levels is inseparable from physical measurements. Therefore, it should be recognized that, in this paper, any OOB contribution that is said to be examined based on specified 1% extended bandpass limits in fact necessarily relies on measured response values that are inside of the specified lower and upper bounds. In other words, regardless of the actual response value associated with the specified limits, measured values within those limits are treated as part of the in-band region. Thus, the “1%” designation of the specified extended bandpass is in name only, and actual response levels for specified OOB contribution cases are less than 1%, which contradicts the OOB definition. As a result, examinations offered in this manuscript that are in terms of specified limits should be considered theoretical. The value of such examinations is in understanding the sensitivity of γ to a narrower set of response limits that signify a theoretical, alternative definition of OOB, provided it is understood that the results of specified limit examinations are inherently biased and serve only as a reference for relative interpretation. That is, this view fosters a means for analysis that allows one to visualize OOB signals with respect to different sets of limits, which is a way of illustrating how energy contributions within or outside of a defined extended bandpass change the integrated radiances
Lin and
Ltotal—a technique that is used in
Section 4. To this end, testing with the limit values of the published specified 1% extended bandpass rather than some other arbitrary set of limits is a matter of convenience, and also reflects the presentation structure of the works of Moeller et al. and Schwarting et al., which offered the inspiration for this effort [
1,
2,
16,
17,
18,
19].
No VIIRS data, aside from RSR information, are used in this study. All
Lin and
Ltotal data are based on integrated hyperspectral radiance measurements. For solar reflective bands, the average OOB contribution
is determined from RSR-integrated SCIAMACHY Level-1b Version-7.03 radiances from August 2002 through December 2010, where
and
are the mean values of hundreds to thousands (depending on the scene) of pseudo radiance pairs computed for each scene-relevant footprint:
The solar reflective bands include I-bands I1–I3, M-bands M1–M10, and Day/Night Band (DNB) mid (MGS) and high (HGS) gain stages (where applicable). Band M11, with a central wavelength near 2.25 µm, is not evaluated due to poor SCIAMACHY spectral calibration quality [
28]. Note that the S-NPP VIIRS DNB contribution is not investigated in this study owing to the absence of associated measured 1% extended bandpass limits [
1,
2]. A flowchart of the complete
determination methodology is given in
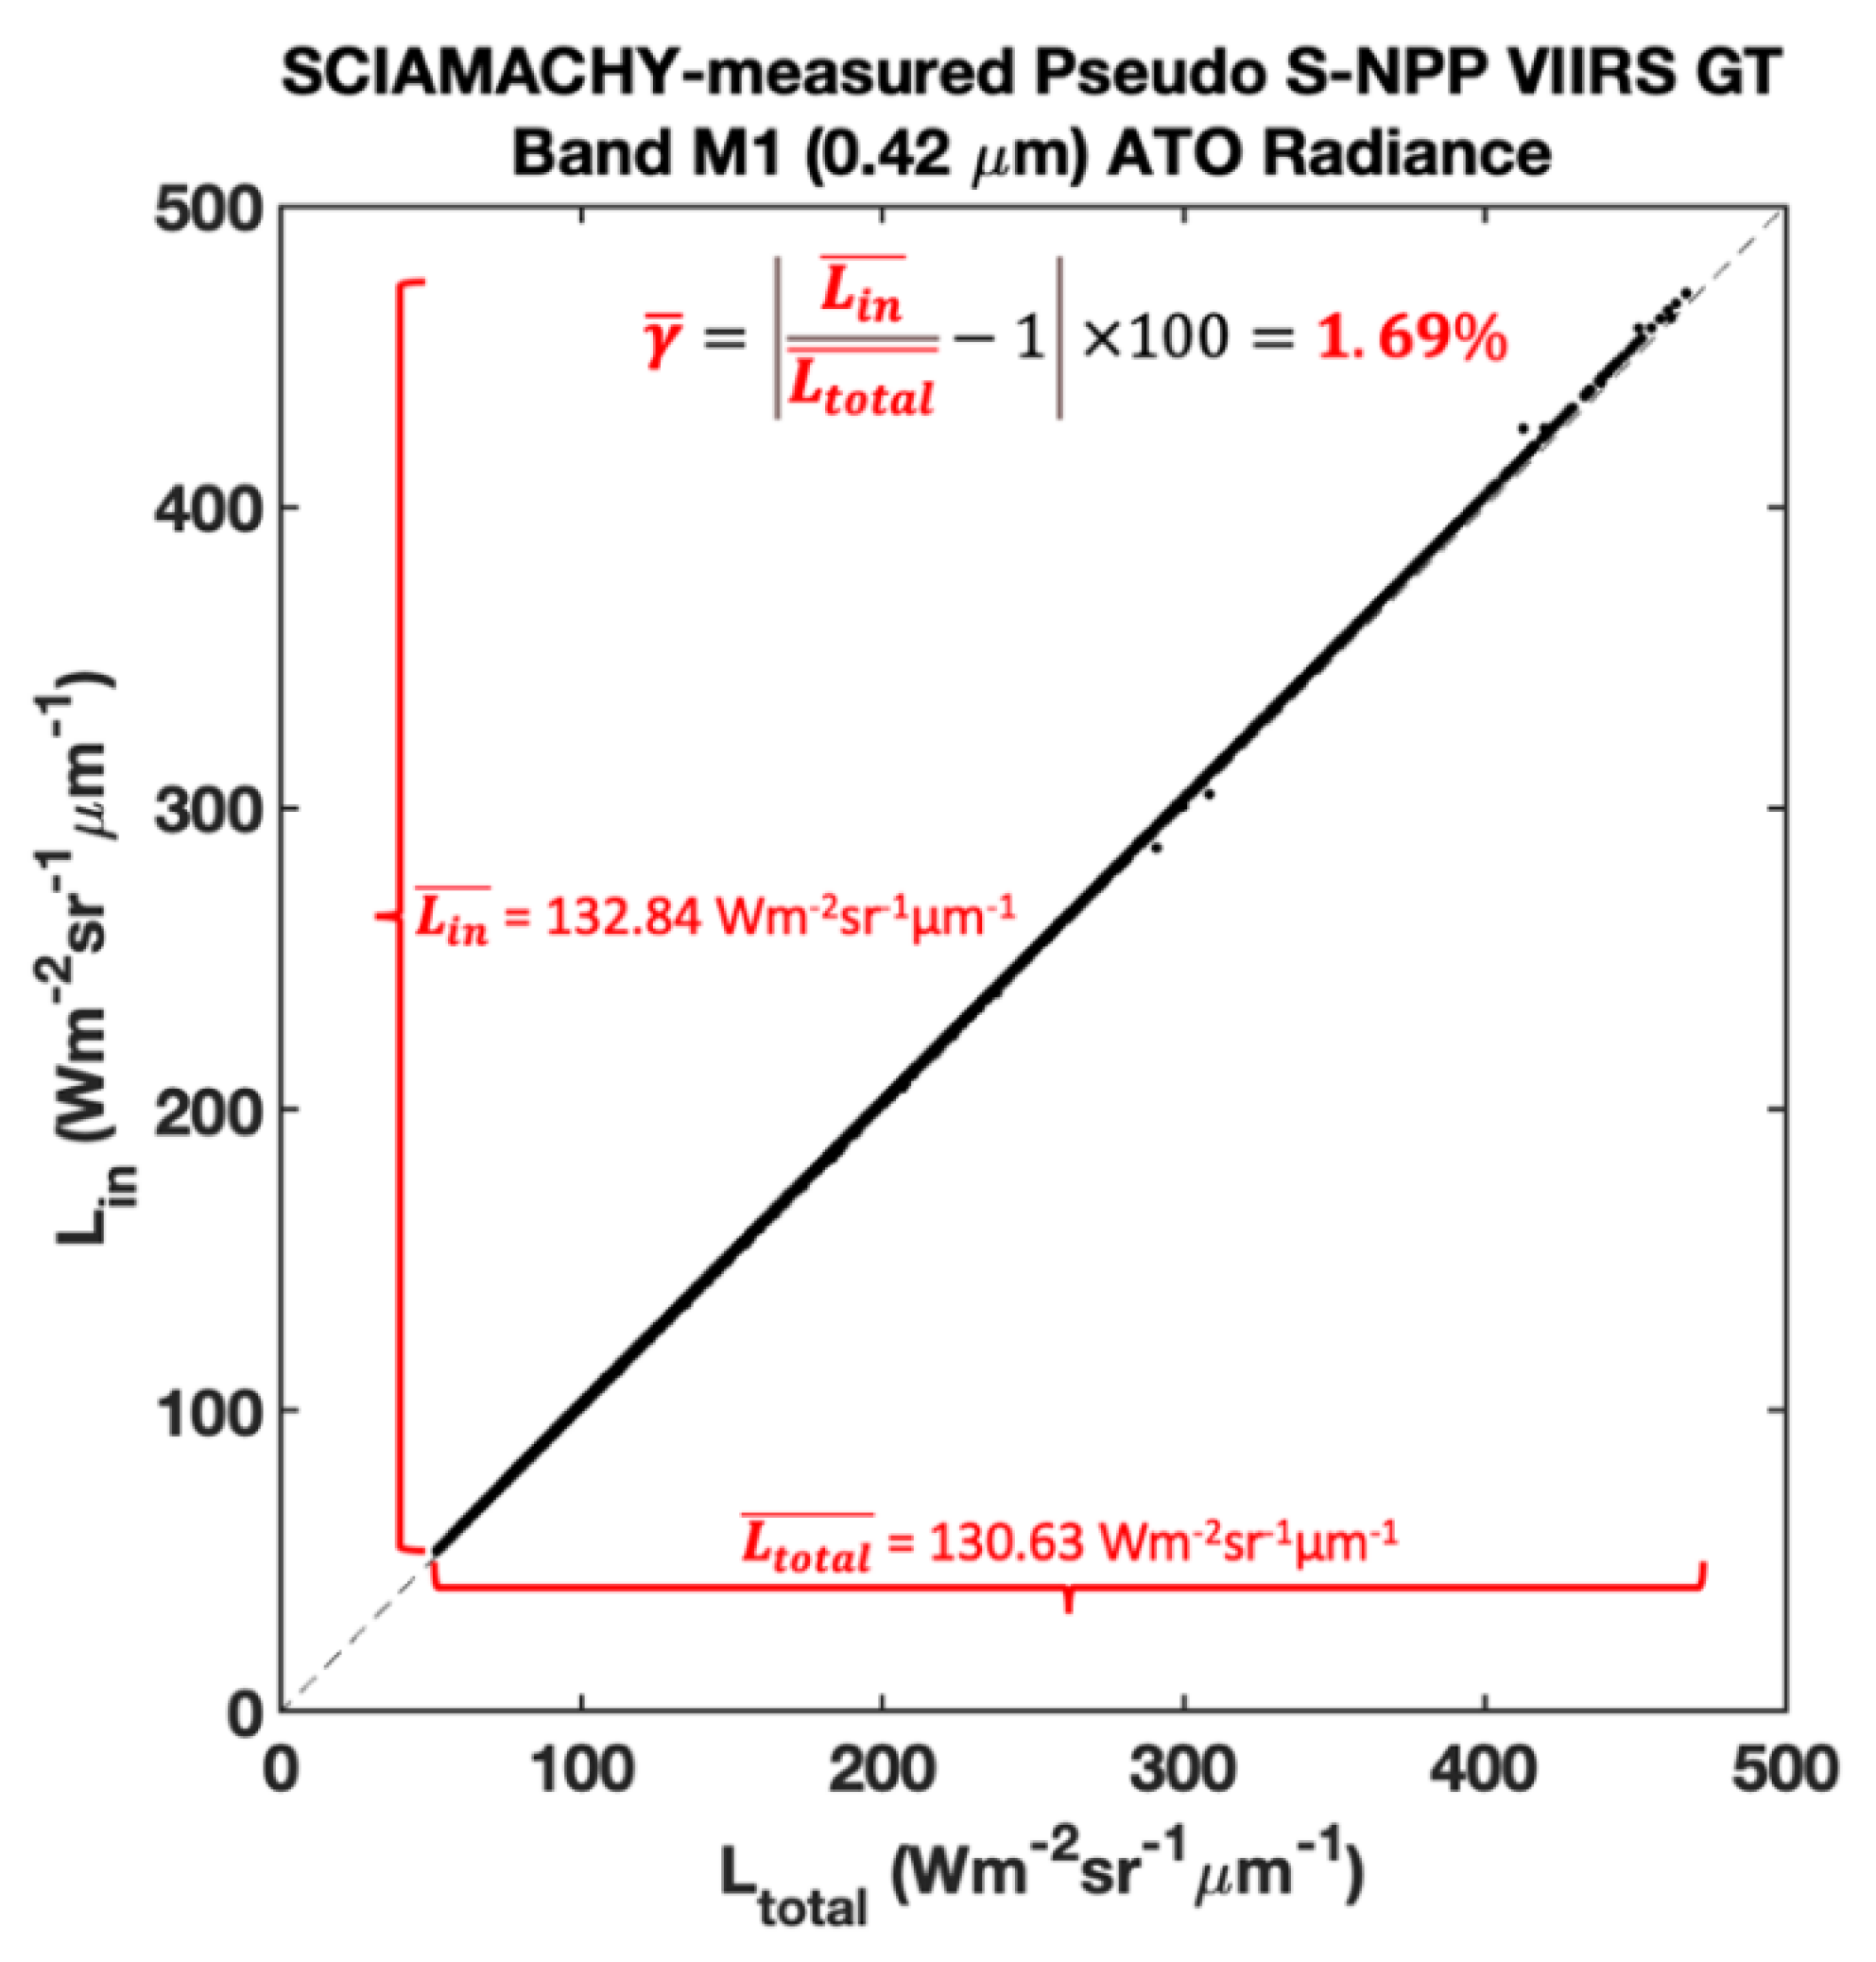
Figure 2. Alternatively,
Figure 3 is a notated scatter plot of pseudo radiance
Li/
Ltotal pairs that illustrates
determination for an all-sky tropical ocean (ATO) scene.
and
are the y-axis and x-axis averaged datapoints, respectively, the ratio of which is equal to the slope of a linear regression that is forced through the origin. The linear nature of the scatter datapoints is expected for comparable Earth-scene spectra given the rather subtle difference between in-band and full-band RSR structure, which is found to be true for all scenes investigated in this study. That is, the small difference in signal contribution between in-band and full-band RSR integration, which this study aims to quantify, can be expressed as a constant value for the given scene type, with small uncertainty.
Eleven Earth-reflected scene types were evaluated, which are based on the distinct spectra offerings of the SBAF tool [
43]. The scenes include deep convective clouds (DCC), ATO, clear-sky tropical ocean (CTO), the Libya-4 Pseudo Invariant Calibration Site (Lib-4 PICS) the Uyuni Salt Flats, and six land classifications defined by the International Geosphere–Biosphere Programme (IGBP) [
45]. The Forest classification consists of IGBP IDs 1–5, Shrubland consist of IDs 6 and 7, Woodland is ID 8, Grassland consists of IDs 9 and 10, Wetland is ID 11, and Cropland consists of IDs 12 and 14. These classification groupings are based on approximate spectral similarity as relevant to OOB contribution assessment, which was determined empirically. Any remaining, unused IGBP IDs are either redundant with already considered scenes, or there was an insufficient number of SCIAMACHY measurements for that land type given the large FOV size. Accurate representation of the identified IGBP type by the SCIAMACHY footprint is ensured by requiring that the center and all four corners of the 30 × 240 km
2 SCIAMACHY FOV be of the same ID. Note that Bhatt et al. showed that the large size of the SCIAMACHY footprint does accurately represent the spectra of the Lib-4 PICS by comparing the influence of an SBAF determined using the Lib-4 PICS boundaries to that from a Libyan Desert PICS one-third the original Lib-4 size. They found the spectral radiance difference between the two Libyan Desert domains to be less than 0.6%, indicating minimal impact from the spatial disparity [
43,
45].
For IR bands,
was determined from footprint-mean
and
using IASI Level-1c radiances acquired from the NOAA Comprehensive Large Array-Data Stewardship System (CLASS) archive, based on the combined time periods of January, April, July, and October 2008. The evaluated bands include I-bands I4–I5 and M-bands M12–M16, where M16 is separated into time-delay-integrated bands M16A and M16B [
11,
46,
47,
48]. Rather than by scene type, IR
evaluation is separated by thermal infrared brightness temperature (IR BT) based on the integration of IASI hyperspectral radiance over the Aqua MODIS 11-μm band (band 31), that is then converted to temperature using the Planck function and the Aqua MODIS band 31 central wavelength (11.02 μm). The average OOB contribution is assessed for measurements with MODIS-integrated IASI IR BT that is less than 205 K and greater than 295 K, as well as the full dynamic range (FDR). The remote sensing calibration community should find the described method effective for scene-specific evaluation of OOB contribution to total signal, which is possible to perform pre-launch.
3. Results
Table 3,
Table 4,
Table 5,
Table 6,
Table 7,
Table 8,
Table 9 and
Table 10 summarize the SCIAMACHY-based Earth-reflected radiance scene-specific
results for solar reflective bands within the reliable SCIAMACHY hyperspectral range of 0.24–1.75 µm, dependent on the selected RSR characterization versions of each VIIRS instrument. The tables are separated by instrument and version, and also by whether OOB contribution is evaluated using specified or measured lower and upper 1% extended bandpass limits [
1,
2,
17,
18]. For example,
Table 3 presents results for S-NPP VIIRS GT RSR characterization for specified 1% extended bandpass limits, and
Table 4 shows the same for measured 1% extended bandpass limits. Results for S-NPP VIIRS NG, NOAA-20 V2, and JPSS-2 V2 RSR characterization follow in the same manner. Entries in each table with bold text signify
of at least 0.5%. This somewhat arbitrary 0.5% significance level was chosen loosely based on unofficial practices of the CERES Imager and Geostationary Calibration Group (IGCG) to achieve inter-calibration consistency that is better than 0.5%. It is a threshold that works well for this study in exemplifying the relative performance of the different VIIRS instruments with regard to
.
The cause of the scene-dependent variation in
can be interpreted from visualization of the selected RSR, with its associated lower and upper 1% extended bandpass boundaries, overlaid with hyperspectral radiance spectra of the various Earth scenes. Such visualizations have been prepared as
Figure 4,
Figure 5 and
Figure 6. For example,
Figure 4 highlights the significant OOB signal of the S-NPP VIIRS M1 (~0.42 μm) band, in this case based on the NG RSR characterization effort, and how that might respond to the Earth-reflected spectra of common inter-calibration targets like DCC, ATO, CTO, and the Lib-4 PICS.
Figure 5 reveals scene-dependent
behavior for the S-NPP VIIRS NG M5 (~0.67 μm) band, which is an important spectral channel for inter-calibration and parameterization efforts [
6,
7,
49]. As seen in
Table 7,
Table 8,
Table 9 and
Table 10, only the M9 (~1.38 μm) bands offer
values in exceedance of 0.5% for both NOAA-20 and JPSS-2, the nature of which can be evaluated in
Figure 6 for select scenes.
Table 11 shows the IASI-based Earth-emitted and Earth-reflected radiance scene-specific
values for VIIRS bands with central wavelengths greater than 3.6 µm, dependent on the selected RSR characterization versions of each VIIRS instrument. Note that the Earth-reflected contribution is only relevant for the mid-wave IR (~3–4 µm) bands I4 (~3.74 μm), M12 (~3.69 μm), and M13 (~4.06 μm) during daytime. The “<205 K” and “>295 K” columns signify
results for IASI footprints in which the Aqua MODIS 11-μm band-integrated (i.e., band 31) IASI IR BT is greater than or less than the indicated value, such as to separate evaluation based on Earth-emitted temperature. The column label “FDR” signifies that the full dynamic range of IASI measurements was considered, i.e., without any BT-based truncation. The associated
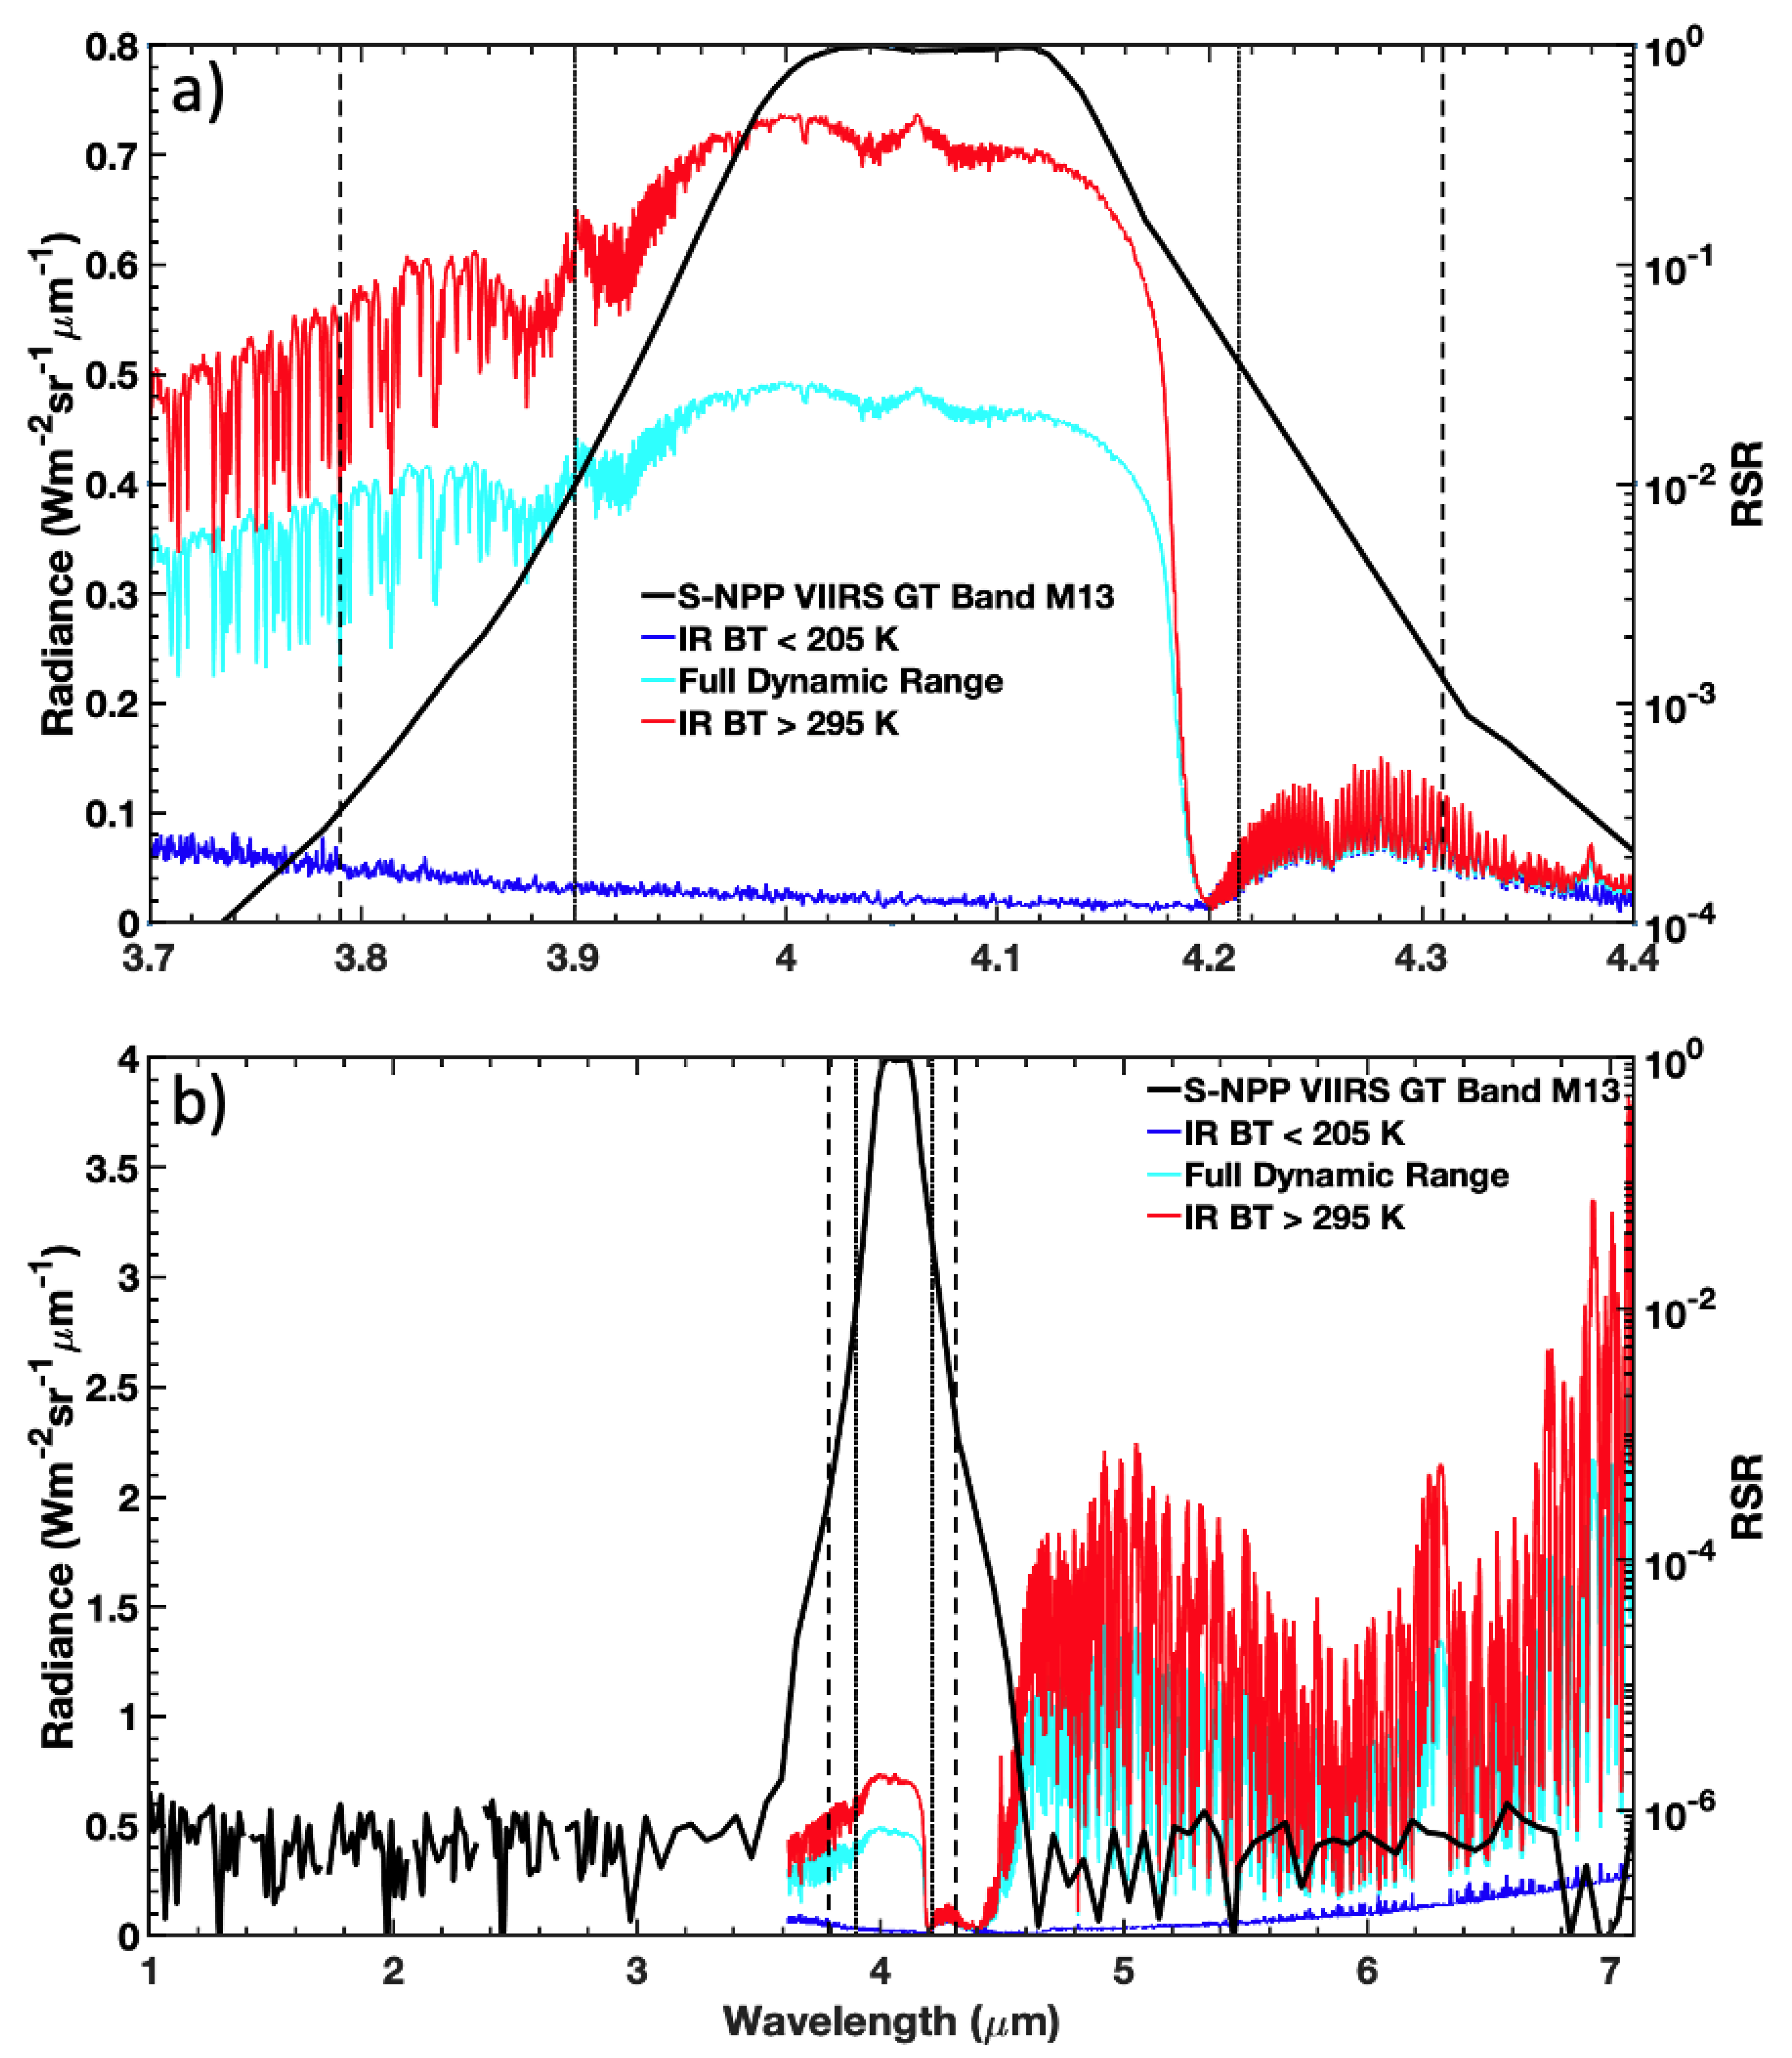
Figure 7a highlights the OOB signal of the S-NPP VIIRS GT band M13 RSR, and how the impact of in-band vs. OOB magnitude can change depending on scene temperature.
Figure 7a allows for close analysis of the in-band measurement range, whereas
Figure 7b uses alternative axes scaling limits in order to grant full view of the band M13 OOB measurement range.
Table 12 summarizes
for VIIRS mid-wave IR bands I4, M12, and M13 based on measured 1% extended bandpass limits, separated by day and night IASI measurements. As in
Table 11, Aqua MODIS 11-μm band-integrated IASI IR BT limits are also considered. With an overall smaller magnitude compared to
Figure 7a,
Figure 8a reveals the nighttime-only, temperature-dependent Earth-emitted radiance spectra with JPSS-2 VIIRS V2 band M13 RSR and extended bandpass limit information overlaid. Even though the JPSS-2 VIIRS V2 band M13 OOB measurement range is significantly narrower than that of S-NPP VIIRS GT,
Figure 8b offers the same rescaled view as that of
Figure 7b for the sake of comparison.
4. Discussion
The overall magnitude of OOB Earth-scene-dependent radiance contribution is much more significant for the S-NPP VIIRS instrument compared to the later NOAA-20 and JPSS-2 sensors. This finding is true for solar reflective bands and IR bands, as evidenced by the greater frequency of bold table entries, which signify
of 0.5% or greater, for S-NPP compared to the other platforms. For example, the S-NPP VIIRS GT and NG characterization versions have six solar reflective bands with
of at least 0.5% for at least one scene type (although up to ten scene types for a single band in case of NG band M1), based on measured lower and upper 1% extended bandpass limits (
Table 4,
Table 6). For NOAA-20 and JPSS-2 VIIRS V2 characterization, by comparison, only solar reflective band M9 exhibits
of at least 0.5%, in this case across six (NOAA-20) or eight (JPSS-2) scenes based on measured extended bandpass limits (
Table 8,
Table 10). Finally, although overall
magnitudes for NOAA-20 and JPSS-2 VIIRS are small compared to those of S-NPP VIIRS (also including where
does not exceed 0.5%), the largest OOB contribution is found for JPSS-2 VIIRS V2 band M9 over the Lib-4 PICS, with a magnitude of 5.70% (5.66%) based on measured (specified) extended bandpass limits (
Table 9 and
Table 10). The smallest
for this band and scene is that of S-NPP VIIRS GT, with a magnitude of 1.27% (1.23%) for measured (specified) extended bandpass limits, which is still a rather significant OOB influence (
Table 3 and
Table 4). The reason
values are notably large for this band is related to the low spectral signal at these wavelengths (~1.38 μm).
The cause of the larger S-NPP VIIRS band M1
values across most scene types can be interpreted from
Figure 4. In this figure, significant OOB response is observed up to a wavelength of nearly 1.0 μm, with the maximum OOB response peak exceeding 0.01 twice near 0.8 μm. By comparison, maximum OOB response for NOAA-20 and JPSS-2 VIIRS V2 band M1 is ~0.0006, with fewer OOB response peaks beyond 0.5 μm (not shown). Of the four selected scenes of
Figure 4, the greatest OOB influence occurs for CTO, the darkest scene having a maximum
of ~2.2%, whereas the least influence occurs for the for DCC and Lib-4, the brightest scenes having
values of ~0.9–1.0% (
Table 5 and
Table 6). It is intuitive that darker scenes are most influenced by OOB radiance contribution given that even minimal additional OOB energy measured by the sensor is significant compared to the already low signal of the in-band measurement. That is, a low signal is susceptible to noise. This concept does not discount the importance of OOB consideration for bright scenes, however, as evident by the ~1.0%
values. Furthermore, the fact that S-NPP VIIRS band M1
values for CTO and DCC each differ from that for ATO (
Table 3,
Table 4,
Table 5 and
Table 6) suggests that ATO OOB contribution is not strictly represented by a constant factor (as otherwise suggested in
Figure 3), but rather is sensitive to the radiance magnitude and the changing spectral composition of the scene. Nevertheless, ATO retrieval applications, such as those used for CERES calibration, are designed to accommodate average conditions with an acceptable level of uncertainty, and therefore the ATO average OOB contribution as given is appropriate, especially because the ATO
value is, as expected, found to be roughly the average of that for CTO and DCC [
49].
Even though
results based on the specified 1% extended bandpass considerations should not be treated as absolute, but rather are theoretical as previously discussed in
Section 2, their examination provides a point of reference that helps illustrate how energy contributions relative to varying OOB definitions affect integrated radiance. Thereby it is interesting to note that if considering specified 1% extended bandpass limits, Lib-4
exceeds that of DCC by 0.07%, with Lib-4 at 0.97% and DCC at 0.90% (
Table 5). For measured extended bandpass limits, however, the
are within 0.01%, with Lib-4 at 0.93% and DCC at 0.94% (
Table 6). In other words, between the use of measured limits to specified limits, an increase in OOB radiance contribution of 0.04% is observed for DCC. This increase is owed to the greater values of integrated radiance allowed by the further extension of the specified limit in the increasing-wavelength direction from the central wavelength of ~0.42 μm (
Figure 4). That is, the greater integrated radiance allowed by the specified extended bandpass limits results in better agreement with the integrated contribution from OOB response at high wavelengths, and thus
based on the specified extended bandpass limits is less than that based on the measured limits. Similarly, a decrease in OOB radiance contribution of 0.04% is observed for Lib-4, going from specified to measured limits. In this case, the further extension of the specified limit allows for more integration of low radiance values at ultraviolet (UV) wavelengths of less than 0.4 μm compared to that for the measured limits. This additional integration of low UV-reflected radiance in part offsets the integrated radiance gained at the higher OOB wavelengths, which results in a larger
for specified 1% extended bandpass limits compared to that of measured limits.
For Earth-monitoring efforts like CERES, satellite records must be combined seamlessly in order to avoid discontinuities in retrievals that arise from either radiometric scaling errors or varying algorithm assumptions. Therefore, it is important to particularly examine the average OOB contribution for the I1 (~0.64 μm) and M5 bands given the historic and continued proliferation of similar channels on Earth-observing imagers and their importance to inter-calibration and cloud parameterization efforts [
6,
7,
49]. Scene-dependent
significance should, it appears, generally not be a concern for the NOAA-20 and JPSS-2 VIIRS instruments in these bands (
Table 7,
Table 8,
Table 9 and
Table 10). For S-NPP VIIRS, OOB contributions are also similarly minimal for band I1, with maximum magnitudes of ~0.2% for CTO and Forest scene types. Although these values could be significant in any application that relies exclusively on such views, the effect is mitigated when radiance contribution from these scenes is combined with other scenes likely found within the instrument FOV, e.g., CERES inter-calibration relies on ATO rather than CTO. Note that in some cases, CERES inter-calibration and other applications do rely on a single scene, such as DCC [
49,
50,
51,
52]. Fortunately, OOB contributions in band I1 and M5 are minimal in such a case. Nevertheless, it is advisable that CERES applications of VIIRS measurements consider the full-band RSR when inter-calibrating or for other applications in which spectral integration is necessary, e.g., atmospheric transmissivity determinations [
3].
Although the I1 band appears to be relatively unimpacted by scene-dependent OOB contribution, the S-NPP VIIRS M5 band does exhibit rather large
for ocean and vegetative scene types. In
Figure 5, the S-NPP VIIRS NG M5 band is examined particularly with CTO (~0.5%) and Forest (~2%) given that CTO is a subset of ATO, which is relied upon in CERES inter-calibration, and Forest has the largest
value of all M5 band scene assessments. Even though the OOB response for M5 does not reach the magnitude of that for M1, the response coupled with relatively high CTO radiance values near ~0.42–0.50 μm results in 0.5% OOB contribution, even considering counter-acting OOB contribution from measurements at wavelengths greater than the upper 1% extended bandpass limit. In the case of Forest spectra, the M5 in-band contributions are situated within in a relative minimum, i.e., a spectral “valley,” compared to immediate lower and higher wavelength ranges. As such, OOB integrated radiance contribution is compounded by strong signals on either side of the central wavelength with comparable response on the order of about 0.001. How this average OOB contribution might influence environmental retrievals can be examined through normalized difference vegetation index (NDVI) determinations, which are calculated from visible (VIS: ~0.65 μm) and near infrared (NIR: ~0.86 μm) radiance measurement ratios [NDVI = (NIR − VIS)/(NIR + VIS)] [
53,
54,
55,
56]. When considering measured 1% extended bandpass limits (
Table 6), the S-NPP VIIRS NG bands M5 and M7 (~0.86 μm) 1.97% and 0.15%, respectively, OOB contributions would amount to less than a 1% change in NDVI for a rough median value of measured Forest radiance (i.e., ~24 Wm
−2sr
−1μm
−1 for VIS and ~55 Wm
−2sr
−1μm
−1 for NIR). The influence is small, but if relying on S-NPP VIIRS for NDVI determination, bands I1 and I2 (~0.86 μm) should be favored over the comparable M-bands when considering OOB-contributed error, because any reduction in contrast between the VIS and NIR bands owing to the OOB signal is undesirable. Although these OOB effects may only rarely require consideration within specialized, environmental retrieval subsets of the remote sensing community, there is, nonetheless, value to be found in improved understanding of scene-specific OOB contribution to the total signal, especially with regard to pre-launch evaluation.
It is interesting to note that despite the prominence of significant OOB contribution across many S-NPP VIIRS bands and scene types, band-specific behaviors, in terms of overall
for different targets, do not necessarily reflect the performance metric findings of the Moeller et al. measured MIOOB analyses. Although
and MIOOB are not equivalent metrics, there is value, nevertheless, in acknowledging how failed specification as determined by measured MIOOB assessment, i.e., designated as out-of-specification in Moeller et al.’s
Table 6, relates to the scene-dependent OOB contribution results presented in this manuscript [
2]. As an example, of the VIS/NIR bands (i.e., M1–M7, I1, and I2) the overall highest MIOOB values are found for band M4 (~0.55 μm) at 3.80% and 3.65% for the S-NPP VIIRS GT and NG RSR products, respectively. In terms of
, however, OOB effects in the M4 band remain consistently low (in a relative sense) across all scene types for both S-NPP VIIRS GT and NG. Conversely, whereas band M2 (~0.44 μm) measured MIOOB metrics meet specification for both S-NPP VIIRS RSR products,
for this band exceeds the chosen 0.5% significance level for five scenes in the case of the GT RSR product, and for one scene in the case of the NG RSR product (
Table 4,
Table 6). Again, MIOOB and
magnitudes are not directly comparable, but from a relative perspective, these findings support the idea that, with regard to performance specification, there is value in the scene-dependent evaluation of OOB contribution, knowledge of which complements the understanding of MIOOB metrics.
Before continuing with a closer examination of the NOAA-20 and JPSS-2 VIIRS and IR band results, it should be acknowledged that strong, spectrally dependent degradation in the S-NPP VIIRS mirror reflectance has modulated the VIIRS RSRs in the solar reflective bands, which prompted the generation and release of degradation modulated S-NPP VIIRS RSRs by the NASA VIIRS Characterization Support Team (VCST). The modulated RSRs have been used for operational sensor data record production since 5 April 2013 [
15,
44,
57,
58]. In order to assess the impact of a modulated RSR with regard to OOB contribution,
was evaluated for the eleven Earth-reflected scene types using band M1, which of all bands is predicted to have the largest radiance error after the four VIIRS mirrors are completely degraded [
14]. The evaluation is based on the measured 1% extended bandpass limits of the S-NPP-VIIRS NG spectral performance characterization effort, because the VCST used the NG product as the baseline RSR in coming up with the modulated RSR [
2,
44]. On average, use of the M1 modulated RSR reduced scene-dependent
by 25% of the original
Table 6 values (ranging from 14% for Lib-4 to 50% for Shrubland). These percentages translate to an average reduction in
magnitude of 0.22% (ranging from 0.07% for Shrubland to 0.50% for CTO). Shrubland has both the largest percentage reduction and the smallest magnitude reduction owing to its initially small
value of 0.14 (
Table 6). Overall, these are significant reductions, which demonstrate the benefit of the modulated RSR in terms of
. Nevertheless, even with this reduction in
across all evaluated scenes, only two of the ten categories that initially had a
value above the 0.5% significance level fell below that threshold when using the modulated RSR (i.e., Uyuni, which dropped from 0.50% to 0.35%, and Grassland, which dropped from 0.58% to 0.44%). Therefore, given that the Moeller et al. published extended bandpass limits predate formulation of the modulated RSRs, and because the M1 band is the most influenced by the mirror degradation, further examination of the remaining bands is left for future efforts. The M1 band results suggest that scenes with the most influence from OOB contribution still remain significantly affected even with this update to the operational RSR, and lesser impact from the modulated RSR implementation is expected for the other bands [
15].
Although NOAA-20 and JPSS-2 VIIRS V2 average OOB contribution is largely better than that of S-NPP VIIRS,
Figure 6 offers close examination of the band M9 exception. For either VIIRS, the in-band integrated radiance for Lib-4 spectra is on the order of 0.6 Wm
−2sr
−1μm
−1, and less than that for Forest and CTO scenes. Given such a small in-band signal, it is intuitive that even minimal OOB energy contribution could have a significant impact on the radiance measurement, especially if that OOB contribution occurs at wavelengths with substantially more energy. This is exactly the case for JPSS-2 VIIRS V2, for which a relatively small (~0.0001) OOB peak at ~1.24 μm can amount to over 5% in OOB radiance signal for the Lib-4 PICS. Furthermore, because CTO, Forest, Shrubland, Woodland, Grassland, Wetland, and Cropland share a similar spectral signature with regard to a low signal near ~1.38 μm and an increased signal near ~1.24 μm, their respective
values are also high, although not as high as that for Lib-4. This substantial signal-to-noise sensitivity for ~1.38 μm bands favors high cloud detection, which is why CERES inter-calibration efforts cannot use PICS methods for such imager channels, and instead employ DCC-based calibration techniques to characterize the signal at a much higher magnitude near ~50 Wm
−2sr
−1μm
−1 [
51]. Finally, although NOAA-20 VIIRS does not have the same OOB peak near ~1.24 μm as JPSS-2 VIIRS has, it does, nevertheless, have a strong OOB signal just outside the lower specified 1% extended bandpass limit, which coincides with the rapid increase in the Lib-4 (as well as other scenes) radiance spectral signature. Additionally, compared to JPSS-2, NOAA-20 VIIRS has a stronger OOB signal beyond 1.6 μm, although at a rather weak response of less than 10
−5. Albeit not as severe as the JPSS-2 VIIRS case, the small leak beyond the extended bandpass combined with the heightened OOB signal in the 1.6–1.75 μm range (shown only up to the range of 1.7 μm in
Figure 6) is enough to cause significantly more than 1% in OOB radiance contribution to the imager measurement.
For VIIRS IR bands, with each instrument except for that on JPSS-2, a significant OOB influence of at least 0.5% is found only for band M13, especially for cold scenes, i.e., ~11-μm IR BT IASI footprint values smaller than 205 K (
Table 11). The cause once again is due to a low in-band radiance signal (especially for cold measurements) being dominated by OOB leaks at high relative energy, which can be interpreted from
Figure 7a following previously described analysis methods. In short, a significant portion of the OOB contribution is sourced from the energy in the wavelength range between the M13 specified and measured 1% extended bandpass limits, as evidenced by the at least 0.55% difference in
for all three BT ranges, with all
for the specified column being 0.09% or less (
Table 11). The energy contribution from outside of this in-band-focused view of S-NPP VIIRS GT band M13 is insignificant. Nevertheless, a broader view of the complete OOB signal is given in
Figure 7b, with x-axis limits based on the published OOB measurement range of 1000–7096 nm [
1]. The RSR axis (right y-axis) lower limit has been extended from 10
−4 to 10
−7 in order to fit the band M13 response. The amount of
sourced from this level of response, even for the relatively broad wavelength range covered and considering the higher values of integrated radiance compared to those of the in-band region, is small relative to the impact of OOB contribution from the higher response regions nearer to the extended bandpass limits, as discussed above. Specifically,
based on integration starting at 4.4 μm (a relative radiance minimum) and ending at the upper OOB measurement range amounts to less than 0.006% for all three BT ranges.
The fact that M13 is a mid-wave IR band suggests there could be a diurnal dependency owed to a daytime solar contribution. This idea is explored in
Table 12 for all mid-wave IR bands, in which significantly greater
values are found for nighttime measurements due to the overall decrease in energy at night, again with most significance for the coldest measurements. Daytime
values are expectedly smaller in magnitude than those for the combined day and night analysis of
Table 11, and although no additional bands, regardless of temperature, exceed the chosen 0.5%
significance level at night, neither do previously significant bands drop below the 0.5%
level during the day.
Figure 8a not only reveals a significantly smaller in-band radiance for IR BT < 205 K, which is the cause of the 5.71%
level for S-NPP VIIRS GT at night, but also offers evidence as to why these effects are not observed for JPSS-2 VIIRS V2. For S-NPP VIIRS GT, the measured upper 1% extended bandpass limit is at 4.2137 μm, which is near where the radiance signal begins to increase and the RSR is relatively strong. For JPSS-2 VIIRS V2, the measured upper 1% extended bandpass limit is at 4.171 μm, which is short of the signal increase that begins near 4.2 μm. Furthermore, the JPSS-2 VIIRS V2 RSR in this (>4.2 μm) OOB region is steeper and of lesser magnitude compared to those for S-NPP VIIRS GT.
Figure 8b is given with the same axes limits as those of
Figure 7b in order to highlight the OOB signal differences between the S-NPP VIIRS GT and JPSS-2 VIIRS V2 band M13, the latter case being significantly more constrained. For the remaining IR bands where radiance magnitudes are higher overall, OOB contribution to the total signal is minimal.
5. Conclusions
On-orbit operational and climate-monitoring measurements by Earth-overserving instruments rely on well-characterized spectral performance—a critical aspect of imager pre-launch testing. Understanding spectral performance is necessary for recognizing the proper implementation and accuracy of radiometric calibration efforts and the products and research endeavors that rely on them, e.g., CERES. Critical laboratory experiments allow for characterization of the full optical path and any optical or electronic cross talks for nearly all VIIRS bands, but they cannot account for the specific spectral signatures measured by Earth-observing imagers. Therefore, it is difficult to tie pre-launch spectral performance metrics to OOB behavior for many varied Earth-viewed scenes. This study quantifies the OOB contribution to the total VIIRS signal and how it changes based on instrument version, channel, extended bandpass limits, and scene type, knowledge of which is important for scene-dependent inter-calibration efforts and environmental and cloud product retrievals. The results inform users of the target-dependent impact of published extended bandpass limits for methods that allow for selective RSR integration. It is appropriate for the remote sensing community to rely on the VIIRS channel-measured 1% extended bandpass, which will be sufficient in most applications. Inter-calibration or retrieval efforts that are dependent on certain scene types for which OOB is significant, however, may require consideration of the full-band VIIRS RSR for improved accuracy or at least for understanding of the potential sources of bias.
The OOB contribution to total signal was assessed using modified methodologies for SCIAMACHY- and IASI-based SBAF computation, employing ratio analysis of VIIRS RSR in-band and full-band integrated radiance FOVs. This method can be used to evaluate scene-specific OOB contribution in pre-launch spectral characterization efforts, which may be of interest to product teams that rely on specific scene conditions. This paper not only quantifies the scene dependence and influence of specified vs. measured 1% extended bandpass limits, but also provides visualization of the OOB contribution for selected targets and VIIRS bands. It was shown that S-NPP VIIRS is, overall, subject to a greater magnitude of OOB Earth-scene-dependent radiance contribution compared to that for the later NOAA-20 and JPSS-2 VIIRS instruments. That said, the OOB contribution for JPSS-2 VIIRS V2 band M9 has a magnitude of 5.7% for the Lib-4 PICS, which is the largest value found for solar reflective bands. The fact that dark scenes, as is the case for Lib-4 in the M9 band, are most influenced by OOB radiance contribution is intuitive, given that a small amount of outside energy is significant compared to the low signal of the in-band measurement, i.e., a low signal dominated by noise. This signal-to-noise consideration was similarly the main cause of OOB-contributed error for the M13 band, particularly for cold scenes at night, reaching a magnitude of 5.7% in the case of S-NPP VIIRS GT.
It is important that satellite records be combined seamlessly for long-term Earth-monitoring efforts like CERES. The aim is to minimize retrieval discontinuities, and thus particular examination of OOB contribution for the VIIRS I1 and M5 bands is valuable. Of the VIIRS instruments, only that on S-NPP elicits a need for meaningful consideration of OOB contribution in these channels, and only in the case of the M5 band for ocean and vegetative scene types. Such cases of OOB influence may impact certain environmental retrieval applications, e.g., NDVI determinations, but these negative effects can be largely avoided by using either another VIIRS instrument, if possible, or by utilizing the comparable I-band or M-band alternatives to the OOB-influenced channels, assuming the potential drawbacks are otherwise acceptable. For similar reasoning, the results of this study support NOAA-20 VIIRS over S-NPP VIIRS as a CERES inter-calibration reference when considering OOB-contributed uncertainty. Furthermore, it is advisable for CERES VIIRS and similar retrieval groups to consider the full-band RSR when spectral integration is required, or otherwise be aware of potential bias, thereby being able to account for potentially impactful OOB signal contribution depending on the scene and application. Although the spectral performance of VIIRS is adequate in the majority of applications, there is, nevertheless, value in understanding the scene-dependent OOB response, even if only for quality assurance purposes.


