Article

Application of UAV Photogrammetry with LiDAR Data to Facilitate the Estimation of Tree Locations and DBH Values for High-Value Timber Species in Northern Japanese Mixed-Wood Forests

1
Department of Forest Science, Graduate School of Agricultural and Life Sciences, The University of Tokyo, Tokyo 113-8657, Japan
2
Faculty of Forestry, University of Forestry and Environmental Science, Yezin, Naypyitaw 15013, Myanmar
3
Graduate School of Agricultural and Life Sciences, The University of Tokyo Chiba Forest, Kamogawa, Chiba 299-5503, Japan
4
Hokkaido Research Center, Forestry and Forest Products Research Institute, 7 Hitsujigaoka, Toyohiraku, Sapporo 062-8516, Japan
5
Graduate School of Agricultural and Life Sciences, The University of Tokyo Hokkaido Forest, Furano, Hokkaido 079-1563, Japan
6
Graduate School of Agriculture, Hokkaido University, Sapporo, Hokkaido 060-8589, Japan
*
Author to whom correspondence should be addressed.
Remote Sens. 2020, 12(17), 2865; https://doi.org/10.3390/rs12172865
Submission received: 7 July 2020 / Revised: 10 August 2020 / Accepted: 1 September 2020 / Published: 3 September 2020
(This article belongs to the Special Issue 3D Point Clouds in Forest Remote Sensing)

Abstract

:
High-value timber species play an important economic role in forest management. The individual tree information for such species is necessary for practical forest management and for conservation purposes. Digital aerial photogrammetry derived from an unmanned aerial vehicle (UAV-DAP) can provide fine spatial and spectral information, as well as information on the three-dimensional (3D) structure of a forest canopy. Light detection and ranging (LiDAR) data enable area-wide 3D tree mapping and provide accurate forest floor terrain information. In this study, we evaluated the potential use of UAV-DAP and LiDAR data for the estimation of individual tree location and diameter at breast height (DBH) values of large-size high-value timber species in northern Japanese mixed-wood forests. We performed multiresolution segmentation of UAV-DAP orthophotographs to derive individual tree crown. We used object-based image analysis and random forest algorithm to classify the forest canopy into five categories: three high-value timber species, other broadleaf species, and conifer species. The UAV-DAP technique produced overall accuracy values of 73% and 63% for classification of the forest canopy in two forest management sub-compartments. In addition, we estimated individual tree DBH Values of high-value timber species through field survey, LiDAR, and UAV-DAP data. The results indicated that UAV-DAP can predict individual tree DBH Values, with comparable accuracy to DBH prediction using field and LiDAR data. The results of this study are useful for forest managers when searching for high-value timber trees and estimating tree size in large mixed-wood forests and can be applied in single-tree management systems for high-value timber species.

Graphical Abstract

1. Introduction

High-value timber species play a significant economic role in forest management. They can be found in very low density [1], while trees with high economic value are often large in size [2], contributing to structural heterogeneity, dynamics, and functions of the forest ecosystem [3,4]. In many different regions, their numbers are declining because they are harvested heavily [5], harvested illegally [6,7,8], and they have often been earmarked for special attention in conservation and forest management practices [5,9]. Due to their high commercial value, the single-tree management system is commonly used for the management of high-value timber species [2,10]. Individual tree information (i.e., tree spatial positions and their stem sizes) of high-value timber species are necessary for operational single-tree management systems. However, forest inventories that acquire individual tree information of high-value timber species that are sparsely distributed within a large area of multispecies mixed forests may not be feasible due to operational costs and labor constraints.
Remote sensing (RS) technology has become increasingly popular for acquiring forest information at large spatial scales [11,12]. Due to their ability for accurate three-dimensional (3D) measurements, airborne laser scanning (ALS) and the recently developed unmanned aerial vehicle digital aerial photogrammetry (UAV-DAP) technologies, among other RS techniques, would provide promising information for high-value trees that could be used for the purposes of single-tree management systems. ALS is an active remote sensing technique that uses light detection and ranging (LiDAR) sensors, providing a range of features related mainly to the trees, including discrete return and full-waveform features [11,13]. However, the use of LiDAR data in practical forest management operations remains costly for forest managers, especially when high spatial and temporal resolution RS data for individual-tree-level analysis are required over a small area [14]. As an alternative to LiDAR data, 3D forest information can be derived from UAV-DAP following a computer-vision-based structure-from-motion technique [15,16,17,18]. Several comparative studies between LiDAR and UAV-DAP data have confirmed the applicability of both data types for forest attribute estimation, with both showing comparable accuracy [19,20,21,22,23,24].
Individual tree spatial position and tree size values for high-value timber species play critical roles in single-tree management systems. Therefore, it is necessary to discriminate the forest canopy at the species level to estimate the spatial positions of individual trees. The applicability of multispectral or hyperspectral data in forest species detection has been demonstrated in previous studies [25,26,27]. LiDAR intensity and waveform data have also been used to classify the forest canopy at the species level [28,29,30]. Some studies have suggested that the accuracy of tree species detection using multispectral or hyperspectral data could improve when combined with LiDAR data [31,32,33]. However, multispectral or hyperspectral data have many constraints in their acquisition and require complex data processing [34]. In this case, the spectral information included in very high-resolution UAV-DAP data would be a cost-effective alternative data source. Therefore, in this study, we examined the use of UAV-DAP for the estimation of individual tree spatial positions of high-value timber species.
The use of LiDAR and UAV-DAP for forest attribute estimation generally follows two common approaches: the area-based approach (ABA) or the individual tree detection (ITD) approach [17,35,36,37,38]. In the ABA, plot- and stand-level forest structural attributes are estimated from vegetation metrics derived from LiDAR and UAV-DAP canopy height models (CHM). In the ITD approach, the CHMs or normalized point clouds are segmented into tree crowns, and variables such as the tree height, crown area, and structural metrics within the segmented tree crowns are extracted. However, the accuracy of tree crown detection largely depends on the forest conditions, i.e., tree density, forest type, and tree species [39,40]. Even though satisfactory results were obtained for conifer trees and plantations [38,41,42], studies suggest that individual tree detection (ITD) algorithms may not produce highly accurate results when the target species are broadleaf species [39,40,43]. The estimation of individual tree size information for large high-value timber trees with highly heterogeneous tree crowns remains a challenging task. In this study, we examine this issue.
In northern Japanese mixed-wood forests, monarch birch (Betula maximowicziana Regel), castor aralia (Kalopanax septemlobus (Thunb.) Koidz), and Japanese oak (Quercus crispula Blume) are major high-value timber species. The production of high-quality and high-value timber from these species is exclusively dependent on the cutting of large trees within the mixed-wood forest. One of the major challenging tasks for forest managers in operational single-tree management systems is the search for high-value timber trees, since they are much rarer than other common conifer and broadleaf species [44]. Considering its high spatial and temporal resolution, costs, and efficient data collection, UAV-DAP could be a useful tool for single-tree management.
Therefore, the objective of this study is to examine the potential use of UAV-DAP to estimate individual tree spatial position and diameter at breast height (DBH) values of high-value timber species. Spectral information derived from UAV-DAP and LiDAR data was used to estimate the trees’ spatial positions. Individual tree DBH Values were estimated from LiDAR and UAV-DAP structural metrics. The results of this study could be useful for forest managers when searching for high-value timber trees based on estimated tree size in large mixed-wood forests.

2. Materials and Methods
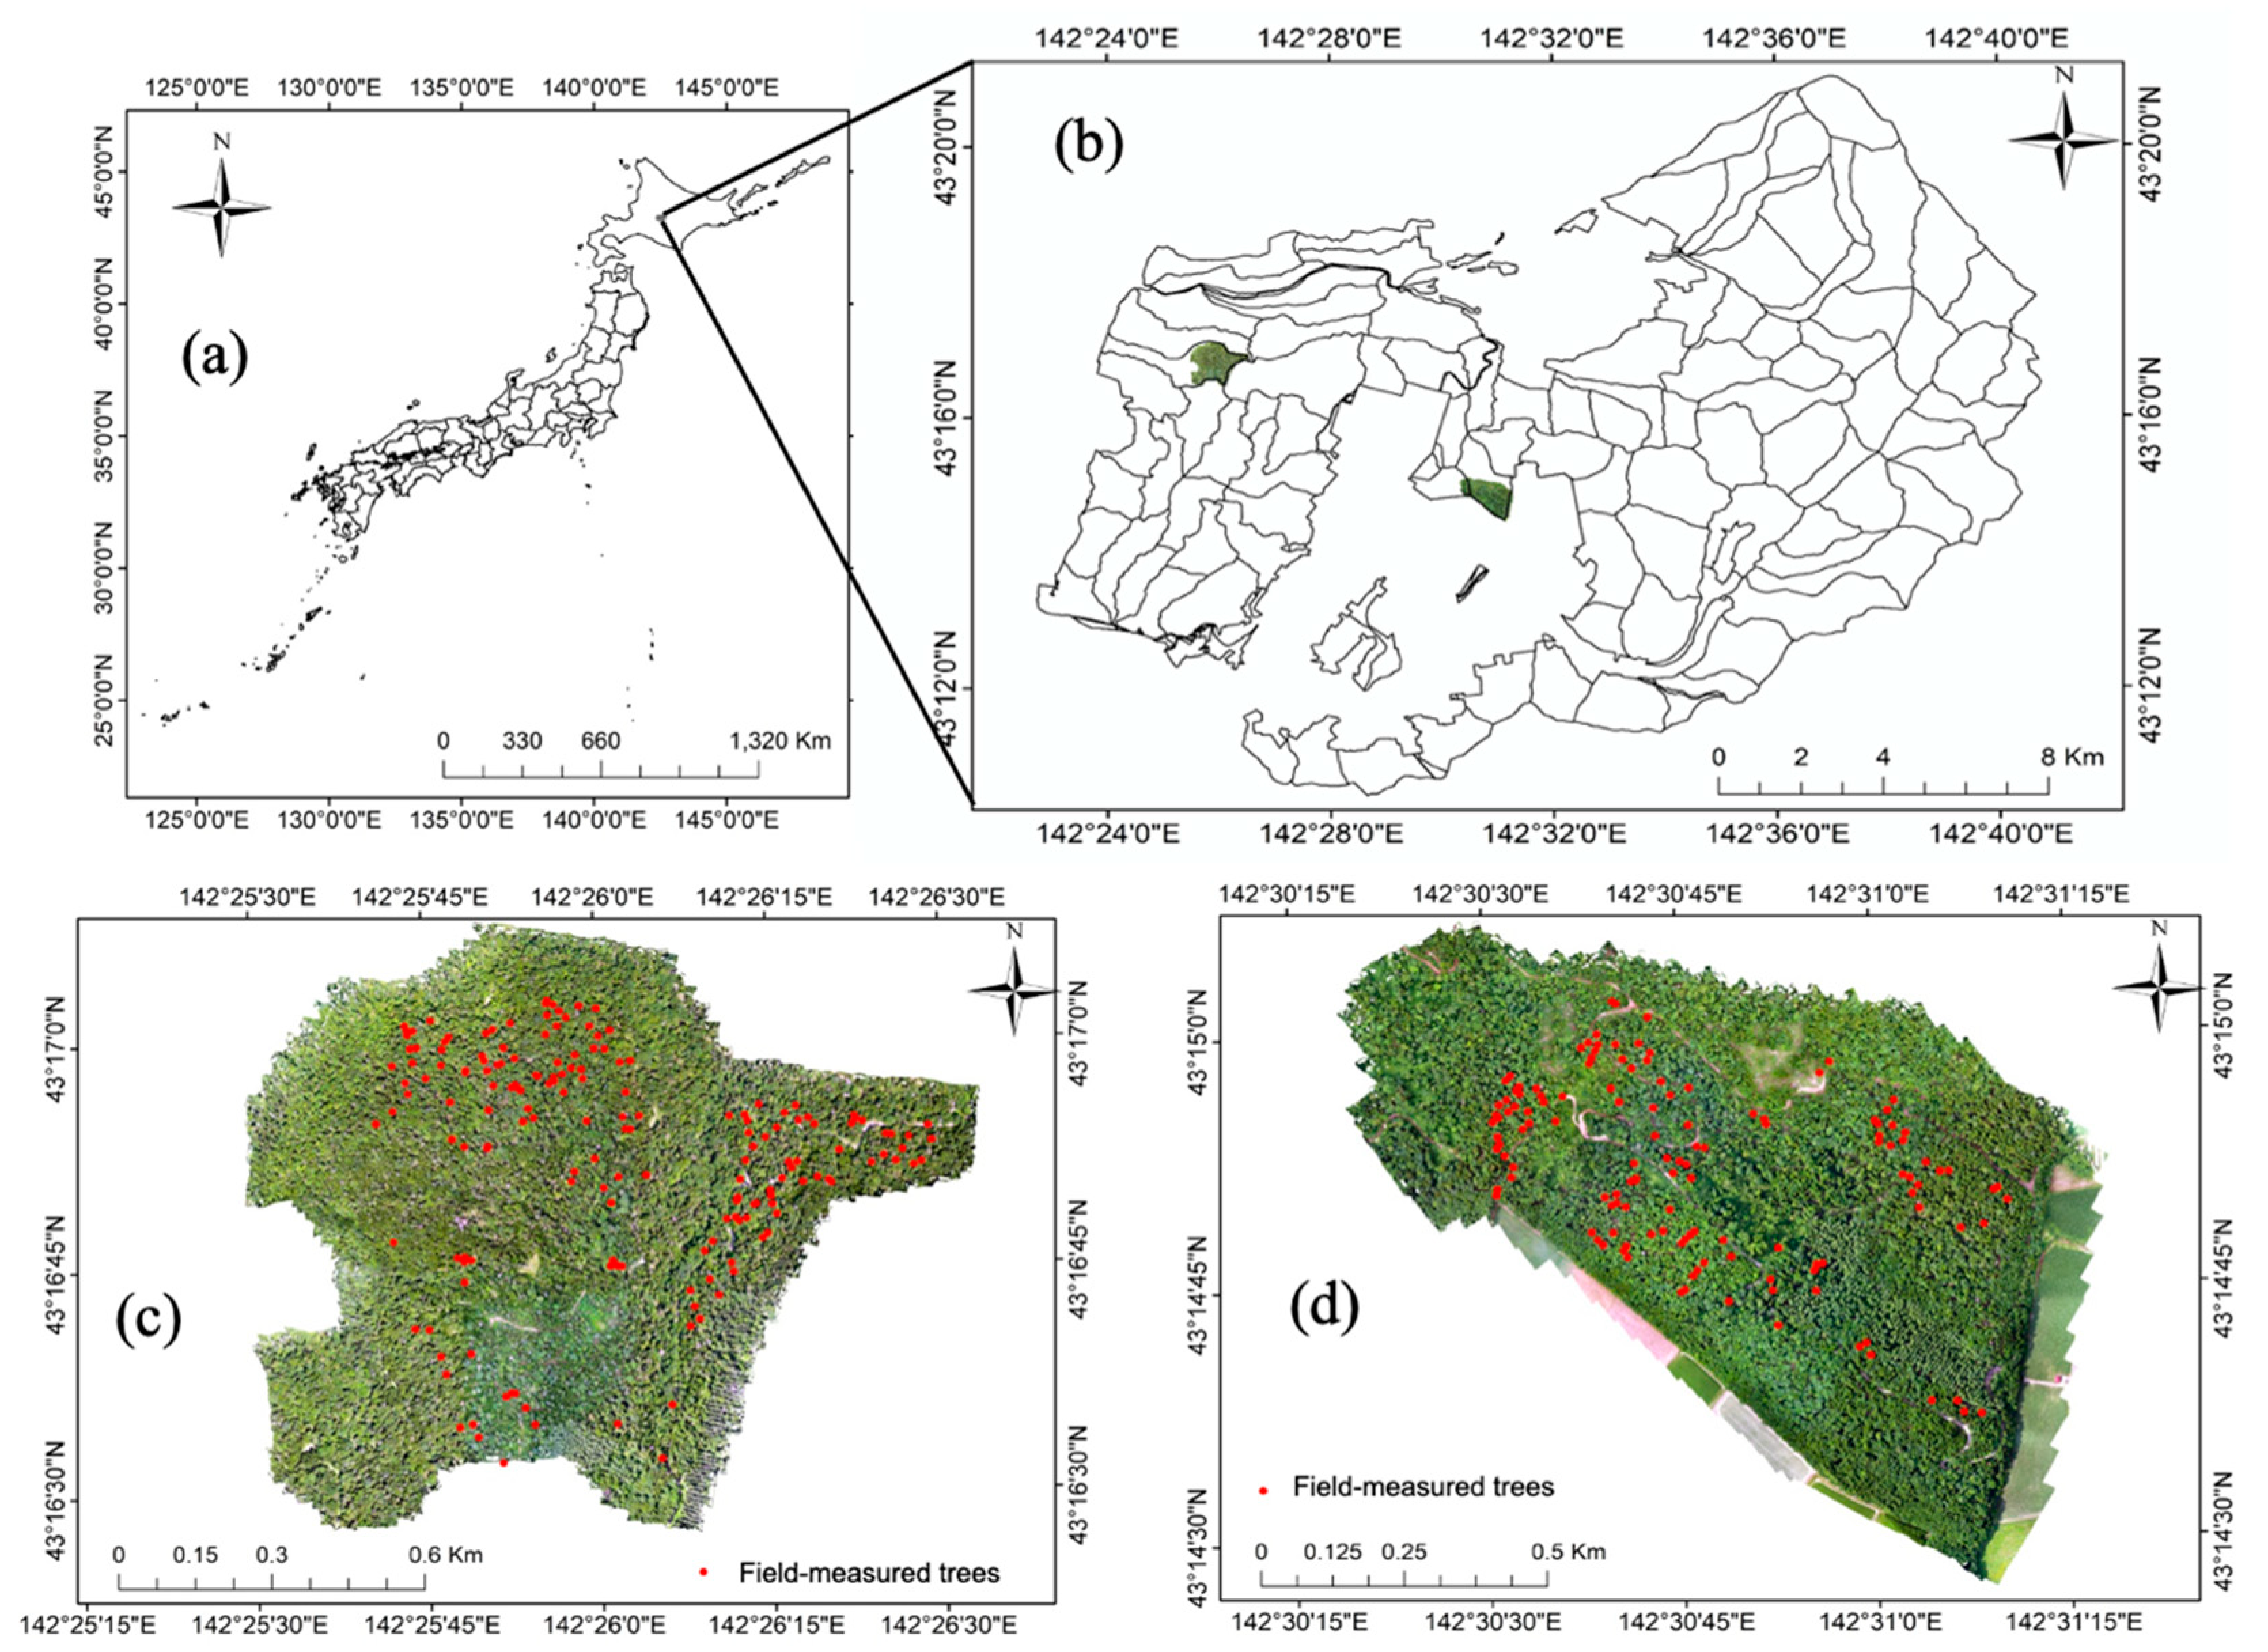
2.1. Study Site

The study site was located in the University of Tokyo Hokkaido Forest (UTHF) (Figure 1) in Furano City, on the central Hokkaido Island in northern Japan (43°10–20′ N, 142°18–40′ E, 190–1459 m asl). Uneven-aged mixed forests with coniferous and broadleaf tree species are the main vegetation cover in the UTHF. The predominant conifer species included Sakhalin fir (Abies sachalinensis) and Yezo spruce (Picea jezoensis), while the major broadleaf species included Tilia japonica, Acer pictum var. mono, B. maximowicziana, K. septemlobus, Q. crispula, and Ulmus laciniata. The main silvicultural system in the UTHF is the single-tree selection system, in which trees are periodically selected and harvested with a cutting cycle of 15 to 20 years and a tree removal rate of 10–17% [2]. In addition, the single-tree management technique has been applied for the management of high-value timber species since 1965 [2,45].
Two forest management sub-compartments, 36B (117.03 ha) and 59A (65.2 ha), were intentionally selected as areas of interest, since these compartments were scheduled for management activities in 2020 and 2019, respectively.

2.2. Data

2.2.1. Field Data

Field surveys were carried out during July and August 2019. In total, 213 sample trees of target high-value timber species (monarch birch, castor aralia, and Japanese oak) and 77 sample trees of other common broadleaf trees (A. pictum var. mono, T. japonica, Ulmus spp, and Fraxinus mandshurica) were measured in the field (Figure 1). The measurement parameters for the three high-value timber species included the DBH, tree height, crown lengths in four perpendicular directions, and spatial positions of individual trees. For other common broadleaf species, the DBH and spatial positions were recorded. The DBH was measured using a diameter tape 1.3 m above the ground. The tree height and crown length were measured using a Vertex III hypsometer and transponder (Haglöf Sweden AB, Långsele, Sweden). Tree height measurements were carried out three times and average height values were assumed as the corresponding tree height. Individual tree spatial positions were recorded using a global navigation satellite system (GNSS). We used an R2 integrated GNSS system (Trimble Inc., Sunnyvale, CA, USA) to record individual tree spatial positions, with an accuracy of less than 1 m. The field-recorded coordinates were post-processed using correction data from the base station. We used the nearest official reference point as the base station.
In addition to field-measured trees, we also recorded large trees near field-measured trees that can be easily identified on the UAV-DAP orthophotographs. Therefore, there were 132 trees from high-value timber species and 62 trees from other broadleaf species in sub-compartment 36B (194 broadleaf trees), and 88 trees from high-value timber species and 33 trees from other broadleaf species in sub-compartment 59A (121 broadleaf trees). These datasets were used for the purpose of classifying the forest canopy. Individual tree crowns for all these trees were manually digitized. We used field-measured individual tree spatial positions, visual interpretation of UAV-DAP orthophotographs, and field-measured crown information in manual digitization of individual tree crowns. These manually digitized tree crown polygons were used as reference tree crowns for classification of the forest canopy at the species level, as described in Section 2.3.2. For the individual tree DBH estimations of high-value timber species described in Section 2.3.3, we used 213 field-measured sample trees, their field-measured crown information, and their manually digitized tree crown areas. A summary of the field measurement data for high-value timber species is given in Table 1.

2.2.2. LiDAR Data

LiDAR data were acquired in September 2018 using an Optech Airborne Laser Terrain Mapper (ALTM) Orion M300 sensor (Teledyne Technologies, Waterloo, ON, Canada) mounted on a helicopter. The detail specifications of LiDAR data are summarized in Table 2. Initial data processing, such as classification of points into ground and non-ground classes, were conducted by the data provider (Hokkaido Aero Asahi, Hokkaido, Japan) and data were delivered in LAS format.

2.2.3. UAV Data

We used an Inspire-2 platform mounted with a Zenmuse X5S RGB camera (DJI, Shenzhen, China) for image acquisition. Flight missions were conducted on 8 and 10 July 2019 for compartment 36B and on 11 and 30 July 2019 for compartment 59A. The UAV flight parameters are described in Table 3. The ground control points (GCPs), take-off, and landing points were set in available open areas before the flight missions. A total of 10 GCPs for sub-compartment 36B and 9 GCPs for sub-compartment 59A were collected. The xyz coordinates of the GCPs were recorded with the Trimble R2 GNSS system, with accuracy of less than 1 m. There were a total of 3292 images for compartment 36B and 2231 images for compartment 59A. All imagery had a photo resolution of 5280 × 3956 pixels.

2.3. Data Analysis

2.3.1. RS Data Processing

LiDAR Data Processing

LiDAR data processing, such as generation of the LiDAR digital terrain model (LiDAR-DTM), LiDAR point cloud normalization, and LiDAR canopy height model (LiDAR-CHM) generation, were carried out using the US Forest Service FUSION/LDV 3.8.0 software [46]. The LiDAR-DTM was generated using the GroundFilter and GridSurfaceCreate functions, as well as the CanopyModel function for point cloud normalization and LiDAR-CHM.

Photogrammetric Processing of UAV Imagery

The photogrammetric processing software Agisoft Metashape Professional Edition 1.5.3 (Agisoft, St. Petersburg, Russia) was used for UAV imagery processing. We performed four image processing stages in Metashape: image alignment, building a dense point cloud, building a digital elevation model (DEM), and building an orthomosaic. We used high accuracy for image matching in the image alignment stage, the stage at which the camera location, orientation, and other internal parameters are optimized [47]. After the initial alignment was performed, abnormal points were deleted based on gradual selection procedures in Metashape [47]. We then added GCPs in each corresponding image for a more accurate optimization of the camera locations and orientations, as well as other internal camera parameters. We used medium quality images in building a dense point cloud stage to reduce the image processing time and mild depth filtering to remove the outliers. We followed the Metashape default setting for the DEM building stage and orthomosaic building stage. The detailed photogrammetric procedure was described by Moe et al. [48]. Dense point clouds were exported in LAS format with an average point density of 547.01 points/m2 and orthophotographs with a 3 cm pixel resolution were exported in GeoTiff format for both sub-compartments. We used LiDAR-DTM for normalization of UAV-DAP point clouds.

2.3.2. Classification of the Forest Canopy into Species

Classification of the forest canopy into species was performed through the following steps: image segmentation, variable extraction, variable selection, classification, and accuracy assessment.

Image Segmentation

RGB information embedded in UAV-DAP data can provide more successful delineation for large and highly heterogenous broadleaf tree crowns. The object-based image analysis (OBIA) method was used to delineate forest canopy into individual tree crown [49,50,51]. OBIA is based on a segmentation procedure that starts from individual pixels that are merged to their most similar adjacent regions. This method is particularly suitable in the case of high spatial resolution imagery, in which pixels are significantly smaller than the objects of interest [51]. The information from the three image spectral bands (i.e., red, green, and blue) of UAV-DAP orthophotographs, together with LiDAR normalized point clouds, were used together for image segmentation using a multiresolution segmentation algorithm in the eCognition Developer (Trimble Inc., Sunnyvale, CA, USA). This algorithm chooses the importance (weight) of a data layer (i.e., RGB layers and CHM layer) used for image segmentation. The importance of the CHM layer was set at three times higher than the RGB layers [50].

Variable Extraction

After the segmentation of each tree crown, various spectral and textural variables were extracted from each individual tree crown [52,53,54]. Since the target species were broadleaf trees with high heterogeneity within an individual tree crown, the exact overlap of algorithm-derived tree crowns and manually digitized tree crowns was not achieved. The same problem was also reported in previous studies [50,53,55,56]. Therefore, segmented objects (tree crowns in this case) with a high percentage of overlap were selected for variable extraction. In this study, we selected the largest tree crown objects within the manually digitized tree polygon for variable extraction. Ma et al. [56] selected 60% overlap objects for variable extraction to classify land cover classes. Apostol et al. [50] used enclosed parts of algorithm-derived tree crowns on the target tree crown for variable extraction. Other studies [57,58] used sunlit parts of the tree crown objects for variable extraction for species classification purposes. The variables extracted from individual tree crowns are listed in Table 4.

Variable Selection, Classification, and Accuracy Assessment

Various variable selection and classification algorithms were applied in remote sensing image classification. Non-parametric methods are widely popular for this purpose, as they can be used with arbitrary data distributions [58]. Among non-parametric methods, random forest (RF) is one of the most used classification methods in the field of image classification, as it is simple and does not require sophisticated parameter tuning [58,59]. RF can handle high data dimensionality (i.e., a small number of observations with a high number of independent variables) [60]. Using the object information described in Table 4, image objects derived from multiresolution segmentation were classified into five classes: monarch birch, castor aralia, Japanese oak, other broadleaf, and conifer. Other broadleaf includes the major canopy species of A. pictum var. mono, T. japonica, Ulmus spp, and F. mandshurica. Conifer trees were not measured in the field. We, therefore, used visual interpretation of orthophotographs for digitizing conifer tree crowns. We used 50 conifer tree crowns in each sub-compartment to extract the variables described in Table 4. We divided the data into training and validation data at a ratio of 70:30. We used the randomForest package [61] implemented in R statistical software package [62] for the classification. The accuracy assessment was carried out by generating standard confusion matrix, as applied in previous studies [25,32]. The resulting image objects were assumed as the individual tree locations of high-value timber species.

2.3.3. Estimation of DBH

Although the largest tree crown objects within manually digitized tree crowns were selected for variable selection, these tree crowns may not be useful for the estimation of tree DBH. In previous studies, segmented tree crowns with one-to-one relationships with manually digitized polygons were selected for individual tree parameter estimation (e.g., [63,64,65,66]). In this study, we used manually delineated tree crowns to extract structural variables from LiDAR- and UAV-DAP-normalized point clouds. We used the cloudmetrics function in the FUSION software package to derive the structural variables of individual tree crowns. A total of 30 crown, height, and structural variables (Table 4) were derived for each tree crown, which were used to estimate individual tree DBH Values. For the purpose of comparison, we also predicted the DBH Values using field-measured tree heights and crown areas. We used a linear mixed effects model, considering the sub-compartments as a random effect. For LiDAR- and UAV-DAP-derived metrics, stepwise variable selection was carried and the final models were selected based on Akaike’s information criterion (AIC) [67]. However, the variables with a variance inflation factor (VIF) larger than five were neglected in the final model in order to avoid multicollinearity [68]. The accuracy of the selected models was validated using leave-one-out-cross-validation. The coefficient of determination for fixed effect parameters (marginal R2), root mean square error (RMSE), and Pearson’s correlation coefficient (r) were determined for each species to assess the goodness of fit of the selected model.

3. Results

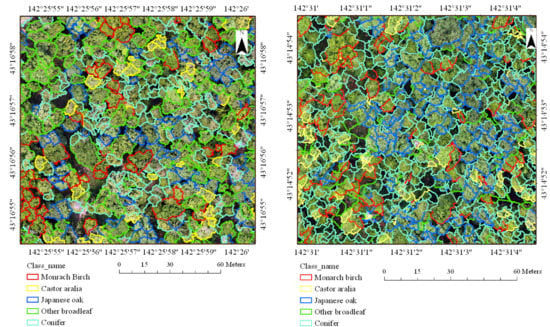
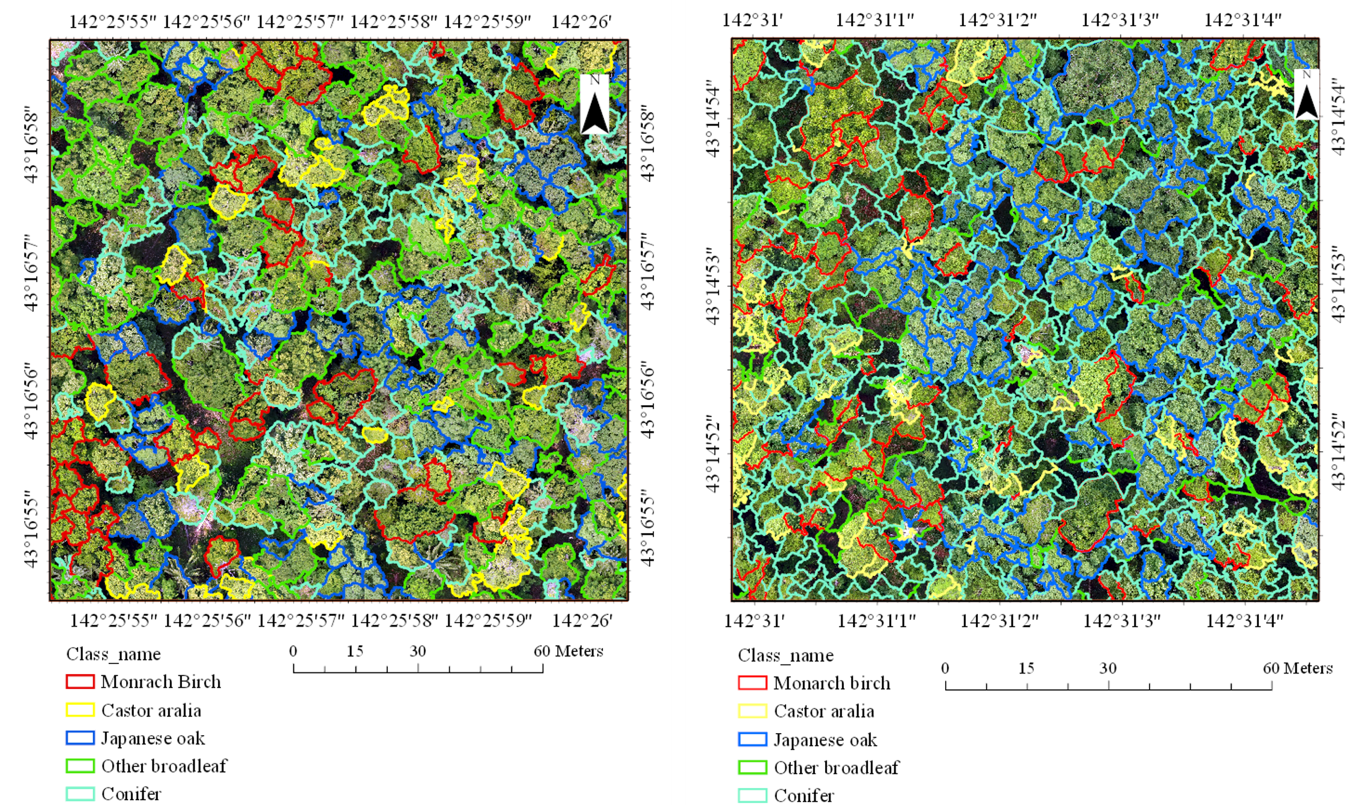
3.1. Multiresolution Segmentation of Forest Canopy

Comparison between crown areas (CAs) were carried out on three pairs (i.e., field-measured CAs versus manually digitized CAs, field-measured CAs versus multiresolution segmented CAs, and manually digitized CAs versus multiresolution segmented CAs). The results of the comparison are shown in Figure 2. The results indicated the lower correlation between field-measured and multiresolution segmented crown areas for all species. A slightly better correlation was observed between manually digitized crown areas and multiresolution segmented crown areas. Among the three pairs used for comparison, field-measured crown areas and manually digitized crown areas exhibited the highest correlation coefficients. Since the target tree species were large in size and their crown areas were highly heterogenous, tree crown area underestimation was observed in all species (Figure 2). Figure 3 shows the visual comparison between manually digitized tree crowns and multiresolution segmentation-derived tree crowns.

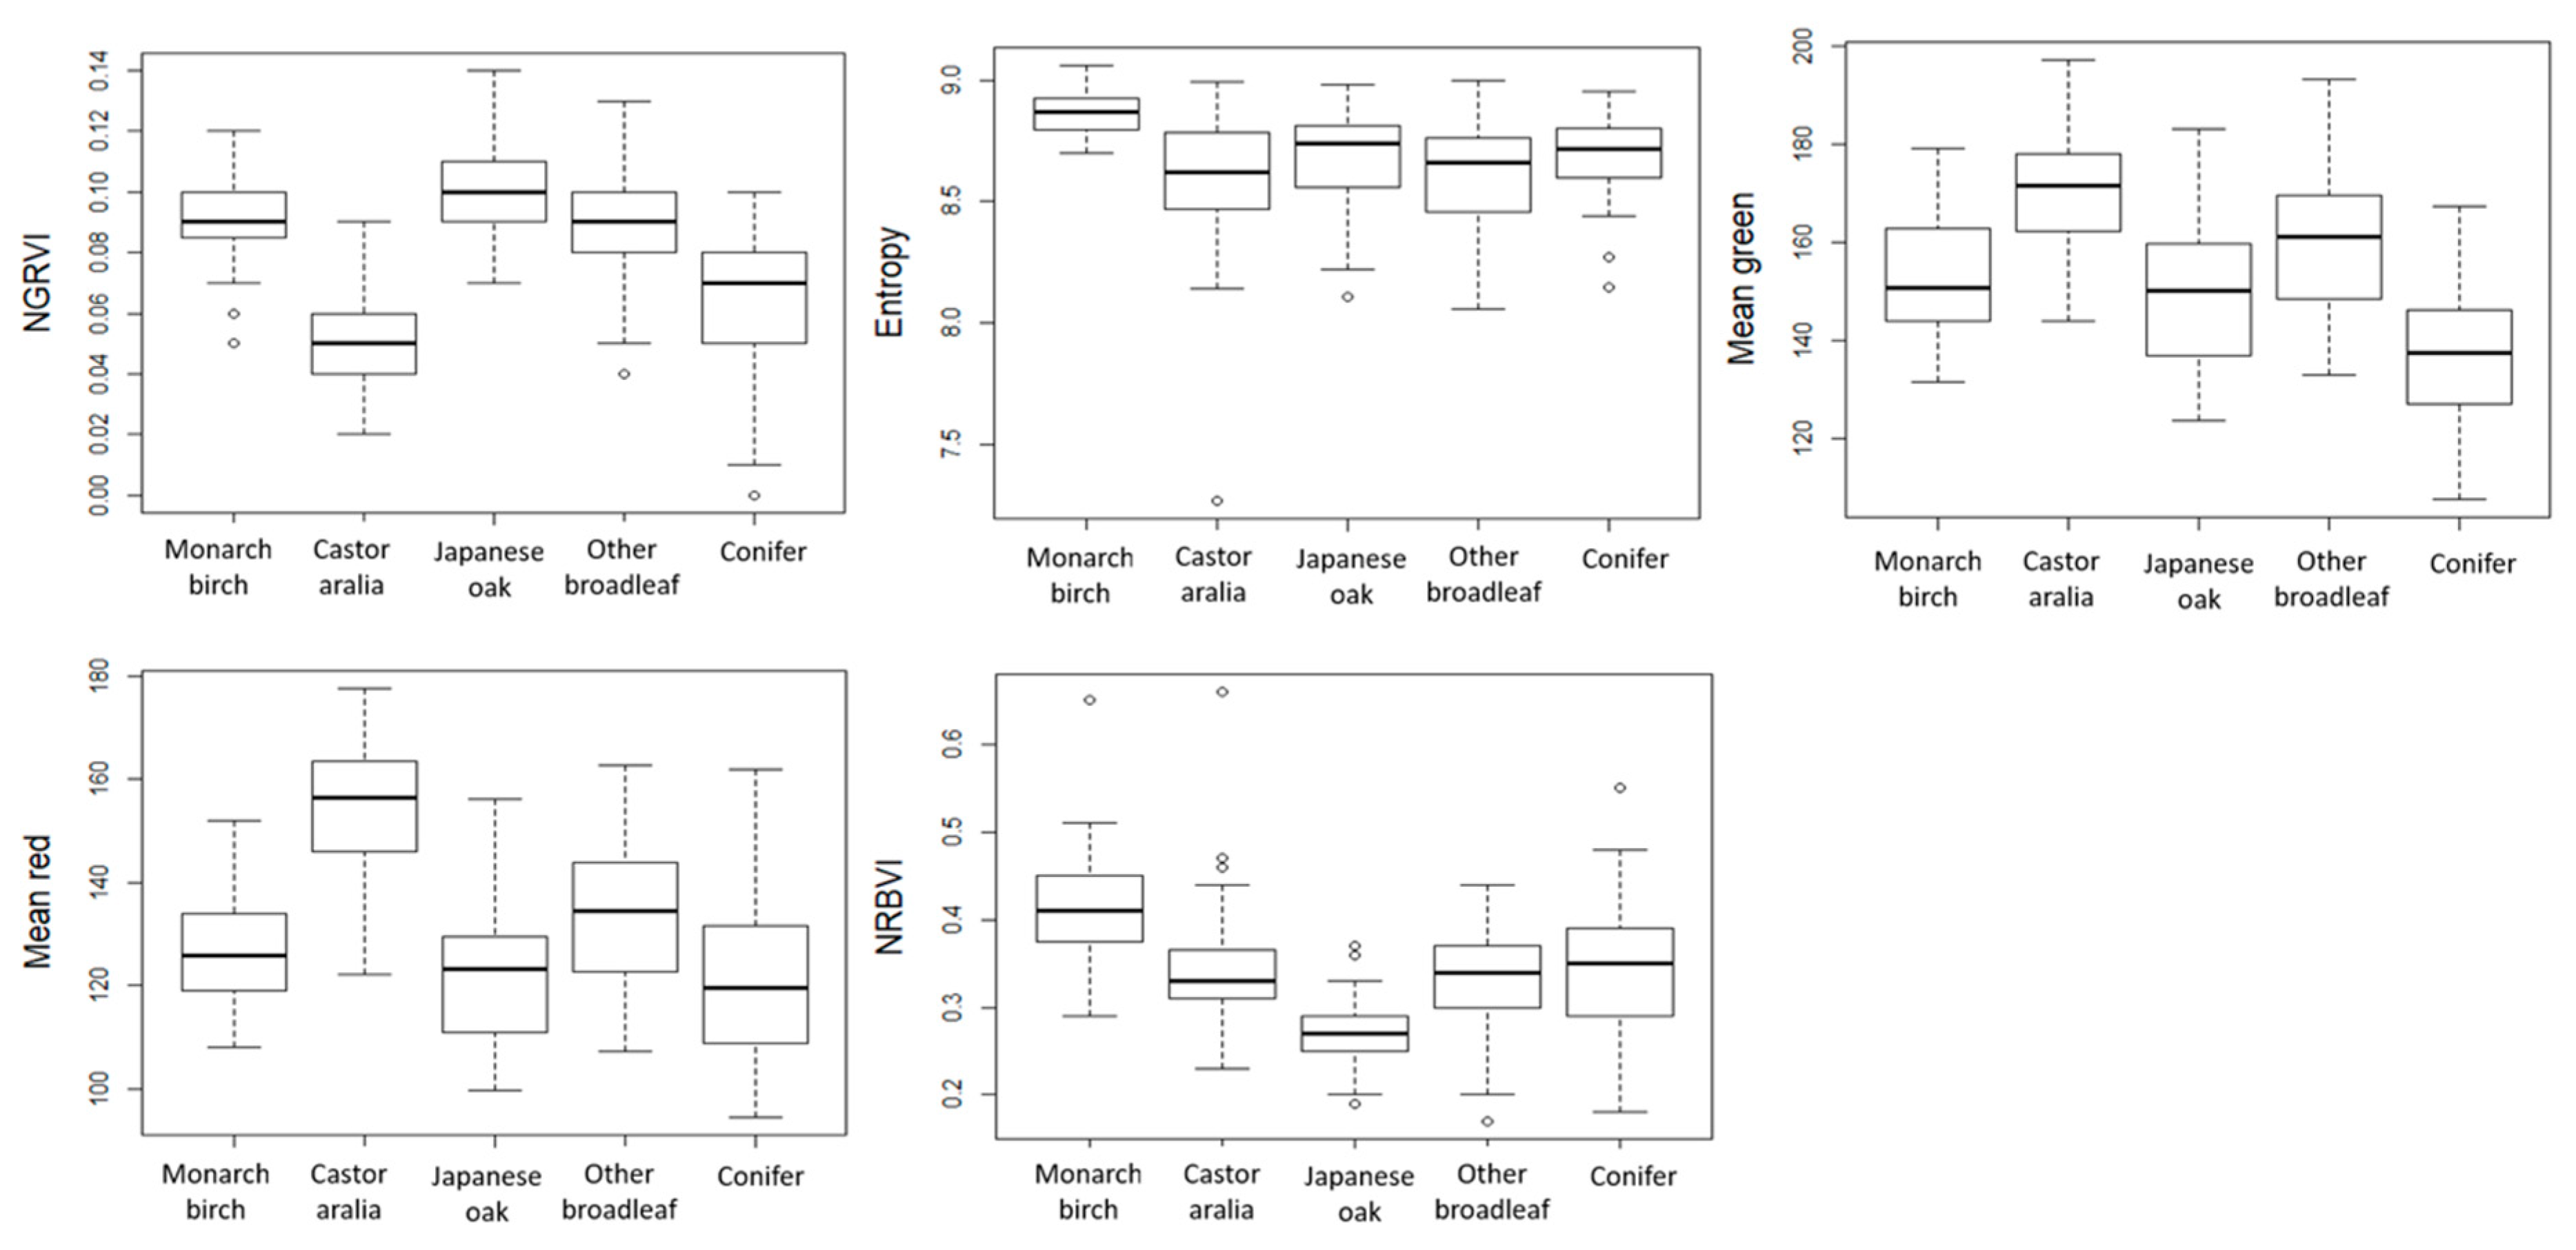
3.2. Variable Selection, Classification of Forest Canopy, and Accuracy Assessment
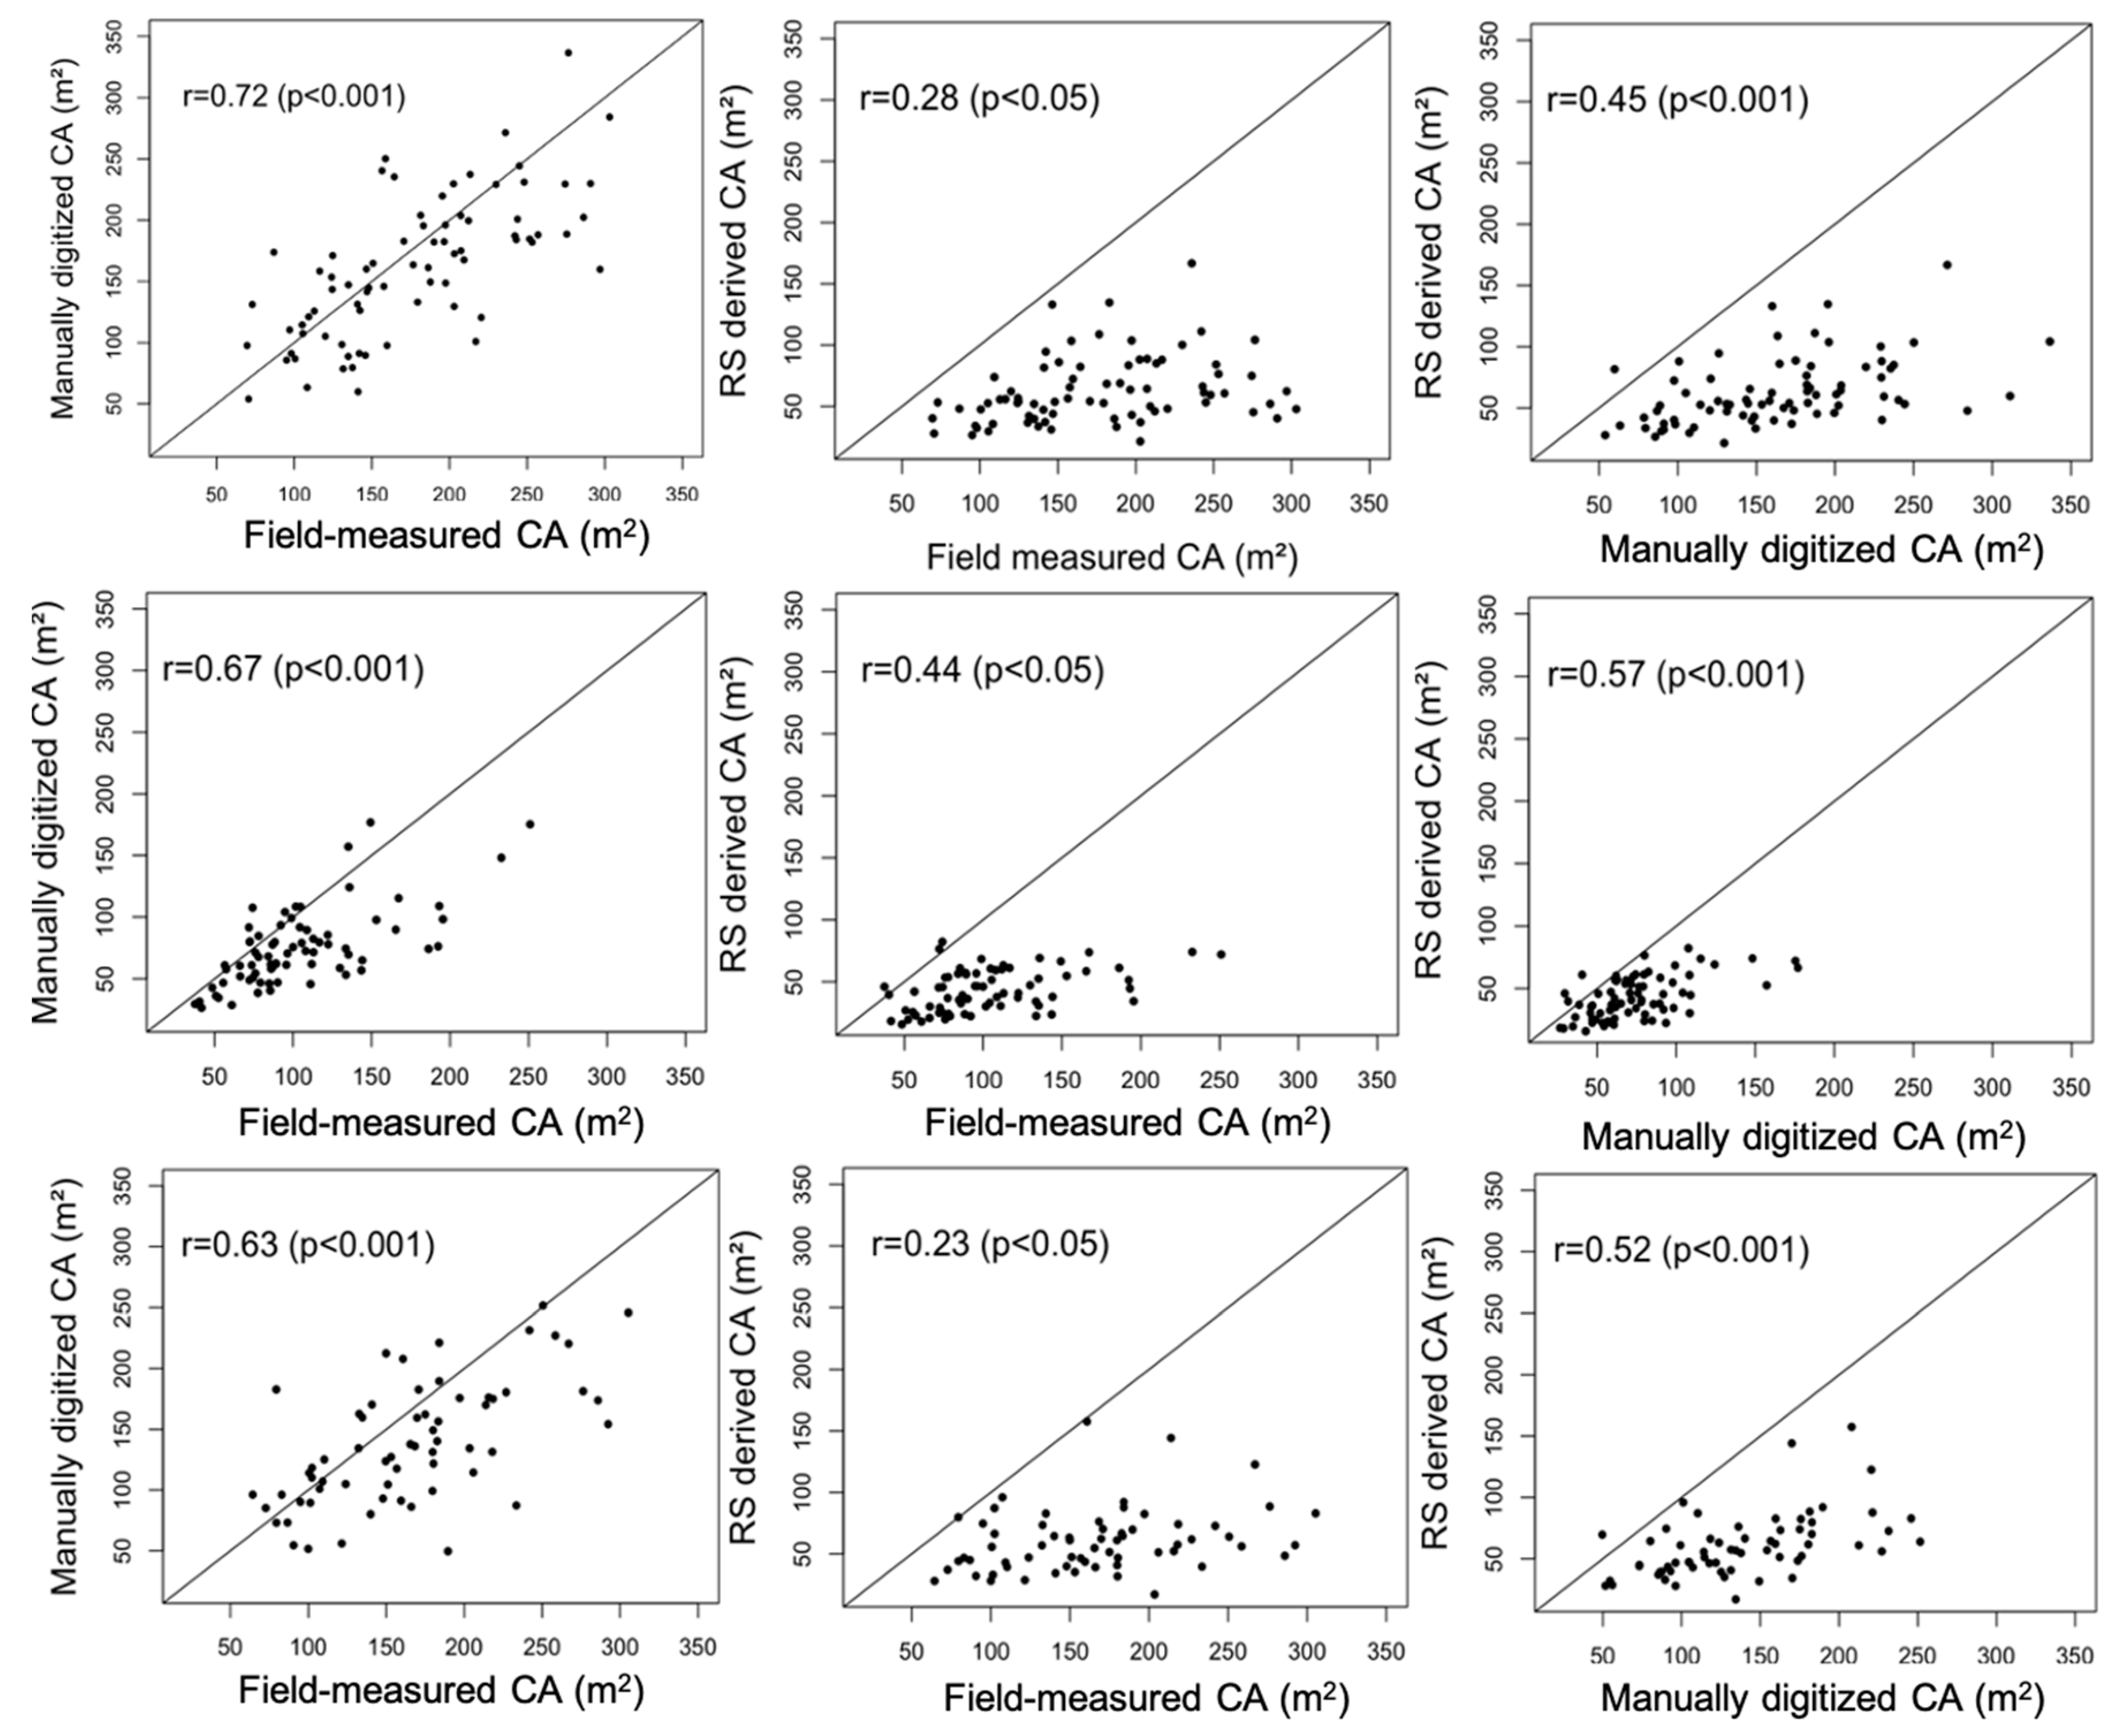
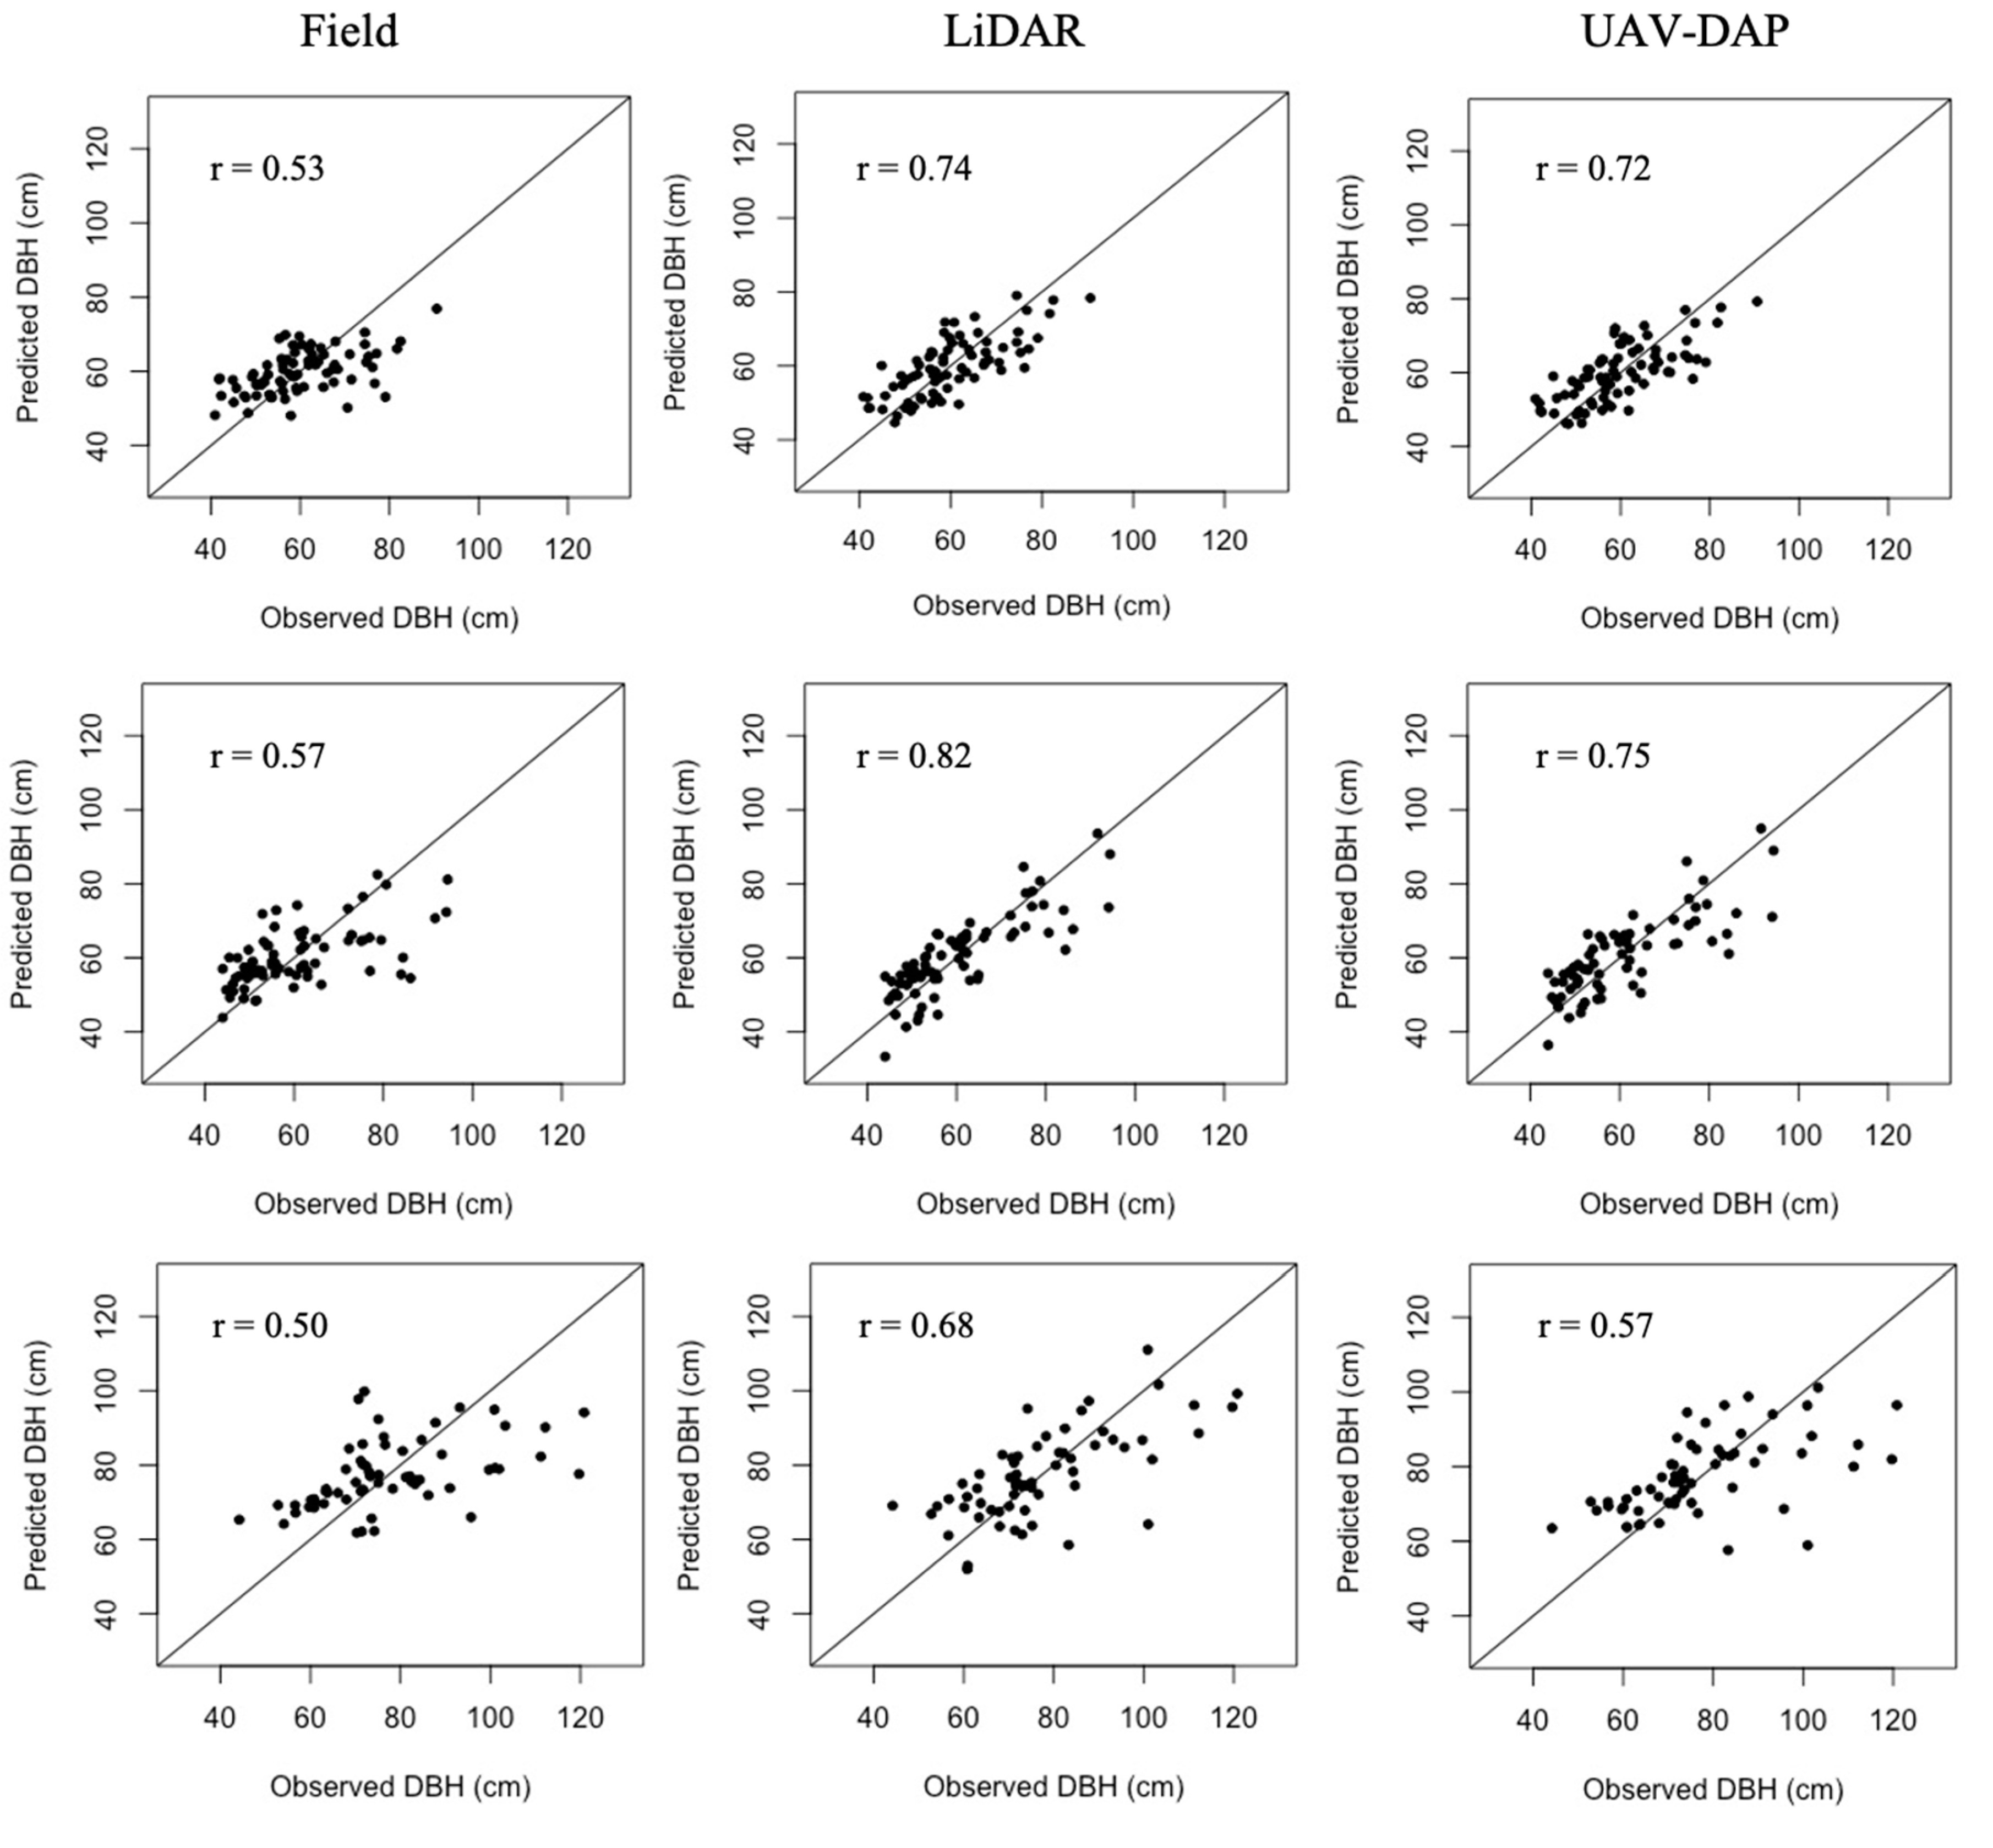
The results of the RF classification of the forest canopy into three high-value timber species, other broadleaf species, and conifer species are shown in Table 5 and Table 6. Based on 75 validation crowns consisting of 11 monarch birch, 18 castor aralia, 12 Japanese oak, 21 other broadleaf, and 13 conifer trees, an overall accuracy classification value of 73% was obtained with a kappa coefficient of 0.66 in sub-compartment 36B (Table 5). Table 6 shows the results of the classification for sub-compartment 59A. The overall accuracy of 63% was obtained with a kappa coefficient of 0.53 based on the validation data (58 crowns) for 12 monarch birch, 9 castor aralia, 6 Japanese oak, 12 other broadleaf, and 19 conifer trees. Figure 4 and Figure 5 show the important variables for the classification of the forest canopy in sub-compartments 36B and 59A, respectively.
The spatial positions of individual trees can be extracted from the classification results. Figure 6 shows monarch birch, castor aralia, Japanese oak, other broadleaf, and conifer tree crowns. These individual tree crowns indicate the tree locations of high-value timber species.

3.3. DBH Estimation

The selected models for DBH estimation using field, LiDAR, and UAV-DAP data are shown in Table 7. Figure 7 showed the correlation between observed and predicated DBH Values for three high-value timber species. The results indicated that the models based on LiDAR data obtained higher correlation coefficients and lower RMSE values. The models based on UAV-DAP revealed a comparable prediction power to LiDAR-based models and field-survey-based models. Among the three data sources, models using field-measured data exhibited the highest RMSE values and lower correlation values for all species. In general, the results showed the higher correlation for castor aralia, while lower correlation values were observed for Japanese oak (Table 7 and Figure 7).

4. Discussion

4.1. Segmentation of the Forest Canopy

In this study, tree crown segmentation was conducted using the multiresolution segmentation method, which showed low segmentation accuracy (Figure 2) for all target high-value timber species. As shown in Figure 3, the crowns of target high-value timber species are largely heterogeneous, which could produce a lower segmentation accuracy. For all target species, underestimation of individual tree crown areas was observed. Deciduous species have a relatively flat outer canopy envelope, and therefore generally have more complex crown structures compared to coniferous species. In addition, the branching patterns of large size deciduous trees lead tree detection algorithms to detect a heterogenous individual tree crown as different tree crowns [69]. In this study, we used spectral bands (i.e., R, G, and B) derived from UAV-DAP together with rasterized LiDAR canopy height models for delineation purposes. The within-crown heterogeneity of large high-value timber species produced different tree crown objects for manually delineated tree crowns (Figure 3). Spectral variation due to shadows within a heterogenous individual tree crown could lead to the segmentation of individual tree crowns into several crowns (Figure 2 and Figure 3).
Higher tree crown detection accuracies were reported for conifer species and plantations in previous studies [38,41]. The results in this study were consistent with previous studies using different tree crown detection algorithms. Studies by [39,40,43] reported that the results of individual tree crown detection algorithms could not produce highly accurate results, especially when the target species were broadleaf species. Using the UAV-DAP-derived canopy height models, Nuijiten et al. [69] accessed the seasonal variation in the results for the delineation of individual tree crown, using a marker-controlled watershed segmentation algorithm in mixed deciduous forest stands. They reported accuracy values of 55% in summer and 77% in autumn. Dalponte et al. [25] used hyperspectral data for the segmentation of the forest canopy, reporting that on average 34% of the area delineated by the tree crown detection algorithm overlapped with the area containing manually delineated tree crowns.

4.2. Classification of the Forest Canopy

We classified the forest canopy into three high-value timber species, other broadleaf species, and conifer species (Table 5 and Table 6). Even though the classification of the forest canopy into two categories of broadleaf and conifer species is highly accurate, as indicated in previous studies [70,71], classification of the forest canopy into several classes can be challenging, especially since our data consisted of R, G, and B bands only. We obtained overall classification accuracy values of 73% and 63% in sub-compartments 36B and 59A, respectively (Table 5 and Table 6, Figure 6). The important variables (Figure 4 and Figure 5) for classification of the forest canopy were different for the two sub-compartments. In sub-compartment 36B, NGRVI appeared to be the best spectral variable for classification, while the mean value of blue was the best variable in sub-compartment 59A. This could be due to the timing of the UAV flight missions between the two sub-compartments. In addition, the weather conditions during the flight missions may have influenced the spectral responses of forest canopy, affecting the classification accuracy.
Lower classification accuracy was observed in sub-compartment 59A. The lower classification accuracy result in the current study could be due to confusion of the spectral signatures of each species. This issue was also highlighted in previous studies [26,55]. The accuracy in the current study was relatively lower than previous studies that used more spectral information, such as multispectral or hyperspectral information. For example, Franklin et al. [26] used multispectral data derived from UAV-DAP to classify a forest canopy into five categories. They reported an overall classification accuracy of 78% for 23 validation tree crowns. A study by Lisein et al. [52] tested multitemporal UAV flights with RGB and color–infrared cameras to determine the best time window for classifying forest species. Using the random forest classification approach, they reported a lower error value of 16% when discriminating 5 different categories of tree species. The use of hyperspectral data and LiDAR data for tree species classification was examined by Matsuki et al. [32] and Dalponte et al. [25]. They reported maximum classification accuracy values of 82% for 16 classes of tree species [32] and 88.1% for 9 classes [25].

4.3. Estimation of Individual Tree DBH

In addition to species classification, this study demonstrated the applicability of RS data for the estimation of DBH, which is one of the most important variables for single-tree management purposes. We compared the accuracy of field, LiDAR, and UAV-DAP data for DBH estimation for three high-value timber species. In the DBH estimation models of RS data, the significant variables used for prediction are the tree-height-related variables. The RS variables related to point density did not play an important role in the estimation of individual tree DBH Values. This result is consistent with the previous studies [63,65]. Yu et al. [63] examined the use of LiDAR height and intensity metrics for the estimation of the tree basal area and stem volume in Finland. They found that the best models for estimating individual tree DBH Values were models that included tree crown and height metrics. In addition, a study by Chen et al. [65] also reported that models including LiDAR height and crown metrics rather than intensity metrics seemed to be the best models for individual tree stem volume and basal area estimations. However, all returns (i.e., first, second, third, and final returns) were used to derive the intensity metrics. The intensity metrics derived separately for each return within specific tree crown areas related better to individual tree DBH Values.
The results of the DBH estimation models also revealed that manually delineated tree crown area values, together with tree height values, could better estimate the individual tree DBH Values than field-measured crown area values. The correlation between observed and predicted DBH Values was higher in DBH models that used manually delineated crown area values. Among the tree species, the accuracy of DBH estimation for castor aralia seemed to be higher than for the other two species. Visually, castor aralia was relatively easier to distinguish in most cases. Therefore, manual tree crown delineation could be more accurate for this species than for the other two species. In the literature, field-measured tree crown and tree height values were used to develop the tree diameter estimation models [72,73,74]. RS data could improve the accuracy of these diameter distribution models.

4.4. Considerations for Forest Management

Our study explored the applicability of UAV-DAP for single-tree management purposes. Under single-tree management, identifying tree locations (e.g., Figure 6) and their stem sizes are important and challenging tasks for forest managers. For these purposes, UAV-DAP, having the ability to acquire high spatial and temporal resolution data, could be a useful data source especially where periodic monitoring to facilitate forest management is necessary for compartment-level forest areas.
Even though our classification results were lower than other studies using multispectral or hyperspectral data [25,26,32,53], we assumed that our results were reasonable at lower spectral bands. However, as indicated by the result of sub-compartment 59A, the results indicated that the timing of UAV-DAP flight missions plays an important role in classifying a forest canopy at the species level, especially when a UAV platform with an RGB camera is used. This issue could be overcome by determining the best season and timing for UAV-DAP data acquisition, which would help identify the high-value timber species and their locations, since the target species are deciduous broadleaf species with significant changes in leaf phenology, especially in the autumn. In addition, further inclusion of more spectral bands could improve the accuracy of the classification results. Further research attempts should be undertaken on these issues for single-tree management purposes.
One of the major problems of DBH estimation for high-value timber species is the automatic tree crown delineation accuracy. The lower accuracy in tree crown delineation could lead to significant errors in DBH estimation, since estimation of DBH relies on the crown area and tree height [73,74]. Previous studies also reported the same problem [25,39,69], which is an active area of research. However, we assumed that with forest canopy classification derived from tree location maps, visual interpretation of tree crowns on UAV-DAP orthophotographs would help determine the tree crown area that can be used for tree size estimation. The availability of tree location maps could help reduce the effort and time taken searching for trees within large forest areas. One of the possibilities for DBH estimation is the use of under-canopy UAV laser scanning [75]. Hyyppä et al. [75] applied under-canopy flying UAV laser scanning data to estimate DBH Values, reporting DBH RMSE values of 0.6 cm and 0.92 cm in sparse and obstructed plots, respectively. In addition, mobile laser scanning and personal laser scanning techniques could be alternatives to the DBH estimation method [76,77]. However, given the trade-offs between costs, time, and resolution, our methods presented in this study could be alternative sources of data that acquire individual tree information for sparsely distributed high-value timber species in mixed-wood forests.

5. Conclusions

In this study, we demonstrated the applicability of UAV-DAP and LiDAR data for estimation of individual tree spatial positions and DBH Values. We performed multiresolution segmentation of UAV-DAP orthophotographs, together with rasterized LiDAR CHM, in order to segment the forest canopy into individual tree crowns. We applied object-based image analysis and random forest classification techniques to classify the forest canopy into three high-value timber species, other broadleaf species, and conifer species. The results indicated overall accuracy values of 73% and 63% in sub-compartments 36B and 59A, respectively. The DBH estimation results showed high prediction accuracy when using a manually digitized tree crown area and LiDAR- and UAV-DAP-derived tree height values. The UAV-DAP data had comparable prediction accuracy to field-measured data and LiDAR data. The results of this study could be useful for forest managers when searching for high-value timber trees and estimating tree size in large mixed-wood forests.
Since our UAV-DAP data were taken once in the summer, the results should be generalized carefully with UAV-DAP data taken over different time periods and with different forest types. Further research attempts should be carried out with repeated UAV flight missions throughout spring, summer, and autumn to determine the best time window for identifying individual tree locations of high-value timber species. In addition, the combined used of terrestrial LiDAR, airborne LiDAR, and UAV-DAP data could be of benefit when estimating the DBH Values of individual trees, and should be analyzed further to estimate the stem sizes of high-value timber species.

Author Contributions

Formal analysis, writing—original draft preparation, K.T.M.; resource, supervision, writing—review and editing, T.O.; review and editing N.F., T.H., and J.M. All authors have read and agreed to the published version of the manuscript.

Funding

This research was funded by Japan Society for the Promotion of Science, Grants-in-Aid for Scientific Research grant numbers 16H04946 and 17H01516.

Acknowledgments

We would like to express our thanks to the technical staff of the University of Tokyo Hokkaido Forest—Kazunobu Iguchi, Shinya Inukai, Yoshikazu Takashima, Takashi Inoue, Yoshinori Eguchi, Masaki Tokuni, Satoshi Fukuoka, Haruki Sato, and Hitomi Ogawa—for their significant contributions to the field measurements and UAV data collection.

Conflicts of Interest

The authors declare no conflict of interest.

References

  1. Schulze, M.; Grogan, J.; Landis, R.M.; Vidal, E. How rare is too rare to harvest? Management challenges posed by timber species occurring at low densities in the Brazilian Amazon. For. Ecol. Manag. 2008, 256, 1443–1457. [Google Scholar] [CrossRef]
  2. Owari, T.; Okamura, K.; Fukushi, K.; Kasahara, H.; Tatsumi, S. Single-tree management for high-value timber species in a cool-temperate mixed forest in northern Japan. Int. J. Biodivers. Sci. Ecosyst. Serv. Manag. 2016, 12, 74–82. [Google Scholar] [CrossRef] [Green Version]
  3. Lutz, J.A.; Furniss, T.J.; Johnson, D.J.; Davies, S.J.; Allen, D.; Alonso, A.; Anderson-Teixeira, K.J.; Andrade, A.; Baltzer, J.; Kendall, M.L.; et al. Global importance of large-diameter trees. Glob. Ecol. Biogeogr. 2018, 27, 849–864. [Google Scholar] [CrossRef] [Green Version]
  4. Vandekerkhovea, K.; Vanhellemont, M.; Vrška, T.; Meyer, P.; Tabaku, V.; Thomaes, A.; Leyman, A.; De Keersmaeker, L.; Verheyen, K. Very large trees in a lowland old-growth beech (Fagus sylvatica L.) forest: Density, size, growth and spatial patterns in comparison to reference sites in Europe. For. Ecol. Manag. 2018, 417, 1–17. [Google Scholar] [CrossRef]
  5. Prates-Clark, C.D.C.; Saatchi, S.S.; Agosti, D. Predicting geographical distribution models of high-value timber trees in the Amazon Basin using remotely sensed data. Ecol. Model. 2008, 211, 309–323. [Google Scholar] [CrossRef]
  6. Grogan, J.; Blundell, A.G.; Landis, R.M.; Youatt, A.; Gullison, R.E.; Martinez, M.; Kómetter, R.; Lentini, M.; Rice, R.E.; Grogan, J.; et al. Over-harvesting driven by consumer demand leads to population decline: Big-leaf mahogany in South America. Conserv. Lett. 2009, 3, 12–20. [Google Scholar] [CrossRef]
  7. Grogan, J.; Jennings, S.B.; Landis, R.M.; Schulze, M.; Baima, A.M.V.; do Carmo A. Lopes, J.; Norghauer, J.M.; Oliveira, L.R.; Pantoja, F.; Pinto, D.; et al. What loggers leave behind: Impacts on big-leaf mahogany (Swietenia macrophylla) commercial populations and potential for post-logging recovery in the Brazilian Amazon. For. Ecol. Manag. 2008, 255, 269–281. [Google Scholar] [CrossRef]
  8. Khai, T.C.; Mizoueb, N.; Kajisa, T.; Ota, T.; Yoshida, S. Stand structure, composition and illegal logging in selectively logged production forests of Myanmar: Comparison of two compartments subject to different cutting frequency. Glob. Ecol. Conserv. 2016, 7, 132–140. [Google Scholar] [CrossRef] [Green Version]
  9. Bourland, N.; Kouadio, Y.L.; Lejeune, P.; Sonké, B.; Philippart, J.; Daïnou, K.; Fétéké, F.; Doucet, J.-L. Ecology of Pericopsis elata (Fabaceae), an endangered timber species in southeastern Cameroon. Biotropica 2012, 44, 840–847. [Google Scholar]
  10. Oosterbaan, A.; Hochbichler, E.; Nicolescu, V.N.; Spiecker, H. Silvicultural principles, goals and measures in growing valuable broadleaved tree species. Die Bodenkultur 2009, 60, 45–51. [Google Scholar]
  11. White, J.C.; Coops, N.C.; Wulder, M.A.; Vastaranta, M.; Hilker, T.; Tompalski, P. Remote sensing technologies for enhancing forest inventories: A review. Can. J. Remote Sens. 2016, 42, 619–641. [Google Scholar] [CrossRef] [Green Version]
  12. Wulder, M.A.; White, J.C.; Nelson, R.F.; Næsset, E.; Ørka, H.O.; Coops, N.C.; Hilker, T.; Bater, C.W.; Gobakken, T. Lidar sampling for large-area forest characterization: A review. Remote Sens. Environ. 2012, 121, 196–209. [Google Scholar] [CrossRef] [Green Version]
  13. Wulder, M.A.; Coops, N.C.; Hudak, A.T.; Morsdorf, F.; Nelson, R.; Newnham, G.; Vastaranta, M. Status and prospects for LiDAR remote sensing of forested ecosystems. Can. J. Remote Sens. 2013, 39, S1–S5. [Google Scholar] [CrossRef] [Green Version]
  14. Dandois, J.P.; Ellis, E.C. High spatial resolution three-dimensional mapping of vegetation spectral dynamics using computer vision. Remote Sens. Environ. 2013, 136, 259–276. [Google Scholar] [CrossRef] [Green Version]
  15. Verhoeven, G.; Doneus, M.; Briese, C.; Vermeulen, F. Mapping by matching: A computer vision-based approach to fast and accurate georeferencing of archaeological aerial photographs. J. Archaeol. Sci. 2012, 39, 2060–2070. [Google Scholar] [CrossRef]
  16. Nex, F.; Remondino, F. UAV for 3D mapping applications: A review. Appl. Geomat. 2014, 6, 1–15. [Google Scholar] [CrossRef]
  17. Goodbody, T.R.H.; Coops, N.C.; White, J.C. Digital aerial photogrammetry for updating area-based forest inventories: A review of opportunities, challenges, and future directions. Curr. For. Rep. 2019, 5, 55–75. [Google Scholar] [CrossRef] [Green Version]
  18. Iglhaut, J.; Cabo, C.; Puliti, S.; Piermattei, L.; O’Connor, J.; Rosette, J. Structure from motion photogrammetry in forestry: A review. Curr. For. Rep. 2019, 5, 155–168. [Google Scholar] [CrossRef] [Green Version]
  19. Bohlin, J.; Wallerman, J.; Fransson, J.E.S. Forest variable estimation using photogrammetric matching of digital aerial images in combination with a high-resolution DEM. Scand. J. For. Res. 2012, 27, 692–699. [Google Scholar] [CrossRef]
  20. Lisein, J.; Pierrot-Deseilligny, M.; Bonnet, S.; Lejeune, P. A photogrammetric workflow for the creation of a forest canopy height model from small unmanned aerial system imagery. Forests 2013, 4, 922–944. [Google Scholar] [CrossRef] [Green Version]
  21. Jayathunga, S.; Owari, T.; Tsuyuki, S. Evaluating the performance of photogrammetric products using fixed-wing UAV imagery over a mixed conifer-broadleaf forest: Comparison with airborne laser scanning. Remote Sens. 2018, 10, 187. [Google Scholar] [CrossRef] [Green Version]
  22. White, J.C.; Wulder, M.A.; Vastaranta, M.; Coops, N.C.; Pitt, D.; Woods, M. The utility of image-based point clouds for forest inventory: A comparison with airborne laser scanning. Forests 2013, 4, 518–536. [Google Scholar] [CrossRef] [Green Version]
  23. Wallace, L.; Lucieer, A.; Malenovskỳ, Z.; Turner, D.; Vopěnka, P. Assessment of forest structure using two UAV techniques: A comparison of airborne laser scanning and structure from motion (SfM) point clouds. Forests 2016, 7, 62. [Google Scholar] [CrossRef] [Green Version]
  24. Thiel, C.; Schmullius, C. Comparison of UAV photograph-based and airborne lidar-based point clouds over forest from a forestry application perspective. Int. J. Remote Sens. 2017, 38, 2411–2426. [Google Scholar] [CrossRef]
  25. Dalponte, M.; Frizzera, L.; Gianelle, D. Individual tree crown delineation and tree species classification with hyperspectral and LiDAR data. PeerJ 2019, 6, e6227. [Google Scholar] [CrossRef]
  26. Franklin, S.E.; Ahmed, O.S. Deciduous tree species classification using object-based analysis and machine learning with unmanned aerial vehicle multispectral data. Int. J. Remote Sens. 2018, 39, 5236–5245. [Google Scholar] [CrossRef]
  27. Dalponte, M.; Ørka, H.O.; Gobakken, T.; Gianelle, D.; Næsset, E. Tree species classification in boreal forests with hyperspectral data. IEEE Trans. Geosci. Remote Sens. 2012, 51, 2632–2645. [Google Scholar] [CrossRef]
  28. Yao, W.; Krzystek, P.; Heurich, M. Tree species classification and estimation of stem volume and DBH based on single tree extraction by exploiting airborne full-waveform LiDAR data. Remote Sens. Environ. 2012, 123, 368–380. [Google Scholar] [CrossRef]
  29. Marselis, S.M.; Tang, H.; Armston, J.D.; Calders, K.; Labrière, N.; Dubayah, R. Distinguishing vegetation types with airborne waveform LiDAR data in a tropical forest-savanna mosaic: A case study in Lopé National Park, Gabon. Remote Sens. Environ. 2018, 216, 626–634. [Google Scholar] [CrossRef]
  30. Cao, L.; Coops, N.C.; Innes, J.L.; Dai, J.; Ruan, H.; She, G. Tree species classification in subtropical forests using small-footprint full-waveform LiDAR data. Int. J. Appl. Earth Obs. Geoinf. 2016, 49, 39–51. [Google Scholar] [CrossRef]
  31. Dalponte, M.; Bruzzone, L.; Gianelle, D. Tree species classification in the Southern Alps based on the fusion of very high geometrical resolution multispectral/hyperspectral images and LiDAR data. Remote Sens. Environ. 2012, 123, 258–270. [Google Scholar] [CrossRef]
  32. Matsuki, T.; Yokoya, N.; Iwasaki, A. Hyperspectral tree species classification of Japanese complex mixed forest with an aid of LiDAR data. IEEE J. Sel. Top. Appl. Earth Obs. Remote Sens. 2015, 8, 2177–2187. [Google Scholar] [CrossRef]
  33. Shi, Y.; Wang, T.; Skidmore, A.K.; Heurich, M. Improving LiDAR-based tree species mapping in Central European mixed forests using multi-temporal digital aerial colour-infrared photographs. Int. J. Appl. Earth Obs. Geoinf. 2020, 84, 101970. [Google Scholar] [CrossRef]
  34. Nguyen, H.M.; Demir, B.; Dalponte, M. A weighted SVM-based approach to tree species classification at individual tree crown level using LiDAR data. Remote Sens. 2019, 11, 2948. [Google Scholar] [CrossRef] [Green Version]
  35. Dalponte, M.; Frizzera, L.; Ørka, H.O.; Gobakken, T.; Næsset, E.; Gianelle, D. Predicting stem diameters and aboveground biomass of individual trees using remote sensing data. Ecol. Indic. 2017, 85, 367–376. [Google Scholar] [CrossRef]
  36. Hyyppä, J.; Yu, X.; Hyyppä, H.; Vastaranta, M.; Holopainen, M.; Kukko, A.; Kaartinen, H.; Jaakkola, A.; Vaaja, M.; Koskinen, J.; et al. Advances in forest inventory using airborne laser scanning. Remote Sens. 2012, 4, 1190–1207. [Google Scholar] [CrossRef] [Green Version]
  37. Jayathunga, S.; Owari, T.; Tsuyuki, S. The use of fixed–wing UAV photogrammetry with LiDAR DTM to estimate merchantable volume and carbon stock in living biomass over a mixed conifer–broadleaf forest. Int. J. Appl. Earth Obs. Geoinf. 2018, 73, 767–777. [Google Scholar] [CrossRef]
  38. Guerra-Hernández, J.; Cosenza, D.N.; Rodriguez, L.C.E.; Silva, M.; Tomé, M.; Díaz-Varela, R.A.; González-Ferreiro, E.N.; Cosenza, D.; Rodriguez, L.C.E.; Silva, M.; et al. Comparison of ALS- and UAV(SfM)-derived high-density point clouds for individual tree detection in Eucalyptus plantations. Int. J. Remote Sens. 2018, 39, 5211–5235. [Google Scholar] [CrossRef]
  39. Kaartinen, H.; Hyyppä, J.; Yu, X.; Vastaranta, M.; Hyyppä, H.; Kukko, A.; Holopainen, M.; Heipke, C.; Hirschmugl, M.; Morsdorf, F.; et al. An international comparison of individual tree detection and extraction using airborne laser scanning. Remote Sens. 2012, 4, 950–974. [Google Scholar] [CrossRef] [Green Version]
  40. Vauhkonen, J.; Ene, L.; Gupta, S.; Heinzel, J.; Holmgren, J.; Pitkänen, J.; Solberg, S.; Wang, Y.; Weinacker, H.; Hauglin, K.M.; et al. Comparative testing of single-tree detection algorithms under different types of forest. Forestry 2012, 85, 27–40. [Google Scholar] [CrossRef] [Green Version]
  41. González-Ferreiro, E.; Diéguez-Aranda, U.; Fernández, L.B.-; Buján, S.; Barbosa, M.; Suárez, J.C.; Bye, I.J.; Miranda, D. A mixed pixel- and region-based approach for using airborne laser scanning data for individual tree crown delineation in Pinus radiata D. Don plantations. Int. J. Remote Sens. 2013, 34, 7671–7690. [Google Scholar] [CrossRef]
  42. Kukunda, C.B.; Duque-Lazo, J.; González-Ferreiro, E.; Thaden, H.; Kleinn, C. Ensemble classification of individual Pinus crowns from multispectral satellite imagery and airborne LiDAR. Int. J. Appl. Earth Obs. Geoinf. 2018, 65, 12–23. [Google Scholar] [CrossRef]
  43. Wang, Y.; Hyyppa, J.; Liang, X.; Kaartinen, H.; Yu, X.; Lindberg, E.; Holmgren, J.; Qin, Y.; Mallet, C.; Ferraz, A.; et al. International benchmarking of the individual tree detection methods for modeling 3-D canopy structure for silviculture and forest ecology using airborne laser scanning. IEEE Trans. Geosci. Remote Sens. 2016, 54, 5011–5027. [Google Scholar] [CrossRef] [Green Version]
  44. Owari, T.; Matsui, M.; Inukai, H.; Kaji, M. Stand structure and geographic conditions of natural selection forests in central Hokkaido, Northern Japan. J. For. Plan. 2011, 16, 207–214. [Google Scholar]
  45. Yamamoto, H.; Nagumo, H.; Watanabe, S. The selection cutting system of high valued natural hardwoods: A new method of managing natural forests. J. Jpn. For. Soc. 1989, 17, 1–9, (In Japanese with English summary). [Google Scholar]
  46. McGaughey, R.J. FUSION/LDV: Software for LiDAR Data Analysis and Visualization; USDA Forest Service Pacific Northwest Research Station: Seattle, WA, USA, 2018.
  47. Agisoft. Agisoft PhotoScan User Manual: Professional edition, Version 1.4; Agisoft: St. Petersburg, Russia, 2018. [Google Scholar]
  48. Moe, K.T.; Owari, T.; Furuya, N.; Hiroshima, T. Comparing individual tree height information derived from field surveys, LiDAR and UAV-DAP for high-value tmber species in northern Japan. Forests 2020, 11, 223. [Google Scholar] [CrossRef] [Green Version]
  49. Baena, S.; Moat, J.; Whaley, O.; Boyd, D.S. Identifying species from the air: UAVs and the very high resolution challenge for plant conservation. PLoS ONE 2017, 12, e0188714. [Google Scholar] [CrossRef] [Green Version]
  50. Apostol, B.; Petrila, M.; Lorenţ, A.; Ciceu, A.; Gancz, V.; Badea, O. Species discrimination and individual tree detection for predicting main dendrometric characteristics in mixed temperate forests by use of airborne laser scanning and ultra-high-resolution imagery. Sci. Total Environ. 2020, 698, 134074. [Google Scholar] [CrossRef]
  51. Blaschke, T. Object based image analysis for remote sensing. ISPRS J. Photogramm. Remote Sens. 2010, 65, 2–16. [Google Scholar] [CrossRef] [Green Version]
  52. Lisein, J.; Michez, A.; Claessens, H.; Lejeune, P. Discrimination of deciduous tree species from time series of unmanned aerial system imagery. PLoS ONE 2015, 10, e0141006. [Google Scholar] [CrossRef]
  53. Michez, A.; Piégay, H.; Lisein, J.; Claessens, H.; Lejeune, P. Classification of riparian forest species and health condition using multi-temporal and hyperspatial imagery from unmanned aerial system. Environ. Monit. Assess. 2016, 188, 1–19. [Google Scholar] [CrossRef] [PubMed] [Green Version]
  54. Alonzo, M.; Andersen, H.E.; Morton, D.C.; Cook, B.D. Quantifying boreal forest structure and composition using UAV structure from motion. Forests 2018, 9, 119. [Google Scholar] [CrossRef] [Green Version]
  55. Singh, M.; Evans, D.; Tan, B.S.; Nin, C.S. Mapping and characterizing selected canopy tree species at the Angkor world heritage site in Cambodia using aerial data. PLoS ONE 2015, 10, e0121558. [Google Scholar] [CrossRef] [PubMed]
  56. Ma, L.; Cheng, L.; Li, M.; Liu, Y.; Ma, X. Training set size, scale, and features in Geographic Object-Based Image Analysis of very high resolution unmanned aerial vehicle imagery. ISPRS J. Photogramm. Remote Sens. 2015, 102, 14–27. [Google Scholar] [CrossRef]
  57. Heinzel, J.N.; Weinacker, H.; Koch, B. Full automatic detection of tree species based on delineated single tree crowns—A data fusion approach for airborne laser scanning data and aerial photographs. In Proceedings of the Silvilaser, Edinburgh, UK, 17–19 September 2008. [Google Scholar]
  58. Immitzer, M.; Atzberger, C.; Koukal, T. Tree species classification with Random Forest using very high spatial resolution 8-band WorldView-2 satellite data. Remote Sens. 2012, 4, 2661–2693. [Google Scholar] [CrossRef] [Green Version]
  59. Rodriguez-Galiano, V.F.; Ghimire, B.; Rogan, J.; Chica-Olmo, M.; Rigol-Sanchez, J.P. An assessment of the effectiveness of a random forest classifier for land-cover classification. ISPRS J. Photogramm. Remote Sens. 2012, 67, 93–104. [Google Scholar] [CrossRef]
  60. Belgiu, M.; Drăgu, L. Random forest in remote sensing: A review of applications and future directions. ISPRS J. Photogramm. Remote Sens. 2016, 114, 24–31. [Google Scholar] [CrossRef]
  61. RColorBrewer, S.; Liaw, M.A. Package “RandomForest”; University of California: Berkeley, CA, USA, 2018. [Google Scholar]
  62. R Core Team, R. The R Project for Statistical Computing; R Foundation for Statistical Computing: Vienna, Austria, 2019. [Google Scholar]
  63. Yu, X.; Hyyppä, J.; Vastaranta, M.; Holopainen, M.; Viitala, R. Predicting individual tree attributes from airborne laser point clouds based on the random forests technique. ISPRS J. Photogramm. Remote Sens. 2011, 66, 28–37. [Google Scholar] [CrossRef]
  64. Iizuka, K.; Yonehara, T.; Itoh, M.; Kosugi, Y. Estimating tree height and diameter at breast height (DBH) from digital surface models and orthophotos obtained with an unmanned aerial system for a Japanese Cypress (Chamaecyparis obtusa) forest. Remote Sens. 2018, 10, 13. [Google Scholar] [CrossRef] [Green Version]
  65. Chen, Q.; Gong, P.; Baldocchi, D.; Tian, Y.Q. Estimating basal area and stem volume for individual trees from LiDAR data. Photogramm. Eng. Remote Sens. 2007, 73, 1355–1365. [Google Scholar] [CrossRef] [Green Version]
  66. Dalponte, M.; Bruzzone, L.; Gianelle, D. A system for the estimation of single-tree stem diameter and volume using multireturn LIDAR data. IEEE Trans. Geosci. Remote Sens. 2011, 49, 2479–2490. [Google Scholar] [CrossRef]
  67. Akaike, H. Information theory and an extension of the maximum likelihood principle. In Proceedings of the 2nd International Symposium on Information Theory, Tsahkadsor, Armenia, 2–8 September 1971; Petrov, B.N., Caski, F., Eds.; Akademiai Kiado: Budapest, Hungary, 1973; pp. 267–281. [Google Scholar]
  68. Kock, N.; Lynn, G.S. Lateral collinearity and misleading results in variance-based SEM: An illustration and recommendations. J. Assoc. Inf. Syst. 2012, 13, 546–580. [Google Scholar] [CrossRef] [Green Version]
  69. Nuijten, R.J.G.; Coops, N.C.; Goodbody, T.R.H.; Pelletier, G. Examining consistency of individual tree segmentation on deciduous stands using digital aerial photogrammetry (DAP) and unmanned aerial systems (UAS). Remote Sens. 2019, 11, 739. [Google Scholar] [CrossRef] [Green Version]
  70. Alonzo, M.; Morton, D.C.; Cook, B.D.; Andersen, H.E.; Babcock, C.; Pattison, R. Patterns of canopy and surface layer consumption in a boreal forest fire from repeat airborne lidar. Environ. Res. Lett. 2017, 12, 065004. [Google Scholar] [CrossRef]
  71. Jayathunga, S.; Owari, T.; Tsuyuki, S.; Hirata, Y. Potential of UAV photogrammetry for characterization of forest canopy structure in uneven-aged mixed conifer–broadleaf forests. Int. J. Remote Sens. 2020, 41, 53–73. [Google Scholar] [CrossRef]
  72. Verma, N.K.; Lamb, D.W.; Reid, N.; Wilson, B. An allometric model for estimating DBH of isolated and clustered Eucalyptus trees from measurements of crown projection area. For. Ecol. Manag. 2014, 326, 125–132. [Google Scholar] [CrossRef]
  73. Jucker, T.; Caspersen, J.J.; Chave, J.; Antin, C.; Barbier, N.; Bongers, F.; Dalponte, M.; van Ewijk, K.Y.; Forrester, D.I.; Haeni, M.; et al. Allometric equations for integrating remote sensing imagery into forest monitoring programmes. Glob. Chang. Biol. 2017, 23, 177–190. [Google Scholar] [CrossRef]
  74. Hulshof, C.M.; Swenson, N.G.; Weiser, M.D. Tree height-diameter allometry across the United States. Ecol. Evol. 2015, 5, 1193–1204. [Google Scholar] [CrossRef]
  75. Hyyppä, E.; Hyyppä, J.; Hakala, T.; Kukko, A.; Wulder, M.A.; White, J.C.; Pyörälä, J.; Yu, X.; Wang, Y.; Virtanen, J.P.; et al. Under-canopy UAV laser scanning for accurate forest field measurements. ISPRS J. Photogramm. Remote Sens. 2020, 164, 41–60. [Google Scholar] [CrossRef]
  76. Bauwens, S.; Bartholomeus, H.; Calders, K.; Lejeune, P. Forest inventory with terrestrial LiDAR: A comparison of static and hand-held mobile laser scanning. Forests 2016, 7, 127. [Google Scholar] [CrossRef] [Green Version]
  77. Chen, S.; Liu, H.; Feng, Z.; Shen, C.; Chen, P. Applicability of personal laser scanning in forestry inventory. PLoS ONE 2019, 14, e0211392. [Google Scholar] [CrossRef] [PubMed]
Figure 1. Location of the study area. (a) The University of Tokyo Hokkaido Forest. (b) Sub-compartment 36B and 59A. (c) Measured trees in sub-compartment 36B. (d) Measured trees in sub-compartment 59A.
Remotesensing 12 02865 g001
Figure 2. Correlations between crown areas derived from field measurements, manual delineation, and multiresolution segmentation of UAV orthophotographs. CA represents crown area. The first, second, and third row represent monarch birch, castor aralia, and Japanese oak, respectively. RS-derived CA represents CA derived from multiresolution segmentation.
Remotesensing 12 02865 g002
Figure 3. Individual tree crown results derived from multiresolution segmentation for three high-value timber species: (a) monarch birch, (b) castor aralia, and (c) Japanese oak in sub-compartment 36B; (d) monarch birch, (e) castor aralia, and (f) Japanese oak in sub-compartment 59A.
Remotesensing 12 02865 g003
Figure 4. Species separability boxplots for classification of the forest canopy in sub-compartment 36B.
Remotesensing 12 02865 g004
Figure 5. Species separability boxplots for classification of the forest canopy in sub-compartment 59A.
Remotesensing 12 02865 g005
Figure 6. Individual tree crowns derived from the RF classification, where each tree crown also indicates the individual tree’s spatial position: (a) sub-compartment 36B and (b) sub-compartment 59A.
Remotesensing 12 02865 g006
Figure 7. Observed and predicted DBH Values for monarch birch (first row), castor aralia (middle row), and Japanese oak (third row).
Remotesensing 12 02865 g007
Table 1. Summary of the statistics for field-measured trees.
DBH (cm)Height (m)Crown Area (m2)
Mean (SD)Min–MaxMean (SD)Min–MaxMean (SD)Min–Max
Monarch birch
(n = 77)
60.1 (10.1)41.8–90.625.4 (2.7)20.9–32.8182.8 (63.1)69.5–366.1
Castor aralia
(n = 73)
59.3 (12.9)44.0–94.423.4 (3.1)14.1–29.7101.9 (44.3)37.4–251.0
Japanese oak
(n = 63)
74.4 (14.1)44.2–111.224.7 (2.6)20.4–30.1158.6 (55.1)72.7–305.3
Note: SD, min, and max stand for the standard deviation, minimum, and maximum, respectively; DBH, diameter at breast height.
Table 2. Light detection and ranging (LiDAR) flight parameters.
ParametersDescription
Flying speed (km/h)140.4
Flying height (m)600
Course overlap (%)50
Beam divergence (mrad)0.16
Pulse rate (kHz)100
Scan angle (°)±30
Point density (points/m2)16.07
Table 3. Unmanned aerial vehicle (UAV) flight parameters.
ParametersDescription
Flying height (m)120
Ground sampling distance (cm/pixel)2.3
Longitudinal overlap (%)80
Lateral overlap (%)80
Table 4. Spectral, textural, and structural variables extracted from each tree crown polygon.
Variables NamesFormula
(for Spectral Variables)
Spectral variables
Mean value of R, G, and B R ¯ , G ¯ , B ¯
Sum of mean R, G, and B R ¯ + G ¯ + B ¯
Normalized R= R ¯ /( R ¯ + G ¯ + B ¯ )
Normalized G= G ¯ /( R ¯ + G ¯ + B ¯ )
Normalized B= B ¯ /( R ¯ + G ¯ + B ¯ )
Mean brightness= ( R ¯ + G ¯ + B ¯ )/3
Normalized Green–Red Vegetation Index (NGRVI)= ( G ¯ R ¯ )/( G ¯ + R ¯ )
Normalized Red–Blue Vegetation Index (NRBVI)= ( R ¯ B ¯ )/( R ¯ + B ¯ )
Normalized Green–Blue Vegetation Index (NGBVI)= ( G ¯ B ¯ )/( G ¯ + B ¯ )
Textural Variables (Grey Level Co-occurrence Matrix (GLCM))
Homogeneity, standard deviation, mean, variance, contrast, dissimilarity, entropy
Structural variables
Maximum height (H-max), mean H, percentile height of 5%, 10–99% (H05, H10–H99), intensity at different H fractions (Int05, Int10–Int99), crown area
Note: R, G, and B represent red, green, and blue, respectively.
Table 5. Confusion matrix for the random forest (RF) classification of broadleaf species into high-value timber species and other broadleaf species based on 75 validation crowns from known tree positions in sub-compartment 36B.
Classified CrownsReference Crowns UA/PA %
Monarch BirchCastor AraliaJapanese OakOther BroadleafConifer
Monarch birch8212157/73
Castor aralia01402182/78
Japanese oak10103071/83
Other broadleaf11113176/62
Conifer11011077/77
Overall accuracy 73 % (kappa = 0.66)
UA and PA stand for user’s accuracy and producer’s accuracy, respectively.
Table 6. Confusion matrix for RF classification of broadleaf species into high-value timber species and other broadleaf species based on 58 validation crowns from known tree positions in sub-compartment 59A.
Classified CrownsReference Crowns UA/PA %
Monarch BirchCastor AraliaJapanese OakOther BroadleafConifer
Monarch birch7000187/58
Castor aralia0602167/67
Japanese oak0056045/83
Other broadleaf1203143/25
Conifer41111670/32
Overall accuracy 63 % (kappa = 0.53)
UA and PA stand for user’s accuracy and producer’s accuracy, respectively.
Table 7. DBH estimation models.
SpeciesModelParameter EstimatesR2 (Marginal)RMSE (cm)
Field
Monarch birchIntercept
CAf
Field Height
33.38 ***
0.08 ***
0.45
0.328.90
Castor araliaIntercept
CAf
Field Height
16.03 *
0.13 ***
1.29 ***
0.4710.57
Japanese oakIntercept
CAf
Field Height
34.01 **
0.12 ***
0.92
0.3214.01
LiDAR
Monarch birchIntercept
CAD
H-max
8.75
0.10 ***
1.29 ***
0.597.05
Castor araliaIntercept
CAD
H99
−11.83
0.23 ***
2.34 ***
0.707.39
Japanese oakIntercept
CAD
H99 H30
22.43
0.17 ***
3.18 ***−3.06 ***
0.5411.87
UAV-DAP
Monarch birchIntercept
CAD
H99
16.97 *
0.11 ***
0.97 ***
0.567.30
Castor araliaIntercept
CAD
H99
0.89
0.22 ***
1.81 ***
0.608.51
Japanese oakIntercept
CAD
H99
24.51
0.20 ***
1.07
0.4013.29
Note: CAf represents field-measured crown area and CAD represents manually digitized crown area, respectively, for UAV orthophotographs. Significance code: *** p < 0.001, ** p < 0.01, * p < 0.05.

