Article

NOAA Satellite Soil Moisture Operational Product System (SMOPS) Version 3.0 Generates Higher Accuracy Blended Satellite Soil Moisture

1
Earth System Science Interdisciplinary Center (ESSIC), University of Maryland, 5825 University Research Court suite, College Park, MD 20740, USA
2
NOAA NESDIS Center for Satellite Applications and Research, College Park, MD 20740, USA
3
Laboratory of Environmental Model & Data Optima, Laurel, MD 20740, USA
*
Author to whom correspondence should be addressed.
Remote Sens. 2020, 12(17), 2861; https://doi.org/10.3390/rs12172861
Submission received: 16 July 2020 / Revised: 14 August 2020 / Accepted: 1 September 2020 / Published: 3 September 2020

Abstract

:
Soil moisture plays a vital role for the understanding of hydrological, meteorological, and climatological land surface processes. To meet the need of real time global soil moisture datasets, a Soil Moisture Operational Product System (SMOPS) has been developed at National Oceanic and Atmospheric Administration to produce a one-stop shop for soil moisture observations from all available satellite sensors. What makes the SMOPS unique is its near real time global blended soil moisture product. Since the first version SMOPS publicly released in 2010, the SMOPS has been updated twice based on the users’ feedbacks through improving retrieval algorithms and including observations from new satellite sensors. The version 3.0 SMOPS has been operationally released since 2017. Significant differences in climatological averages lead to remarkable distinctions in data quality between the newest and the older versions of SMOPS blended soil moisture products. This study reveals that the SMOPS version 3.0 has overwhelming advantages of reduced data uncertainties and increased correlations with respect to the quality controlled in situ measurements. The new version SMOPS also presents more robust agreements with the European Space Agency’s Climate Change Initiative (ESA_CCI) soil moisture datasets. With the higher accuracy, the blended data product from the new version SMOPS is expected to benefit the hydrological, meteorological, and climatological researches, as well as numerical weather, climate, and water prediction operations.

Graphical Abstract

1. Introductions

Soil moisture is one of the most important factors to impact land-atmosphere interactions through controlling water and energy fluxes [1]. Therefore, it is a significant variable used in various weather, climate, and hydrology models. Ground stations may provide good quality in situ soil moisture measurements, but they are constrained by insufficient coverage at large scales [2]. Microwave satellite remote sensing has opened a new era for achieving spatially and temporally continuous soil moisture observations since the 1970s [3,4,5,6,7].
The microwave emission is primarily affected by the soil dielectric constant that links soil emissivity and soil moisture [8,9]. This theory offers the opportunity to retrieve soil moisture in a relatively direct manner through X-band (8.0–12.0 GHZ), C-band (4.0–8.0 GHZ), and L-band (1.0–2.0 GHZ) measurements. Specifically, the passive microwave remote sensing technique uses a radiometer to receive the land surface emission that is affected by the emissivity and physical temperature of the Earth. Yet, active microwave radars sense the land surface backscatter through transmitting an electromagnetic pulse. Based on the solid radiation transfer physics, a variety of microwave soil moisture data products have been produced in the past couple decades [1,10,11,12,13].
Considering that the individual retrievals have different data quality, archiving file formats and spatial resolutions, as well as a user request from the National Weather Service (NWS)-National Centers for Environmental Predictions (NCEP) of National Oceanic and Atmospheric Administration (NOAA), a Soil Moisture Operational Product System (SMOPS) has been developed at NOAA′s National Environmental Satellite, Data, and Information Service (NESDIS) to produce a one-stop shop for all soil moisture products from the available soil moisture capable microwave satellite sensors [4,5,6,14,15]. The SMOPS blended soil moisture data, including 6-h (00Z, 06Z, 12Z, and 18Z) and daily data files, have been operationally available to users since 2010 [15]. The SMOPS blended product is unique in that it provides global spatial coverage of soil moisture in near real time [14], which makes it useful to improve drought monitoring capability [16] and enhance numerical weather forecast accuracy [17]. With benefits of assimilating the SMOPS blended observations, land surface model, which is an important component of hydrologic, atmospheric, and climate models, shows remarkable improvements in comparison with the individual soil moisture data assimilations [14,18].
The SMOPS has been updated for soil moisture observations from new satellite sensors and retirement of older satellite platforms. The newest version 3.0 SMOPS takes advantage of four advances in soil moisture data product generation. The first advance was the passive microwave remote sensing approach that has been developed with the ground-, airborne-, and spaceborne-based experimental heritage [1]. The prominent feature of new generation microwave satellites is a larger antenna reflector for passive radiometers (Table 1), which allows achieving finer spatial resolution and higher coverage on the ground brightness temperature [19]. To overcome C-band sensor weaknesses including shallower penetration depth and higher attenuation in the presence of vegetation, L-band microwave radiometers on Soil Moisture Ocean Salinity (SMOS) and Soil Moisture Active Passive (SMAP) satellites are specifically designed to sense soil moisture [1,12]. In addition, radio-frequency interference (RFI) in the C-band and L-band context has been brought to the forefront. The Advanced Microwave Scanning Radiometer-2 (AMSR-2) onboard the Global Change Observation Mission 1st-Water (GCOM-W) satellite has an additional 7.3 GHZ channel to detect and mitigate the RFI impact [19]. Similarly, RFI probability and characterization were developed to detect, localize, mitigate, and monitor the impacts on SMOS and SMAP measurements [20,21].
The second advance benefited from the Advanced Scatterometer (ASCAT), the operational Meteorological Operation (MetOp) satellite system of European Organization for the Exploitation of Meteorological Satellites (EUMETSAT), offers reliable and continuous long-term soil moisture datasets [13]. The MetOp-A, -B, and -C were launched in October 2006, September 2012, and November 2018, respectively. Given the 5.3 GHz frequency, ASCAT sensors are able to track soil moisture changes with active measurements. The three antennas make ASCAT backscatter measurements at two different incidence angles, which can correct vegetation effects and in turn improve soil moisture retrieval [13]. Based on the long-term active microwave satellite heritage, calibrations of backscatter measurements have been well conducted to make ASCAT more suitable to measure soil moisture [23,24].
The third advance was the availability of more reliable ancillary data sets used in the passive microwave soil moisture retrieval (PSCR) algorithm. The brightness temperature from a single microwave channel is converted to emissivity, which is further corrected for vegetation and surface roughness effect [6,25]. The vegetation optical depth (τ) highly relies on vegetation water content (ω) that is traditionally estimated using static Advanced Very High Resolution Radiometer (AVHRR)-Normalized Difference Vegetation Index (NDVI). However, the static NDVI lacks the ability to present a near real time land surface condition and vegetation status [26,27]. The real time Suomi National Polar-orbiting Partnership (S-NPP) vegetation index maps have thus been used in the new version SMOPS to replace the AVHRR-NDVI multiyear climatologies [6]. The regression parameter (b) in the linear relationship between τ and ω is associated with land cover types. In the current PSCR implementation, the b value is simply defined as a universal constant across different land cover types [25]. The development of S-NPP global land cover map using support vector machines [17] offers a great opportunity to capture more accurate surface type information for the PSCR [6].
The fourth advance was the higher quality soil moisture climatology of the Global Land Data Assimilation System (GLDAS). Individual soil moisture retrievals from different sensors have their own climatology. Therefore, they were harmonized to GLDAS soil moisture climatology using the cumulative distribution function (CDF)-matching method [28] (Reichle and Koster, 2004). Regardless of the distribution shapes, the CDF matching approach corrects all quantile-dependent biases, and thus the quality of GLDAS soil moisture simulations have great influences on SMOPS performance [29]. With suffering against forcing data quality and static variable maps such as vegetation index and surface albedo [26], previous soil moisture simulations from GLDAS present a relative drier pattern. Consequently, older version SMOPS blended soil moisture observations tend to underestimate soil moisture values correspondingly (Figure 1), although their global wetness and dryness distributions are reasonable [5]. With observation-based downward radiation and precipitation forcing data and the optimized analyses from atmospheric data assimilation systems, the GLDAS currently incorporates several satellite hydrological observations including leaf area index, soil moisture, snow cover, and snow water equivalent to archive the best available long-term soil moisture simulations [30].
With efforts over more than a decade, three version SMOPS data products have been generated at NOAA-NESDIS. The new generation SMOPS is expected to archive a more accurate daily blended soil moisture for the users. This study thus aims at providing the state-of-the-art of the newest version daily SMOPS blended soil moisture data product and investigating the primary differences between the newest version and the older versions. Results of this study will provide a foundation for the ongoing SMOPS development and comprehensively reprocessing the SMOPS soil moisture data product.

2. Datasets and Methods
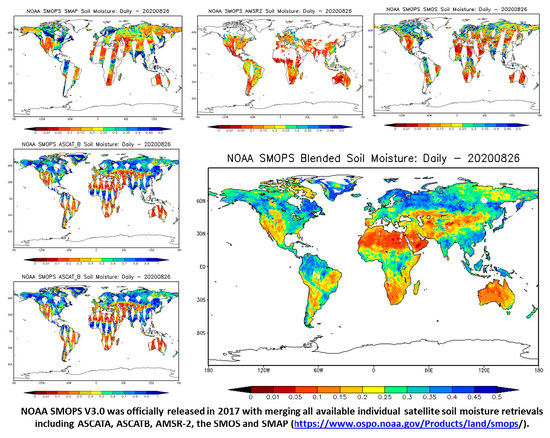
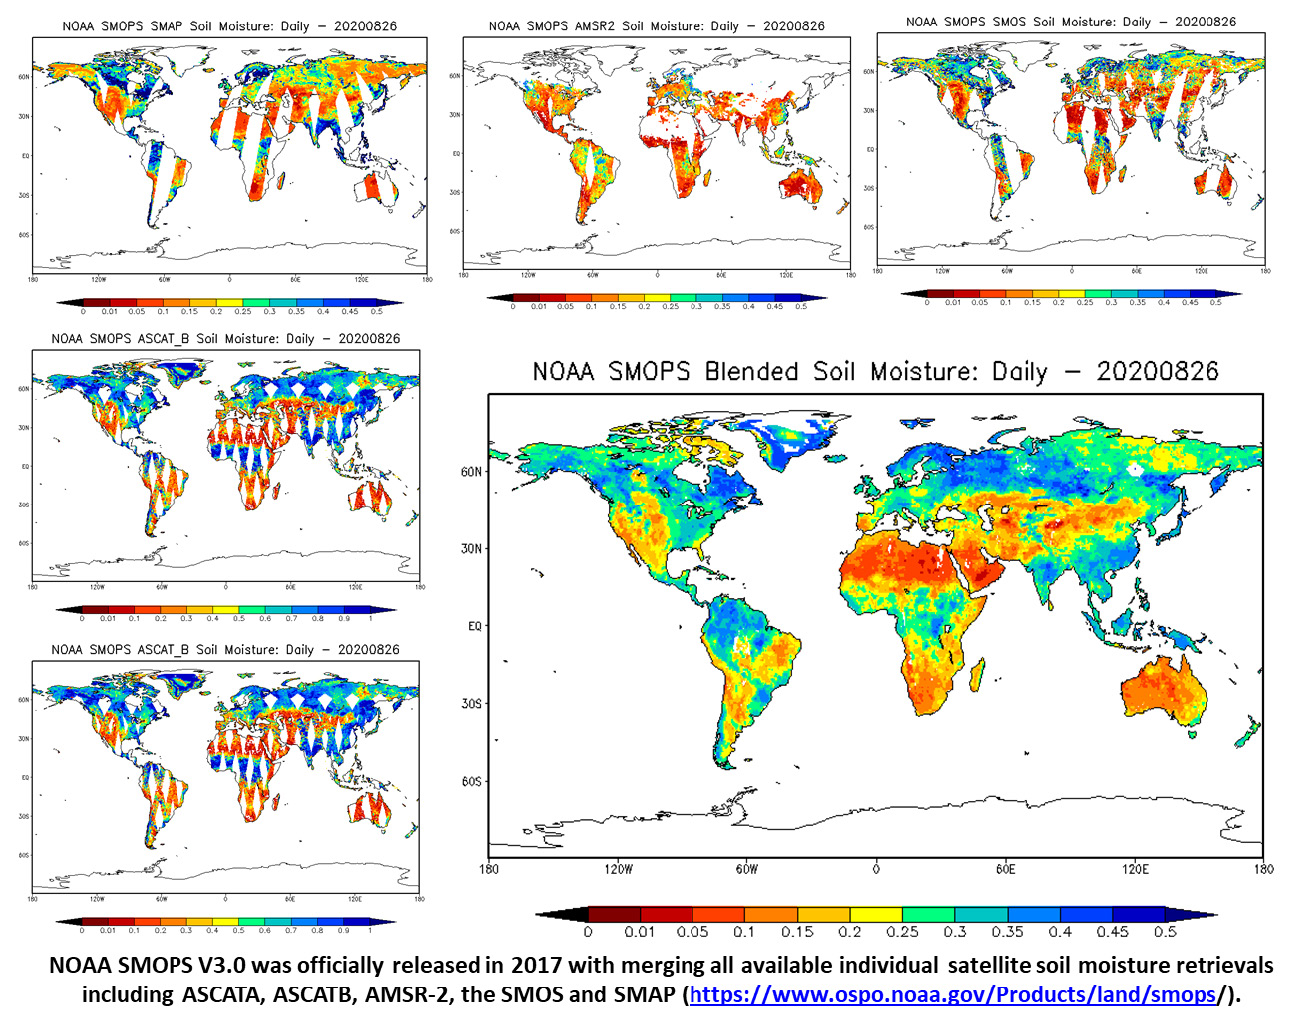
2.1. SMOPS

The SMOPS was developed by the NOAA-NESDIS Center for Satellite Applications and Research (STAR) and operated at NOAA-NESDIS Office of Satellite and Product Operations (OSPO). To increase the temporal and spatial coverage of soil moisture product for NOAA and other operational users, SMOPS also provides a blended data layer that combines individual soil moisture retrievals from each of the available satellite sensors [4,5,6,14,15]. SMOPS has been operationally running at OSPO since 2010. In the first version, soil moisture observations from WindSat, ASCAT onboard the MetOp-A satellite, and AMSR-E on the Earth Observation Satellite (EOS) Aqua operated by the National Aeronautics and Space Administration (NASA) were used to produce the blended datasets (Table 1). Compared to version 1.0, SMOPS was improved in version 2.0 in the following ways: (1) With the SMOS product officially available, SMOPS started to merge SMOS soil moisture retrievals in 2010; (2) soil moisture observations from the ASCAT sensor onboard the MetOp-B satellite was ingested in the system; (3) WindSat soil moisture was excluded and replaced by the AMSR-2 in the SMOPS (Table 1).
The new generation (version 3.0) of SMOPS was developed in 2016 and officially released in 2017 with merging all available individual satellite soil moisture retrievals including ASCATA, ASCATB, AMSR-2, the SMOS, and SMAP (Table 1). The SMOPS produced a six-hourly product with 3-h latency and a daily product with 6-h latency for operational uses [15]. Considering that SMAP and SMOS official products are not meeting the latency requirements (2–6 h generally) for the operational users, SMOPS version 3.0 retrieves near real time (NRT) SMAP and SMOS soil moisture data products were used to reduce the time latency using the NRT Level-1 brightness temperature observations [6]. Figure 2 shows the process flow of producing the daily SMOPS blended soil moisture data product. SMOPS version 3.0 generates two sets of daily blended data including NRT and archived global gridded products. The NRT daily SMOPS was operationally generated at 00:00 UTC everyday with merging all soil moisture retrievals acquired during the past 24 h, while the archived daily SMOPS has two-day latency. When the SMOPS retrieval mode is turned on, the ancillary data will be used in the newest version SMOPS soil moisture retrieval algorithm, which include the surface temperature data from the operational Global Forecast System (GFS) and the land cover and weekly NDVI maps from S-NPP Visible Infrared Imaging Radiometer Suite (VIIRS) observations [6]. The individual soil moisture retrievals from different multiple satellite sensors have their own spatial resolutions, data qualities, and achieving file formats. To generate a blended soil moisture product, the available observations from those satellite platforms were extracted from their original archiving files, regridded to SMOPS 0.25° lat/lon grids, and bias corrected to GLDAS-Noah version 2.0 soil moisture climatology for 0–10 cm soil layer [30] using the CDF-matching method [28]. For each of the version upgrades, CDF climatology was updated with the newest available GLDAS data set. All global retrievals acquired within the previous 24-h windows were composited for the daily blended product and then combined into one value for each grid over the global domain using equal weights [5,14,15]. In this paper, the daily SMOPS blended soil moisture data products version 1.0 during the 1 June 2007–3 November 2011 period, version 2.0 during the 16 November 2010–20 September 2016 period, and version 3.0 during the 1 April 2015–31 December 2019 period were employed with quality control using the snow and frozen ground flags, which are based on land surface temperature simulations from the Global Forecast System (GFS).

2.2. SCAN

The Soil Climate Analysis Network (SCAN) of United States Department of Agriculture is designed to provide in situ soil climate measurements to support natural resources assessments. It is composed of over 200 stations with focusing on agricultural areas of the US [31]. Hourly soil moisture observations are automatically recorded with device measuring the soil dielectric constant for the limits of the sensors [31,32]. In this paper, the SCAN measurements were reprocessed to match the daily temporal resolution of SMOPS. The observations from each SCAN site were quality controlled through detecting problematic data sets. The quality control strategies specifically include: (1) Soil moisture measurements outside of the physically possible range were excluded [32]; (2) data under frozen conditions on the basis of SCAN soil temperature measurements were excluded [27,32]; (3) SCAN sites providing fewer than 500-day of observations were also excluded. There are a total of 128, 162, and 174 sites that had valid data covering SMOPS versions 1.0, 2.0, and 3.0 time periods in the contiguous United States (CONUS), respectively.

2.3. ESA_CCI Soil Moisture

In support of climate research, the European Space Agency’s Climate Change Initiative (ESA_CCI) soil moisture data products were developed to bridge the short-term gap of individual satellite missions [7]. After bias corrected both active and passive observations to GLDAS climatology, the ESA_CCI merged them to generate the daily combined soil moisture datasets with a 0.25° spatial resolution [7]. The ESA_CCI soil moisture version 4.5 product was publicly released in December 2019 with a one-year latency [33]. Instead of merging the pre-merged active and passive products, the combined product in version 4.5 combined all active and passive level-2 products directly. Given that ESA_CCI provides consistent quality controlled soil moisture data records from 1978 to 2018, the daily global SMOPS products were complementarily evaluated with the ESA_CCI version 4.5 combined products over the 2007–2018 period.

2.4. Validation Strategy

The choice of performance metrics is primarily depending on the variable, nature, and characteristics. Each metric is sensitive to some characteristics of environmental variables, and it means a single metric is not able to well capture all the variable attributes [34]. The performances of the SMOPS soil moisture data products were estimated by three widely used metrics [34] including correlation coefficient (r), root mean square error (RMSE)/difference (RMSD), and unbiased RMSE (ubRMSE). The correlation coefficient provides a measure of the dynamic trend agreements between in situ and SMOPS soil moisture observations. The RMSE measures the differences between SMOPS and SCAN soil moisture observations. Considering that satellite soil moisture measurements generally have considerable mean and seasonal biases from stationary biases associated ancillary surface data and retrieval algorithms [34,35], the ubRMSE is a widely used metric for unbiased estimations with removing the climatological biases.
Given SCAN (MSCAN) and SMOPS (MSMOPS) soil moisture observations, the metrics are:
r = i = 1 N ( M S C A N i M S C A N ¯ ) ( M S M O P S i M S M O P S ¯ ) i = 1 N ( M S C A N i M S C A N ¯ ) 2 i = 1 N ( M S M O P S i M S M O P S ¯ ) 2
R M S E = i = 1 N ( M S C A N i M S M O P S i ) 2 / ( N 1 )
u b R M S E = i = 1 N ( ( M S C A N i M S C A N ¯ ) ( M S M O P S i M S M O P S ¯ ) ) 2 / ( N 1 )
Similarly, with respect to the ESA_CCI soil moisture product (MESACCI), the RMSD is given:
R M S D = i = 1 N ( M S C A N i M E S A C C I i ) 2 / ( N 1 )
where the sample size N for the SMOPS version 1.0 is 1616 since there are 1616 days from 1 June 2007 to 3 November 2011. Similarly, the sample sizes for SMOPS versions 2.0 and 3.0 are 2015 and 1735, respectively.

3. Results

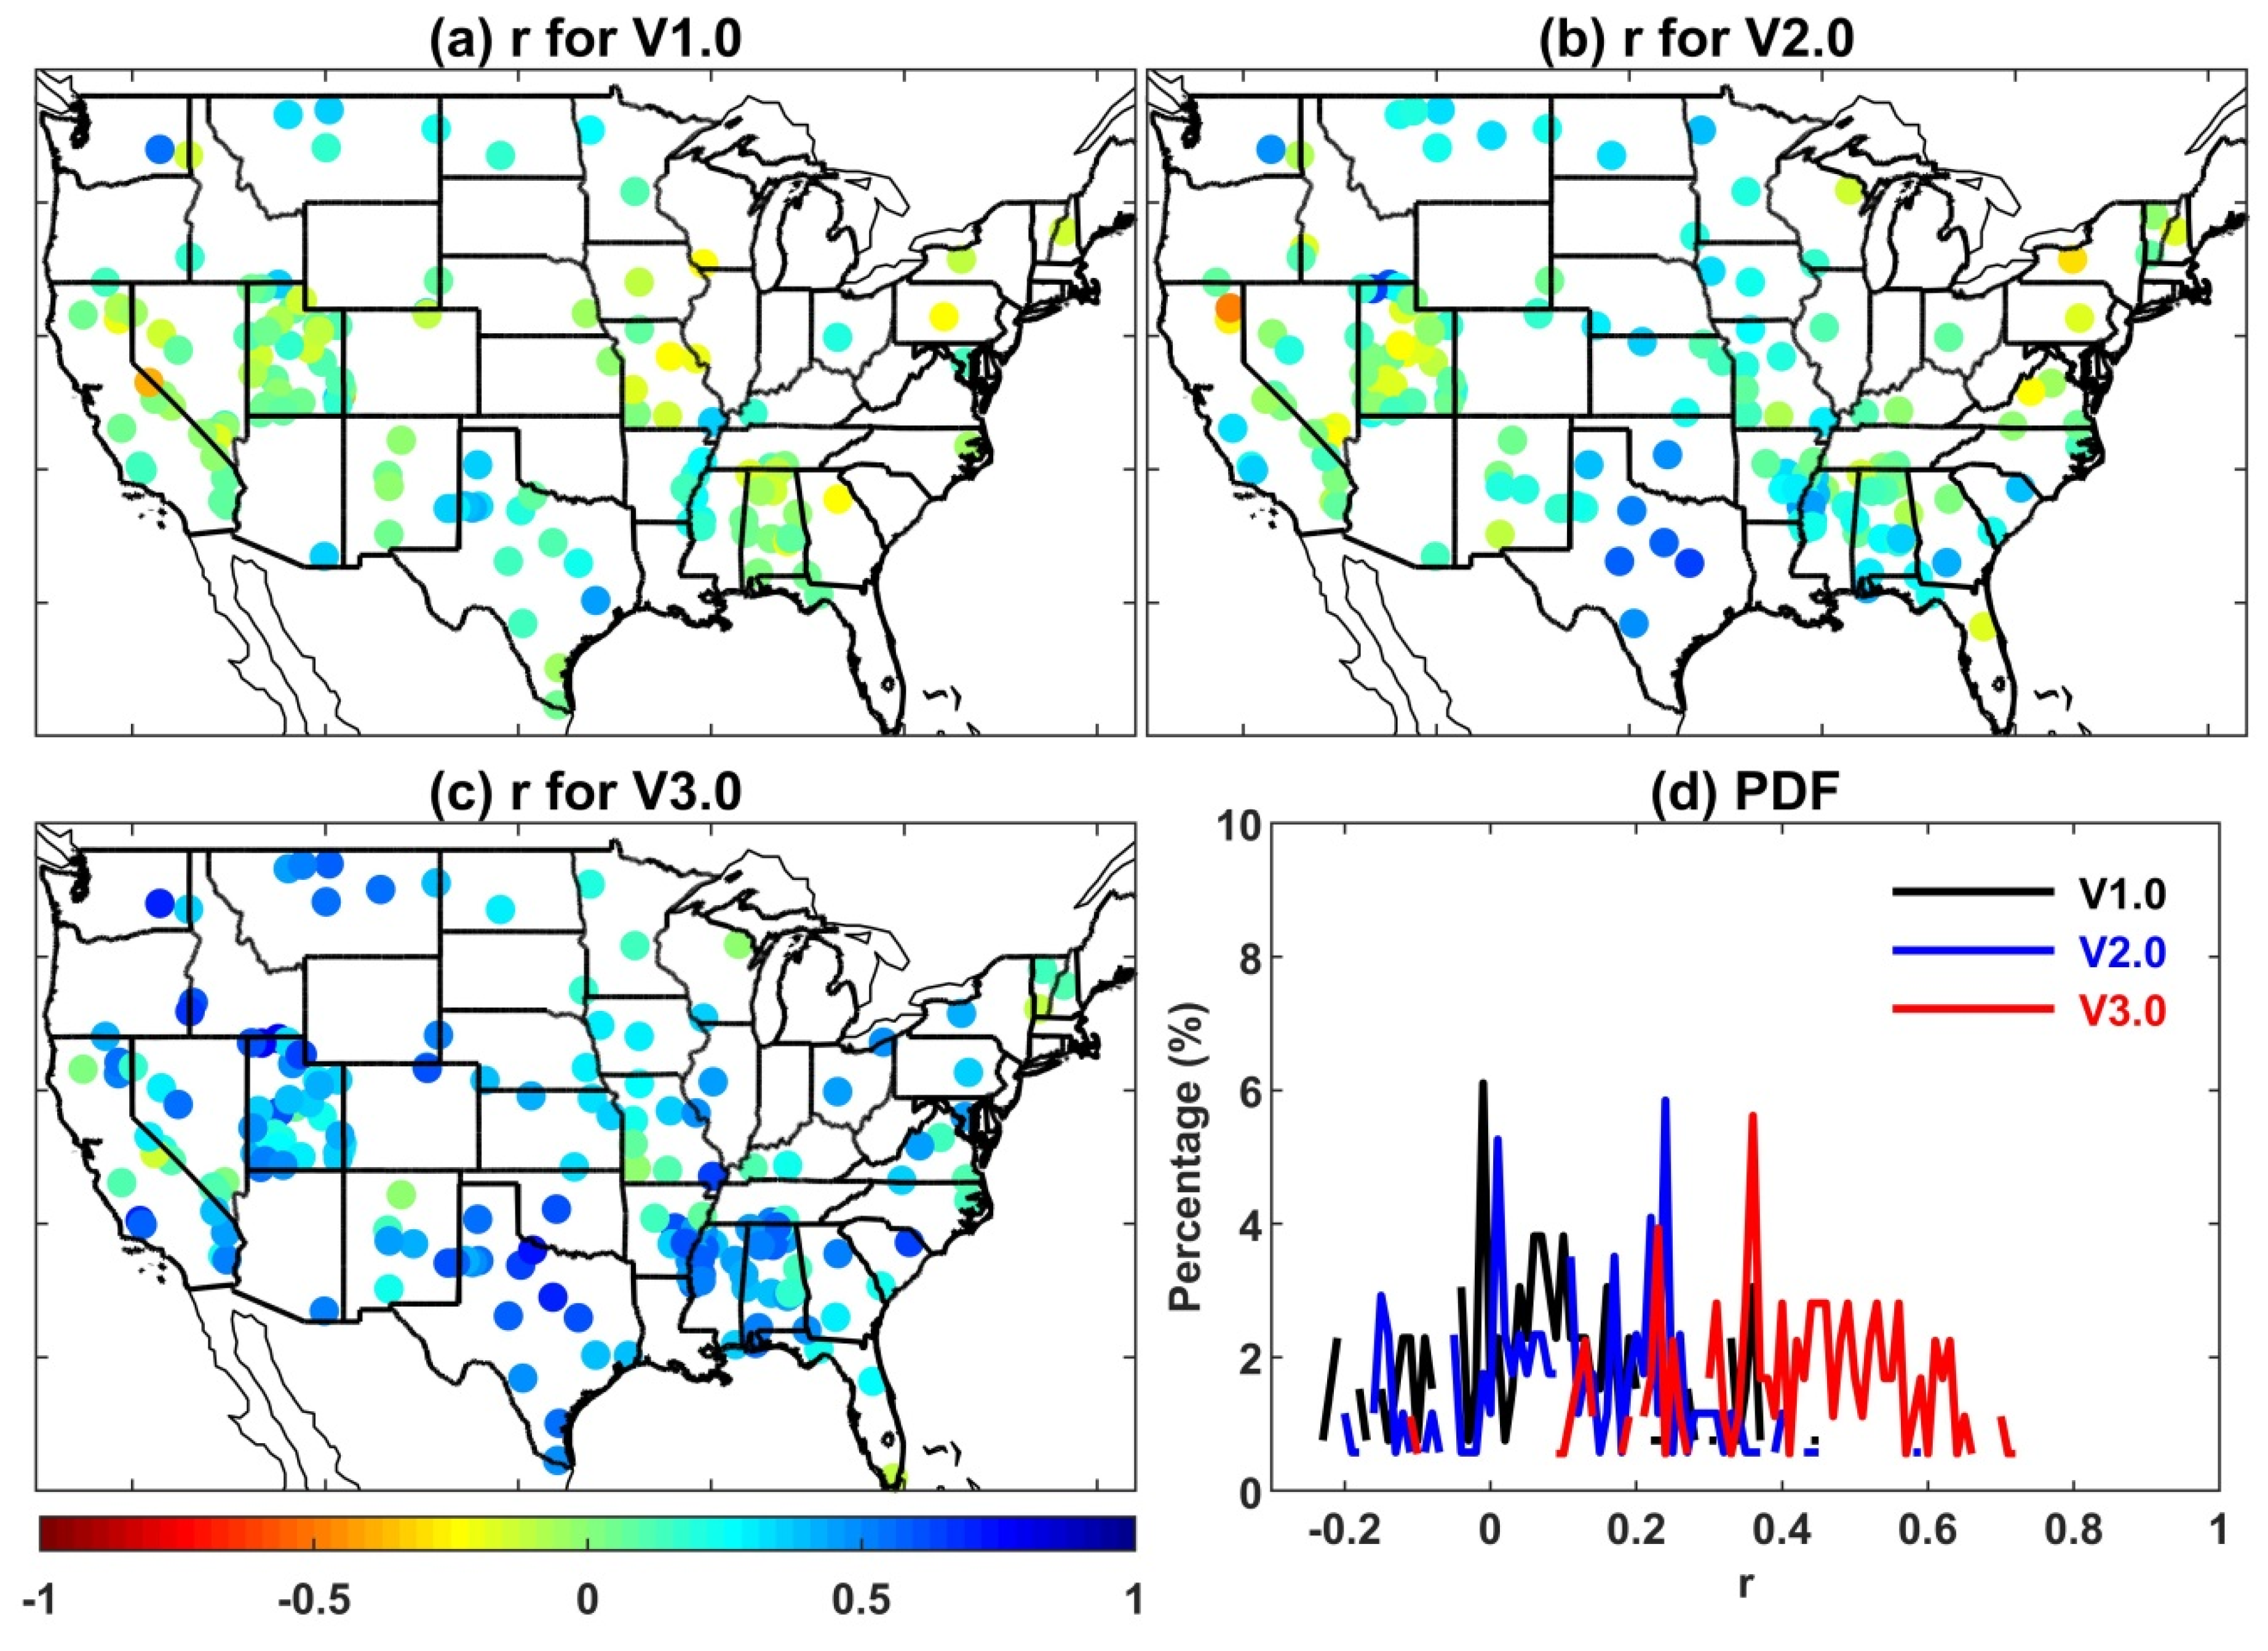
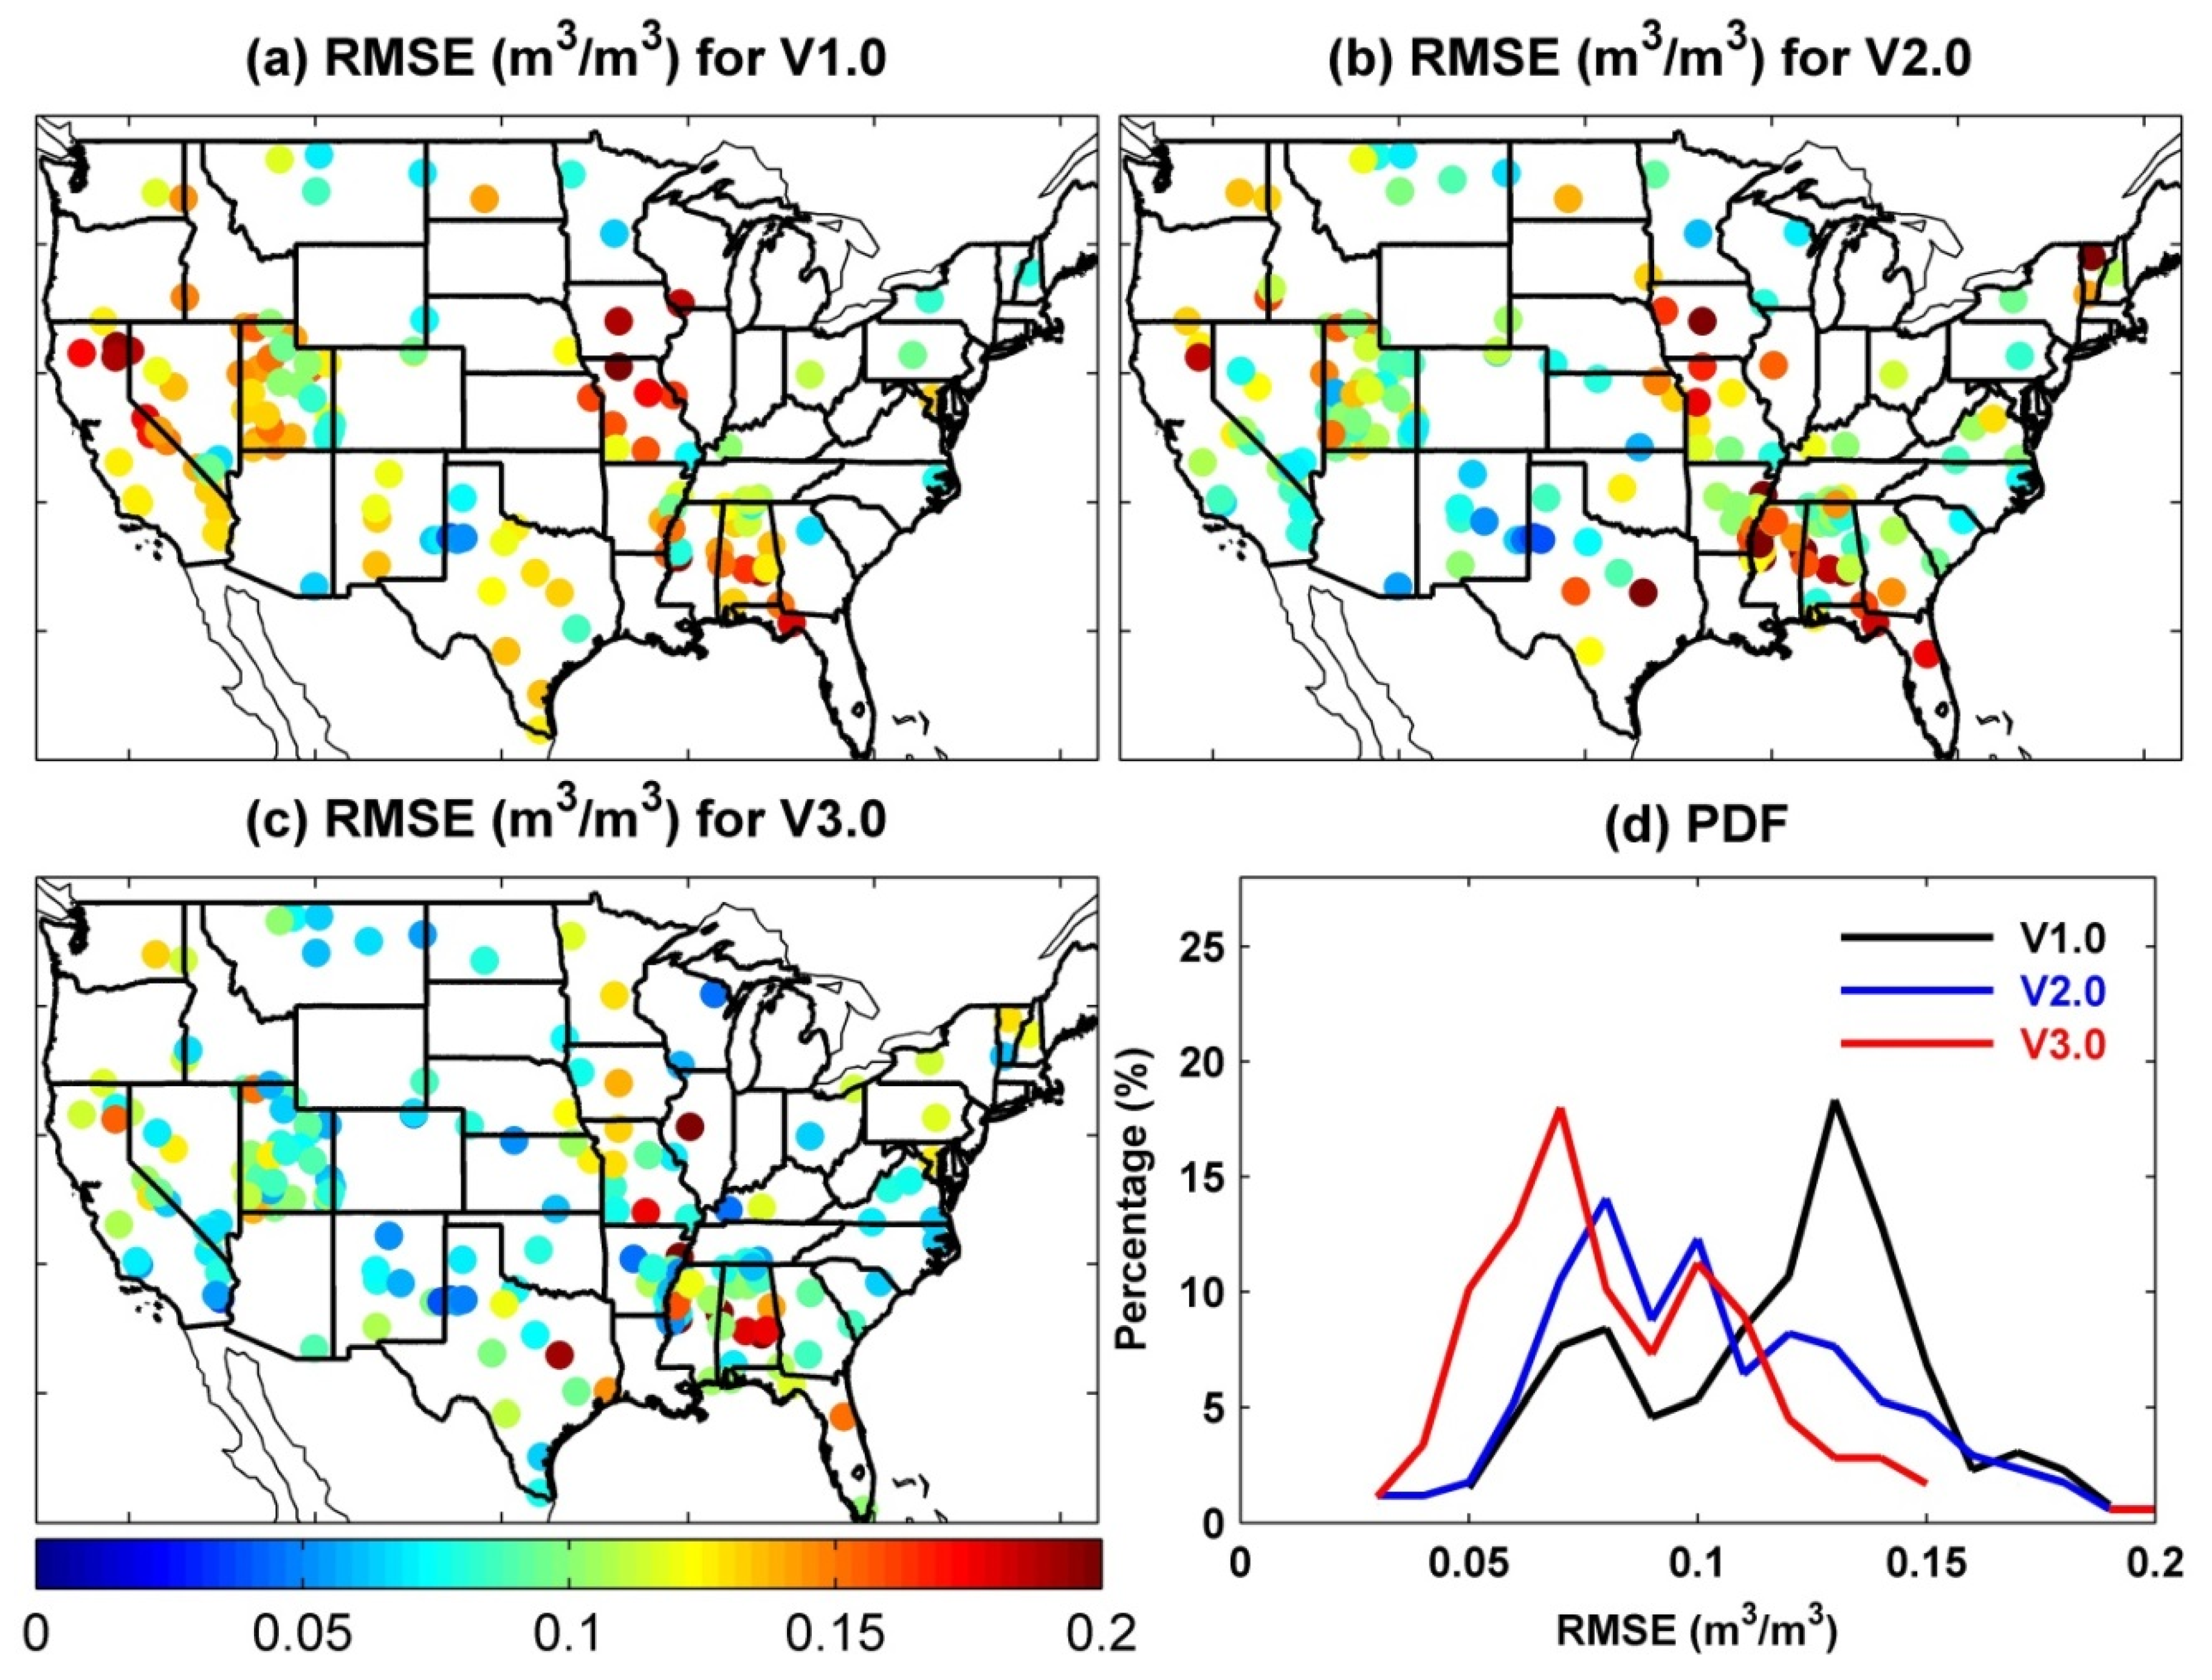
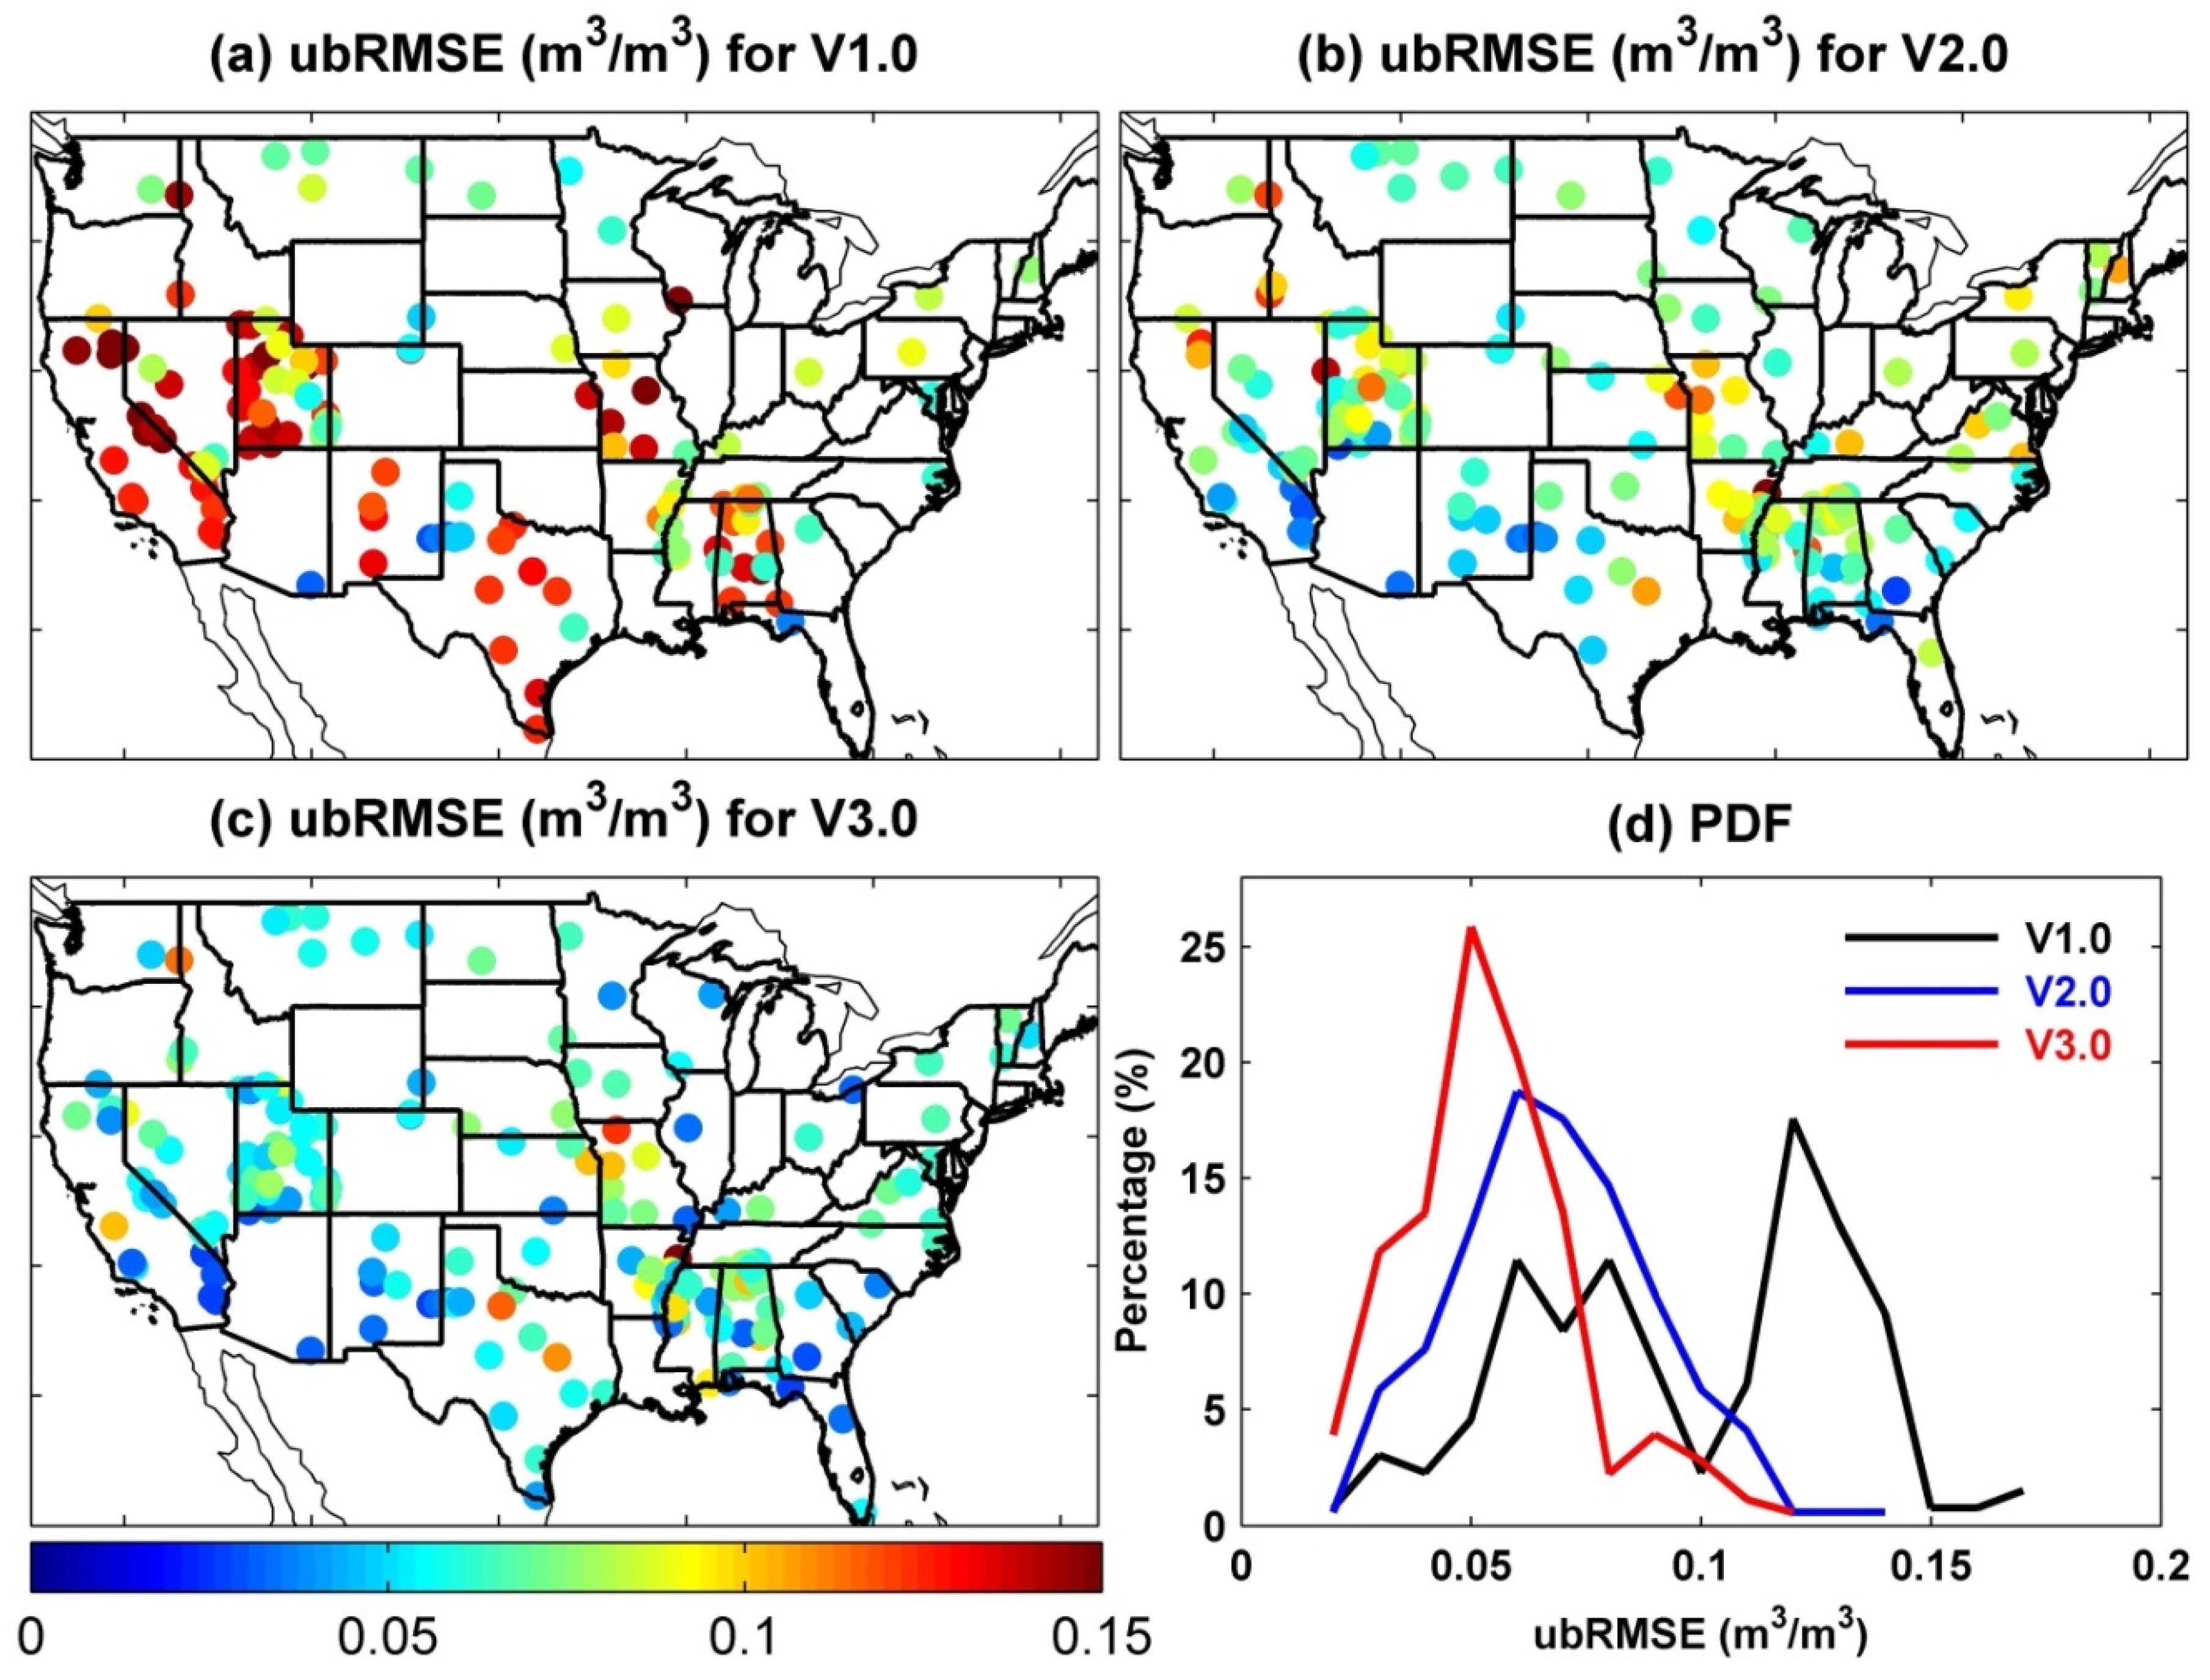
3.1. Validations with SCAN Soil Moisture Measurements

The daily SMOPS blended soil moisture data products were validated with the quality controlled SCAN soil moisture measurements. Figure 3a–c showed the SCAN measurements-based correlation coefficients with the blue (red) indicating robust positive (negative) correlations. Given that C- and X-band measurements are struggling in moderately and densely vegetated (greater than ~3 kg/m2) areas, soil moisture retrievals from ASCATA, AMSR-E, and WindSat, which were used to generate SMOPS version 1.0 blended data sets, may show modest behaviors in the eastern CONUS. ASCATA retrievals were problematic over mountainous regions due to the fact that the backscattering coefficient was sensitive to the surface roughness conditions [13]. As a result, SMOPS version 1.0 presented a weak agreement with the quality controlled SCAN observations in the western mountain areas. With benefits of replacing WindSat as AMSR-2 and combining SMOS retrievals, the second generation SMOPS exhibited a relative stronger consistent with in situ observations, but the lower r values can be still found in the western and eastern CONUS.
Compared to the older versions, the SMOPS version 3.0 was more successful to track the top 10 cm soil moisture changes with significantly raising the SCAN measurements-based correlations over the CONUS domain. Long-term observations offered a good opportunity to improve ASCAT retrieval algorithms and in turn making the newest ASCAT retrievals comparable to SMOS data [13,36]. In addition, the weights of L-band soil moisture observations in the new generation SMOPS were significantly increased along with merging SMAP retrievals. Considering that both SMAP and SMOS were sensitive to soil moisture through dense vegetation (~5 kg/m2), it was thus expected that the newest version SMOPS exhibited a more robust agreement with SCAN measurements in the eastern regions. Statistical results documented that the curve for version 3.0 apparently shifts toward the right (Figure 3d), which indicated the relationships between the new generation SMOPS and SCAN observations were much stronger than that for the older versions.
As suffering from the modest performance of ASCAT datasets in the mountain areas, the SMOPS version 1.0 showed larger uncertainties in the western CONUS (Figure 4a). Due to the great weights of C-band observations that yielded to dense vegetation, both old versions exhibited humble performances in the eastern areas (Figure 4a,b). The negative situations were significantly improved by the new generation SMOPS with presenting reasonable errors (RMSE ≤ 0.10 m3/m3) at 60.8% SCAN sites (Figure 4c). Figure 4d showed statistical results for the three version SMOPS blended soil moisture data products during the corresponding product periods. Curves shifting toward the left indicate improvements in reducing the probability of larger RMSEs, whereas shifting toward the right indicate degradations. Compared to the older versions, the SMOPS version 3.0 presented a significantly left shifting tendency with raising probability of giving lower errors. With respect to the quality controlled SCAN soil moisture measurements, the CONUS domain-averaged RMSE values for SMOPS versions 1.0, 2.0, and 3.0 were 0.124, 0.114, and 0.093 m3/m3 (33.3% reduction versus version 1.0 and 22.6% reduction versus version 2.0), respectively.
The low correlations and high RMSEs of SMOPS version 1.0 were well mirrored in the ubRMSE estimations (Figure 5a). Relatively, version 2.0 presented a reasonable performance in the southwestern and southeastern areas, whereas showed larger unRMSE values in the mountainous and densely vegetated regions (Figure 5b). Statistical results revealed that the SMOPS version 2.0 presented reasonable performance (ubRMSE less than 0.05 m3/m3) at 15.4% stations, which was raised to 29.3% (13.9% increase versus version 2.0) by the new generation SMOPS (Figure 5c). With respect to the quality controlled SCAN observations, the CONUS domain-averaged frequency probability as a function of ubRMSE for the three version SMOPS data products can be found in Figure 6d. Relative to the older versions, the curve for the new generation SMOPS clearly shifted toward the left, which means improvements in the decreasing probability of larger ubRMSE values. The CONUS domain-averaged ubRMSEs for SMOPS versions 1.0, 2.0, and 3.0 were 0.105, 0.072, and 0.059 m3/m3 (78.0% reduction versus version 1.0 and 22.0% reduction versus version 2.0), respectively.

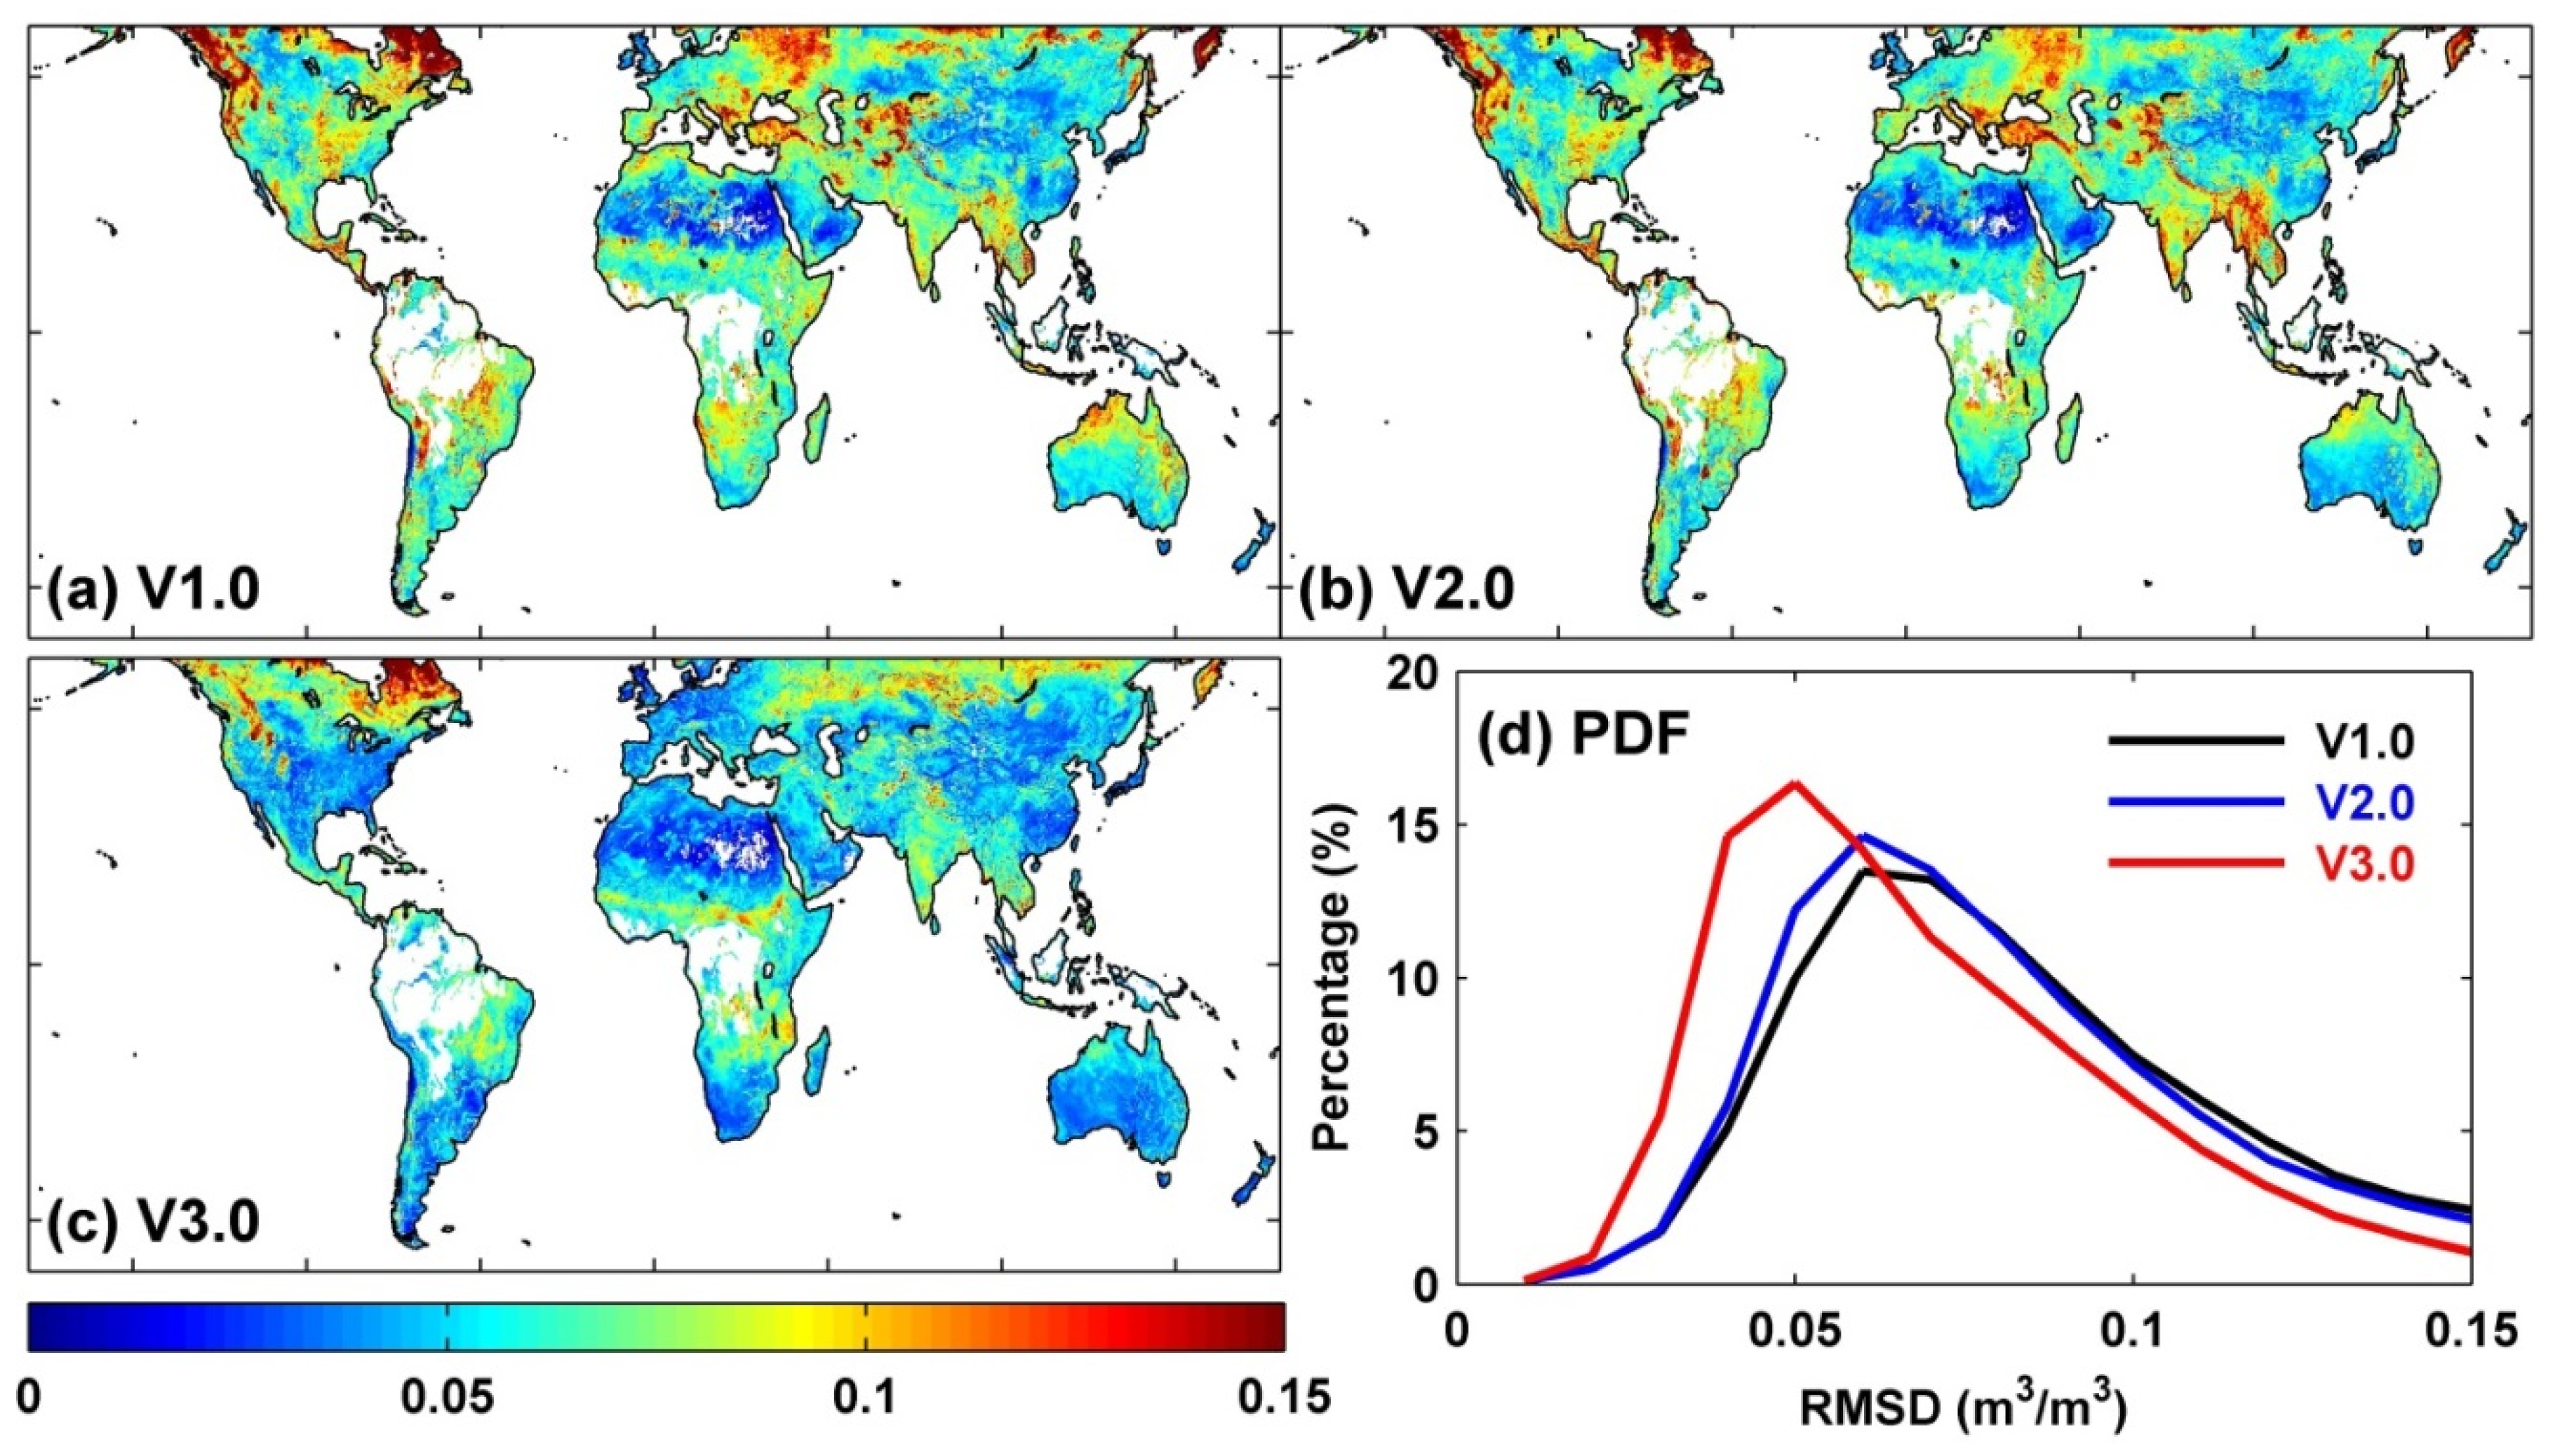
3.2. Evaluation with ESA_CCI Soil Moisture Product

The quality controlled SCAN measurements-based validations indicated that the newest version SMOPS had better performance in comparison with the old versions. However, the SCAN sites are limited not only in the CONUS but also from low density networks, and thus it is still unknown the behaviors of SMOPS data products on the entire global terrestrial domain. These types of constrains can be compensated for by comparing with a gridded soil moisture data product that have been widely used in the communities. To a certain time period, ESA_CCI provides the historical soil moisture records [7]. It also provides a combined active and passive microwave product with combining various soil moisture observations from single sensors. Instead of RMSE, the terminology RMSD is used here since the ECA_CCI data product does not represent the real soil moisture “truth”. With respect to the ESA_CCI data, Figure 6a–c showed the time series RMSDs for three version SMOPS soil moisture products. Areas shading in blue color indicate smaller differences between SMOPS and ECV_CCI datasets, whereas in red color indicate larger RMSD values. The SMOPS version 1.0 presented lower RMSD values in the Arabian Peninsula, Sahara, China, and the southern Australia. Relatively, version 2.0 showed slight improvements in Australia and southern Africa over the first version. With benefits of the new generation SMOPS, the RMSD values on the global domain are significantly reduced in comparison with the older versions. Specifically, the statistical results documented that the SMOPS versions 1.0, 2.0, and 3.0 exhibited reasonable differences (RMSD less than 0.06 m3/m3) in 30.8%, 35.0%, and 51.6% areas over the global terrestrial domain. As a result, the curve for the SMOPS version 3.0 in Figure 6d clearly shifted toward the left in comparison with the versions 1.0 and 2.0, which means improvements in decreasing the probability of larger ECV_CCI product-based RMSD values.

3.3. Inter-Comparison with ECV_CCI Data

To make effective use of all available microwave-based datasets, methodologies must be developed to merge and harmonize the available soil moisture data products to provide daily global estimates. One such dataset, the ECV_CCI data products benefit from its long-term historical soil moisture records during a certain period [7]. With the strong support of CCI program, the ESA has officially released the multi-decadal, combined, global satellite soil moisture datasets since 2012 [7,33]. An additional dataset, the SMOPS provides NRT daily global blended soil moisture observations. Compared to ESA_CCI, the new generation SMOPS shows lower uncertainties in the western and eastern CONUS, whereas presents negligible differences in the central great plain (Figure 7). The CONUS domain-averaged RMSEs for SMOPS version 3.0 and ESA_CCI version 4.5 are 0.093 and 0.089 m3/m3, respectively. This is an unfair comparison due to the NRT nature of SMOPS, but the SMOPS version 3.0 is comparable to the ESA_CCI soil moisture data (Figure 7) with respect to the quality controlled SCAN observations.

4. Discussion

With respect to the quality controlled in situ observations, results in Section 3 clearly indicate that the SMOPS version 3.0 presents more robust correlations and lower uncertainties (Figure 3, Figure 4 and Figure 5). The newest version SMOPS is also more successful to reduce the ECV_CCI soil moisture product-based RMSD values (Figure 6). These positive evaluation results allow the new generation SMOPS to better meet the users’ requirements. However, considerations relevant to the further development of the SMOPS product in the near future are needed to produce much better satellite soil moisture datasets for users.

4.1. Advantages of NRT Satellite Soil Moisture

Land surface model (LSM) is an important component of current weather forecast models. However, LSM simulations are typically prone to the forcing data uncertainties and errors from the lack of well understanding in model physics [5,14,37]. NOAA-NCEP provides regional and global weather prediction services using the North American Mesoscale Model (NAM) and Global Forecast System (GFS), respectively. Surface soil moisture is estimated in both NAM and GFS are based on LSM simulations, which could be erroneous and even contain large uncertainties and eventually resulting in unreliable weather predictions [17,37]. These weather forecast models provide guess fields for the full forecasts typically at 00:00, 06:00, 12:00, and 18:00 UTC cycles. With 6-h latency, the NRT daily SMOPS can well meet soil moisture data needs of weather predictions within the 6-h cut-off time limit. Specifically, the GFS soil moisture simulations with benefits of assimilating the daily SMOPS data have better agreement with the in situ measurements. As a result, the GFS had a better capability to forecast surface air temperature, surface humidity, precipitation, and 500 hPa height anomaly correlations [17].

4.2. ASCATC Soil Moisture

The MetOp-C was launched in November 2018. As the last mission of a series of three MetOp satellites, soil moisture retrievals from the MetOp-C has been operationally produced since May 2019 and became available in January 2020. Thus, there are currently three ASCAT instruments (A, B, and C) onboard MetOp satellites to operationally provide soil moisture observations. Considering that the MetOp-A will be likely de-orbited in 2022, ASCATC observations will be combined in the SMOPS blended soil moisture data product in the near future. With the planned integration, the ASCATC will be quantitatively assessed to objectively assign its weight. With benefits of combining ASCATC retrievals, the daily SMOPS blended soil moisture data will have a much higher spatial coverage globally. The SMOPS that merges ASCATC operationally is expected to have a better performance in the specific regions [36] where ASCAT generally performs better.

4.3. Long-Term Historical SMOPS Data Product

Long-term historical soil moisture records are fundamental for understanding of climatological dynamics, changes, and tendencies in continental water, carbon, and energy cycles [7]. Given the reasonable performances of the newest version SMOPS, reprocessing SMOPS datasets is expected to improve the quality of older version data through using the latest retrieval and blending algorithms, better soil moisture climatology, and real time ancillary information. As a result, the reprocessed SMOPS product will offer a long-term reliable and continuous global soil moisture dataset for users in the near future. Two advantages of this kind of long-term SMOPS product will benefit users. The first advantage benefits from the long-term high quality consistent soil moisture records. It will meet the requirements of the climate community and in turn is used to investigate soil moisture climatological trends [38], understand soil moisture-precipitation feedbacks [39], identify the role of soil moisture on climate change [40], explain impacts of soil moisture on global biogeochemical cycles and ecology [41], and apply soil moisture in the context of hydrological and meteorological studies [29,37,42]. The second advantage is from near real time updating soil moisture datasets with short latency. The soil moisture status is an important indicator to monitor agricultural drought [16]. The near real time long-term SMOPS will allow better understanding of drought development through assessing soil moisture deficits over the historical records [41]. In addition, climate models require initial and boundary conditions to start model running [43]. These initial conditions are unreliable, and thus spin-up through multiyear is needed to make climate models run stably [43,44]. In a specific soil moisture data assimilation system, the climatological SMOPS may be used to spin up climate models and the real time SMOPS will improve the future projections.

4.4. Weights of Individual SM Retrievals

In version 3.0, the SMOPS blended product is produced through merging all available individual microwave satellite soil moisture retrievals with the relative importance of each quantity on average [14,15]. This equal-weight approach subjectively assumes that high-and poor-quality individual retrievals have equal weights. Objectively assigning weights for the individual soil moisture retrievals are primarily limited by the lack of well understanding in errors of different microwave satellite data products. Traditional validation activities are typically based on comparisons with in situ observations [36]. The weights of individual retrievals cannot be directly determined by such comparisons, since the ground soil moisture measurements are from sparse networks and are not able to provide global scale validations. Recent studies have reported that this challenge can be addressed by the triple collocation technique [16,36]. In the near future, it is expected to further improve SMOPS blended soil moisture accuracy through decreasing weight for low-quality individual soil moisture retrieval and increasing high-quality retrieval weight in combination processing.

5. Conclusions

The SMOPS version 3.0 was developed in 2016 and officially released in 2017. Significant differences in climatological averages between the latest and old versions result in remarkable distinctions in data quality. In terms of validations with in situ measurements and ECV_CCI observations, the new generation SMOPS archives are more stable and the higher accurate daily blended soil moisture data product significantly reduced the uncertainties. Such a capability is a critical milestone in developing the near real time satellite blended soil moisture product system. With the added data reliability, the new generation SMOPS bended data product can benefit the hydrological, meteorological, and climatological science and support decision-making process on climate change adaptation and extreme events mitigation.

Author Contributions

Designed the research and wrote the paper, J.Y., X.Z. and J.L.; reviewed and edited the manuscript, J.Y., X.Z. and J.L. All authors have read and agreed to the published version of the manuscript.

Funding

This research received no external funding.

Acknowledgments

This work was jointly supported by NOAA’s Climate Program Office’s Modeling, Analysis, Predictions, and the NOAA JPSS Proving Ground and Risk Reduction (PGRR) Program. The manuscript contents are solely the opinions of the authors and do not constitute a statement of policy, decision, or position on behalf of NOAA or the US Government. We are also grateful to the anonymous reviewers for helping to significantly improve the quality of the manuscript. The SMOPS soil moisture data product can be obtained from the NOAA NESDIS at http://www.ospo.noaa.gov/Products/land/smops/.

Conflicts of Interest

The authors declare no conflict of interest.

References

  1. Entekhabi, D.; Njoku, E.G.; O’Neill, P.E.; Kellogg, K.H.; Crow, W.T.; Edelstein, W.N.; Entin, J.K.; Goodman, S.D.; Jackson, T.J.; Johnson, J.; et al. The Soil Moisture Active Passive (SMAP) Mission. Proc. IEEE 2010, 98, 704–716. [Google Scholar] [CrossRef]
  2. Crow, W.T.; Berg, A.A.; Cosh, M.H.; Loew, A.; Mohanty, B.P.; Panciera, R.; de Rosnay, P.; Ryu, D.; Walker, J.P. Upscaling sparse ground-based soil moisture observations for the validation of coarse-resolution satellite soil moisture products. Rev. Geophys. 2012, 50, RG2002. [Google Scholar] [CrossRef] [Green Version]
  3. Mo, T.; Choudhury, B.J.; Schmugge, T.J.; Wang, J.R.; Jackson, T.J. A model for microwave emission from vegetation-covered fields. J. Geophys. Res. 1982, 87, 11229. [Google Scholar] [CrossRef]
  4. Yin, J.; Zhan, X.; Zheng, Y.; Liu, J.; Hain, C.R.; Fang, L. Impact of quality control of satellite soil moisture data on their assimilation into land surface model. Geophys. Res. Lett. 2014, 41, 7159–7166. [Google Scholar] [CrossRef]
  5. Yin, J.; Zhan, X.; Zheng, Y.; Liu, J.; Fang, L.; Hain, C.R. Enhancing model skill by assimilating SMOPS blended soil moisture product into Noah land surface model. J. Hydrometeorol. 2015, 16, 917–931. [Google Scholar] [CrossRef]
  6. Zhan, X.; Liu, J.; Wen, J.; Zhao, L.; Vargas, M.; Weng, F. Soil Moisture data product generated from NASA SMAP observations with NOAA ancillary data. In Proceedings of the 2016 IEEE International Geoscience and Remote Sensing Symposium (IGARSS), Beijing, China, 10–15 July 2016; pp. 5237–5240. [Google Scholar] [CrossRef]
  7. Dorigo, W.; Wagner, W.; Albergel, C.; Albrecht, F.; Balsamo, G.; Brocca, L.; Chung, D.; Ertl, M.; Forkel, M.; Gruber, A.; et al. ESA CCI Soil Moisture for improved Earth system understanding: State-of-the art and future directions. Remote Sens. Environ. 2017, 203, 185–215. [Google Scholar] [CrossRef]
  8. Wang, J.; Engman, E.; Mo, T.; Schmugge, T.; Shiue, J. The Effects of Soil Moisture, Surface Roughness, and Vegetation on L-Band Emission and Backscatter. IEEE Trans. Geosci. Remote Sens. 1987, GE-25, 825–833. [Google Scholar] [CrossRef]
  9. Jackson, T.J.; Schmugge, T.J. Passive microwave remote sensing system for soil moisture: Some supporting research. IEEE Trans. Geosci. Remote Sens. 1989, 27, 225–235. [Google Scholar] [CrossRef]
  10. Njoku, E.G.; Jackson, T.J.; Lakshmi, V.; Chan, T.K.; Nghiem, S.V. Soil moisture retrieval from AMSR-E. IEEE Trans. Geosci. Remote Sens. 2003, 41, 215–229. [Google Scholar] [CrossRef]
  11. Li, L.; Gaiser, P.W.; Gao, B.C.; Bevilacqua, R.M.; Jackson, T.J.; Njoku, E.G.; Rudiger, C.; Calvet, J.-C.; Bindlish, R. WindSat Global Soil Moisture Retrieval and Validation. IEEE Trans. Geosci. Remote Sens. 2010, 48, 2224–2241. [Google Scholar] [CrossRef]
  12. Kerr, Y.H.; Waldteufel, P.; Wigneron, J.-P.; Delwart, S.; Cabot, F.; Boutin, J.; Escorihuela, M.-J.; Font, J.; Reul, N.; Gruhier, C.; et al. The SMOS Mission: New Tool for Monitoring Key Elements ofthe Global Water Cycle. Proc. IEEE 2010, 98, 666–687. [Google Scholar] [CrossRef] [Green Version]
  13. Wagner, W.; Hahn, S.; Kidd, R.; Melzer, T.; Bartalis, Z.; Hasenauer, S.; Figa-Saldaña, J.; de Rosnay, P.; Jann, A.; Schneider, S.; et al. The ASCAT Soil Moisture Product: A Review of its Specifications, Validation Results, and Emerging Applications. Meteorol. Z. 2013, 22, 5–33. [Google Scholar] [CrossRef] [Green Version]
  14. Yin, J.; Zhan, X.; Liu, J.; Shull, M. An Inter-comparison of Noah Model Skills with Benefits of Assimilating SMOPS Blended and Individual Soil Moisture Retrievals. Water Resour. Res. 2019, 55, 2572–2592. [Google Scholar] [CrossRef]
  15. Liu, J.; Zhan, X.; Hain, C.; Yin, J.; Fang, L.; Li, Z.; Zhao, L. NOaa Soil Moisture Operational Product System (SMOPS) and its validations. In Proceedings of the 2016 IEEE International Geoscience and Remote Sensing Symposium (IGARSS), Beijing, China, 10–15 July 2016; pp. 3477–3480. [Google Scholar]
  16. Yin, J.; Zhan, X.; Hain, C.R.; Liu, J.; Anderson, M.C. A Method for Objectively Integrating Soil Moisture Satellite Observations and Model Simulations toward a Blended Drought Index. Water Resour. Res. 2018, 54, 6772–6791. [Google Scholar] [CrossRef]
  17. Zheng, W.; Zhan, X.; Liu, J.; Ek, M. A preliminary assessment of the impact of assimilating satellite soil moisture data products on NCEP Global Forecast System. Adv. Meteorol. 2018, 2018, 7363194. [Google Scholar] [CrossRef] [Green Version]
  18. Nair, A.; Indu, J. Enhancing Noah Land Surface Model Prediction Skill over Indian Subcontinent by Assimilating SMOPS Blended Soil Moisture. Remote Sens. 2016, 8, 976. [Google Scholar] [CrossRef] [Green Version]
  19. Maeda, T.; Taniguchi, Y.; Imaoka, K. GCOM-W1 AMSR2 level 1R product: Dataset of brightness temperature modified using the antenna pattern matching technique. IEEE Trans. Geosci. Remote Sens. 2016, 54, 770–782. [Google Scholar] [CrossRef]
  20. Piepmeier, J.R.; Johnson, J.T.; Mohammed, P.N.; Bradley, D.; Ruf, C.; Aksoy, M.; Garcia, R.; Hudson, D.; Miles, L.; Wong, M. Radio-Frequency Interference Mitigation for the Soil Moisture Active Passive Microwave Radiometer. IEEE Trans. Geosci. Remote Sens. 2014, 52, 761–775. [Google Scholar] [CrossRef]
  21. Soldo, Y.; Cabot, F.; Khazaal, A.; Miernecki, M.; Slominska, E.; Fieuzal, R.; Kerr, Y.H. Localization of RFI sources for the SMOS mission: A means for assessing SMOS pointing performances. IEEE J. Sel. Top. Appl. Earth Obs. Remote Sens. 2015, 8, 617–627. [Google Scholar] [CrossRef]
  22. Lobl, E. Joint Advanced Microwave Scanning Radiometer (AMSR) Science Team meeting. Earth Obs. 2001, 13, 3–9. [Google Scholar]
  23. Wilson, J.J.W.; Anderson, C.; Baker, M.A.; Bonekamp, H.; Saldaña, J.F.; Dyer, R.G.; Lerch, J.A.; Kayal, G.; Gelsthorpe, R.V.; Brown, M.A.; et al. Radiometric Calibration of the Advanced Wind Scatterometer Radar ASCAT Carried Onboard the METOP-A Satellite. IEEE Trans. Geosci. Remote Sens. 2010, 48, 3236–3255. [Google Scholar] [CrossRef]
  24. Anderson, C.; Figa, J.; Bonekamp, H.; Wilson, J.J.W.; Verspeek, J.; Stoffelen, A.; Portabella, M. Validation of Backscatter Measurements from the Advanced Scatterometer on MetOp-A. J. Atmos. Ocean. Technol. 2012, 29, 77–88. [Google Scholar] [CrossRef] [Green Version]
  25. Zhan, X.W.; Crow, W.T.; Jackson, T.J.; O’Neill, P.E. Improving Spaceborne Radiometer Soil Moisture Retrievals With Alternative Aggregation Rules for Ancillary Parameters in Highly Heterogeneous Vegetated Areas. IEEE Geosci. Remote Sens. Lett. 2008, 5, 261–265. [Google Scholar] [CrossRef]
  26. Yin, J.; Zhan, X.; Zheng, Y.; Hain, C.R.; Ek, M.; Wen, J.; Fang, L.; Liu, J. Improving Noah land surface model performance using near real time surface albedo and green vegetation fraction. Agric. For. Meteorol. 2016, 218–219, 171–183. [Google Scholar] [CrossRef]
  27. Yin, J.; Zheng, Y.; Zhan, X.; Hain, C.R.; Zhai, Q.; Duan, C.; Wu, R.; Liu, J.; Fang, L. An assessment of impacts of land-cover changes on root-zone soil moisture. Int. J. Remote Sens. 2015, 36, 6116–6134. [Google Scholar] [CrossRef]
  28. Reichle, R.H.; Koster, R.D. Bias reduction in short records of satellite soil moisture. Geophys. Res. Lett. 2004, 31, L19501. [Google Scholar] [CrossRef] [Green Version]
  29. Yin, J.; Zhan, X. Impact of Bias-Correction Methods on Effectiveness of Assimilating SMAP Soil Moisture Data into NCEP Global Forecast System Using the Ensemble Kalman Filter. IEEE Geosci. Remote Sens. Lett. 2018, 15, 659–663. [Google Scholar] [CrossRef]
  30. Rodell, M.; Houser, P.R.; Jambor, U.; Gottschalck, J.; Mitchell, K.; Meng, C.-J.; Arsenault, K.; Cosgrove, B.; Radakovich, J.; Bosilovich, M.; et al. The Global Land Data Assimilation System. Bull. Am. Meteorol. Soc. 2004, 85, 381–394. [Google Scholar] [CrossRef] [Green Version]
  31. Schaefer, G.L.; Cosh, M.H.; Jackson, T.J. The USDA Natural Resources Conservation Service Soil Climate Analysis Network (SCAN). J. Atmos. Ocean. Technol. 2007, 24, 2073–2077. [Google Scholar] [CrossRef]
  32. Liu, Q.; Reichle, R.H.; Bindlish, R.; Cosh, M.H.; Crow, W.T.; de Jeu, R.; De Lannoy, G.J.M.; Huffman, G.J.; Jackson, T.J. The Contributions of Precipitation and Soil Moisture Observations to the Skill of Soil Moisture Estimates in a Land Data Assimilation System. J. Hydrometeorol. 2011, 12, 750–765. [Google Scholar] [CrossRef]
  33. Gruber, A.; Scanlon, T.; van der Schalie, R.; Wagner, W.; Dorigo, W. Evolution of the ESA CCI Soil Moisture climate data records and their underlying merging methodology. Earth Syst. Sci. Data 2019, 11, 717–739. [Google Scholar] [CrossRef] [Green Version]
  34. Entekhabi, D.; Reichle, R.H.; Koster, R.D.; Crow, W.T. Performance Metrics for Soil Moisture Retrievals and Application Requirements. J. Hydrometeorol. 2010, 11, 832–840. [Google Scholar] [CrossRef]
  35. Drusch, M. Observation operators for the direct assimilation of TRMM microwave imager retrieved soil moisture. Geophys. Res. Lett. 2005, 32, L15403. [Google Scholar] [CrossRef]
  36. Chen, F.; Crow, W.T.; Bindlish, R.; Colliander, A.; Burgin, M.S.; Asanuma, J.; Aida, K. Global-scale evaluation of SMAP, SMOS and ASCAT soil moisture products using triple collocation. Remote Sens. Environ. 2018, 214, 1–13. [Google Scholar] [CrossRef]
  37. Yin, J.; Hain, C.R.; Zhan, X.; Dong, J.; Ek, M. Improvements in the forecasts of near-surface variables in the Global Forecast System (GFS) via assimilating ASCAT soil moisture retrievals. J. Hydrol. 2019, 578, 124018. [Google Scholar] [CrossRef]
  38. Rahmani, A.; Golian, S.; Brocca, L. Multiyear monitoring of soil moisture over Iran through satellite and reanalysis soil moisture products. Int. J. Appl. Earth Obs. Geoinf. 2016, 48, 85–95. [Google Scholar] [CrossRef]
  39. Koster, R.D.; Guo, Z.; Yang, R.; Dirmeyer, P.A.; Mitchell, K.; Puma, M.J. On the Nature of Soil Moisture in Land Surface Models. J. Clim. 2009, 22, 4322–4335. [Google Scholar] [CrossRef] [Green Version]
  40. Hirschi, M.; Mueller, B.; Dorigo, W.; Seneviratne, S.I. Using remotely sensed soil moisture for land–atmosphere coupling diagnostics: The role of surface vs. root zone soil moisture variability. Remote Sens. Environ. 2014, 154, 246–252. [Google Scholar] [CrossRef] [Green Version]
  41. McNally, A.; Shukla, S.; Arsenault, K.R.; Wang, S.; Peters-Lidard, C.D.; Verdin, J.P. Evaluating ESA CCI soil moisture in East Africa. Int. J. Appl. Earth Obs. Geoinf. 2016, 48, 96–109. [Google Scholar] [CrossRef] [Green Version]
  42. Kumar, S.V.; Peters-Lidard, C.D.; Mocko, D.; Reichle, R.; Liu, Y.; Arsenault, K.R.; Xia, Y.; Ek, M.; Riggs, G.; Livneh, B.; et al. Assimilation of Remotely Sensed Soil Moisture and Snow Depth Retrievals for Drought Estimation. J. Hydrometeorol. 2014, 15, 2446–2469. [Google Scholar] [CrossRef]
  43. Cosgrove, B.A.; Lohmann, D.; Mitchell, K.E.; Houser, P.R.; Wood, E.F.; Schaake, J.C.; Robock, A.; Sheffield, J.; Duan, Q.; Luo, L.; et al. Land surface model spin-up behavior in the North American Land Data Assimilation System (NLDAS). J. Geophys. Res. Atmos. 2003, 108, 2002JD003316. [Google Scholar] [CrossRef] [Green Version]
  44. Matte, D.; Laprise, R.; Thériault, J.M.; Lucas-Picher, P. Spatial spin-up of fine scales in a regional climate model simulation driven by low-resolution boundary conditions. Clim. Dyn. 2017, 49, 563–574. [Google Scholar] [CrossRef] [Green Version]
Figure 1. Average soil moisture (in m3/m3 unit) for (a) SMOPS version 1.0 over the 1 June 2007–3 November 2011 period, (b) SMOPS version 2.0 over the 16 November 2011–20 September 2016 period, (c) SMOPS version 3.0 over the 1 April 2015–31 December 2019 period, as well as (d) global domain-averaged frequency probability as a function of average soil moisture for the three version SMOPS blended soil moisture data products during the corresponding product time periods.
Remotesensing 12 02861 g001
Figure 2. Processing flow of the daily SMOPS blended soil moisture data product. The abbreviations SM and Tb indicate soil moisture and brightness temperature.
Remotesensing 12 02861 g002
Figure 3. With respect to the quality controlled soil climate analysis network (SCAN) observations, correlation coefficients (r) for (a) SMOPS version 1.0 over the 1 June 2007–3 November 2011 period, (b) SMOPS version 2.0 over the 16 November 2011–20 September 2016 period, (c) SMOPS version 3.0 over the 1 April 2015–31 December 2019 period, as well as (d) contiguous United States (CONUS) domain-averaged frequency probability as a function of correlation coefficients for the three versions SMOPS blended soil moisture data products during the corresponding product time periods with curves shifting toward the right (left) indicating stronger (weaker) correlations.
Remotesensing 12 02861 g003
Figure 4. With respect to the quality controlled SCAN observations, root mean square errors (RMSEs in m3/m3 unit) for (a) SMOPS version 1.0 over the 1 June 2007–3 November 2011 period, (b) SMOPS version 2.0 over the 16 November 2011–20 September 2016 period, (c) SMOPS version 3.0 over the 1 April 2015–31 December 2019 period, as well as (d) CONUS domain-averaged frequency probability as a function of RMSE for the three versions SMOPS blended soil moisture data products during the corresponding product time periods with curves shifting the toward left (right) indicating lower (greater) errors.
Remotesensing 12 02861 g004
Figure 5. With respect to the quality controlled SCAN observations, unbiased root mean square errors (ubRMSEs in m3/m3 unit) for (a) SMOPS version 1.0 over the 1 June 2007–3 November 2011 period, (b) SMOPS version 2.0 over the 16 November 2011–20 September 2016 period, (c) SMOPS version 3.0 over the 1 April 2015–31 December 2019 period, as well as (d) CONUS domain-averaged frequency probability as a function of RMSE for the three versions SMOPS blended soil moisture data products during the corresponding product time periods with curves shifting toward the left (right) indicating lower (greater) errors.
Remotesensing 12 02861 g005
Figure 6. With respect to the European Space Agency’s Climate Change Initiative (ESA_CCI) observations, root mean square differences (RMSDs in m3/m3 unit) for (a) SMOPS version 1.0 over the 1 June 2007–3 November 2011 period, (b) SMOPS version 2.0 over the 16 November 2011–20 September 2016 period, (c) SMOPS version 3.0 over the 1 April 2015–31 December 2019 period, as well as (d) global domain-averaged frequency probability as a function of RMSD for the three versions SMOPS blended soil moisture data products during the corresponding product time periods with curves shifting toward the left (right) indicating lower (greater) errors.
Remotesensing 12 02861 g006
Figure 7. With respect to the quality controlled SCAN observations, differences in RMSEs (m3/m3) between SMOPS version 3.0 and ESA_CCI version 4.5 over the 1 April 2015–31 December 2018 period. Sites in blue (red) color indicate that SMOPS is better (worse) than ESA_CCI.
Remotesensing 12 02861 g007
Table 1. Satellite sensors of which observations are combined into the daily soil moisture operational product system (SMOPS) blended soil moisture data products.
SensorIFOV (km)BandSwathAltitudeAntenna SizeSMOPS VersionReference
AMSR-E74 × 436.9 GHZ~1445 km~705 km1.6 m1.0[22]
WindSat39 × 716.8 GHZ~1025 km~830 km1.8 m1.0[11]
ASCATA25–355.3 GHz~550 km~817 km— *1.0–3.0[13]
ASCATB25–355.3 GHz~550 km~817 km— *2.0–3.0[13]
AMSR-262 × 356.925 GHz~1450 km~700 km2.0 m2.0–3.0[19]
SMOS~451.4 GHz~ 900 km~765 km4.0 m **2.0–3.0[12]
SMAP39 × 471.41 GHz~1000 km~685 km6.0 m3.0[1]
Superscripts * and ** indicate scatterometer with six antennas, and antenna arm length of interferometry, respectively. The acronym IFOV indicates Instantaneous Field of View.

