Article

Thermal Infrared and Ionospheric Anomalies of the 2017 Mw6.5 Jiuzhaigou Earthquake

1
State Key Laboratory of Earthquake Dynamics, Institute of Geology, China Earthquake Administration, Beijing 100029, China
2
Lanzhou Geophysics National Observatory and Research Station, Lanzhou 730000, China
3
Institute of Earthquake Forecasting, China Earthquake Administration, Beijing 100036, China
*
Author to whom correspondence should be addressed.
Remote Sens. 2020, 12(17), 2843; https://doi.org/10.3390/rs12172843
Submission received: 20 July 2020 / Revised: 29 August 2020 / Accepted: 30 August 2020 / Published: 1 September 2020

Abstract

:
Taking the 2017 Mw6.5 Jiuzhaigou earthquake as a case study, ionospheric disturbances (i.e., total electron content and TEC) and thermal infrared (TIR) anomalies were simultaneously investigated. The characteristics of the temperature of brightness blackbody (TBB), medium-wave infrared brightness (MIB), and outgoing longwave radiation (OLR) were extracted and compared with the characteristics of ionospheric TEC. We observed different relationships among the three types of TIR radiation according to seismic or aseismic conditions. A wide range of positive TEC anomalies occurred southern to the epicenter. The area to the south of the Huarong mountain fracture, which contained the maximum TEC anomaly amplitudes, overlapped one of the regions with notable TIR anomalies. We observed three stages of increasing TIR radiation, with ionospheric TEC anomalies appearing after each stage, for the first time. There was also high spatial correspondence between both TIR and TEC anomalies and the regional geological structure. Together with the time series data, these results suggest that TEC anomaly genesis might be related to increasing TIR.

Graphical Abstract

1. Introduction

Electromagnetic signals can spread from the lithosphere to the atmosphere and ionosphere via electromagnetic, acoustic, and geochemical pathways, and models for “lithosphere—atmosphere—ionosphere” coupling (LAIC) during electromagnetic propagation have been experimentally derived [1,2,3,4]. Studies have shown that the thermal infrared anomalies related to earthquakes are a form of electromagnetic disturbance. In the late 1980s, Soviet scientists discovered preseismic infrared radiation anomalies when analyzing earthquake activity in the Middle East [5]; since then, many studies have investigated seismic infrared anomalies and found that during the process of energy accumulation and release (e.g., earthquakes), the crustal structure can be coupled with changes in ground thermal infrared radiation [6,7,8,9,10,11,12]: e.g., rock testing was made in laboratory, the observed enhanced mid-IR emission is believed to arise based on some physical mechanism; the complex analysis of TIR satellite data demonstrated that the transient TIR anomalies starts along the main tectonic fault zone and variations could be seen in a radius of approximately 100 km around the epicenter over the land and sea. From the analysis of bright temperature data, Xu [13] identified clear preseismic thermal infrared anomalies 2–22 days before earthquakes. Zhang [14] identified obvious thermal anomalies before large earthquakes (e.g., the 2008 M s 8.0 Wenchuan earthquake).
When earthquake electromagnetic signals propagate into the ionosphere, they can cause a disturbance of related ionospheric parameters [15,16,17,18,19,20,21,22], and satellite can observe those seismic electromagnetic effects. Since the ionospheric disturbance phenomenon was first observed over the epicenter of the 1960 M9.2 Alaska earthquake, a large number of statistical analyses have shown corresponding disturbance phenomena in the atmosphere and ionosphere above epicentral zones in the days to hours before earthquakes [23,24,25,26,27,28,29,30,31]. When describing ionospheric disturbances, the total electron content (TEC) is an important parameter. Le et al. [32] used Global Positioning System (GPS) TEC data to analyze 736 global M s ≥ 6.0 earthquakes from 2002 to 2010; they found that the GPS TEC changed with earthquake magnitude, depth, and occurrence time. Liu and Wan [33] used GPS TEC to analyze M s ≥ 6 earthquakes in China from 1998 to 2010 and found that abnormal disturbances occurred in multiple directions around epicenters in the 3–5 days before an earthquake. He et al. [34] studied the changes in electron density before and after 7000 global M s ≥ 5 earthquakes from 2006 to 2009 using DEMETER (Detection of Electro-Magnetic Emission Transmitted from Earthquakes) data; they found that preseismic anomalies were always concentrated near epicenters. Li and Parrot [35] used the statistical analysis of earthquake-related ion density recorded by DEMETER over a 6-year period to show that ion-density anomalies increase with increasing earthquake magnitudes, the largest ion-density anomalies occurred on earthquake days.
To investigate preseismic thermal infrared and ionospheric disturbances, various studies have developed anomaly extraction methods, performed thermodynamic tests, and suggested LAIC mechanisms and propagation models [36,37,38]. The simultaneous study of pre- and postseismic TIR and TEC anomalies would allow us more objectively understand the propagation of seismic electromagnetic radiation in LAIC.
The M w 6.5 earthquake occurred in Jiuzhaigou county, Sichuan province (China), at 13:19:49 on 8 August 2017 (UTC). The epicenter was located at 33.193° N and 103.855° E, and the earthquake had a depth of ~9 km (USGS). Based on the dominant orientation of the long axis of seismic intensity, the concentrated zones of seismic collapse and landslip, the repositioning of a dense band of aftershocks, and the main earthquake source, the event was a left strike slip earthquake with a steep dip angle. The generating fault was the northern section of NNW-trending Huya fault [39].
Zhang [40] calculated blackbody brightness temperatures for the 2017 M w 6.5 Jiuzhaigou earthquake using static meteorological satellite data with wavelet transform and power spectrum analysis. The results showed that preseismic thermal infrared radiation increased in a belt located along the Longmenshan fault zone on the edge of the Sichuan basin, likely reflecting a basin effect. Zhang [41] used global ionosphere grid data provided by the International Ground Station (IGS) network to analyze pre- and postseismic ionosphere TEC time series using the interquartile range method (IQR); the results showed obvious ionospheric anomalies on the 13th day before the earthquake and on the day of the earthquake. Zhai [42] used Global Navigation Satellite System (GNSS) data for reference stations of a land-based network to compare and analyze ionospheric TEC anomalies of the Songpan station (Sichuan province) using an IQR method and the Prophet model; the results showed three positive anomalies (the 7th day before the earthquake and the 1st day and the 7th day after the earthquake) and three negative anomalies (the 10th day, 2nd day before the earthquake, and the 6th day after the earthquake).
In this study, we made more deep investigation simultaneously to ionospheric disturbances and thermal infrared anomalies of the 2017 M w 6.5 Jiuzhaigou earthquake. We used the power spectrum method to extract thermal infrared anomaly features from the data products of the Fēngyún (FY) stationary satellite. The perturbation characteristics of TEC before and after the earthquake were extracted from GNSS data of a land-based network reference station using the IQR method. Combined with the geological structure and solar and geomagnetic activity indices, seismic ionospheric disturbances and thermal infrared anomalies were contrastively analyzed from multiple perspectives.
In most studies of seismic thermal anomalies, satellite remote sensing data products are used to analyze infrared anomaly information in different wavelengths, including temperature of brightness blackbody (TBB), medium-wave infrared brightness (MIB), and outgoing longwave radiation (OLR). However, till date, there has been no comparative study of these three infrared data types related to earthquake. As different satellites have different orbits, attitudes, and radiometer parameters, comparative analysis of data from different satellites is hampered by systematic interference. Therefore, in this study, infrared data of different wavebands observed by the same satellite at the same time were compared so as to objectively understand earthquake-related thermal infrared anomalies.

2. Data and Calculation Methods

2.1. Infrared Data and Methods

We used TBB, OLR, and MIB data observed by the Chinese stationary meteorological satellites FY-2E and FY-2G. FY-2E was launched on 15 June 2008, whereas FY-2G, a substitute satellite for FY-2E, was launched on 31 December 2014. They are both located at a fixed point of more than 35,000 km above the equator at 105° E and have an effective observation range of 45°–165° E and 60° S–60° N.
The main FY-2E and FY-2G payloads are visible light and infrared self-spin scan radiators; detailed parameters of the infrared channels are shown in Table 1. TBB is obtained by quantifying radiation values after observing underlying surface objects using the scanning radiometer; it reflects the temperatures of brightness of different underlying surfaces and its value is obtained by comparing the value observed by satellite thermal infrared channel 1 (the gray value) with a corresponding temperature lookup table. Satellite OLR products are mainly generated by calculating the gray image data of infrared channel 1, infrared channel 2, and the water vapor channel. MIB was studied using data from infrared channel 4.
For the three types of satellite data, the power spectrum method was used to extract anomalies. In past studies, to avoid the impact of solar radiation on the land surface temperature, a mean value for data collected from 1:00 a.m. to 5:00 a.m. (local premorning) has been used to investigate thermal infrared anomalies. However, using mean values can smooth the data; therefore, data were used that were collected at 5:00 a.m. (local premorning) from 1 January 2014 to 30 September 2017. The main steps for extracting anomalies from power spectra were as follows [14].
(1) Wavelet transform was applied to the three kinds of satellite data using the db8 wavelet basis in the Daubechies (dbN) wavelet system. Continuous infrared data information includes the basic temperature field of the Earth (dc part), the annual temperature field, the daily temperature field, temperature changes caused by rain clouds and by cold or hot air streams, and minor temperature changes caused by other factors (including earthquakes).
Original record of TBB (Figure 1a) was taken as an introduction case. Rain clouds and cold or hot airflows caused by temperature change generally occur over short timescales (hours to days) and can be removed by wavelet transform, i.e., removal of some of the second step wavelet detail (high frequency information) (Figure 1c). The application of a wavelet transform can also remove the basic temperature field of the Earth and the annual temperature field; e.g., removal of some of the seventh step wavelet scale with significant annual change information (low-frequency information) (Figure 1d). With the second step wavelet scale (Figure 1b) minus the seventh step wavelet scale, the information of the intermediate frequency band can be retained and the information of high frequency and low frequency is omitted; this step is equivalent to a bandpass filtering. After above steps, each pixel in the time domain had a waveform data that showed relative changes between positive and negative anomalies (Figure 1e).
(2) Power spectrum estimation was used to analyze a massive volume of data over their full temporal and spatial scales. Fourier transform was performed using a n = 64 day window length and m = 1 day slide window length. We then calculated the power spectra; the time series data of every pixel was used to obtain each power spectrum, with the time set by the start time of the window data. In this way, time-frequency space data were obtained. The frequency and amplitude were used to analyze the similarities and differences in thermal power spectra between aseismic and seismic periods.
(3) To better compare thermal power spectra from before and after the earthquake, all power spectrum frequencies for each pixel were processed with relative amplitudes in order to generate spatial data with a time-frequency relative change using Equations (1) and (2):
A i k = 1 l j = 1 l W i j k , ( i = 1 , 2 , , n ;   k = 1 , 2 , , m )
R i j k = W i j k A i k , ( i = 1 , 2 , , n ;   j = 1 , 2 , , l ;   k = 1 , 2 , , m )
where n is the total number of pixels, m is the number of frequency points, l is the total number of time series data, and W i j k is power spectrum amplitude of the ith pixel on the jth day in the kth frequency. The A i k is the average power spectrum amplitude within statistical time (length l) in the kth frequency of the ith pixel. The relative power spectrum amplitude of the kth frequency on the jth day of the ith pixel is calculated using Equation (2). This mathematical calculation method is mature, and the calculation process is simple. The time-frequency spatial data obtained were used to scan the whole space-time range and all of frequency bands in order to identify frequencies (i.e., the characteristic period) corresponding to large changes in amplitude.

2.2. TEC Data and Methods

The TEC data used in this study were retrieved from the GNSS data of a land-based network of base stations. This network consists of three parts: a base network, a regional network, and a data system. The base network is composed of 260 continuously observing base stations distributed in and around the Chinese mainland. In this study, the GNSS TEC data of 103 stations located in eight provinces and regions (Gansu, Qinghai, Shaanxi, Ningxia, Sichuan, Yunnan, Guizhou, and Xizang) around the epicenter were used (Figure 2).
In this study, the IQR method was used for TEC anomaly detection. In statistics, after a group of data is arranged from small to large and equally divided into four parts, the values at the three segmentation points are the quartiles. The difference of the 75 percentile and the 25 percentile is the interquartile range (IQR). Using the IQR method, a dynamic background reference value M was derived from several days of data before the earthquake. The median M and IQR were used to set an upper boundary on L1 and lower boundary on L2, where L1 and L2 are defined by Equation (3) and Equation (4), respectively:
L1 = M + 1.5 × IQR
L2 = M − 1.5 × IQR
A positive anomaly occurs when a data point is larger than the upper boundary, whereas a negative anomaly occurs when a data point is smaller than the lower boundary.
Here, the ratio of the quartile distance to the standard deviation(σ) is 1.34 according to Gaussian distribution, so we define M + 1.5 × IQR or M − 1.5 × IQR is abnormal boundary. This threshold range is close to 2σ, and under this condition, the confidence of the anomaly detection method is 95%.

3. Results and Discussion

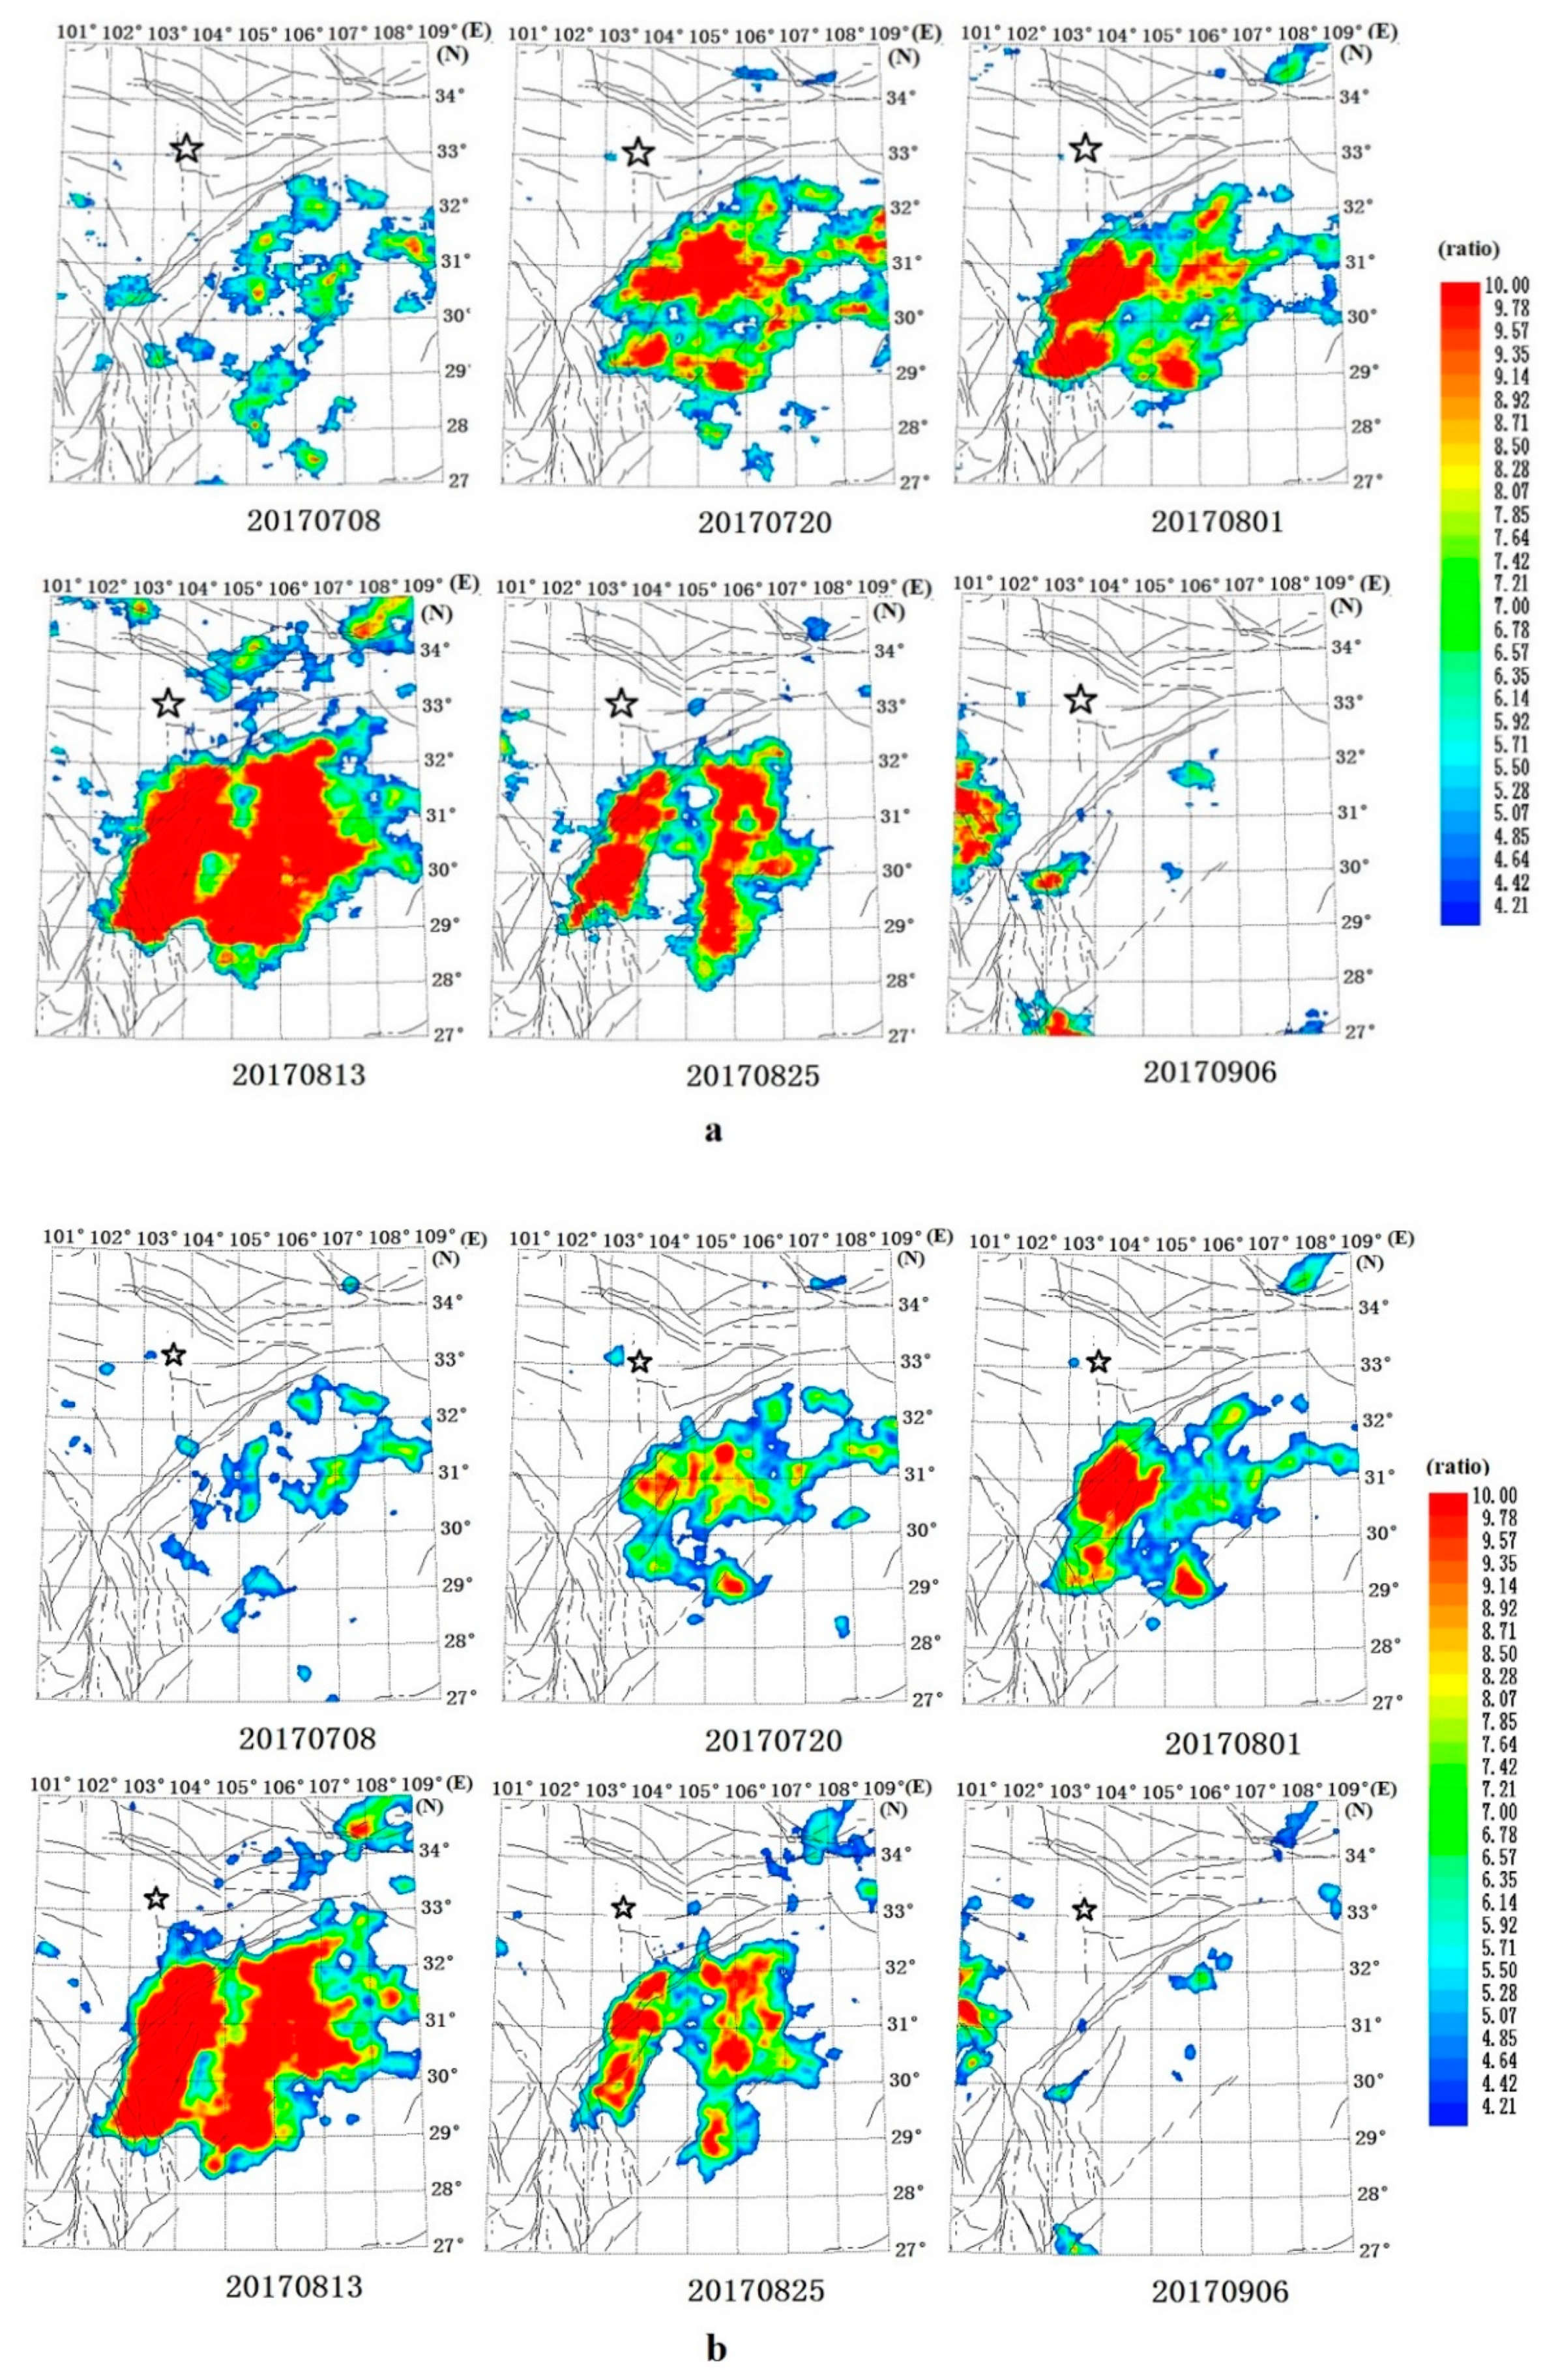
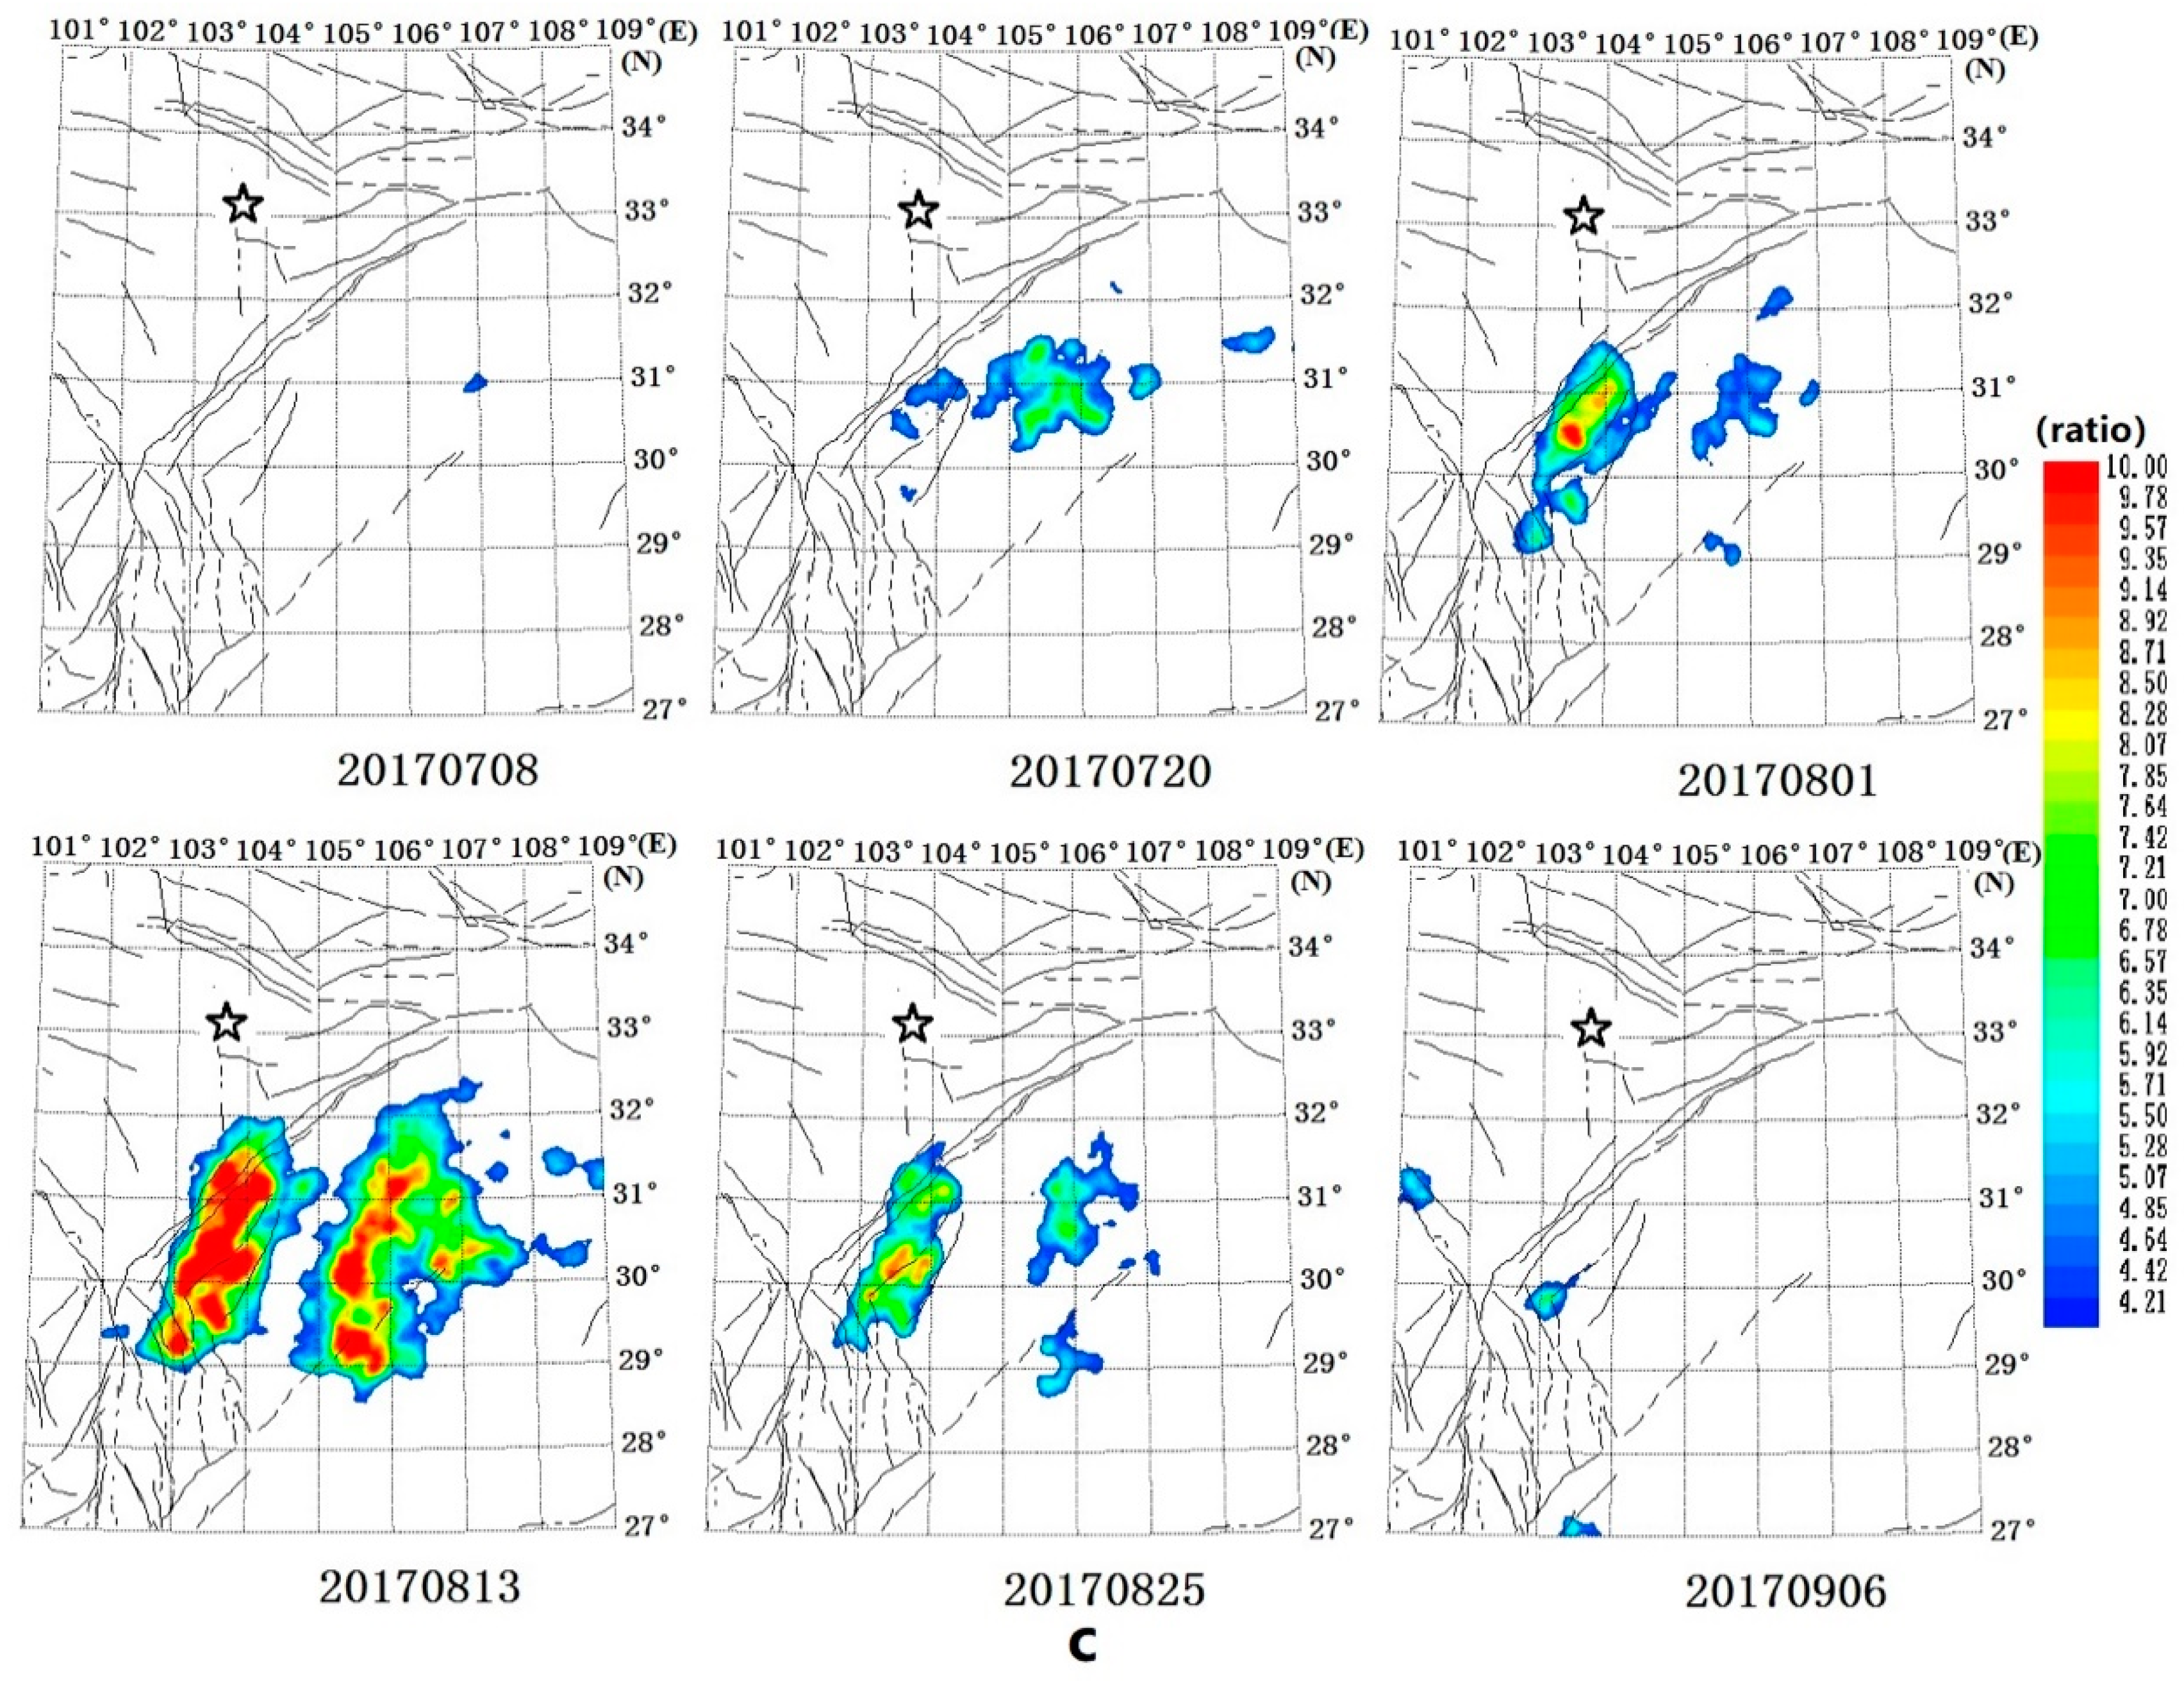
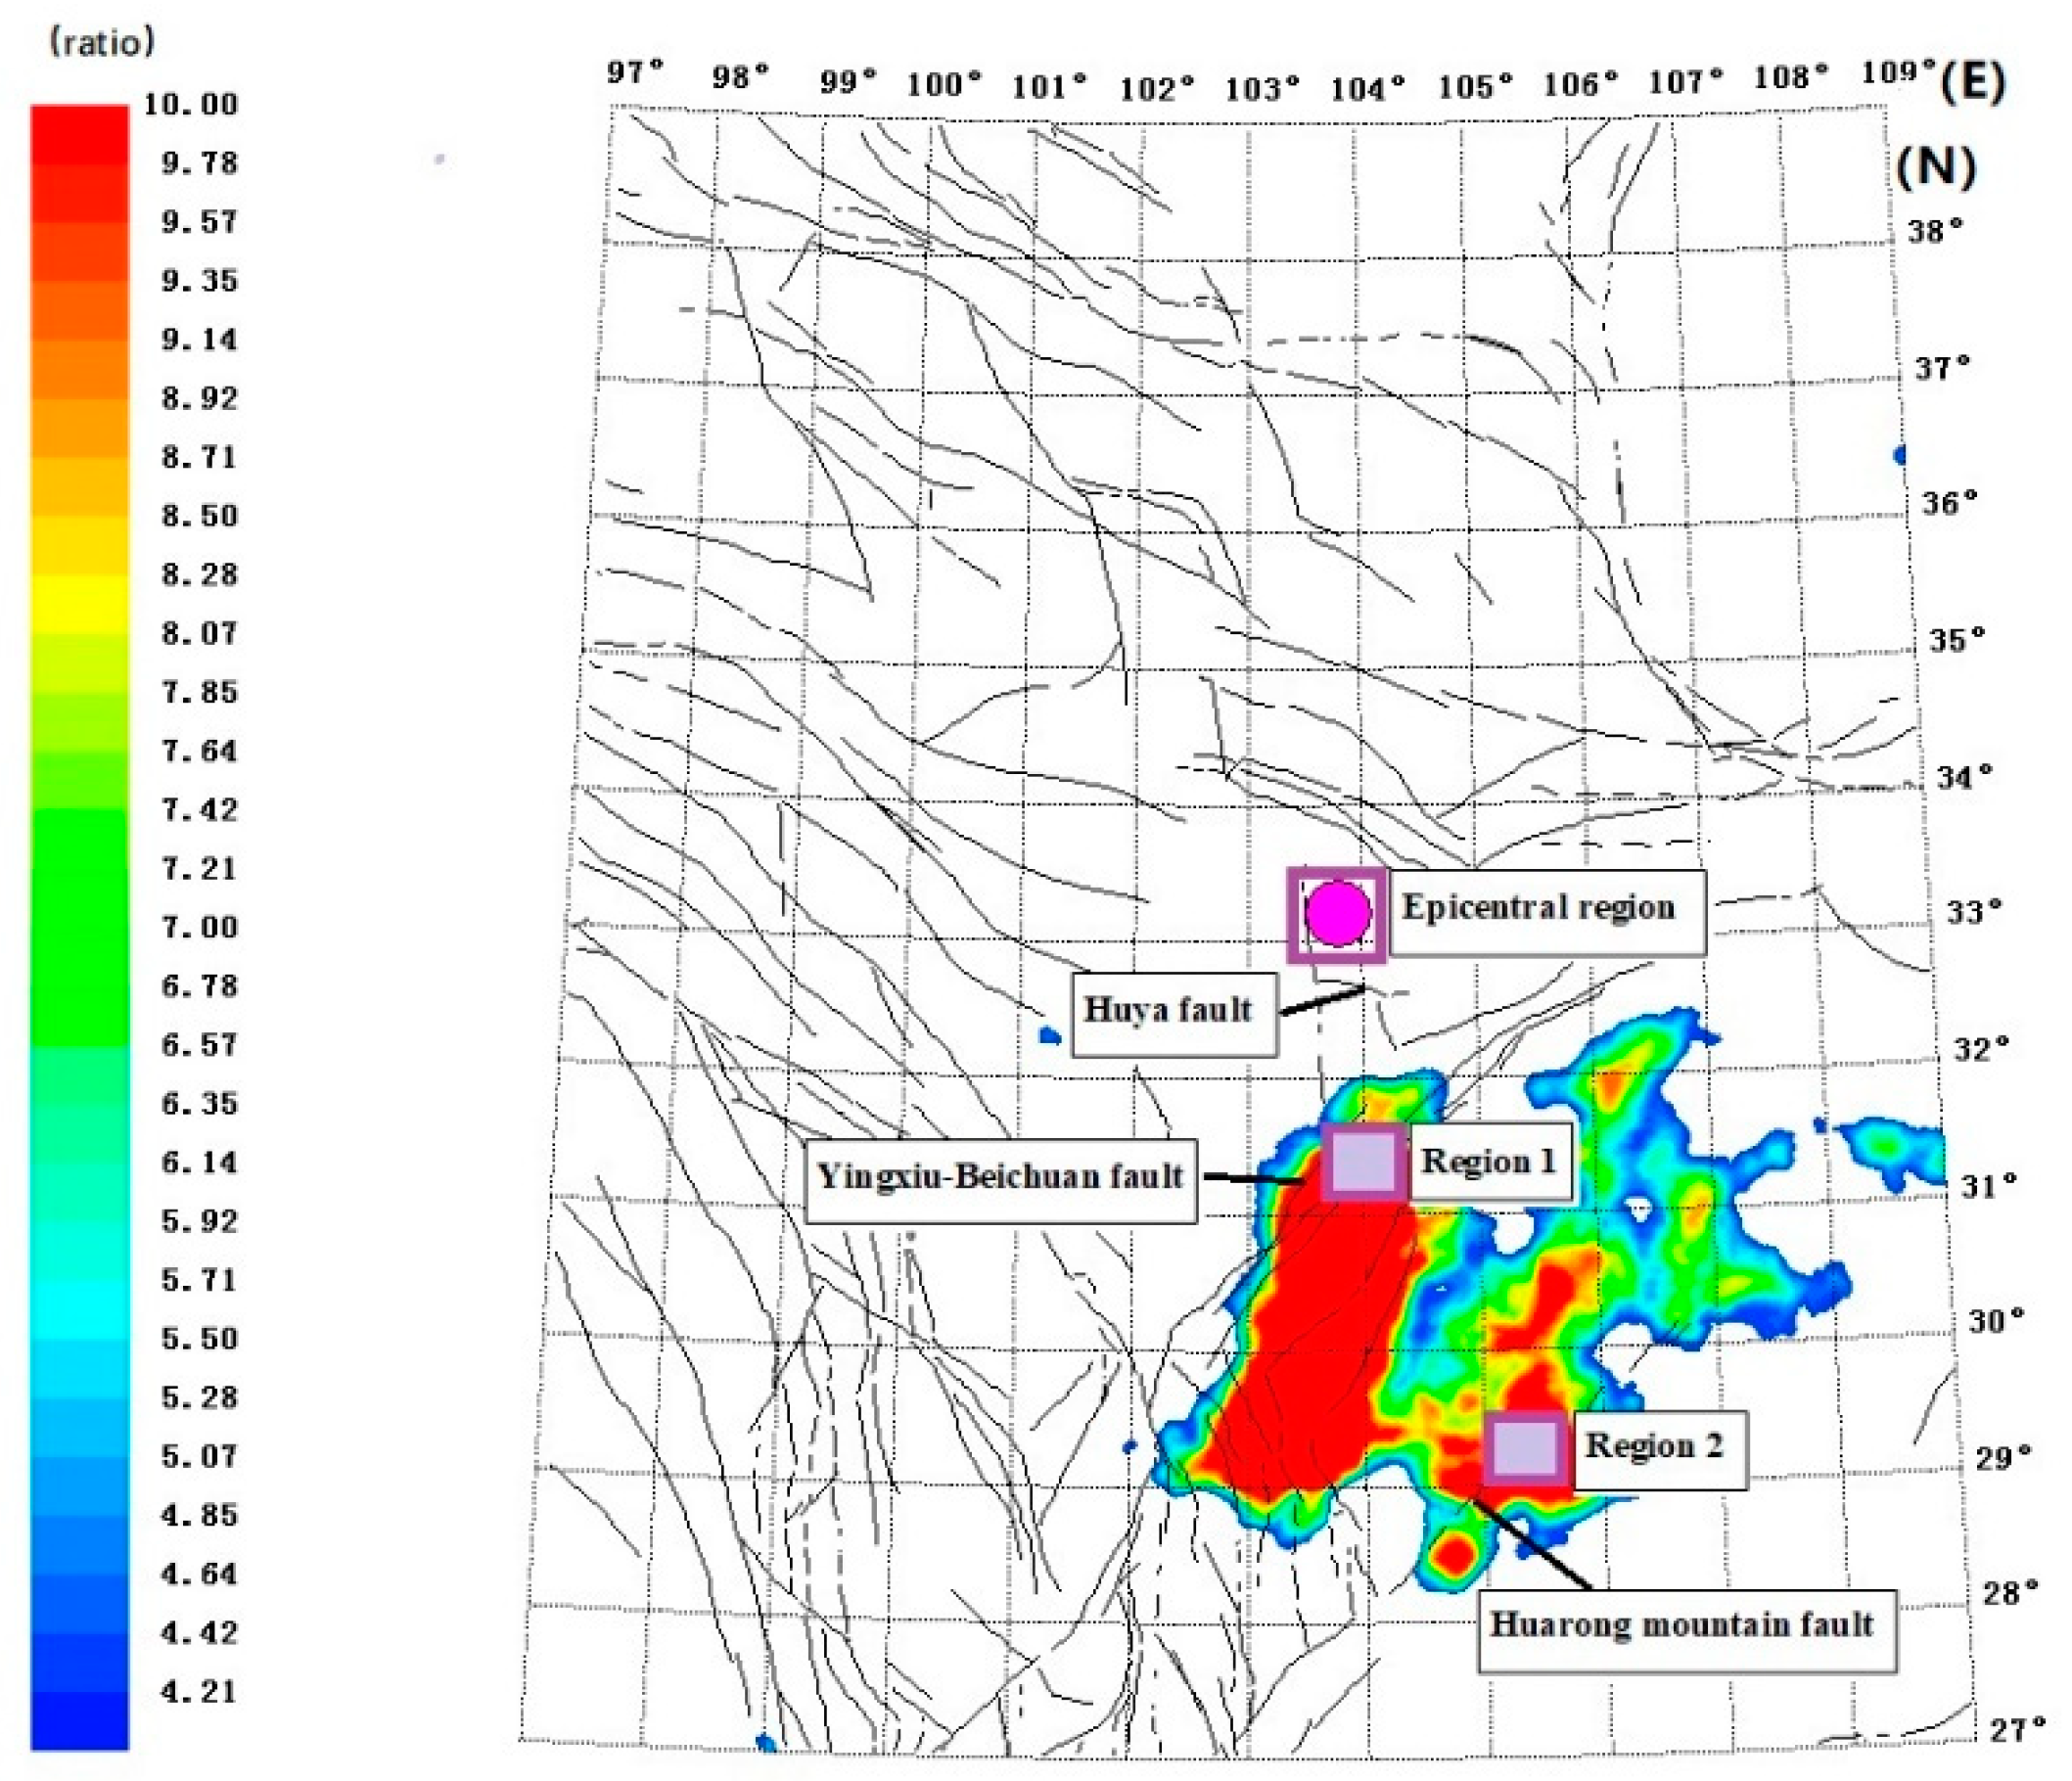
3.1. Spatial Evolution of Infrared Anomalies

According to the power spectra, infrared anomalies were generally distributed southeast of the epicenter (Figure 3). The first anomaly appeared along the southern Yingxiu-Beichuan fault; it gradually strengthened and then began to appear along the Huarong mountain fault. After the earthquake, anomalies located along the Huarong mountain fault began to disappear; the anomaly on the southern Yingxiu-Beichuan fault disappeared last. TBB and MIB anomalies were apparent first (8 July), followed by OLR anomalies (14 July). All three anomaly types had disappeared completely by mid-September.
The spatial distributions of MIB, TBB, and OLR anomalies were all in the same seismogenic fault region, suggesting that all three were potentially related to the earthquake. The MIB data contained significant noise away from the anomaly area, which made identification of the anomaly area more difficult. In contrast, even weak amplitude OLR anomalies were clearly identifiable by the end of July. However, the results suggest that power spectrum analysis using TBB is best for identifying earthquake-related infrared anomalies.

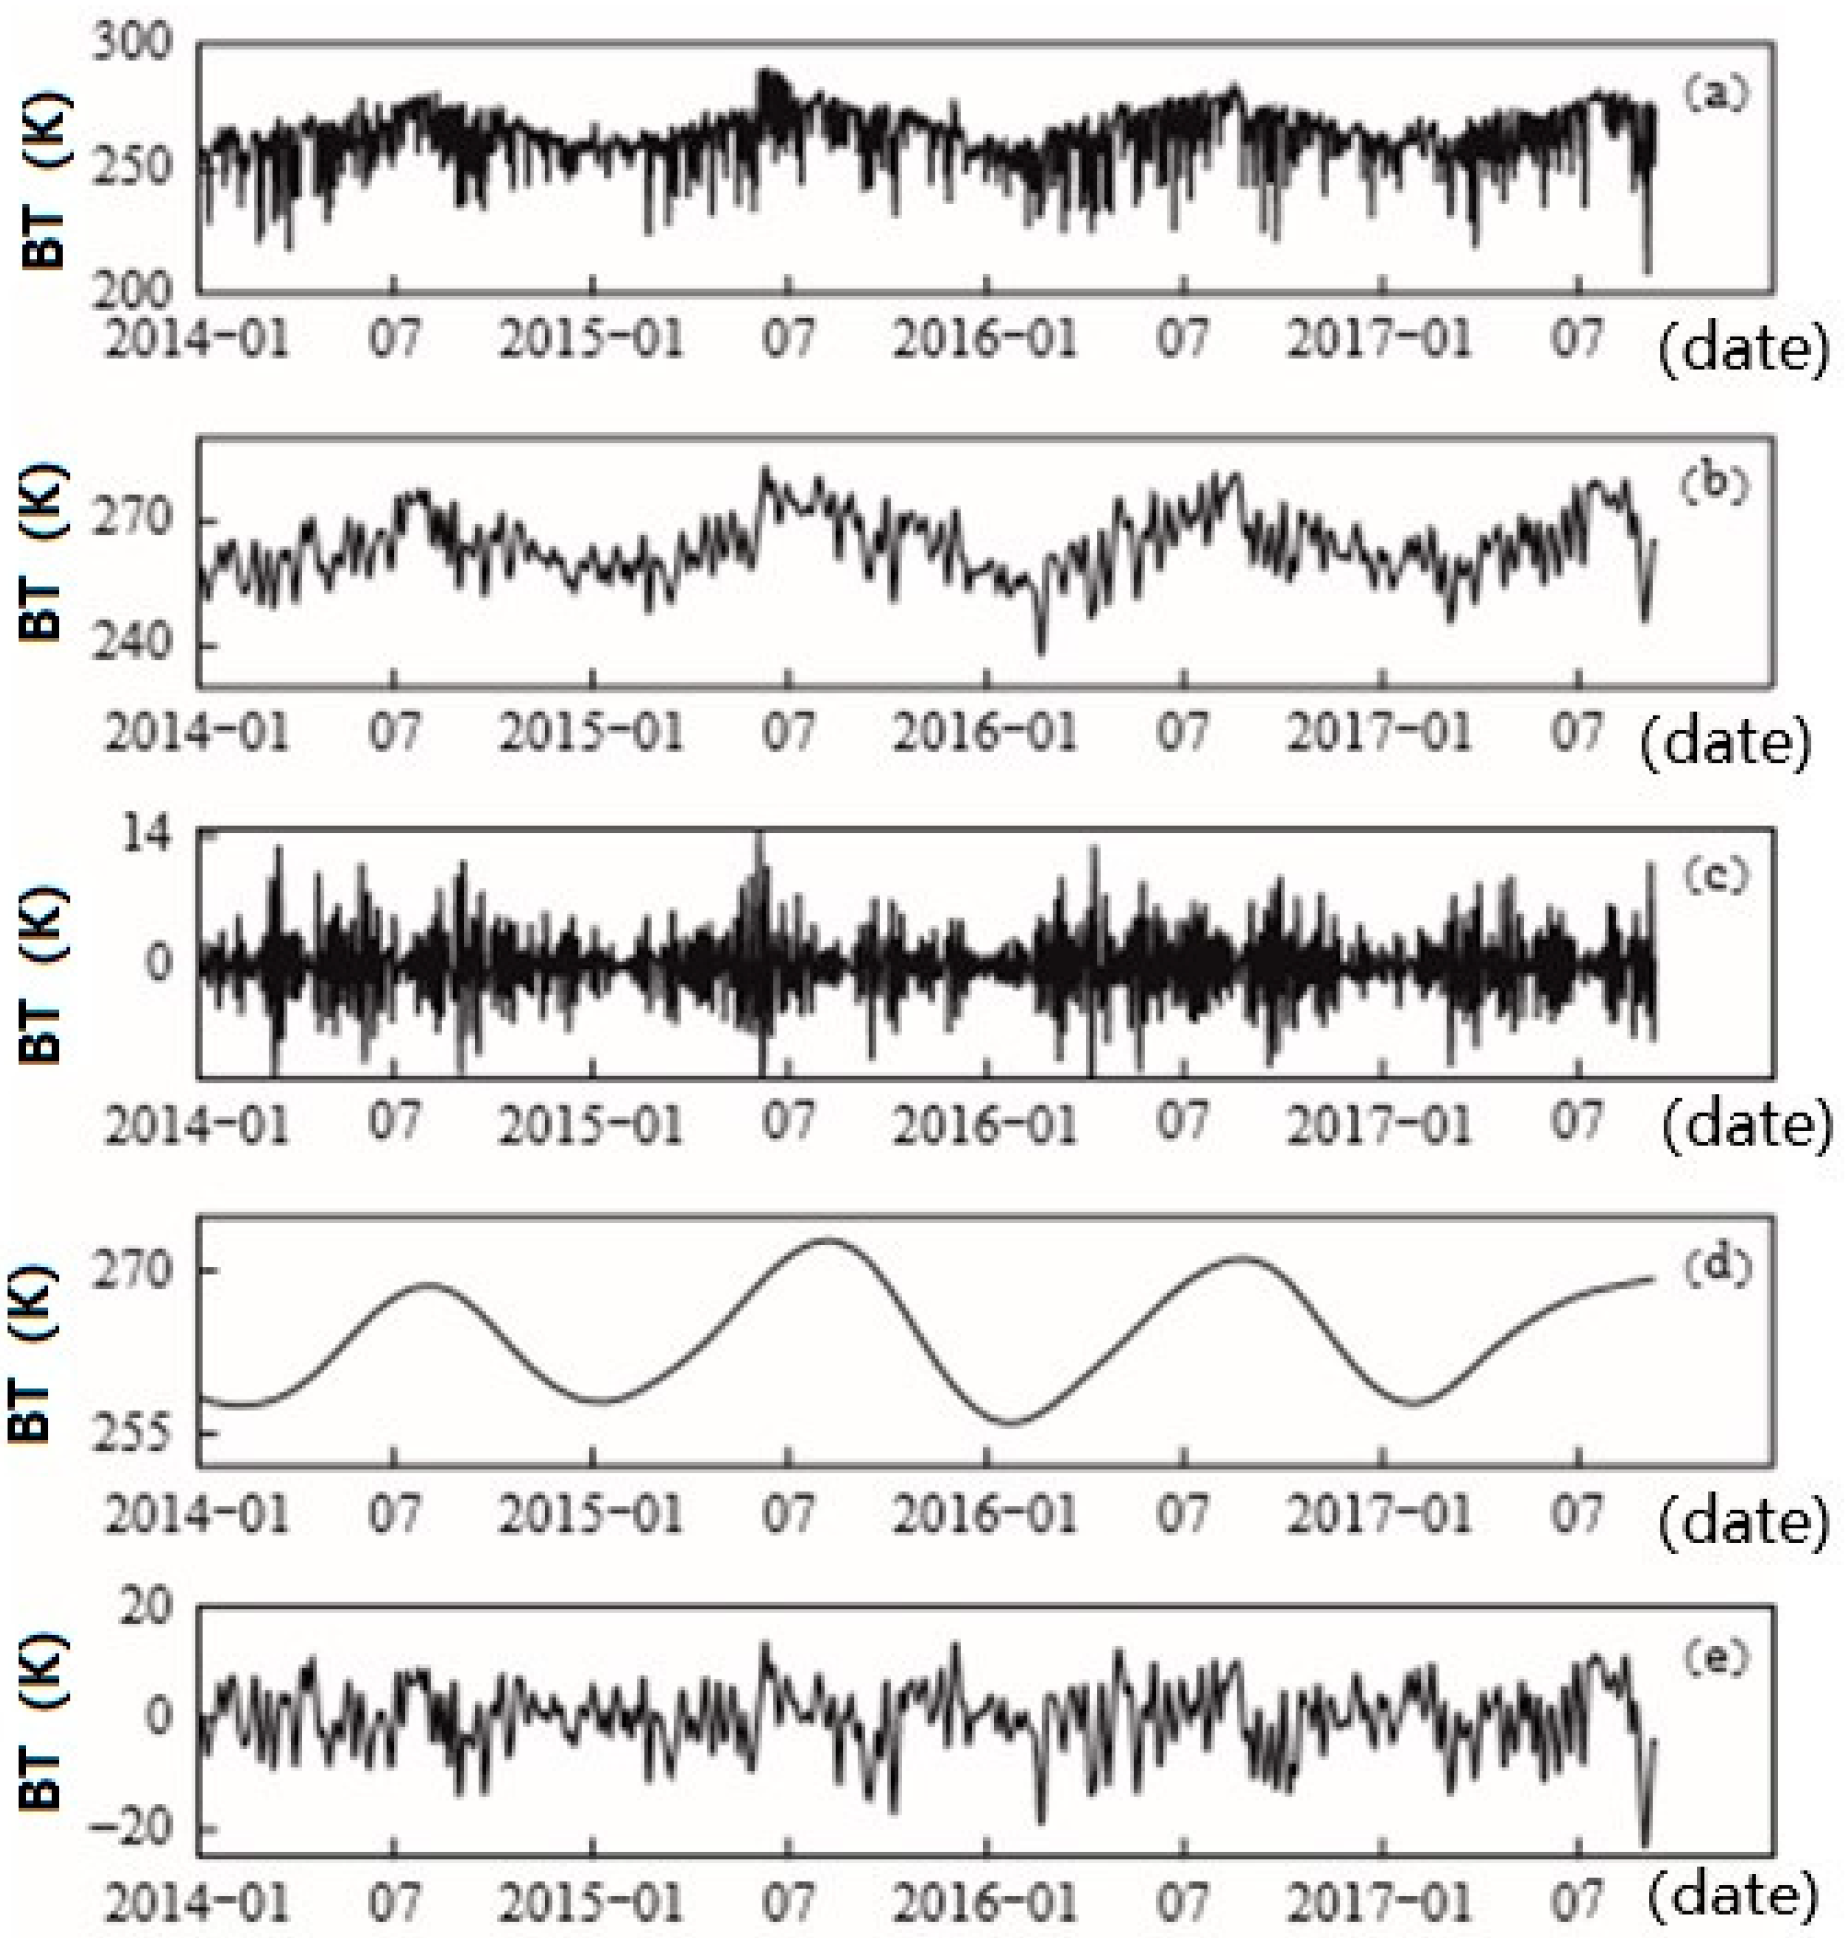
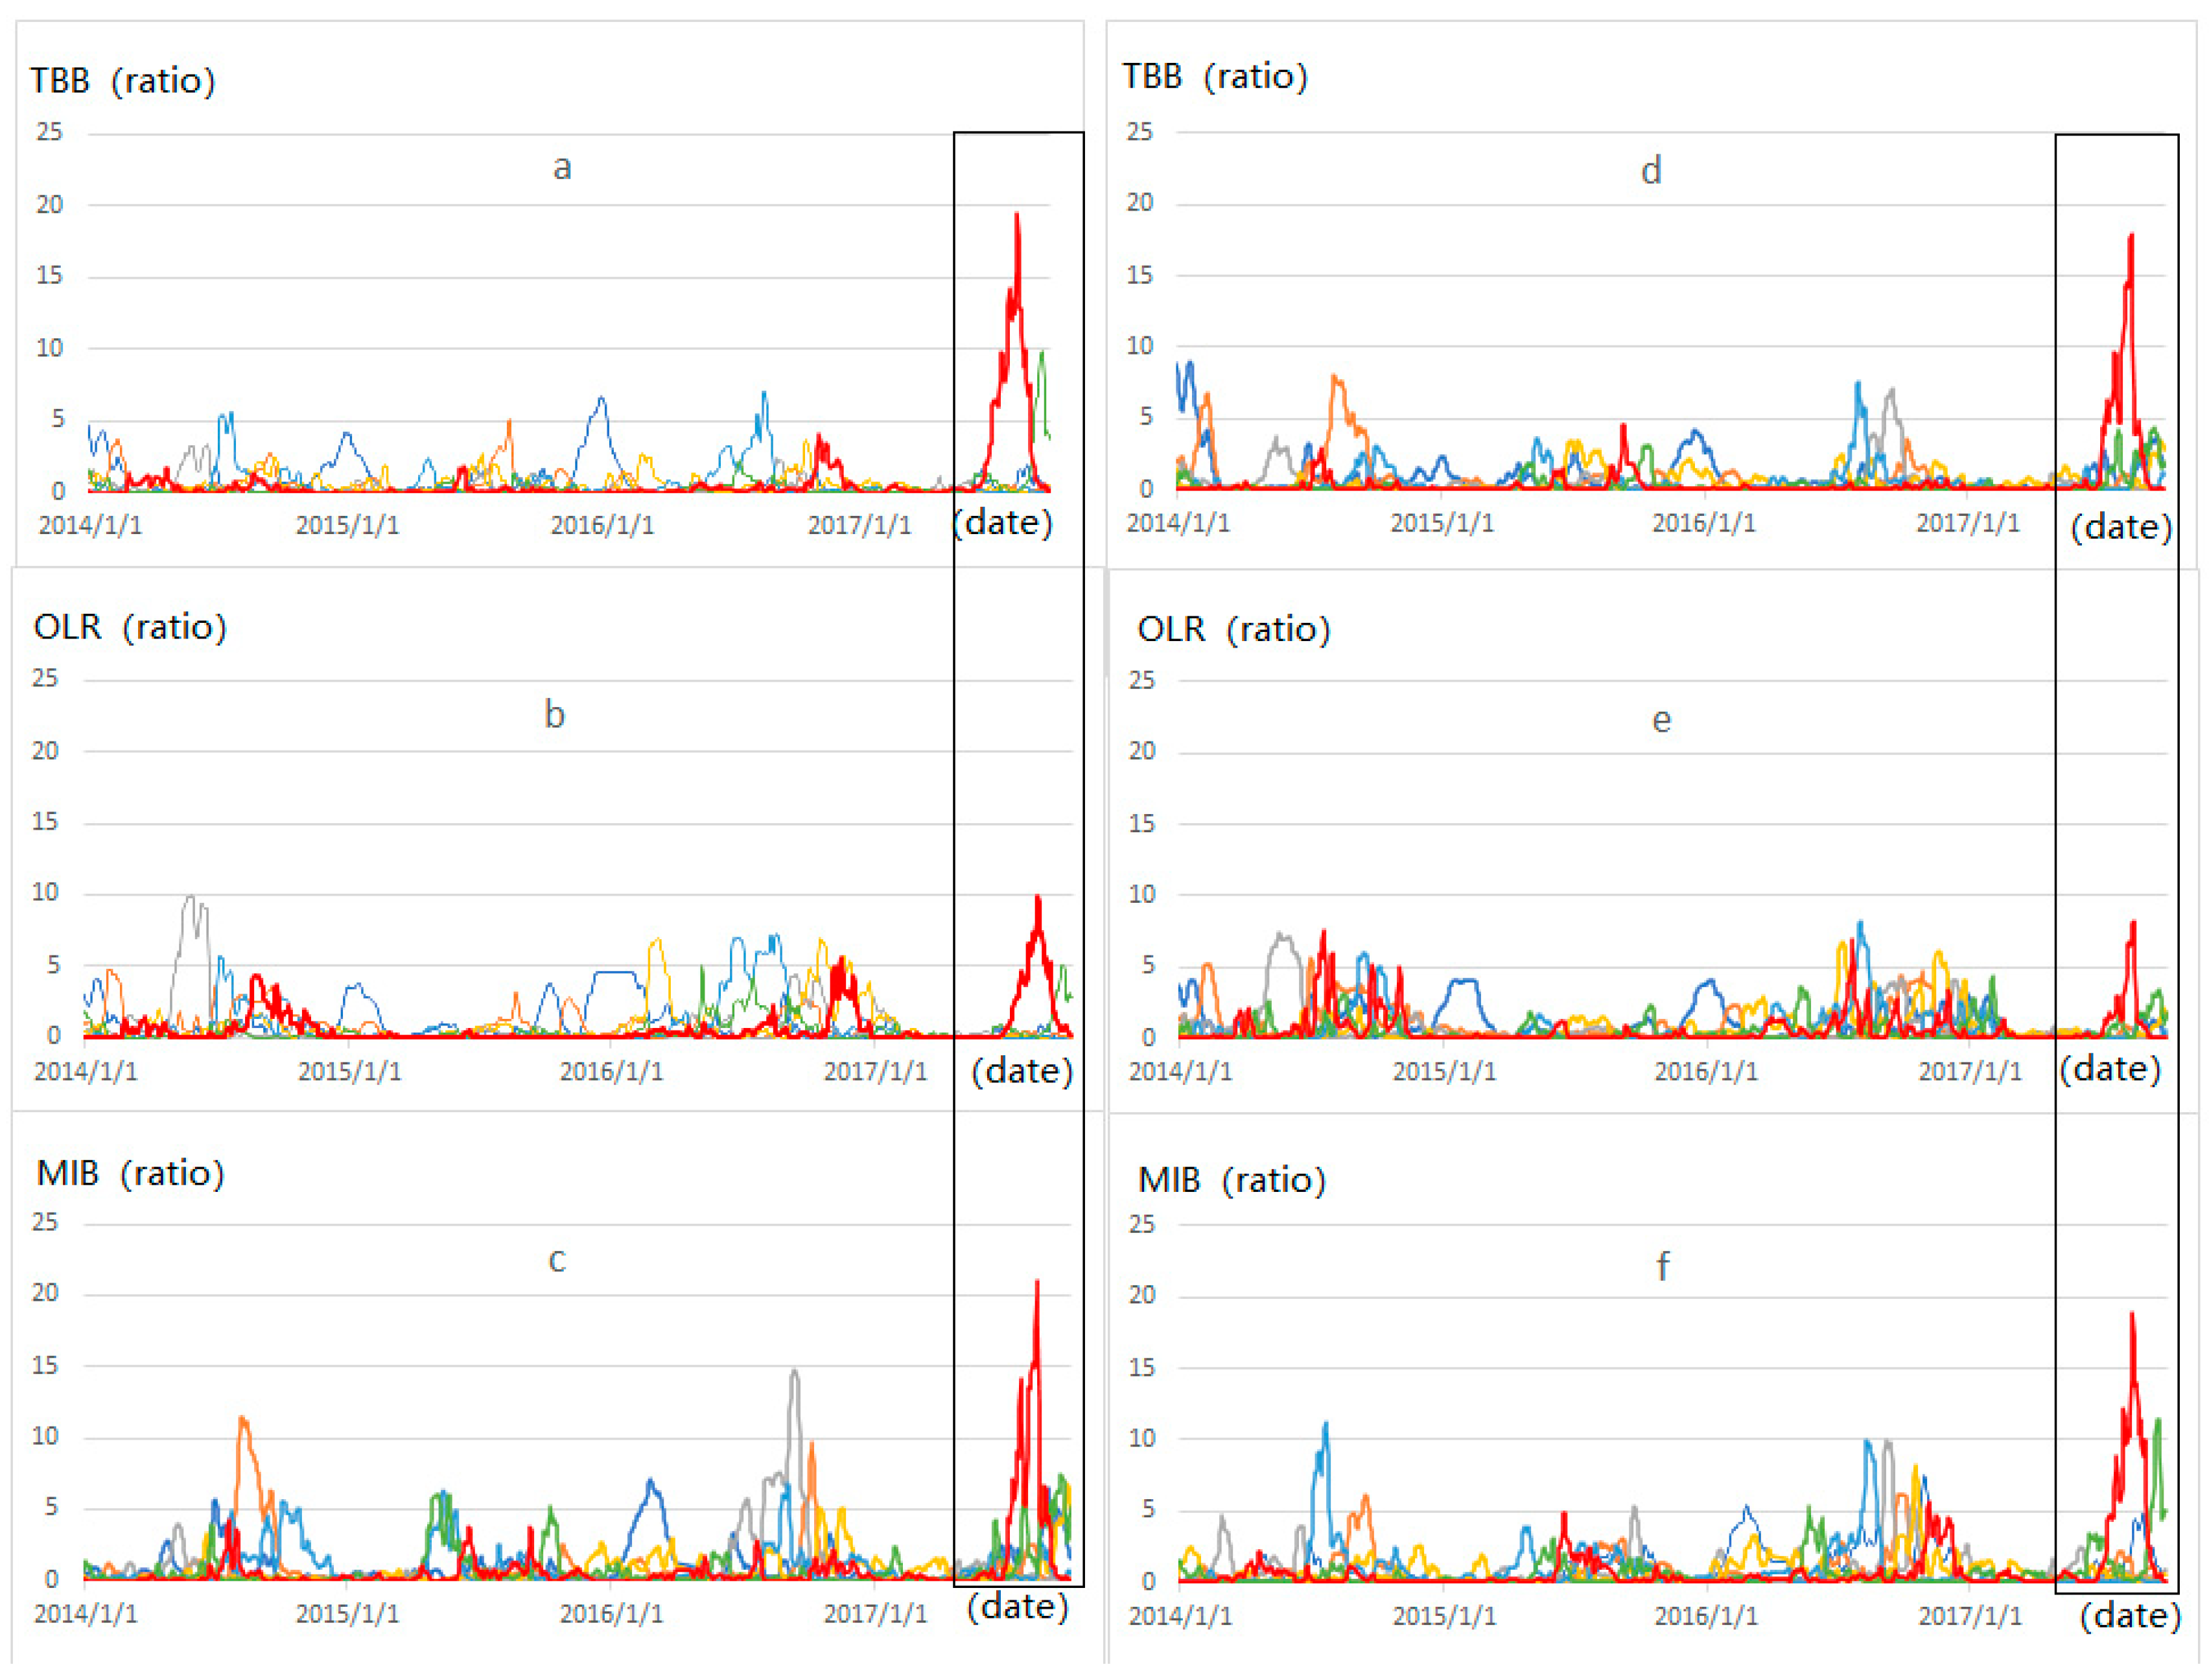
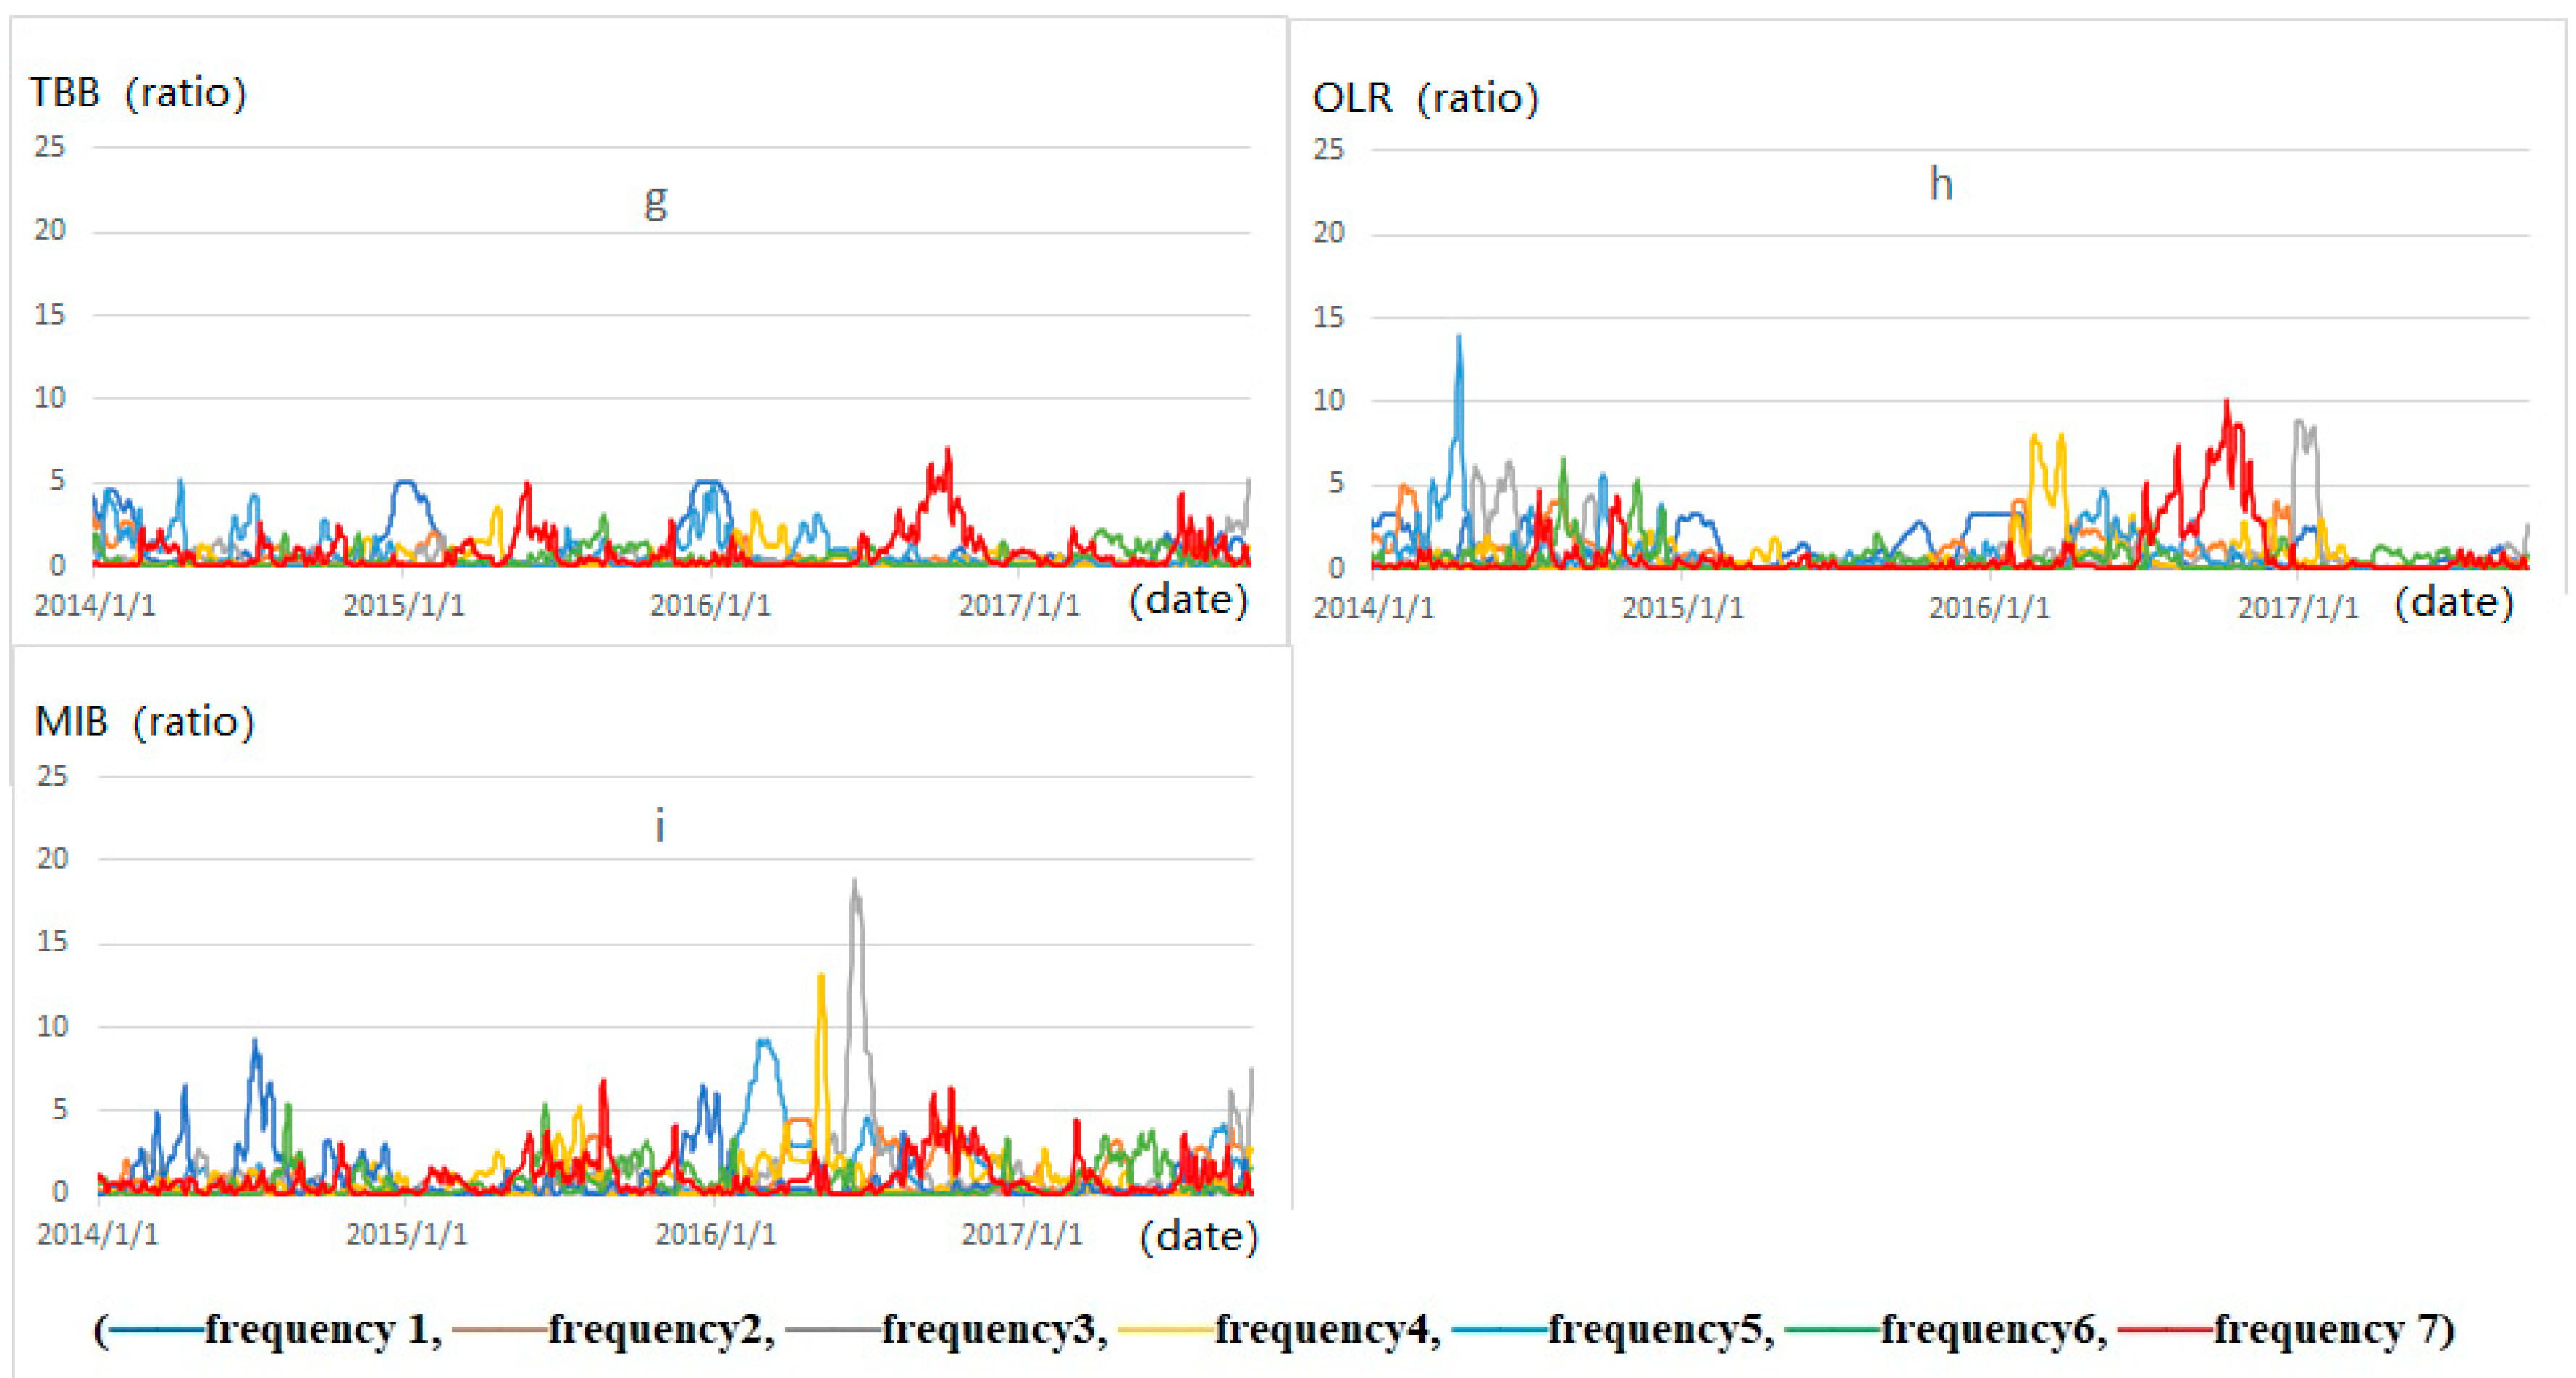
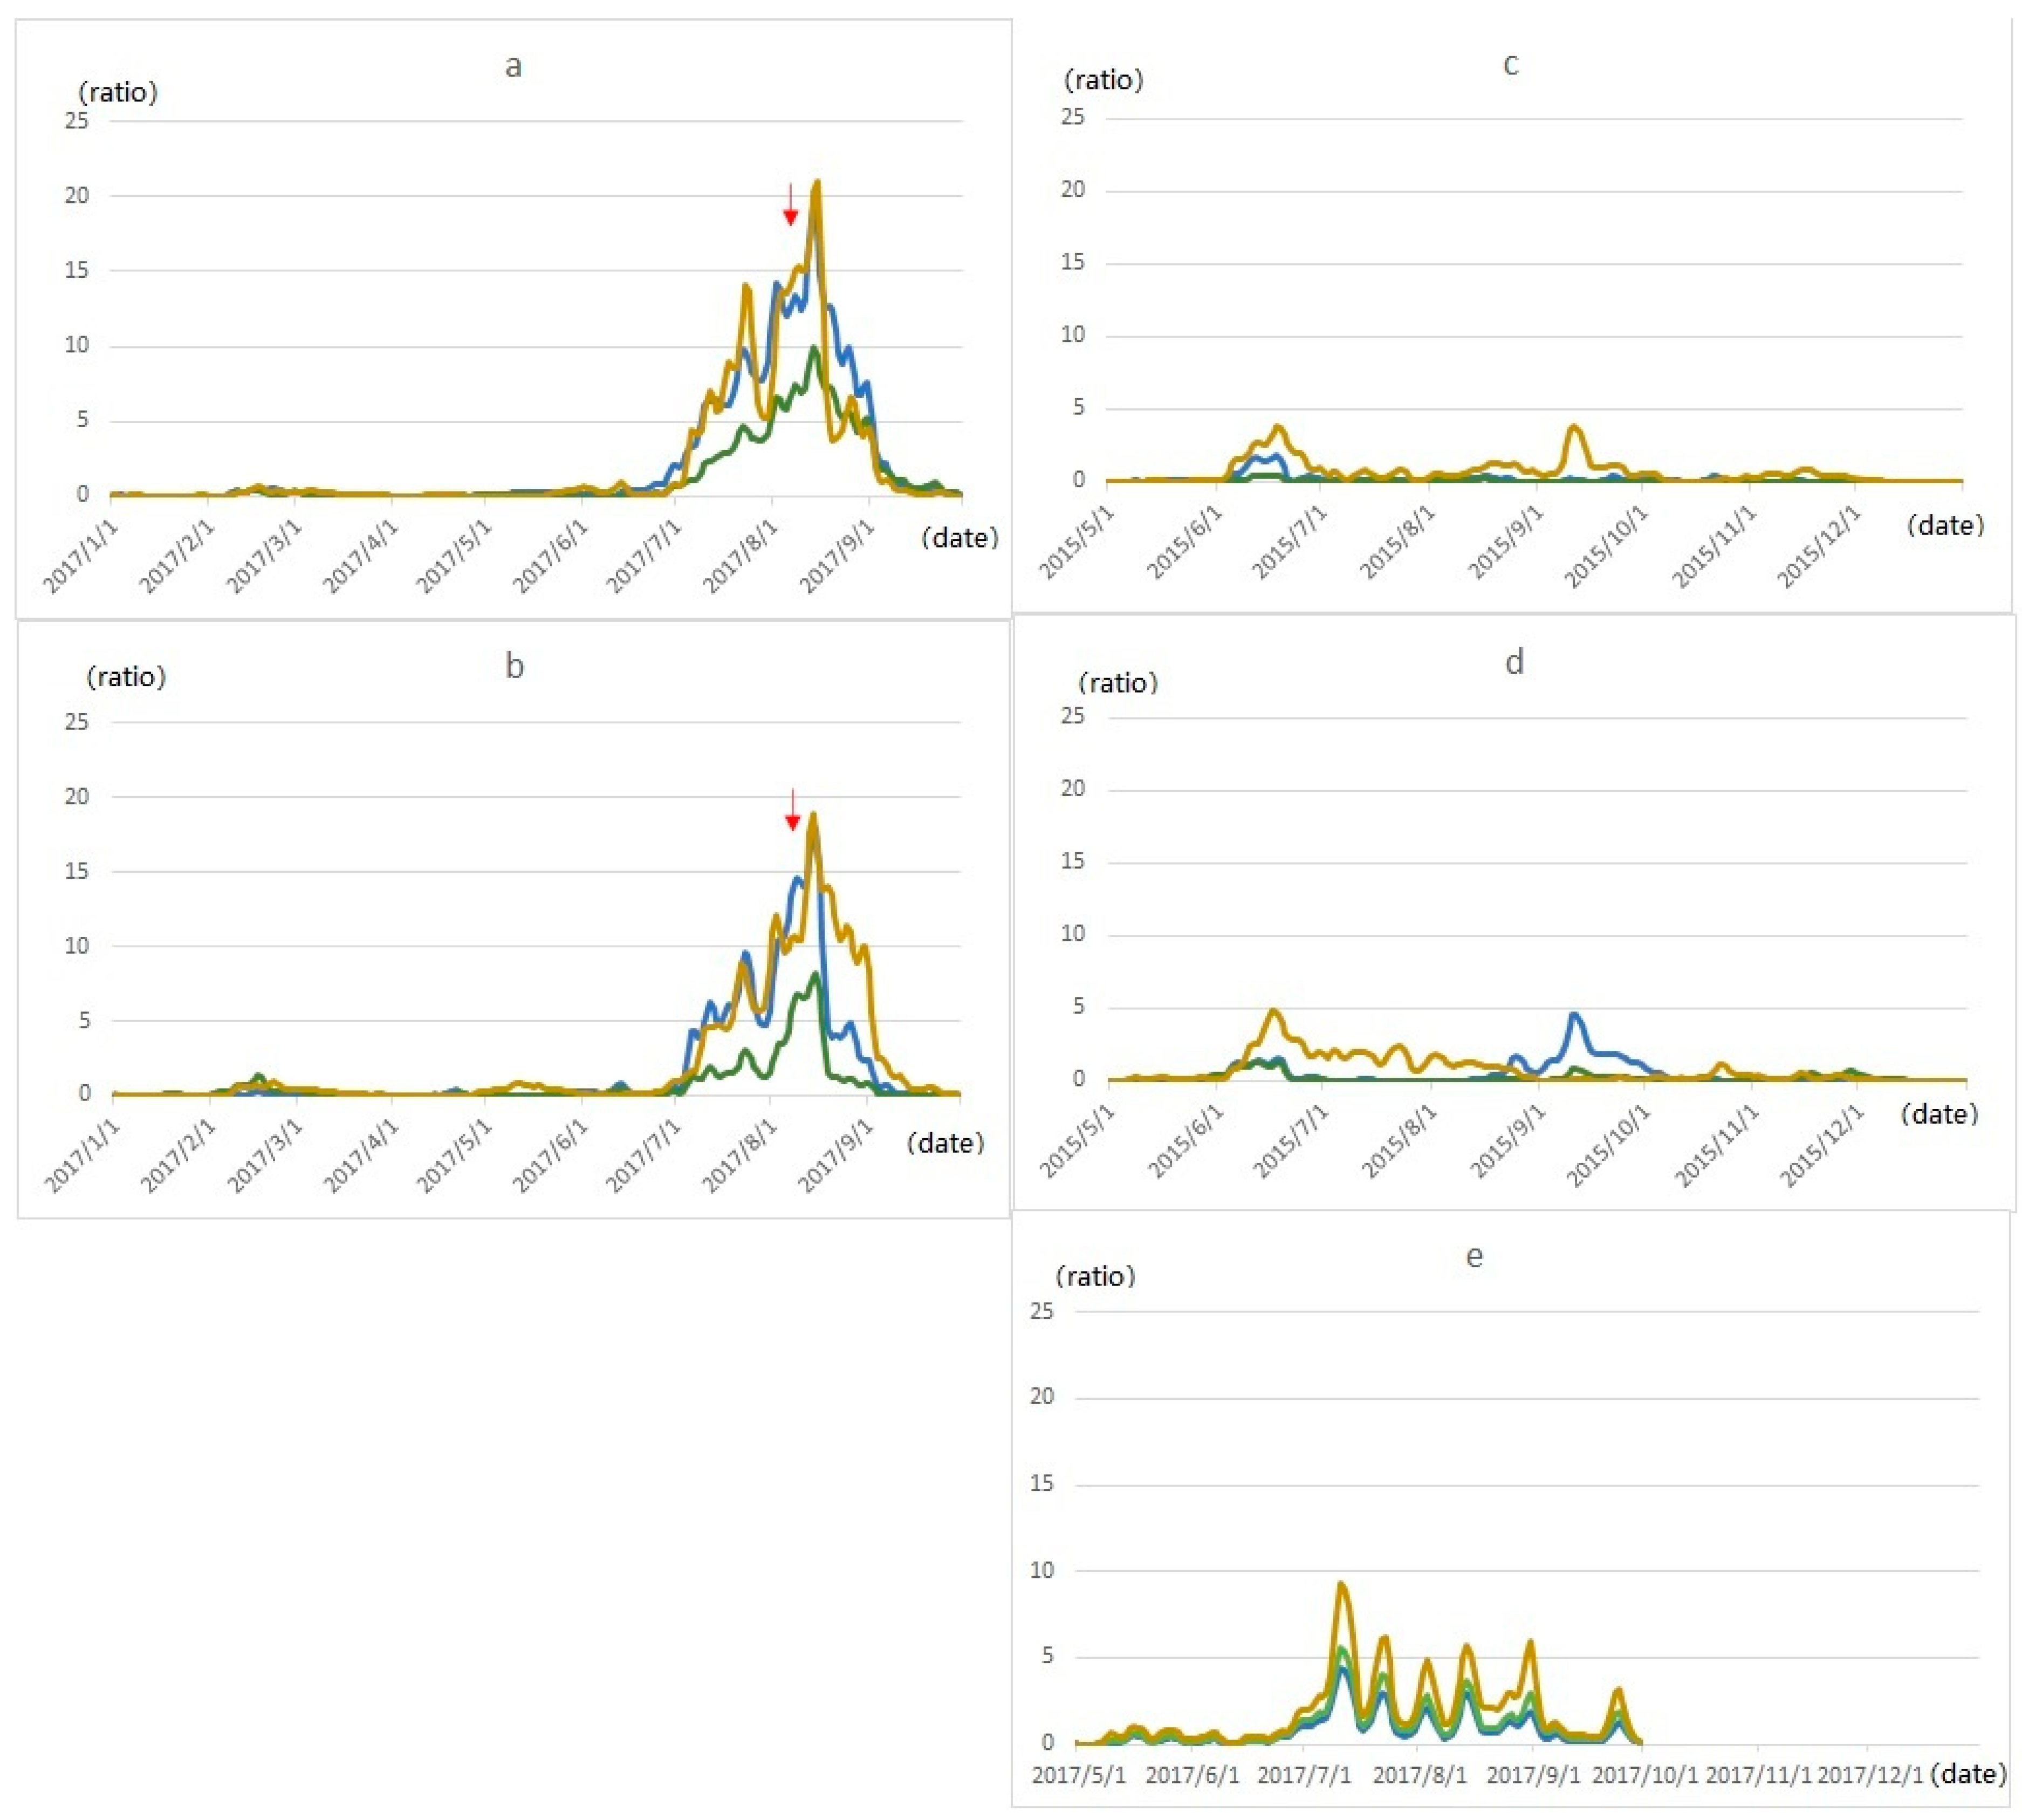
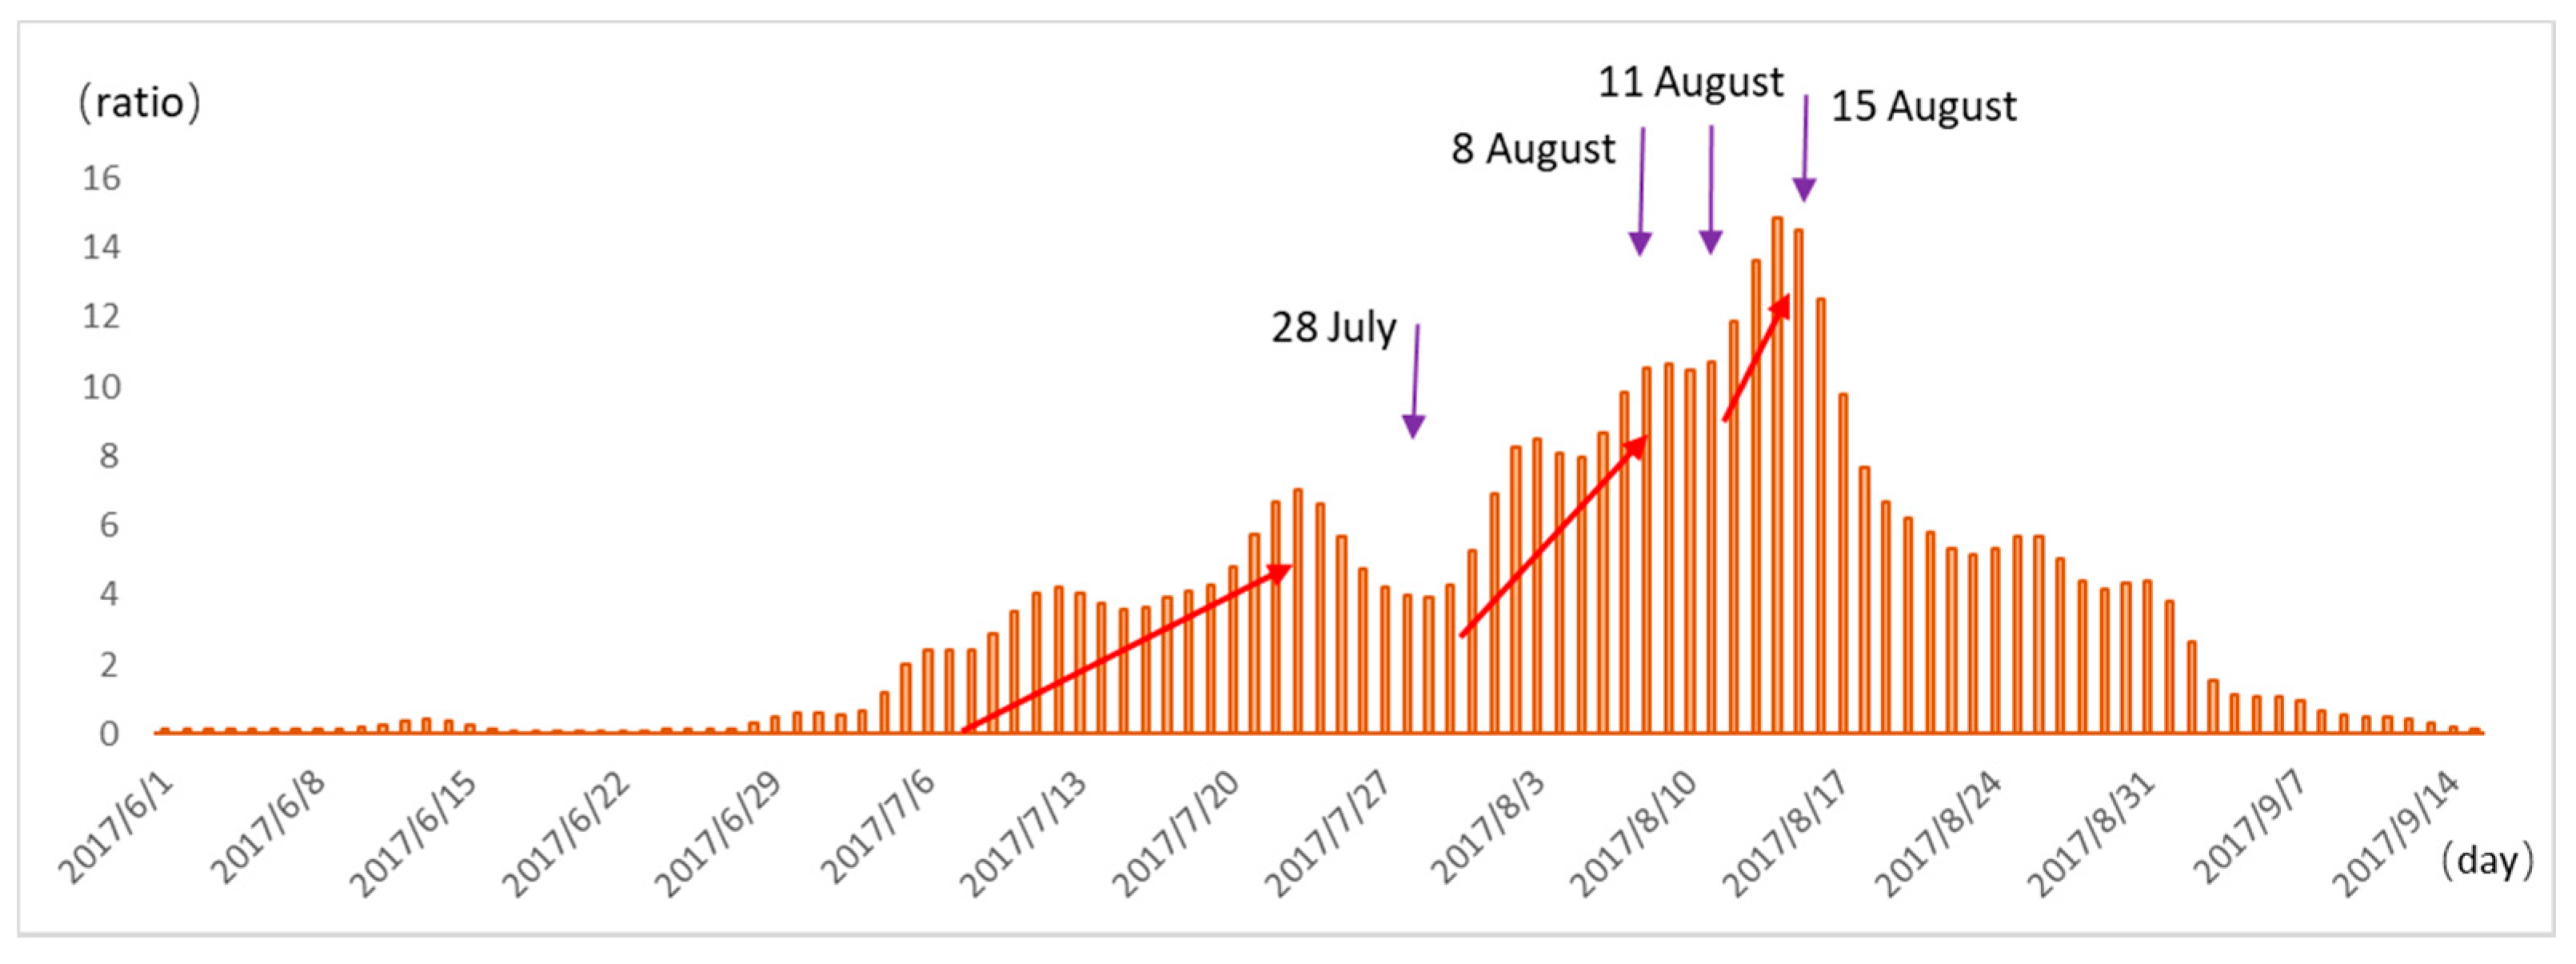
3.2. Time Series of Infrared Power Spectra Anomalies

Time series of full frequency power spectra for TBB, OLR, and MIB were extracted for the epicentral region (33°–33.5° N, 103.5°104° E) and two regions with elevated thermal infrared radiation (Figure 4): (1) the Yingxiu-Beichuan fault region (Region 1; 31°–31.5° N, 104°–104.5° E, ~220 km from the epicenter) and (2) the Huarong mountain fault region (Region 2; 29°–29.5° N, 105°–105.5° E, ~470 km from the epicenter).
During a period of low seismic activity (January 2014 to June 2017), the power spectra values of full frequency bands for TBB, OLR, and MIB were generally low (fluctuating below ~5; Figure 5). After July 2017, power spectra in the seventh frequency band of TBB, OLR, and MIB increased significantly in regions 1 and 2, with a maximum of more than 20 times the background level. In contrast, power spectra in other frequency bands showed no obvious changes related to the Jiuzhaigou M w 6.5 earthquake. In the epicentral region, no anomalous increases (nearly fluctuating below ~5) in the three infrared power spectra were observed in the seventh frequency band; because of a prominently high ratio before the earthquake, the seventh thermal infrared frequency band was the characteristic frequency band of the earthquake.

3.3. Comparison of Anomalous Infrared Power Spectra

We compared the power spectra of the seventh frequency bands of TBB, OLR, and MIB. Before and after the Jiuzhaigou M w 6.5 earthquake, which occurred on 8 August, anomaly variation trends and peaks in the power spectra of TBB and MIB overlapped significantly, while those in the OLR power spectra were lower. In regions 1 and 2 (i.e., the areas with the most intense anomalies), the highest values for all three power spectra appeared on 14 August, before quickly returning to normal (Figure 6a,b).
However, during the aseismic summer of 2015, regions 1 and 2 contained no anomalies (ratio fluctuating below ~5); similarly, the epicenter region contained no anomalous radiation related to seismicity during the summer of 2017. The change trends and values of the TBB and OLR power spectra overlapped significantly, while those of MIB differed (Figure 6c–e).
Our results show that the infrared radiation characteristics of an earthquake differ from those observed during aseismic periods and from those caused by other factors (e.g., high summertime solar radiation). While this phenomenon requires further analysis using data from additional earthquakes and aseismic periods, our results suggest that particular characteristics of thermal infrared radiation could be used to predict earthquake activity.

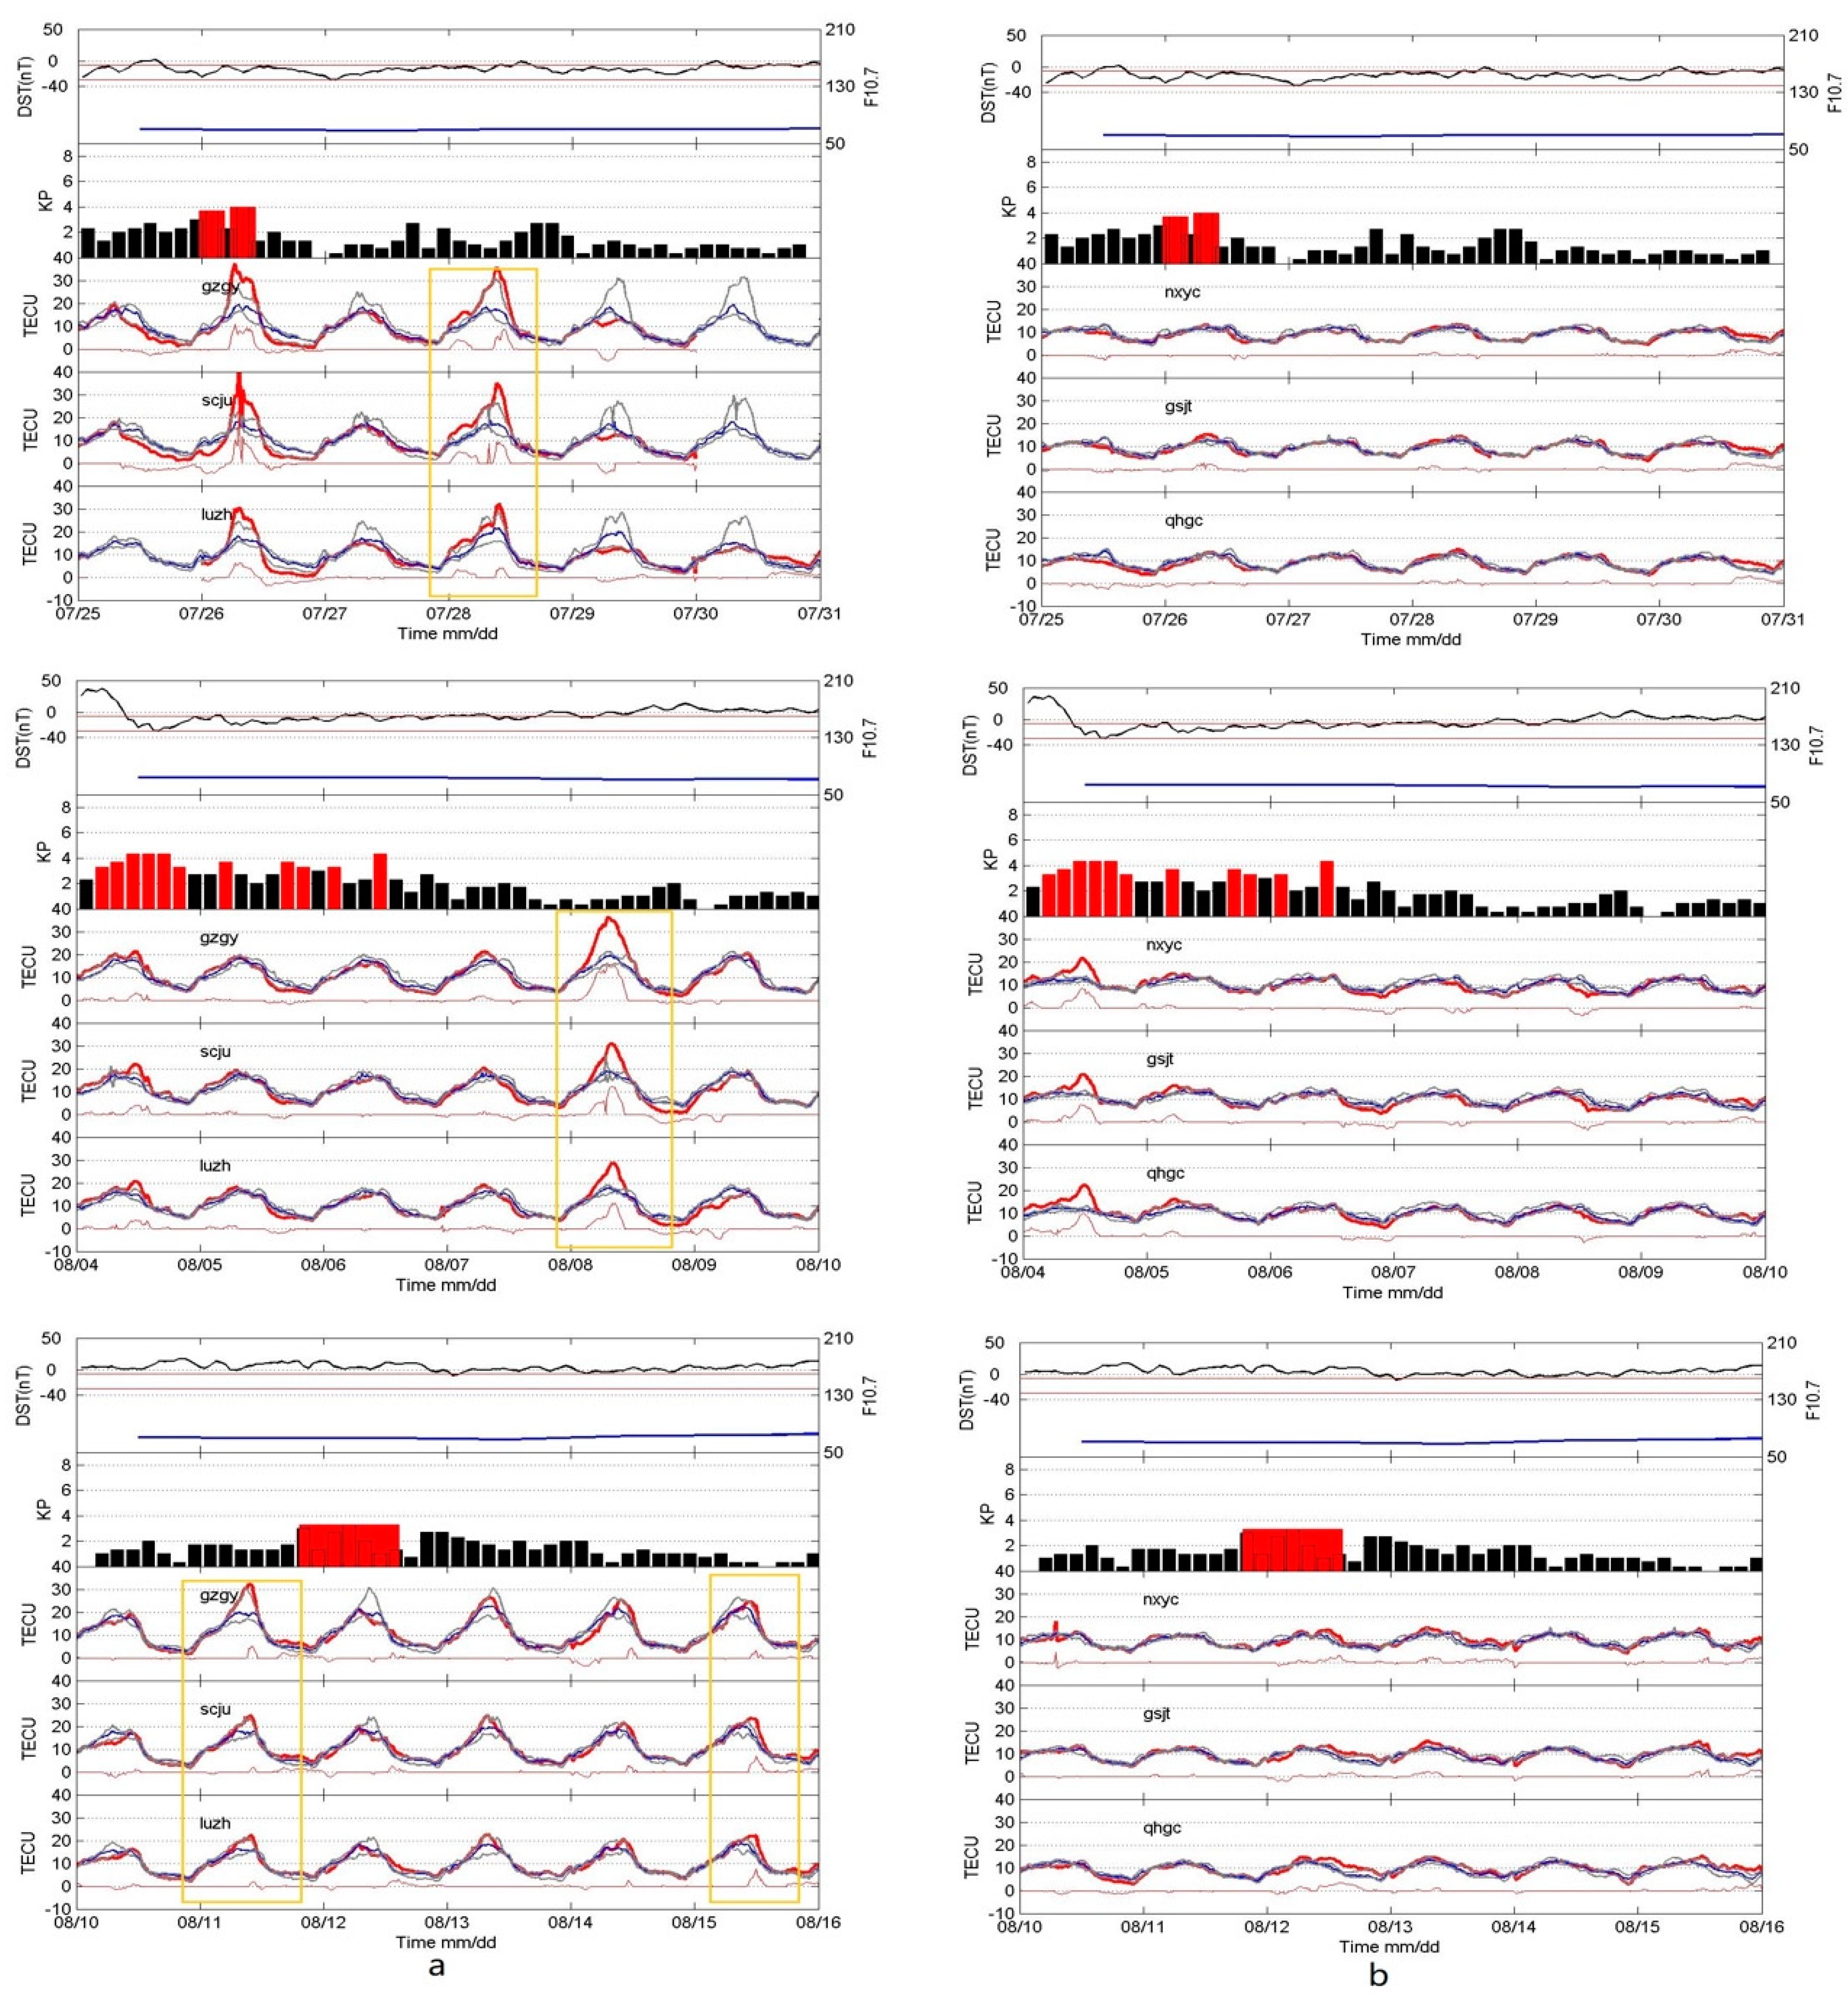
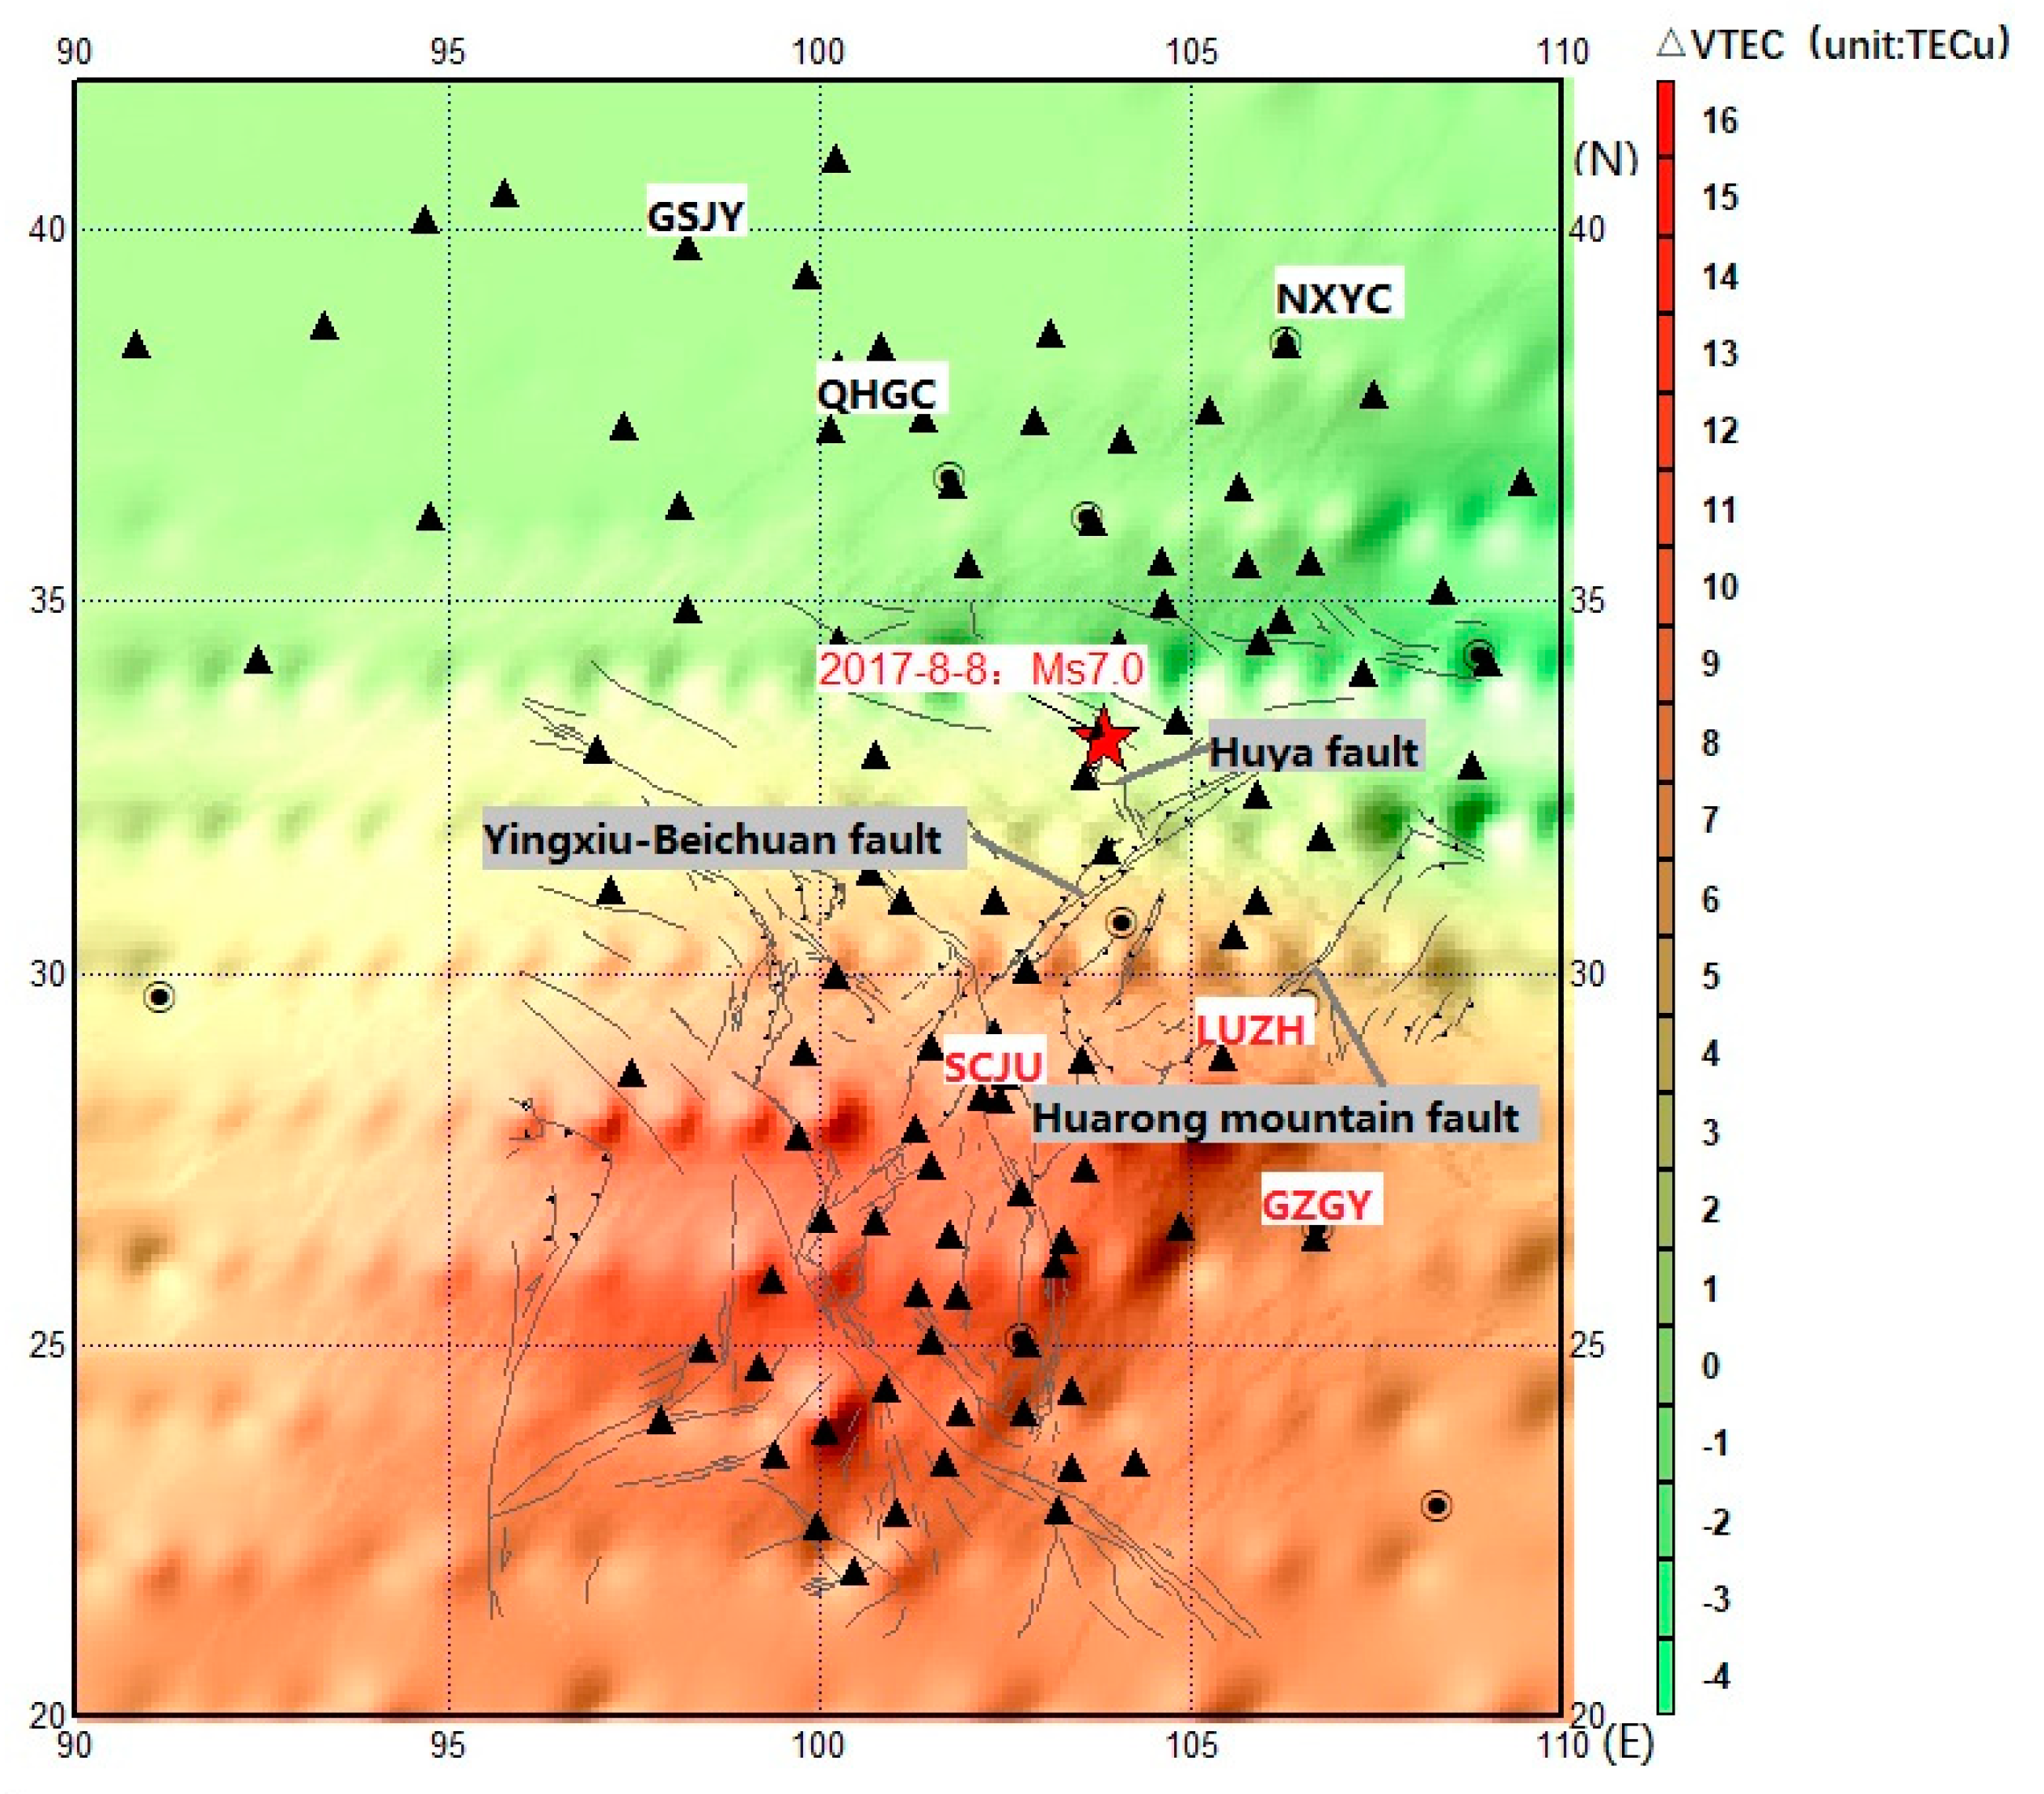
3.4. Extraction of Ionospheric TEC Anomalies

The TEC data of nearly 60 stations within the study area showed abnormal fluctuations before and after the Jiuzhaigou earthquake (Figure 7a). Values above the background level occurred on 28 July, 8 August, 11 August, and 15 August. Among them, on the morning of 28 July, the TEC increased at numerous stations, reaching up to 10 TEC. On the morning of 8 August, increased TEC continued for several hours, with a maximum of 15 TEC. The maximum value of the TEC anomaly on 11 August was 5 TEC and that on 15 August was 7 TEC. From the Kp index, DST index (Disturbance Storm Time Index), and F10.7, there was no interreference from electromagnetic activity during these four periods of increased ionospheric TEC. The Kp index exceeded 4 on 26 July and 4 August, the lowest Dst index also was closed to −30 nT (when −50 nT< Dst ≤ −30 nT, there is a small magnetic storm) (Figure 7b). Therefore, the TEC anomalies on 26 July and 4 August can be attributed to interference from electromagnetic activity.

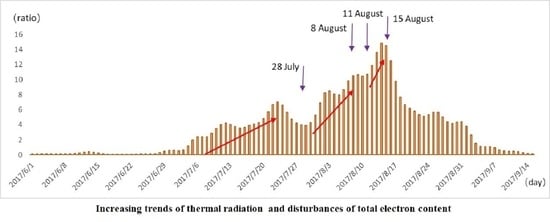
3.5. Comparative Analysis of Thermal Radiation and Ionospheric TEC Anomalies

The spatial distribution of GNSS TEC anomalies processed by interpolation (taking points according to orientation; Figure 8) shows that on the morning of the earthquake (8 August 2017), a large range of positive ionospheric TEC anomalies occurred in the southern epicentral area and on southern side of the Huarong mountain fault, with the latter exhibiting a larger amplitude anomaly. The infrared anomaly distribution was situated on the northern edge of this ionospheric TEC anomaly area. Region 2, which had a significant infrared anomaly, almost completely overlapped the largest TEC anomaly region (i.e., the LUZH, SCJU, and GZGY stations). The distributions of both anomaly types had good correspondence with the geological structure of the area, which could have been caused by the same tectonic activity.
For Region 2, the power spectra in the seventh frequency band of TBB, OLR, and MIB were averaged to represent the variation trend of infrared anomalies before and after the earthquake; this was then compared with the ionospheric disturbances. The increase in infrared radiation related to the Jiuzhaigou M w 6.5 earthquake can be divided into three phases (Figure 9): (1) 3–24 July (22 days), when thermal radiation gradually increased; (2) 30 July–9 August (10 days), when thermal radiation significantly increased; and (3) 11–14 August (5 days), when thermal radiation increased dramatically. Increasing infrared during at each stage was followed by increasing TEC (e.g., on 28 July, 8 August, 11 August, and 15 August); subsequently, infrared radiation decreased rapidly and there was no increase in TEC again. In summary, the ground thermal radiations and the subsequent ionospheric TEC anomalies had good correspondence.

4. Conclusions

In this study, we investigated thermal infrared (i.e., TBB, OLR, and MIB) and ionospheric TEC anomalies of the 2017 M w 6.5 Jiuzhaigou earthquake using data from the FY-2E and FY-2G satellites. Thermal infrared anomalies were identified using the power spectrum method, while ionospheric TEC anomalies were extracted using the IQR method. Our conclusions are as follows:
(1) Thermal infrared anomalies were observed for all data types (TBB, OLR, and MIB). Anomalies were mainly distributed in the fault region. The seventh frequency band was the characteristic frequency band for anomaly extraction. Among the types of infrared, TBB was best for identifying infrared anomalies. The anomaly trends and peak values of the TBB and MIB power spectra overlapped significantly during the period of seismic activity; in contrast, the TBB and OLR power spectra overlapped significantly for aseismic periods or regions with no anomalies. By analyzing three different types of infrared radiation, we conclude that the infrared radiation characteristics of an earthquake (TBB more overlaps MIB) differ from those during aseismic periods (TBB more overlaps OLR) or those caused by other factors (e.g., high solar radiation during the summer); as such, the joint analysis of TBB, OLR, and MIB data is necessary for more accurate prediction of earthquake activity.
(2) We found that ionospheric TEC increased four times in total before and after the earthquake. The area with the largest TEC anomaly amplitude overlapped significantly with one of the infrared anomaly regions (Region 2). After improved selection of data, we can observe obvious three stages of increasing TIR radiation. In regions with significant infrared anomalies, increasing infrared radiation was followed by increasing TEC, and increasing TEC stopped when infrared radiation decreased.
(3) In addition to temporal correlations, we found that thermal radiation and TEC anomalies both had high spatial correspondence with the same geological structures. These observations suggest that ground thermal radiation related to earthquakes might have some physical relationship with subsequent increases in ionosphere TEC.
Here, two faults (Yingxiu-Beichuan fault and Huarong mountain fault) with significant thermal infrared anomalies are located at the edge of basin area (Sichuan Basin, China). According to previous studies [40,43,44,45], basins are often rich in geothermal resources; they are more sensitive to the change of stress before the earthquakes, i.e., when the stress accumulates to a certain degree, peripheral active tectonic zone and microcracks of basins can become gas upwelling channels, as a result, the radiation warming effect is obvious owing to methane, carbon dioxide, and other greenhouse gases spilled from the surface. So, the ability, here, to extract relatively obvious thermal infrared anomalies might also be attributed by this basin effect.
In LAIC mode, electromagnetic radiations concentratively produced by the deep-seated source spread upward in short phase before earthquake. They are thought to spread from the lithosphere to the atmosphere and the ionosphere by the electromagnetic approach (the response to electromagnetic field change and vertical current increasement between the ground and ionosphere), causing the ionospheric disturbance observed by satellite [1,46]. Our finding of the 2017 M w 6.5 Jiuzhaigou earthquake may be another good evidence for these theories.
Past studies have often identified TIR anomalies, but it is difficult to predict whether they will precede an earthquake. However, the temporal and spatial correspondence of TIR and TEC anomalies observed in this study suggest that TIR and TEC can be combined for earthquake warning, and we will investigate more earthquakes to find this kind of phenomenon. Specifically, increasing TBB that is highly consistent with MIB could be an earthquake precursor. In future work, we will consider the relationships among TBB, MIB, and OLR under different conditions (e.g., solar storms, quiet periods, etc.) and also study the temporal evolution of TIR anomalies for several hours before sun rises and not only at 5 o’clock.

Author Contributions

Software, X.Z. and X.G.; formal analysis, M.Z.; data curation, M.Z.; writing—original draft preparation, M.Z.; writing—review and editing, Z.J. and M.Z.; supervision, X.S., X.Z. and C.Q.; funding acquisition, C.Q., X.S., X.Z. and M.Z.; All authors have read and agreed to the published version of the manuscript.

Funding

This research was funded by the National Key Technologies R&D Program of China (Grant No. 2018YFC1503602, 2019YFC1509200 and 2018YFC1503506) and the Earthquake Science and Technology Development Fund of the Gansu Earthquake Agency (Grant No. 2014M02)

Acknowledgments

We would like to thank the Crustal Movement Monitoring Engineering Research Center and Institute of Earthquake Forecasting of the China Earthquake Administration (CEA) for providing GNSS TEC data and for technical support, and the National Satellite Meteorological Center of China Meteorological Administration for providing infrared satellite data. We also thank the seismological infrared research team led by Yuan-sheng Zhang of the Lanzhou Geophysics National Observatory and Research Station for technical support, and Jian-hui He from the Institute of Geology and Geophysics of Chinese Academy of Sciences for his valuable advice.

Conflicts of Interest

The authors declare no conflict of interest.

References

  1. Pulinets, S.A.; Boyarchuk, K.A. Ionospheric Precursors of Earthquakes; Springer: Berlin/Heidelberg, Germany, 2004; pp. 1–289. [Google Scholar]
  2. Hayakawa, M.; Molchanov, O.A. Seismo-Electromagnetics: Lithosphere-Atmosphere-Ionosphere Coupling; Terra Scientific Publishing Co.: Tokyo, Japan, 2002; p. 477. [Google Scholar]
  3. Kuo, C.L.; Lee, L.C.; Huba, J.D. An improved coupling model for the lithosphere-atmosphere-ionosphere system. J. Geophys. Res. Space Phys. 2014, 119, 3189–3205. [Google Scholar] [CrossRef]
  4. Pulinets, S.; Ouzounov, D. Lithosphere–Atmosphere–Ionosphere Coupling (LAIC) model–An unified concept for earthquake precursors validation. J. Asian Earth Sci. 2011, 41, 371–382. [Google Scholar] [CrossRef]
  5. Gorny, V.I.; Salman, A.G.; Tronin, A.A.; Shilin, B.B. Terrestrial outgoing infrared radiation as an indicator of seismic activity. Proc. Acad. Sci. USSR 1988, 30, 67–69. [Google Scholar]
  6. Ouzounov, D.; Freund, F. Mid-infrared emission prior to strong earthquakes analyzed by remote sensing data. Adv. Space Res. 2004, 33, 268–273. [Google Scholar] [CrossRef]
  7. Ouzounov, D.; Bryant, N.; Logan, T.; Pulinets, S.; Taylor, P. Satellite thermal IR phenomena associated with some of the major earthquakes in 1999–2003. Phys. Chem. Earth 2006, 31, 154–163. [Google Scholar] [CrossRef]
  8. Yang, G.; Mi, Y.Q. Thermal anomalies and earthquakes: Evidence from Wenchuan, China. Earthq. Res. China 2009, 23, 48–55. [Google Scholar]
  9. Zhang, Y.; Kang, C.L.; Ma, W.Y.; Yao, Q. The change in outgoing longwave radiation before the Ludian Ms6. 5 earthquake based on tidal force niche cycles. Earthq. Res. China 2017, 31, 422–430. [Google Scholar]
  10. Qin, K.; Wu, L.; Zheng, S.; Ma, W. Discriminating satellite IR anomalies associated with the Ms 7.1 Yushu earthquake in China. Adv. Space Res. 2018, 61, 1324–1331. [Google Scholar] [CrossRef]
  11. Liu, F.; Xin, H.; Zhang, T.B.; Lu, Q.; Ren, Y. Time series analysis on the ratio for pixels with abnormal brightness temperature increase and its variation before some earthquakes with Ms ≥ 5·0 in the Taiwan area. Earthq. Res. China 2007, 21, 437–444. [Google Scholar]
  12. Tronin, A.; Hayakawa, M.; Molchanov, O.A. Thermal IR satellite data application for earthquake research in Japan and China. J. Geodyn. 2002, 33, 519–534. [Google Scholar] [CrossRef]
  13. Xu, X.D.; Xu, X.M.; Wang, Y. Satellite infrared anomaly before Nantou Ms=7.6 earthquake in Taiwan, China. Acta Seismol. Sin. 2000, 22, 666–669. [Google Scholar]
  14. Zhang, Y.S.; Guo, X.; Zhong, M.J.; Shen, W.R.; Li, W.; He, B. Wenchuan earthquake: Brightness temperature changes from satellite infrared information. Chin. Sci. Bull. 2010, 55, 1917–1924. [Google Scholar] [CrossRef]
  15. Kuo, C.L.; Huba, J.D.; Joyce, G.; Lee, L.C. Ionosphere plasma bubbles and density variations induced by pre-earthquake rock currents and associated surface charges. J. Geophys. Res. 2011, 116, A10317. [Google Scholar] [CrossRef] [Green Version]
  16. Sorokin, V.M.; Chmyrev, V.M.; Yaschenko, A.K. Theoretical model of DC electric field formation in the ionosphere stimulated by seismic activity. J. Atmos. Sol. Terr. Phys. 2005, 67, 1259–1268. [Google Scholar] [CrossRef]
  17. Chakraborty, S.; Sasmal, S.; Basak, T.; Ghosh, S.; Palit, S.; Chakrabarti, S.K.; Ray, S. Numerical modeling of possible lower ionospheric anomalies associated with Nepal earthquake in May, 2015. Adv. Space Res. 2017, 60, 1787–1796. [Google Scholar] [CrossRef]
  18. Chum, J.; Liu, J.Y.; Podolská, K. Infrasound in the ionosphere from earthquakes and typhoons. J. Atmos. Sol. Terr. Phys. 2017, 171, 72–82. [Google Scholar] [CrossRef] [Green Version]
  19. Freund, F. Pre-earthquake signals: Underlying physical processes. J. Asian Earth Sci. 2011, 41, 383–400. [Google Scholar] [CrossRef]
  20. Molchanov, O.A.; Hayakawa, M. Seismo Electromagnetics and Related Phenomena: History and Latest Results; TERRAPUB: Tokyo, Japan, 2008; p. 189. [Google Scholar]
  21. Pulinets, S.A. Physical mechanism of the vertical electric field generation over active tectonic faults. Adv. Space Res. 2009, 44, 767–773. [Google Scholar] [CrossRef]
  22. Hegai, V.V.; Kim, V.P.; Liu, J.Y. The ionospheric effect of atmospheric gravity waves excited prior to strong earthquake. Adv. Space Res. 2006, 37, 653–659. [Google Scholar] [CrossRef]
  23. Li, W.; Guo, J.Y.; Yu, X.M.; Yu, H.J. Analysis of ionospheric anomaly preceding the Mw7. 3 Yutian earthquake. Geod. Geodyn. 2014, 5, 54–60. [Google Scholar] [CrossRef] [Green Version]
  24. Zhu, F.Y.; Wu, Y. Anomalous variations in ionospheric TEC prior to the 2011 Japan Ms9.0 earthquake. Geod. Geodyn. 2011, 2, 8–11. [Google Scholar] [CrossRef] [Green Version]
  25. Zahra, S.; Masoud, M.H. Application of the T2-Hotelling test for investigating ionospheric anomalies before large earthquakes. J. Atmos. Sol. Terr. Phys. 2019. [Google Scholar] [CrossRef]
  26. Li, J.Y.; Meng, G.J.; Wang, M.; Liao, H.; Shen, X.H. Investigation of ionospheric TEC changes related to the 2008 Wenchuan earthquake based on statistic analysis and signal detection. Earthq. Sci. 2009, 22, 545–553. [Google Scholar] [CrossRef] [Green Version]
  27. Shalimova, S.L.; Nesterovc, I.A.; Vorontsovc, A.M. On the GPS-based ionospheric perturbation after the Tohoku earthquake of March 11, 2011. Phys. Solid Earth 2017, 53, 262–273. [Google Scholar] [CrossRef]
  28. Akhoondzadeh, M.; Santis, A.D.; Marchetti, D.; Piscini, A.; Cianchini, G. Multi precursors analysis associated with the powerful ecuador (MW = 7.8) earthquake of 16 April 2016 using Swarm satellites data in conjunction with other multi-platform satellite and ground data. Adv. Space Res. 2018, 61, 248–263. [Google Scholar] [CrossRef] [Green Version]
  29. Santis, A.D.; Balasis, G.; Pavon-Carrasco, F.J.; Cianchini, G.; Mandea, M. Potential earthquake precursory pattern from space: The 2015 Nepal event as seen by magnetic Swarm satellites. Earth Planet. Sci. Lett. 2017, 461, 119–126. [Google Scholar] [CrossRef] [Green Version]
  30. Parrot, M. Use of satellites to detect seismo-electromagnetic effects, main phenomenological features of ionospheric precursors of strong earthquakes. Adv. Space Res. 1995, 15, 1337–1347. [Google Scholar] [CrossRef]
  31. Yuan, Y.B.; Li, Z.S.; Wang, N.B.; Zhang, B.C.; Li, H.; Li, M.N.; Huo, X.L.; Ou, J.K. Monitoring the ionosphere based on the crustal movement observation network of china. Geod. Geodyn. 2015, 6. [Google Scholar] [CrossRef] [Green Version]
  32. Le, H.J.; Liu, J.Y.; Liu, L. A statistical analysis of ionospheric anomalies before 736 M6.0+ earthquakes during 2002–2010. J. Geophys. Res. 2011, 116, A02303. [Google Scholar] [CrossRef]
  33. Liu, J.; Wan, W.X. Spatial-temporal distribution of the ionospheric perturbations prior to Ms≥6.0 earthquakes in China mainland. Chin. J. Geophys. 2014, 57, 2181–2189. [Google Scholar]
  34. He, Y.; Yang, D.; Qian, J.; Parrot, M. Response of the ionospheric electron density to different types of seismic events. Nat. Hazard Earth Syst. Sci. 2011, 11, 2173–2180. [Google Scholar] [CrossRef] [Green Version]
  35. Li, M.; Parrot, M. Statistical analysis of an ionospheric parameter as a base for earthquake prediction. J. Geophys. Res. 2013, 118, 3731–3739. [Google Scholar] [CrossRef] [Green Version]
  36. Wu, L.X.; Qin, K.; Liu, S.J. GEOSS-Based Thermal Parameters Analysis for Earthquake Anomaly Recognition. Proc. IEEE 2012, 100, 2891–2907. [Google Scholar] [CrossRef]
  37. Lu, X.; Meng, Q.Y.; Gu, X.F.; Zhang, X.D.; Xiong, P.; Ma, W.Y.; Xie, T. Multi-parameters of thermal infrared remote sensing anomalies of the earthquake. Earthq. Res. China 2016, 30, 500–512. [Google Scholar] [CrossRef] [Green Version]
  38. Piscini, A.; De Santis, A.; Marchetti, D.; Cianchini, G. A multiparametric climatological approach to study the 2016 Amatrice-Norcia (Central Italy) earthquake preparatory phase. Pure Appl. Geophys. 2017, 174, 3673–3688. [Google Scholar] [CrossRef]
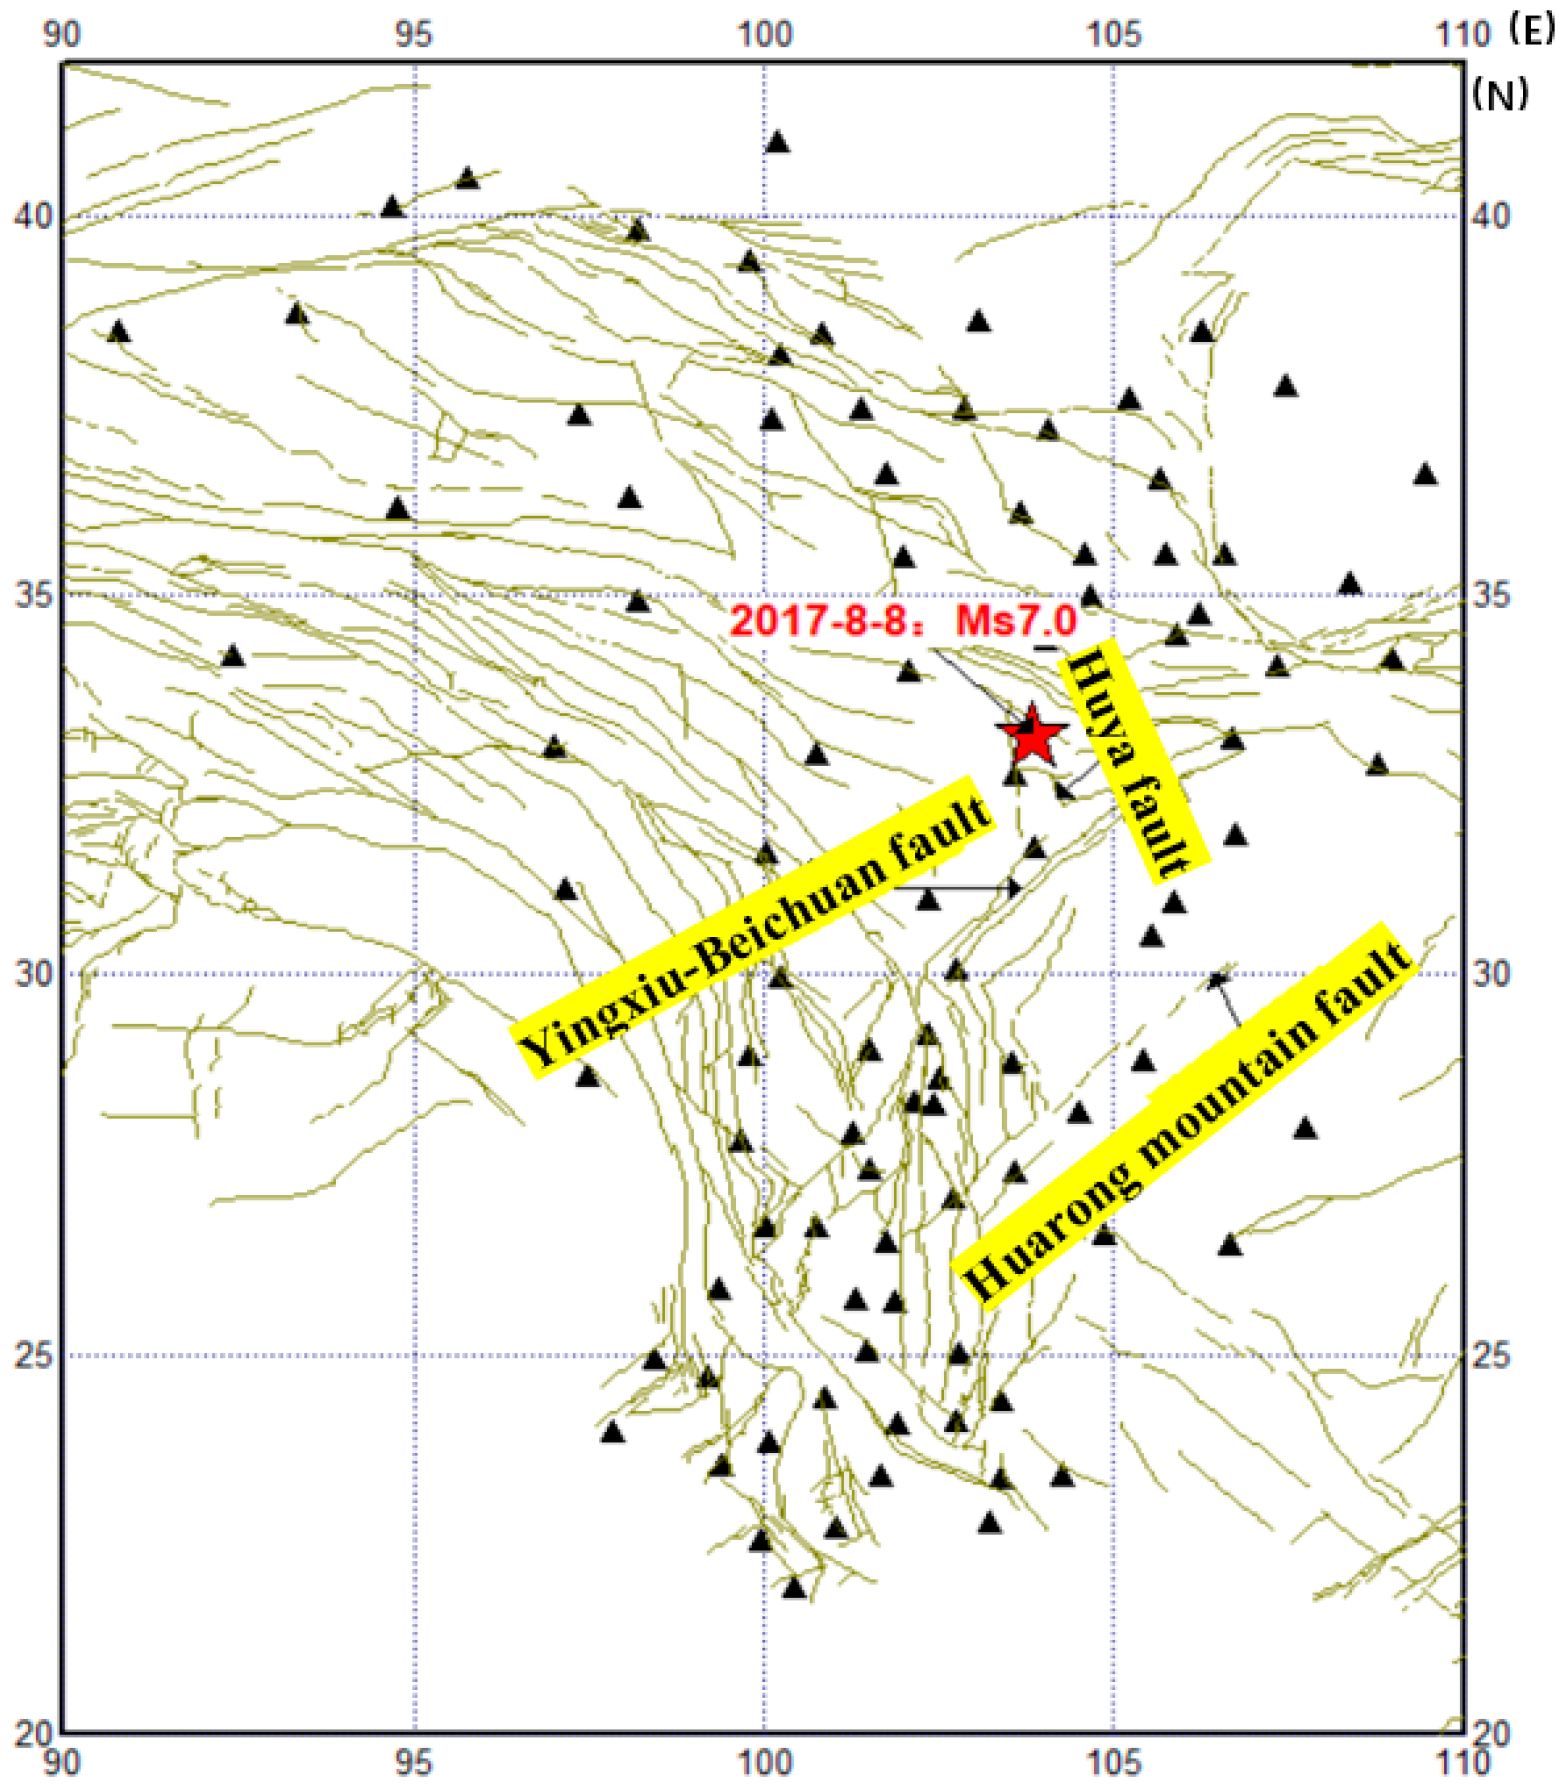
  39. Xu, X.W.; Chen, G.H.; Wang, Q.X.; Chen, J.C.; Ren, Z.K.; Xu, C.; Wei, Z.Y.; Lu, R.Q.; Tan, X.B.; Dong, S.P.; et al. Discussion on seismogenic structure of Jiuzhaigou earthquake and its implication for current strain state in the southeastern Qinghai-Tibet Plateau. Chin. J. Geophys. 2017, 60, 4018–4026. (In Chinese) [Google Scholar] [CrossRef]
  40. Zhang, L.F.; Guo, X.; Zhang, X.; Tu, H.W. Anomaly of thermal infrared brightness temperature and basin effect before Jiuzhaigou MS7.0 earthquake in 2017. Acta Seismol. Sin. 2018, 40, 797–808. [Google Scholar] [CrossRef]
  41. Zhang, M.M.; Liu, Z.M.; Liu, P.; Chong, J.F. Analysis of ionospheric TEC anomalies before the Jiuzhaigou Ms7.0 earthquake. Eng. Survey Map. 2018, 27, 24–30. [Google Scholar] [CrossRef]
  42. Zhai, D.L.; Zhang, X.M.; Xiong, P.; Song, R. Detection of ionospheric TEC anomalies based on Prophet Time-series Forecasting Model. Earthquake 2019, 39, 46–62. [Google Scholar]
  43. Qiang, Z.J.; Dian, C.G.; Huang, F.L.; Zhao, Y. New remote sensing method of prospecting for petroleum zone of enrichment: Exploration-serving technique of satellite thermal infrared band. Chin. Sci. Bull. 1994, 39, 1822–1823. [Google Scholar]
  44. Huang, F.L.; Zhang, X.H.; Xia, X.H.; Qiang, Z.J.; Dian, C.G.; Zhang, Y.K. Distribution of methane and its homologues in lowlayer atmosphere over eastern China and seas. Chin. Sci. Bull. 1998, 43, 1902–1908. [Google Scholar] [CrossRef]
  45. Guo, W.Y.; Shan, X.J.; Qu, C.Y. Correlation between infrared anomalous and earthquakes in Tarim basin. Arid Land Geogr. 2006, 29, 736–741. (In Chinese) [Google Scholar]
  46. He, M.; Wu, L.X.; Cui, J.; Wang, W.; Qi, Y.; Mao, W.F.; Miao, Z.L.; Chen, B.Y.; Shen, X.H. Remote sensing anomalies of multiple geospheres before the Wenchuan earthquake and its spatiotemporal correlations. J. Remote Sens. 2020, 24, 681–700. [Google Scholar] [CrossRef]
Figure 1. Results of wavelet transformation of the temperature of brightness blackbody (TBB). (a) Original record of brightness temperature; (b) result with second-order scale analysis; (c) details of the second-order wavelet; (d) results with seventh-order scale analysis; and (e) difference between second-order scale analysis and seventh-order scale analysis.
Remotesensing 12 02843 g001
Figure 2. Distribution of Global Navigation Satellite System (GNSS) base stations in the eight provinces around the 2017 M w 6.5 Jiuzhaigou earthquake. Black triangles show the locations of GNSS base stations, and the red star shows the epicenter location.
Remotesensing 12 02843 g002
Figure 3. Evolution of (a) medium-wave infrared brightness (MIB), (b) temperature of brightness blackbody (TBB), and (c) outgoing longwave radiation (OLR) anomalies from 8 July to 6 September 2017. The black star shows the epicenter location.
Remotesensing 12 02843 g003aRemotesensing 12 02843 g003b
Figure 4. Temperature of brightness blackbody (TBB) anomaly on 7 August 2017 (Region 1: Yingxiu-Beichuan fault and Region 2: Huarong mountain fault).
Remotesensing 12 02843 g004
Figure 5. Power spectra time series for full frequency bands in the study region from 1 January 2014 to 30 September 2017. Power spectra of (a) temperature of brightness blackbody (TBB), (b) outgoing longwave radiation (OLR), and (c) medium-wave infrared brightness (MIB) in Region 1; power spectra of (d) TBB, (e) OLR, and (f) MIB in Region 2; power spectra of (g) TBB, (h) OLR, and (i) MIB in the epicentral region.
Remotesensing 12 02843 g005aRemotesensing 12 02843 g005b
Figure 6. Power spectra time series of temperature of brightness blackbody (TBB; blue lines), outgoing longwave radiation (OLR; green lines), and medium-wave infrared brightness (MIB; orange lines) showing thermal radiation anomalies in (a) Region 1 and (b) Region 2 and showing periods with no thermal radiation anomalies in (c) Region 1, (d) Region 2, and (e) the epicenter region. Red arrows denote the day of the 2017 M w 6.5 Jiuzhaigou earthquake.
Remotesensing 12 02843 g006
Figure 7. Total electron content (TEC) anomalies through sliding quarterback standard deviation of (a) seismic anomalies at the GZGY, SCJU, and LUZH stations and (b) aseismic anomalies at the NXYC, GSJY, and QHGC stations. Red thick lines denote observation data, blue lines show the mean curve, purple lines denote the threshold range of 2σ, and red fine lines denote TEC anomalies.
Remotesensing 12 02843 g007
Figure 8. Spatial distribution of total electron content (TEC) anomalies on 8 August 2017. Black triangles show the locations of Global Navigation Satellite System (GNSS) base stations, and the red five-pointed star shows the epicenter location of the 2017 M w 6.5 Jiuzhaigou earthquake.
Remotesensing 12 02843 g008
Figure 9. Increasing trends of thermal radiation (mean power spectrum of temperature of brightness blackbody (TBB), outgoing longwave radiation (OLR), and medium-wave infrared brightness (MIB)) and total electron content (TEC). Red arrows denote phases of increasing thermal radiation; purple arrows denote TEC disturbances.
Remotesensing 12 02843 g009
Table 1. Satellite radiometer parameters.
ChannelBand (μm)Pixel Ground Resolution (KM)Usage
Infrared 110.3–11.35Day and night clouds, temperature of underlying surface, distinguishing cloud and snow
Infrared 211.5–12.55Day and night clouds
Infrared 36.3–7.65Top temperature of translucent cirrus clouds, middle and upper level water vapor
Infrared 43.5–4.05Day and night clouds, high temperature targets

