The Special Issue comprises 19 research papers, namely 17 articles, 1 technical note, and 1 letter.
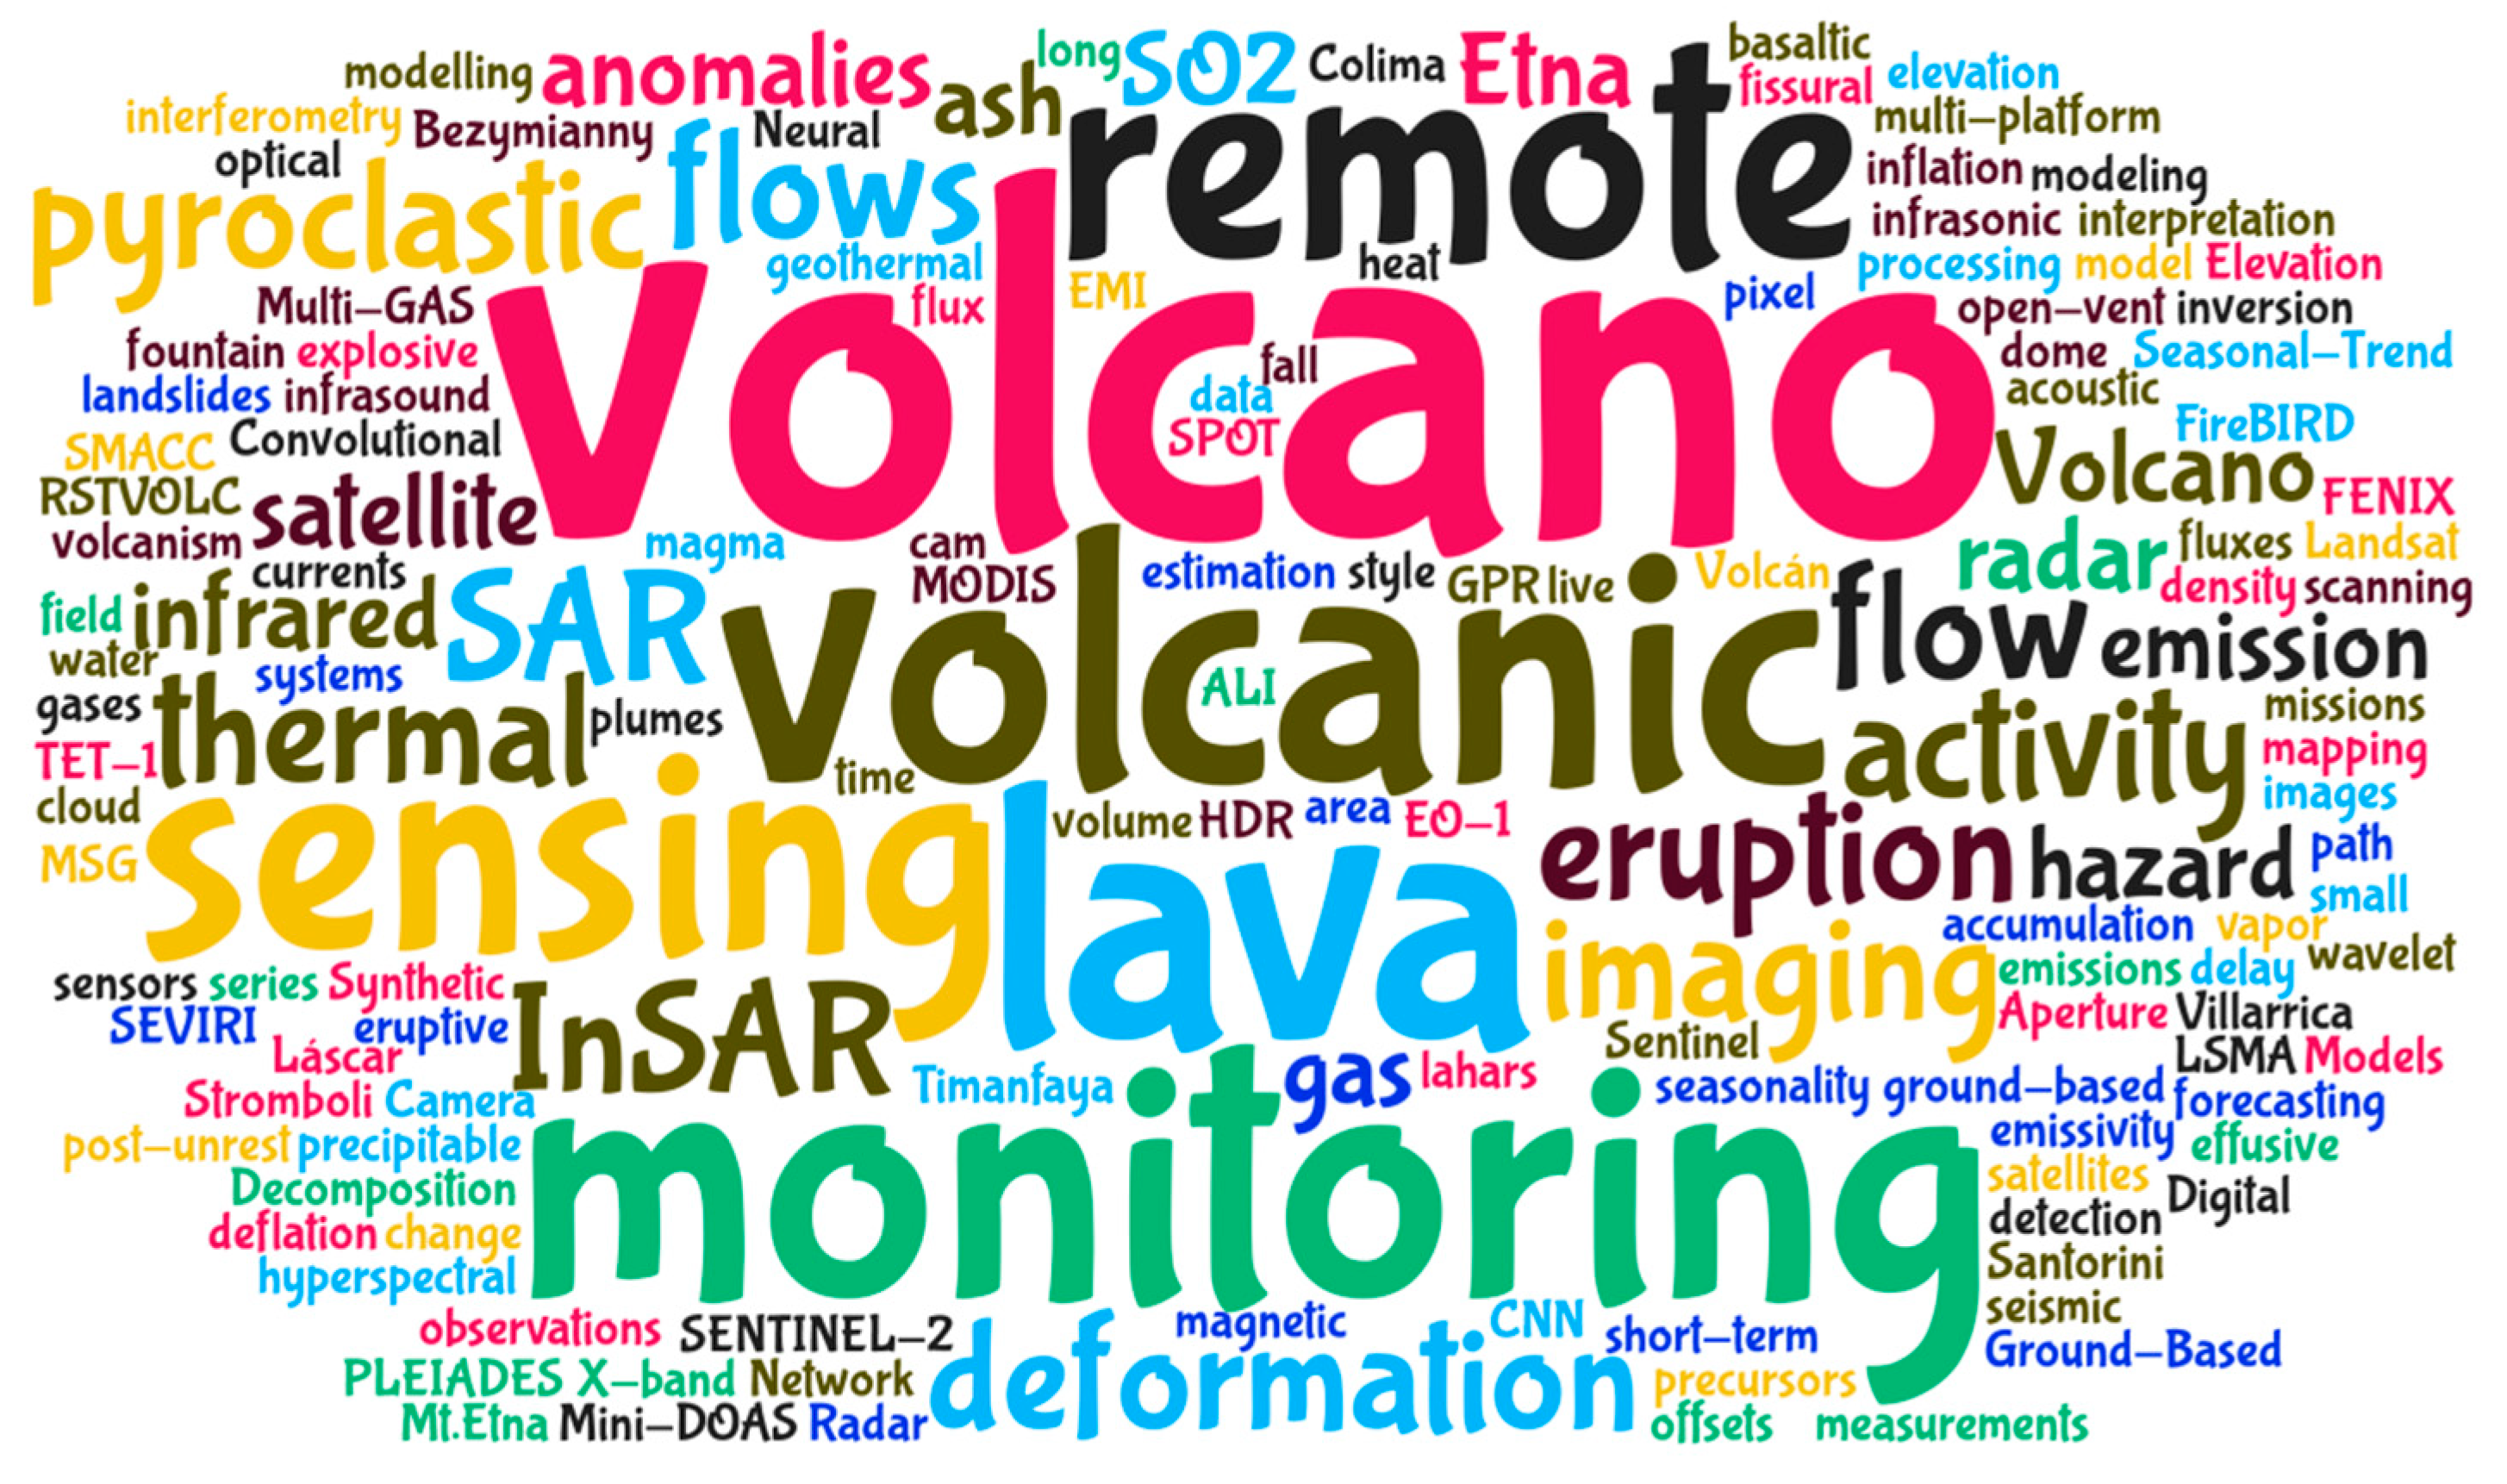
Figure 1 shows a pictorial word cloud of the thematic keywords used by the 19 papers, where the strong multi-disciplinary character of the approaches employed for volcano monitoring, and the combination of a variety of sensor types and platforms are apparent. A summary of the remote sensing data and methods used, and the areas of interest investigated, is provided in
Table 1.
Short accounts for each paper are also provided in the next sections, according to the following subdivision:
This subdivision is an attempt to organize the papers by the dominant scope, main character of the research, and/or peculiar type of remote sensing approach exploited. Therefore, such subdivision may appear a simplification for those papers encompassing more than one volcanological aspect or focusing on more than one volcanic parameter or observable. Consequently, the last group collects those papers that encompass multi-disciplinary approaches and encourage the integration of multi-sensor data.
It is worth noting that a common ground across the papers is the promotion of novel, integrated, or improved monitoring solutions to increase the existing observation capabilities based on either satellite, aerial, or terrestrial devices. Remote sensing, in this regard, represents an opportunity, in the context that less than 10% of the approximately 1500 active subaerial volcanoes around the world are monitored regularly on the ground, as recalled in [
14].
2.1. Remote Sensing of Thermal Features and Anomalies
Satellite sensors such as MODerate resolution Imaging Spectroradiometer (MODIS), Meteosat Second Generation Spinning Enhanced Visible and InfraRed Imager (SEVIRI), Advanced Very-High-Resolution Radiometer (AVHRR), and Landsat-8 Thermal InfraRed Sensor (TIRS), currently provide effective means for the thermal remote sensing of volcanoes at the global scale. Several papers published in the Special Issue demonstrate how these satellite data are nowadays well established across the volcanological community for research and the operational monitoring of volcanic thermal features (e.g., vents, geysers, hot springs, lava flows, lava domes).
SEVIRI is among the most used satellite sensors, owing to its high temporal resolution ranging from 15 min (Earth’s full disk) to 5 min (rapid scan mode over Europe and Northern Africa). Exploiting the time series collected in real time from a Meteosat-8 ground station antenna operating since 2010 at the National Institute of Geophysics and Volcanology (INGV) in Rome, Lombardo et al. [
15] tested a new detection method based on the wavelet transform of SEVIRI InfraRed (IR) data, to investigate eruptive processes and discriminate different styles of volcanic activity. In particular, a statistical analysis was performed on wavelet smoothed data derived from SEVIRI Mid-IR (MIR) radiance collected over Mount Etna in Italy from 2011 to 2017, when the volcano changed its eruptive style from predominantly effusive to more explosive (2011–2015), and a vigorous Strombolian activity started from the south-east crater producing a small lava flow (February 2017). The results (validated through ground-based information and literature references) suggested a relationship between the rate of increment in radiance (and thus temperature) and the nature of the volcanic process causing that increment. Statistical analysis of SEVIRI MIR radiance trends highlighted the involvement of at least two different heating mechanisms for eruptions at Mount Etna. Since the methodology applies to data acquired at the onset of the eruption, prediction of what will be its dominant eruptive style at later stages is feasible, with a degree of trustworthiness in the first eight hours from the beginning of the eruption.
Instead, Marchese et al. [
9] integrated AVHRR and MODIS observations in the Robust Satellite Techniques–volcanoes (RST
VOLC) algorithm within the satellite-based system developed at the Institute of Methodologies for Environmental Analysis (IMAA) of the National Research Council (CNR) of Italy to monitor Italian volcanoes in near-real time. The authors investigated the eruptive events occurring in May 2016 at Mount Etna, and the fumarolic emissions recorded before a small degassing vent (of approximately 20–30 m in diameter) opened within the Voragine crater (VOR). AVHRR and MODIS observations were integrated in RST
VOLC to generate hotspot products (i.e., JPG, Google Earth KML, and ASCII files) a few minutes after the sensing time. The detection of volcanic thermal anomalies is based on two local variation indices. The first identifies anomalous signal variations in the MIR band of the AVHRR (channel 3: 3.55–3.93 µm) and MODIS (channels 21/22: 3.929–3.989 µm) sensors, where hot magmatic surfaces reach the peak of thermal emissions. The second index allows the minimization of spurious effects associated with non-volcanological signal fluctuations. The results indicated that the Strombolian eruption of 21 May 2016 lasted longer than reported by field observations, or that a short-lived event occurred in the late afternoon of the same day. Furthermore, the intensity of fumarolic emissions changed before 7 August 2016, as a possible preparatory phase of the hot degassing activity occurring at VOR. These outcomes matched with the evidence found in Sentinel-2 MSI (Multispectral Instrument) and Landsat-8 OLI (Operational Land Imager) data.
While the above space missions remain reference data sources for the community, the paper by Plank et al. [
7] is an excellent example of the advances in space-borne sensor development, to achieve higher spatial resolution and sensitivity with regard to thermal anomalies. The authors demonstrated the applicability of the Technology Experiment Carrier-1 (TET-1), i.e., the first of two small experimental satellites of the German Aerospace Center (DLR)’s FireBIRD mission. TET-1 was launched in July 2012, followed by BIROS (Berlin IR Optical System) in June 2016. Both satellites are flying sun-synchronously in a low-Earth orbit at approximately 500 km altitude, with a repetition rate of approximately five days for one satellite, depending on its geographic location, and up to less than 3 days with ± 30° across-track acquisitions. The sensors operate two IR cameras, one in the Mid Wave IR (MWIR) and one in the Long Wave IR (LWIR), as well as a three-channel camera in the visible (VIS: RED and GREEN) and Near IR (NIR). The MWIR, LWIR, and RED channel are installed in the nadir position, while the GREEN and NIR channel are oriented off-nadir. TET-1 operates a push broom sensor system with a ground sampling distance of 178 m for the thermal channels, corresponding to a pixel resolution of 356 m due to staggering. The MWIR channel of TET-1 is more suitable for the detection of high-temperature events than LWIR (higher temperature events have a higher radiant power at shorter wavelengths according to Wien’s displacement law). In particular, the authors analyzed a time series of nine TET-1 thermal images acquired before and during the March/April 2015 eruption of Villarrica volcano (Chile), which is one of the most active volcanoes in the South Andes Volcanic Zone. The temperature, area coverage, and radiant power of the detected thermal hotspots were derived at the subpixel level and compared with observations derived from MODIS and Visible IR Imaging Radiometer Suite (VIIRS) data. TET-1 images allowed thermal anomalies to be detected nine days before the eruption. After the decrease of the radiant power following the 3 March 2015 eruption, a stronger increase of the radiant power was observed on 25 April 2015. Since the eruption caused ash coverage of the glacier at the eastern flank, surface changes were also investigated. The comparison with higher resolution multispectral data from Landsat-8 highlighted that the event was well captured in TET-1 imagery.
Alongside satellite observations, Thermal IR (TIR) ground-based observations are another important source of information to investigate thermal features, as well as volcanic plumes and gases, lava flows, lava lakes, and fumarole fields. Sansivero and Vilardo [
13] rightly pointed out that, in the past, such observations were mostly collected during a limited time span (e.g., eruption phases, field campaigns). The evidence that thermal precursors can be successfully detected before eruptions based on more continuous TIR observations has recently stimulated the increasing installation of permanent ground TIR stations at active volcanoes across the globe. However, such augmented availability of data has not yet been followed by an equal development of software packages allowing the processing of continuous TIR time series and near real-time automated analysis of large datasets. In this context, Sansivero and Vilardo [
13] aimed to fill the gap by presenting an operational processing chain developed in the Matlab© environment (Automated System of IR Analysis, ASIRA) that allows the detection and quantification of possible changes in time and space of the ground-surface thermal features. ASIRA allows effective removal of the seasonal component of IR temperature time series, and an estimation of radiative heat fluxes of thermal anomaly areas. The ASIRA code was applied to process TIR frames acquired at night by the stations of the TIRNet surveillance network operated by INGV’s Osservatorio Vesuviano (INGV-OV) at Phlegraean Fields volcanic area in Italy. The results show the effectiveness of this method. The Matlab© code of ASIRA and the Operative Manual are included in the Supplementary Materials of the paper, thus offering a tool for scholars to implement the analysis elsewhere with similar data.
Finally, it is important to not forget the impact that geophysical techniques can have on the detection of thermal anomalies associated to volcanic geothermal systems. Active volcanic areas are characterized by high-enthalpy geothermal systems that exhibit high-temperature zones (>150–200 °C) at ground level. While convective hydrothermal systems are most common, Hot Dry Rock (HDR) geothermal systems consisting of subsurface zones with very low fluid content are rarer. Gomez-Ortiz et al. [
16] focused their attention on HDR, thus providing an original contribution to the still very few studies on such geothermal systems based on magnetotellurics, transient electromagnetics, electrical resistivity, magnetics, self-potential, and seismic. The reason for this paucity of specialist literature is that the presence of vapor as the dominant phase (instead of hot water) makes this kind of system more difficult to interpret using electromagnetic methods. The authors demonstrate how near-surface geophysical modeling can be implemented to image thermal anomalies in HDR geothermal systems through a case study in the Timanfaya volcanic area in Lanzarote, Canary Islands. There, thermal anomalies are still present as a consequence of the historical eruptive activity that occurred between 1730 and 1736. In particular, the authors combined ground-penetrating radar (GPR), electromagnetic induction (EMI), and magnetic prospecting to characterize the geophysical signature of the high ground temperature areas. GPR revealed that when the material is homogeneous, the signature of the reflections is more intense in the areas with high temperature values. Similarly, a variation in the subsurface distribution of the thermal anomaly was detected for the first time through the analysis of GPR at different periods. The resistivity models obtained from the inversion of EMI data demonstrated that high-resistive areas are associated with high-temperature zones. Magnetic data showed that the zones with high-temperature values are associated with magnetic lows due to the demagnetization of the volcanic materials when they are heated to temperatures close to or higher than the Curie point of the involved magnetic minerals. Therefore, the authors conclude that the combined use of GPR, EMI, and magnetic prospecting methods is effective to locate and study both the geometry at depth and seasonal variability of geothermal areas associated with HDR systems.
2.2. Investigation, Mapping, and Prediction of Lava Flows and Lahars
Aufaristama et al. [
12] recalled that in high eruption frequency areas, lava flows often overlap each other and may exhibit similar spectral signatures, which makes their discrimination difficult. Spectral range and resolution (i.e., number of spectral bands), as well as the spatial resolution of satellite images, can further constrain the success of separation between different spectral signatures. Hyperspectral satellite data still provide limited spatial resolution (e.g., Earth Observing-1 or EO-1 Hyperion with a ground resolution of 30 m), so airborne sensors may help, but dedicated acquisition surveys are needed. A demonstration of such capabilities is discussed by the authors based on the analysis of hyperspectral data that they collected in 622 channels with spectral range from approximately 400 to 2500 nm by using the AisaFENIX sensor onboard the Natural Environment Research Council (NERC) Airborne Research Facility, five months after the Holuhraun 2014–2015 lava flow, in NE Iceland. This event lasted about six months (31 August 2014 to 27 February 2015) and produced a bulk volume of approximately 1.44 km
3 of basaltic lava, i.e., a diverse surface environment to investigate and characterize lava deposits. The objective was to retrieve the main lava surface type contributing to the signal recorded by airborne hyperspectral data at the very top surface of Holuhraun, on the area around the eruptive fissures vent, for which very high-resolution aerial photographs of the lava field (0.5 m spatial resolution) were available for comparison, and validation of the unmixing results. The data were atmospherically corrected using the QUick Atmospheric Correction (QUAC) algorithm, and the Sequential Maximum Angle Convex Cone (SMACC) method was used to find spectral endmembers and their abundances throughout the airborne hyperspectral image. In total, 15 endmembers (i.e., representing pure surface materials in a hyperspectral image) were estimated and categorized into six groups based on the shape of the endmembers: (1) basalt; (2) hot material; (3) oxidized surface; (4) sulfate mineral; (5) water; and (6) noise. This was required, since the amplitude varied due to illumination conditions, spectral variability, and topography. The respective abundances from each endmember group were retrieved using fully constrained Linear Spectral Mixture Analysis (LSMA). The authors conclude that the combination of SMACC and LSMA methods offers an optimum and a fast selection for volcanic products segregation. However, ground-truthing spectra are recommended for further analysis.
Instead, Dávila et al. [
19] relied on satellite images to revise and improve the chronological reconstruction of the different eruptive phases that occurred from September 2014 to September 2016 at Volcán de Colima in Mexico, including the eruption on 10–11 July 2015, which was the most violent since the 1913 Plinian eruption. Their analysis mainly relied on satellite products. SPOT-6 dual-stereoscopic and tri-stereopair images were used to generate the Digital Surface Models (DSMs) and therefore estimate the volumes of lava flows and the main pyroclastic flow deposits. SPOT-6/7 and EO-1 ALI (Advanced Land Imager) data were in parallel combined to better define the spatial distribution of the lava flows prior to and after the volcanic activity of July 2015. Then, pre- and post-eruption DSMs were used as topographic inputs to calibrate lava flow simulation software (i.e., the Etna Lava Flow Model, ELFM) to simulate different paths that lava might follow when emitted from a volcanic vent. Through this methodology, the authors were able to estimate that the total volume of the magma that erupted during the 2014–2016 event was approximately 40 × 10
7 m
3, i.e., one order of magnitude lower than that of the 1913 Plinian eruption. A larger magma volume stored in the magma chamber would have been necessary, and, as observed in the precursory activity of the 1913 eruption, dome destruction would have been accompanied by explosive events for the 2015 event to be similar to the 1913 one.
In the context of recent advances in space-borne sensors, the research by Aldeghi et al. [
25] is relevant in its attempt to demonstrate the novel Earth Observation (EO) technology of PlanetScope images with 3 m pixel size in an operational scenario of “rapid response” mapping of eruption deposits, which could be eroded or removed by rainfall soon after emplacement, and thus trigger secondary volcanic hazards such as lahars. Constellations of small satellites (‘CubeSats’) such as PlanetScope are bringing a new paradigm in the EO arena, given that they achieve very high spatial resolution at high cadence (up to less than 1 h) by means of numerous cheap satellites allowing for multiple scene acquisitions within a few minutes in the overlapping region. Aldeghi et al. [
25] tested PlanetScope 16-bit calibrated orthorectified surface reflectance data with a positional accuracy of better than 10 m, which was collected during the 31 January–2 February 2018 eruption of the Fuego volcano in Guatemala, to map lava flows, Pyroclastic Density Currents (PDCs), and tephra falls through visual analysis, the Normalized Difference Vegetation Index (NDVI) difference method, and trial-and-error approach using single bands. The authors found that high-resolution visible images can be a good alternative for lava flow mapping, provided that enough contrast with the background is achieved, and they allow for the detailed mapping of structural and morphological changes associated with the volcanic activity. In particular, the scar at the head of Barranca Honda was immediately identified after the eruption and could be interpreted as either a collapse or erosion feature associated with the generation or transit of PDCs through that area. As expected, the NDVI difference approach was not suitable for detecting changes in areas that were originally non-vegetated, and thus, no good results could be achieved for PDCs confined to the channels on the flanks of the volcanic edifice. On the contrary, for tephra fall mapping analysis, the method provided a much better alternative than visual mapping, given that the gradational boundaries of the tephra fall deposits (i.e., the transition from areas with heavy tephra fall to areas with no tephra fall) are smooth and may be difficult to define visually.
The Fuego volcano is also the subject of the paper by Cando-Jácome and Martínez-Graña [
17], who discussed the integrated results of satellite remote sensing and geospatial analysis to complement hazard maps generated in the aftermath of an eruption. In particular, the authors focused on the strong eruption occurred on 3 June 2018, when a dense cloud of 10 km-high volcanic ash and destructive pyroclastic flows caused approximately 200 deaths and huge economic losses in the nearby region. After the eruption, two scenarios of lahars for medium and heavy rains based on the numerical models were produced using the LAHARZ software, which was developed at the United States Geological Survey. To improve lahar mapping, Sentinel-1 Synthetic Aperture Radar (SAR) data were processed by means of Differential Interferometric SAR (DInSAR) to locate areas of ground deformation on the volcano flanks, where lahars could have formed and been triggered. To determine the trajectory of the lahars, parameters and morphological indices—accumulation of flow, topographic wetness index, length–magnitude factor of the slope—were analyzed with the software System for Automated Geoscientific Analysis (SAGA), and a slope stability analysis was performed using the SHAllow Landslide STABility software (SHALSTAB) based on the Mohr–Coulomb theory and its parameters. The application of this complementary methodology provided a more accurate response of the areas destroyed by primary and secondary lahars in the vicinity of the volcano.
For crisis management of effusive volcanic events, lava flow ‘distance-to-run’ is a key parameter to predict. However, lava flow is a complex surface feature to observe using remote sensing, given that temperature, texture, vesicularity, and thickness vary across the moving material. Rogic et al. [
14] focused their attention on the emissivity—the efficiency with which a surface radiates its thermal energy at various wavelengths—that is in close relationship with land surface temperatures and radiant fluxes and, as such, impacts directly on the prediction of lava flow behavior. Since emissivity is seldom measured and mostly assumed, the authors attempted a multi-stage experiment, combining laboratory-based Fourier Transform IR (FTIR) analyses, remote sensing data, and numerical modeling. In particular, they tested the capacity for reproducing emissivity using the ASTER Global Emissivity Database (GED) built by NASA’s Jet Propulsion Laboratory, while assessing the spatial heterogeneity of emissivity. To this purpose, the chemical composition of 10 rock samples was analyzed through X-Ray Fluorescence (XRF), and emissivity was retrieved from both reflectance and radiance data at ambient/low and high temperatures using FTIR spectroscopy. The laboratory–satellite emissivity values were used to establish a realistic land surface temperature from Landsat-7 ETM+ to obtain an instant temperature–radiant flux and eruption rate results for the 2001 Mount Etna eruption, which gave rise to an outstanding pattern of seven different fast-developing lava flows. Forward-modeling tests were conducted on the 2001 ‘aa’ lava flow by means of the MAGFLOW Cellular Automata code. Good correlation was found between laboratory (FTIR) and space-borne (ASTER GED) data for the same target area, and at specific TIR wavelengths, by exhibiting an emissivity range/error of ≤0.03. However, the authors concluded that this emissivity information is ‘static’, relates to the solidified (cooled) product, and does not reflect the range of temperatures involved at an active lava flow or the emissivity/temperature trend seen in the high-temperature FTIR results. Furthermore, the theoretical empirical approaches and modeling indicated that a 0.2 variation in emissivity may result in significant changes to the prediction of lava flow ‘distance-to-run’ estimates. Indeed, the tests conducted by the authors provided differences of up to approximately 600 m in the simulated lava flow ‘distance-to-run’ for a range of emissivity values. Therefore, this study highlighted the need to assess the role and significance of emissivity, not only as a ‘static’ and uniform value across all wavelengths and temperatures, but also to take its response to thermal gradient into account.
2.3. Monitoring Gas Emissions and Volcanic Plumes
Dissolved gases in magmas are the main drivers of most volcanic eruptions. Changes in their composition and fluxes can be proxies of subtle changes in the rate of magma ascent and degassing within shallow volcano plumbing systems. For example, this is the case of volcanic sulfur dioxide (SO2) emissions in plumbing systems located at less than 3 km depth.
In this regard, the paper by Delle Donne et al. [
21] provided an innovative contribution through a robust experimental demonstration to constrain the degassing regimes and eruptive behavior of the Mount Etna volcano in 2016. The technological focus of the paper is the development and testing of a novel algorithm for the real-time automatic processing of UltraViolet (UV) camera data and visualization of SO
2 flux time-series. Automation is meant to solve a known limitation of permanent UV camera systems that are extensively used to monitor volcanic SO
2 emissions, but produce streams of data whose processing is still time-consuming and labor-intensive. To obtain SO
2 emissions associated with diverse volcanic processes and dynamics—including quiescent (passive) degassing, explosive eruptions (Strombolian activity/lava fountaining), and effusive eruptions, and therefore capture switches between these different phases—the authors exploited the UV camera system installed at the Montagnola site, at about a 3 km distance from the active summit vents, and streaming real-time SO
2 flux results through a Wi-Fi data link. Measurements were also carried out during an ongoing lava fountaining event, which is not so common to find in the specialist literature. The results were validated through MODIS satellite-based thermal data obtained from the MIROVA (Middle IR Observation of Volcanic Activity) system, ground-based thermal data streamed by monitoring cameras of INGV’s Osservatorio Etneo (INGV-OE), and seismic tremor data. All these independent datasets showed coherent temporal variations that validated the use of UV cameras for detecting subtle changes in volcanic and degassing activity. Pre-paroxysm SO
2 fluxes were found to have consistent values (of approximately 2000 t/d) during the three episodes. Similarly, the highest SO
2 fluxes (from 3000 up to 5200 t/d on a daily average basis) were identified during the three eruptive sequences, while post-eruptive fluxes were systematically characterized by reduced degassing (<1000 t/d). If confirmed by future observations, these results may bring implications for identifying switches in volcanic activity regime. Therefore, this paper is novel because it has demonstrated a recent advance in instrumental volcanic gas monitoring as well as for the quantitative information published therein.
Since (at least) the 2010 eruption of Eyjafjallajökull in Iceland, even non-experts know that airborne volcanic ash represents a direct threat to aviation that can cause disruption to flight operations and damage infrastructure. During eruptions, warnings can be issued based on the outputs of models of atmospheric ash transport which, among other parameters, exploit the rate at which the material is ejected from volcanic vents.
Large-scale eruptions involving the injection of hot gas-laden pyroclasts into the atmosphere generate infrasound acoustic waves with frequencies typically <20 Hz, which can travel distances of up to several thousands of kilometers. Such low-frequency waves can be detected with ground-based acoustic infrasound instrumentation. Given the increasing implementation of this instrumentation by researchers and practitioners, the review by De Angelis et al. [
23] is timely in that it provides an insightful assessment of the developments and lessons learnt in this field. Focusing on acoustic infrasound at local distances (i.e., within 10–15 km from eruptive vents), the authors review near-field (<10 km from the vent) linear acoustic wave theory, evaluate recent advances in volcano infrasound modeling and inversion, and comment on the advantages and current limitations of these methods. Among the highlights, it is worth mentioning the recent introduction of numerical modeling to approximate the atmosphere’s impulse response in the presence of realistic topography, and how this approach has been integrated within inversion workflows. The authors also stress that the temporal resolution offered by acoustic infrasound in retrieving eruption source parameters in order to inform ash plume rise and transport models remains unmatched, and how this capability can be exploited for the rapid assessment of airborne eruption hazards.
Volcanic Cloud-Top Height (VCTH), as a Plume Elevation Model (PEM), is one of the most critical parameters to retrieve, because it affects the quantitative estimation of volcanic cloud ash and gases parameters, the mass eruption rate needed for the transport and deposition models, and the definition of the most dangerous zone for air traffic.
In a logic sequence with their previous publication focused on Landsat-8 OLI Level 0 raw data [
26], de Michele et al. [
18] presented a method to extract VCTH from orthorectified Level 1 data, i.e., the standard product available free of charge for end users. The concept behind this retrieval method is that the physical distance between the panchromatic sensor (PAN) and the multispectral sensors (MS), both onboard Landsat-like satellites, yields a baseline and a time lag between the PAN and MS image acquisitions during a single passage of the satellite. This information can be used to extract a spatially detailed map of VCTH from virtually any multispectral push broom system, namely PEM. While adapting such PEM methodology to the standard Landsat-8 products, the authors aimed to simplify the procedure for routine monitoring, offering an opportunity to produce PEM maps. They implemented this approach on the episodes that occurred at Mount Etna on 26 October 2013 and compared the results with independent VCTH measures from the geostationary SEVIRI and the polar MODIS. The analysis highlighted a good agreement with the Landsat-8 VCTH product, thus corroborating the accuracy and reliability of the proposed method.
2.4. Ground Deformation Analysis Based on SAR and InSAR
Owing to their capability to collect data in all weather conditions, SAR sensors, either space-borne or ground-based, are undoubtedly advantageous for monitoring volcanic activity. Countless examples can be found in the specialist literature on the use of SAR images and their derived products by means of Interferometric SAR (InSAR) processing. According to a recent estimate, over 500 volcanoes worldwide have now been the subject of InSAR measurements [
2].
In this Special Issue, SAR and InSAR are well represented to monitor the growth of lama domes [
22], examine a post-unrest period [
11], and to investigate the radar path delays due to the water vapor contained in volcanic gas plumes [
8].
Monitoring the growth of lava domes is crucial, given that explosive eruptions can make outer flanks unstable until they collapse and cause pyroclastic flows, which may move very quickly down the slopes and impact on regions several kilometers away and/or pose threat for aviation. An interesting contribution toward an effective monitoring solution is presented by Mania et al. [
22]. The authors combined seismic data, camera monitoring, and Mimatsu diagrams with change detection maps and pixel offset tracking based on TerraSAR-X SpotLight SAR images to understand the dome growth mechanisms acting during the January 2016–June 2017 eruption sequence at Bezymianny, an andesitic dome-building volcano in Kamchatka, Russia. In particular, camera monitoring allowed the approximate identification of topographic changes at Bezymianny’s flank. This assessment was refined using ground motion estimated from the pixel offset tracking algorithm, owing to the pixel spacing of 0.9 × 1.25 m in the slant-range and azimuth directions provided by TerraSAR-X, alongside the selected descending viewing geometry overcoming visibility issues due to the foreshortening and shadowing of the flanks. The results revealed clear morphometric changes preceding eruptions that were associated with intrusions and extrusions. In particular, seven to nine months of precursory ground motion were captured and were interpreted as a rigid body extruded at the summit prior to the first documented effusive December 2016–February 2017 eruption. Besides exogenous growth, the SAR amplitude images also unveiled distinct, recurrent endogenous growth stages as Bezymianny’s dome bulged northwards multiple times. Based on this evidence, the authors developed a conceptual model of volcanic growth at Bezymianny, thus proving how the integration of satellite observations with other remote sensing data can generate an improved understanding of lava dome building processes.
Papageorgiou et al. [
11] exploited multi-sensor satellite SAR datasets (i.e., Sentinel-1, Radarsat-2, and TerraSAR-X, and previously published ERS-1/2 and ENVISAT) processed with Multi-Temporal InSAR (MT-InSAR), as well as inversion modeling based on Volcano and Seismic source Model (VSM), to examine the post-unrest period of the Santorini volcano in Greece in 2012–2017. In the last century, volcanic activity up to the most recent eruption in 1950 was intertwined with the building of the intra-caldera islets of Palea and Nea Kameni. The latest volcano reactivation was followed by the restless period of 2011, but this did not produce an eruption. The geodetic analysis of the MT-InSAR data confirmed the new volcano state after the unrest period. The post-unrest response to the 2011–2012 inflation episode is well explained by a shallow sill-like source at 2 km depth. This is located just above the approximately 4 km-deep inflation source responsible for the 2011–2012 uplift. The authors also used ERS-1/2 and ENVISAT data from 1992 to 2010 in order to interpret the similarity between the pre- and post-unrest volcano deformation. The presence of a steady subsidence source at Nea Kameni, in accordance with the pre-unrest period, led to the re-evaluation of the 2011–2012 unrest. The interpretation model suggested the co-existence of the Kameni source during the unrest, although having a lower impact compared to the larger deformation induced by the inflation source.
If the above paper is a further demonstration of what can be achieved with InSAR to understand volcanoes, it is to be acknowledged that this technique is largely affected by changes in atmospheric refractivity, in particular changes in distribution of water vapor (H
2O) in the atmospheric column. Atmospheric contributions to Differential InSAR (DInSAR) data often have similar magnitudes and wavelengths as the actual ground deformation signal. To remove such interference from interferograms, scholars usually either implement time-space-based filtering or model atmospheric contribution, with the latter being based on prediction of the atmospheric phase delay along the satellite line-of-sight and its compensation by means of high-resolution numerical weather models. However, Bredemeyer et al. [
8] rightly pointed out that weather models are typically not able to capture atmospheric disturbances due to continuously degassing volcanoes. Consequently, the large and variable amounts of water vapor in volcanic plumes may cause differential phase errors in InSAR measurements due to the reduction of radar propagation velocity within the plume above and downwind of the volcano, which are notably well captured by short-wavelength X-band SAR systems (e.g., TerraSAR-X). In turn, this may lead to the misinterpretation of ground motions from an interferogram. Inversely, the estimation of the Precipitable Water Vapor (PWV) content in the plume at the time of SAR acquisitions is the key to overcome this limitation.
To investigate the radar path delays due to water vapor contained in the volcanic gas plume, Bredemeyer et al. [
8] selected Láscar volcano, in the dry Atacama Desert of Northern Chile. This choice proved to be very effective, given that Láscar is among the most active volcanoes of the central Andes, the second largest emission source of volcanic gases in Northern Chile, and is located in one of the driest areas on the Earth, where background atmospheric PWV is very low most of the year with generally less than 1 mm total water column. The authors estimated water vapor contents based on SO
2 emission measurements from a scanning UV spectrometer (Mini-DOAS) station installed at Láscar volcano, which were scaled by H
2O/SO
2 molar mixing ratios obtained during a Multi-component Gas Analyzer System (Multi-GAS) survey on the volcano crater rim. This methodological approach was justified in light of challenging direct measurements of volcanic water vapor emissions by means of optical remote sensing. Based on these estimates, the authors obtained daily average PWV contents inside the volcanic gas plume of a 0.2–2.5 mm equivalent water column, which translates to a Slant Wet Delay (SWD) in DInSAR data of 1.6–20 mm. By combining these estimates with high-resolution TerraSAR-X DInSAR observations at Láscar volcano, the authors demonstrated that gas plume-related refractivity changes are significant and detectable in DInSAR measurements.
2.5. Multi-Data and Multi-Sensor Monitoring of Volcanoes
In the last decade, the scientific literature on the remote sensing of volcanic hazard and risk is increasingly exploiting the integration of different observation capabilities, instrumentation and devices, and data (e.g., [
27,
28]). This trend is also observed in this Special Issue, particularly with the papers by Valade et al. [
24], Laiolo et al. [
20], and Di Traglia et al. [
10].
From a satellite data point of view, in the context of the EO revolution that the European Commission’s Copernicus Programme has opened with free accessibility to an increasingly large volume of data and observations from different satellite platforms, the volcano monitoring platform MOUNTS (Monitoring Unrest from Space) presented by Valade et al. [
24] is among the best examples of current operational infrastructure enabling users to understand the temporal evolution of volcanic activity and eruptive products based on the integration of multi-sensor satellite imagery with in situ and other remote sensing data. MOUNTS monitors 17 volcanoes, and its results are published in the form of both geocoded images and time series of relevant parameters through an open-access website, as they are generated from processing Sentinel-2 VIS and Short-Wave IR (SWIR) and Sentinel-5P TROPOspheric Monitoring Instrument (TROPOMI) data for thermal and SO
2 monitoring purposes, respectively. Additionally, one of the most interesting features is the pre-trained Convolutional Neural Network (CNN) that is incorporated into the processing pipeline to detect large deformation in InSAR interferograms and generate wrapped interferograms, coherence maps, unwrapped interferograms, SAR intensity image, deformation, and decorrelation time series in less than 24 h. The CNN approach is compared with methods published in the literature, and its performance is tested on the same volcanoes (i.e., Erta Ale in Ethiopia and Mount Etna in Italy). The paper also provides a portfolio of recent eruptions (Erta Ale 2017, Fuego 2018, Kilauea 2018, Anak Krakatau 2018, Ambrym 2018, and Piton de la Fournaise 2018–2019) to demonstrate the MOUNTS products and the utility of its interdisciplinary approach.
At Mount Etna, Laiolo et al. [
20] tested the hypothesis that the combination of multiple datasets can help for the detection of short- and long-term precursors preceding these events. Open-vent basaltic volcanoes can indeed alternate continuous emissions of magmatic-related products into the atmosphere with sporadic more energetic phenomena, such as paroxysmal explosions or flank eruptions. The authors chose the main effusive event that occurred on 24 December 2018 and the successive resumption of the summit explosive activity, and they combined heat flux data derived by the MODIS MIROVA sensor to calculate and track the evolution of time-averaged lava discharge rates and erupted volumes. Instead, they used the high spatial resolution of Copernicus Sentinel-2 multispectral images to locate the thermal activity at the multiple active summit vents. Infrasonic arrays and tremor amplitude measures were used to track the intensity, the frequency, and the source of the explosive events occurring at summit craters. Based on such data integration, the authors could record the shifting from open-vent conditions, represented by sustained summit Strombolian activity, to the 24–26 December flank effusion promoted by a 2 km-long feeder dyke intrusion. The dyke propagation lasted for almost 3 h, during which magma migrated from the central conduit system to the lateral vent, at a mean speed of 0.15–0.20 m/s. An accurate estimate of the lava volume from the summit outflows and lateral effusive episode was achieved.
Remaining in southern Italy, Di Traglia et al. [
10] conceived a well-structured multi-sensor study combining in situ and remote sensing measurements to characterize the run-up phase and the phenomena that occurred during the August–November 2014 flank eruption at Stromboli volcano in Italy. In particular, the authors relied on TIR and VIS cameras from the Camera Monitoring Network of INGV-OE; ground displacement recorded by the permanent-sited Ku-band Ground-Based InSAR (GBInSAR) device; seismic signals (band 0.02–10 Hz) from INGV-OV network, including amplitude of volcanic tremor, amplitude of explosion quakes, inclination of the seismic polarization in the Very-Long-Period (VLP) band (0.05–0.5 Hz), and a neural network-based analysis of seismic signals to detect signals related to landslides occurring along the Sciara del Fuoco slope; and finally high-resolution Digital Elevation Models (DEMs) reconstructed based on pre-eruptive 2012 LiDAR data and post-eruptive 2017 tri-stereo Pléiades-1 imagery, and related topographic change detection. With such a wealth of data, the authors found that the explosive activity peaked between 5 and 6 August 2014, whereas the GBInSAR device recorded a drastic increase in the displacement rate since the morning of 6 August, which was consistent with a strong inflation of the crater terrace. Ground displacement started to show evidence of sliding in the crater terrace after the 6 August 2014 evening, and this was also corroborated by seismic signals. The breaching of the summit cone with emplacement of a landslide along the Sciara del Fuoco was anticipated by the GBInSAR measurements, as observed by the live camera and recorded by the seismic data. Based on topographic change detection, a total volume of 3.07 ± 0.37 × 10
6 m
3 of lava flow field emplaced on the steep Sciara del Fuoco slope was estimated. This volume was below the limit of 6.5 ± 1 × 10
6 m
3 expected for triggering a paroxysmal explosion.


