Conversion of Agricultural Land for Urbanization Purposes: A Case Study of the Suburbs of the Capital of Warmia and Mazury, Poland


Abstract
:
1. Introduction
Background and Related Research
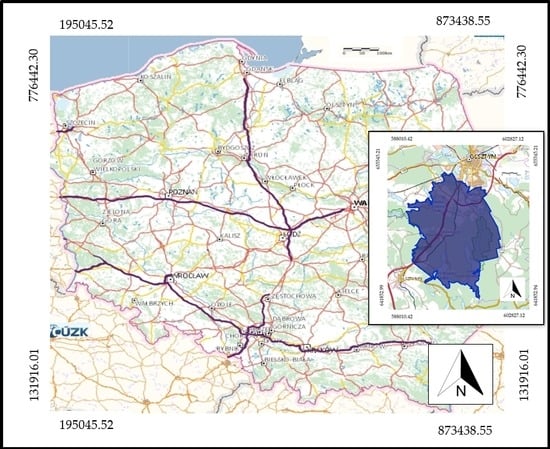
2. Research Area
3. Materials and Methods
3.1. Materials
3.2. Research Methodology
- —dependent variable (value of the plot)
- —fixed parameters of the model
- —independent variable (time)
- —random component of the model.
- r—time trend
- —fixed parameters of the regression model.
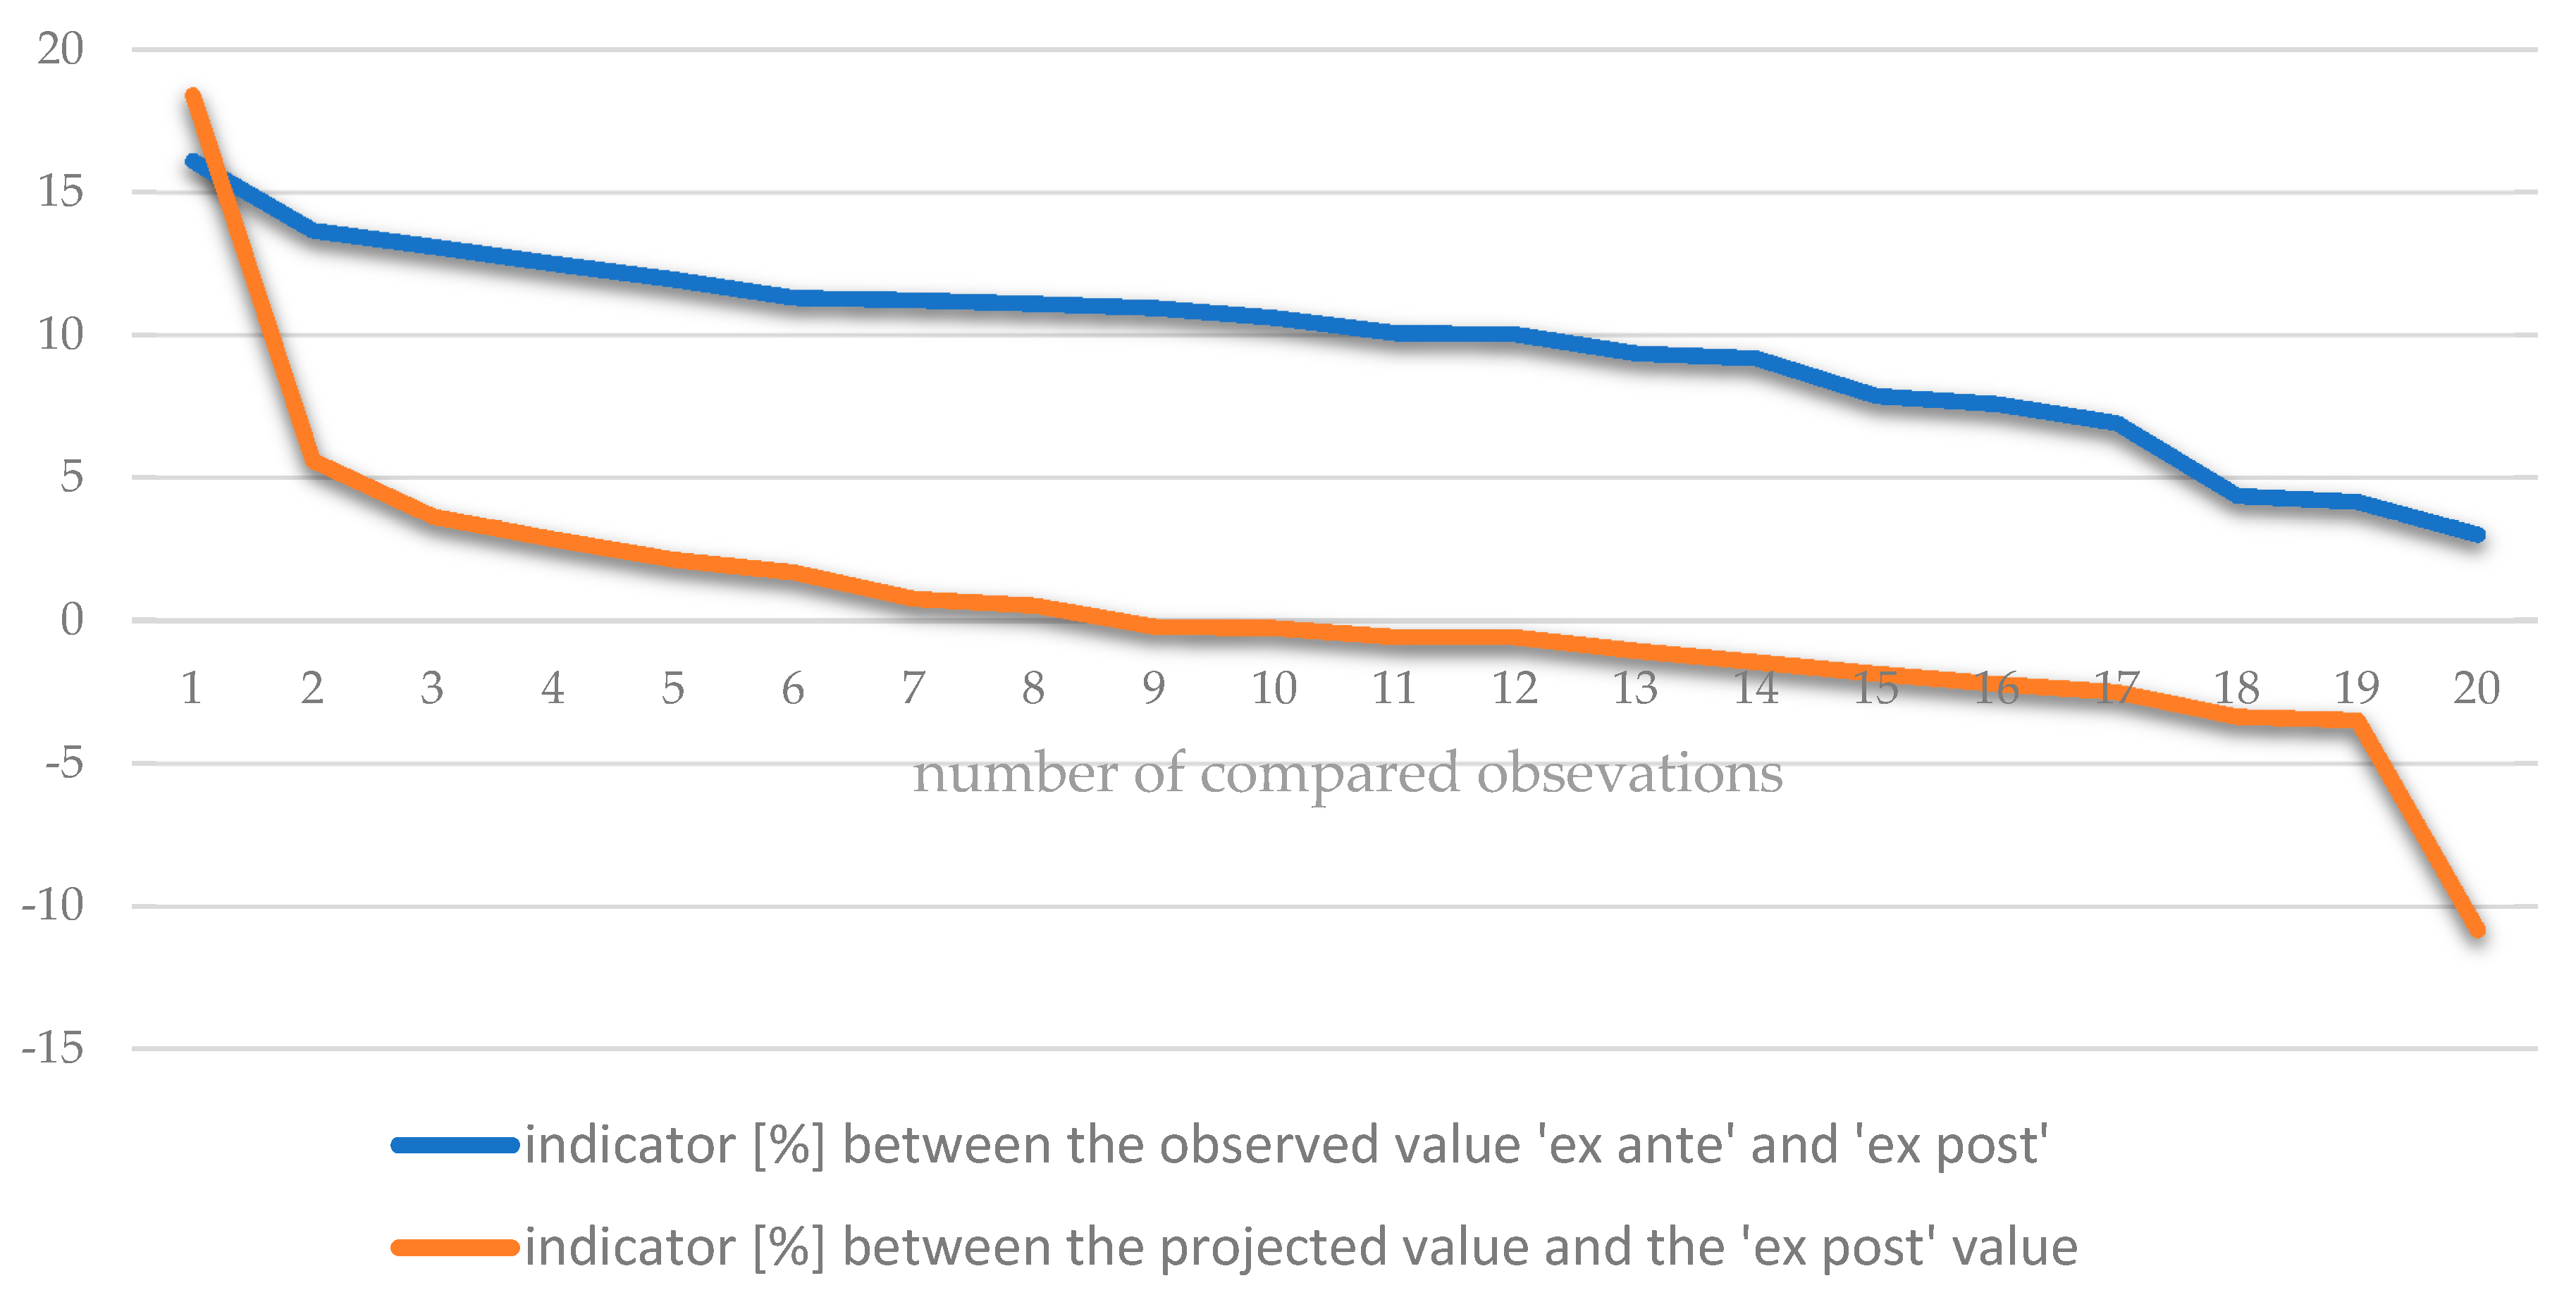
- —increase in the value of the “ex post” plot
- —value of the “ex post” plot
- —value of the “ex ante” plot.
- —dependent variable (value of the plot)
- —independent variable
- —free term
- —model parameters, coefficients determined with the least square method.
- β—standarized regression coefficient
- —parameter of the regression function
- —standard deviation of the independent variable
- —standard deviation of the dependent variable.
- —value of the plot after division
- —value of the plot before division
- —parameter of the regression function
- vi—i-th indepenedent variable (difference in the explanatory variable in the “ex ante” and “ex post” conditions).
4. Result and Discussion
5. Conclusions
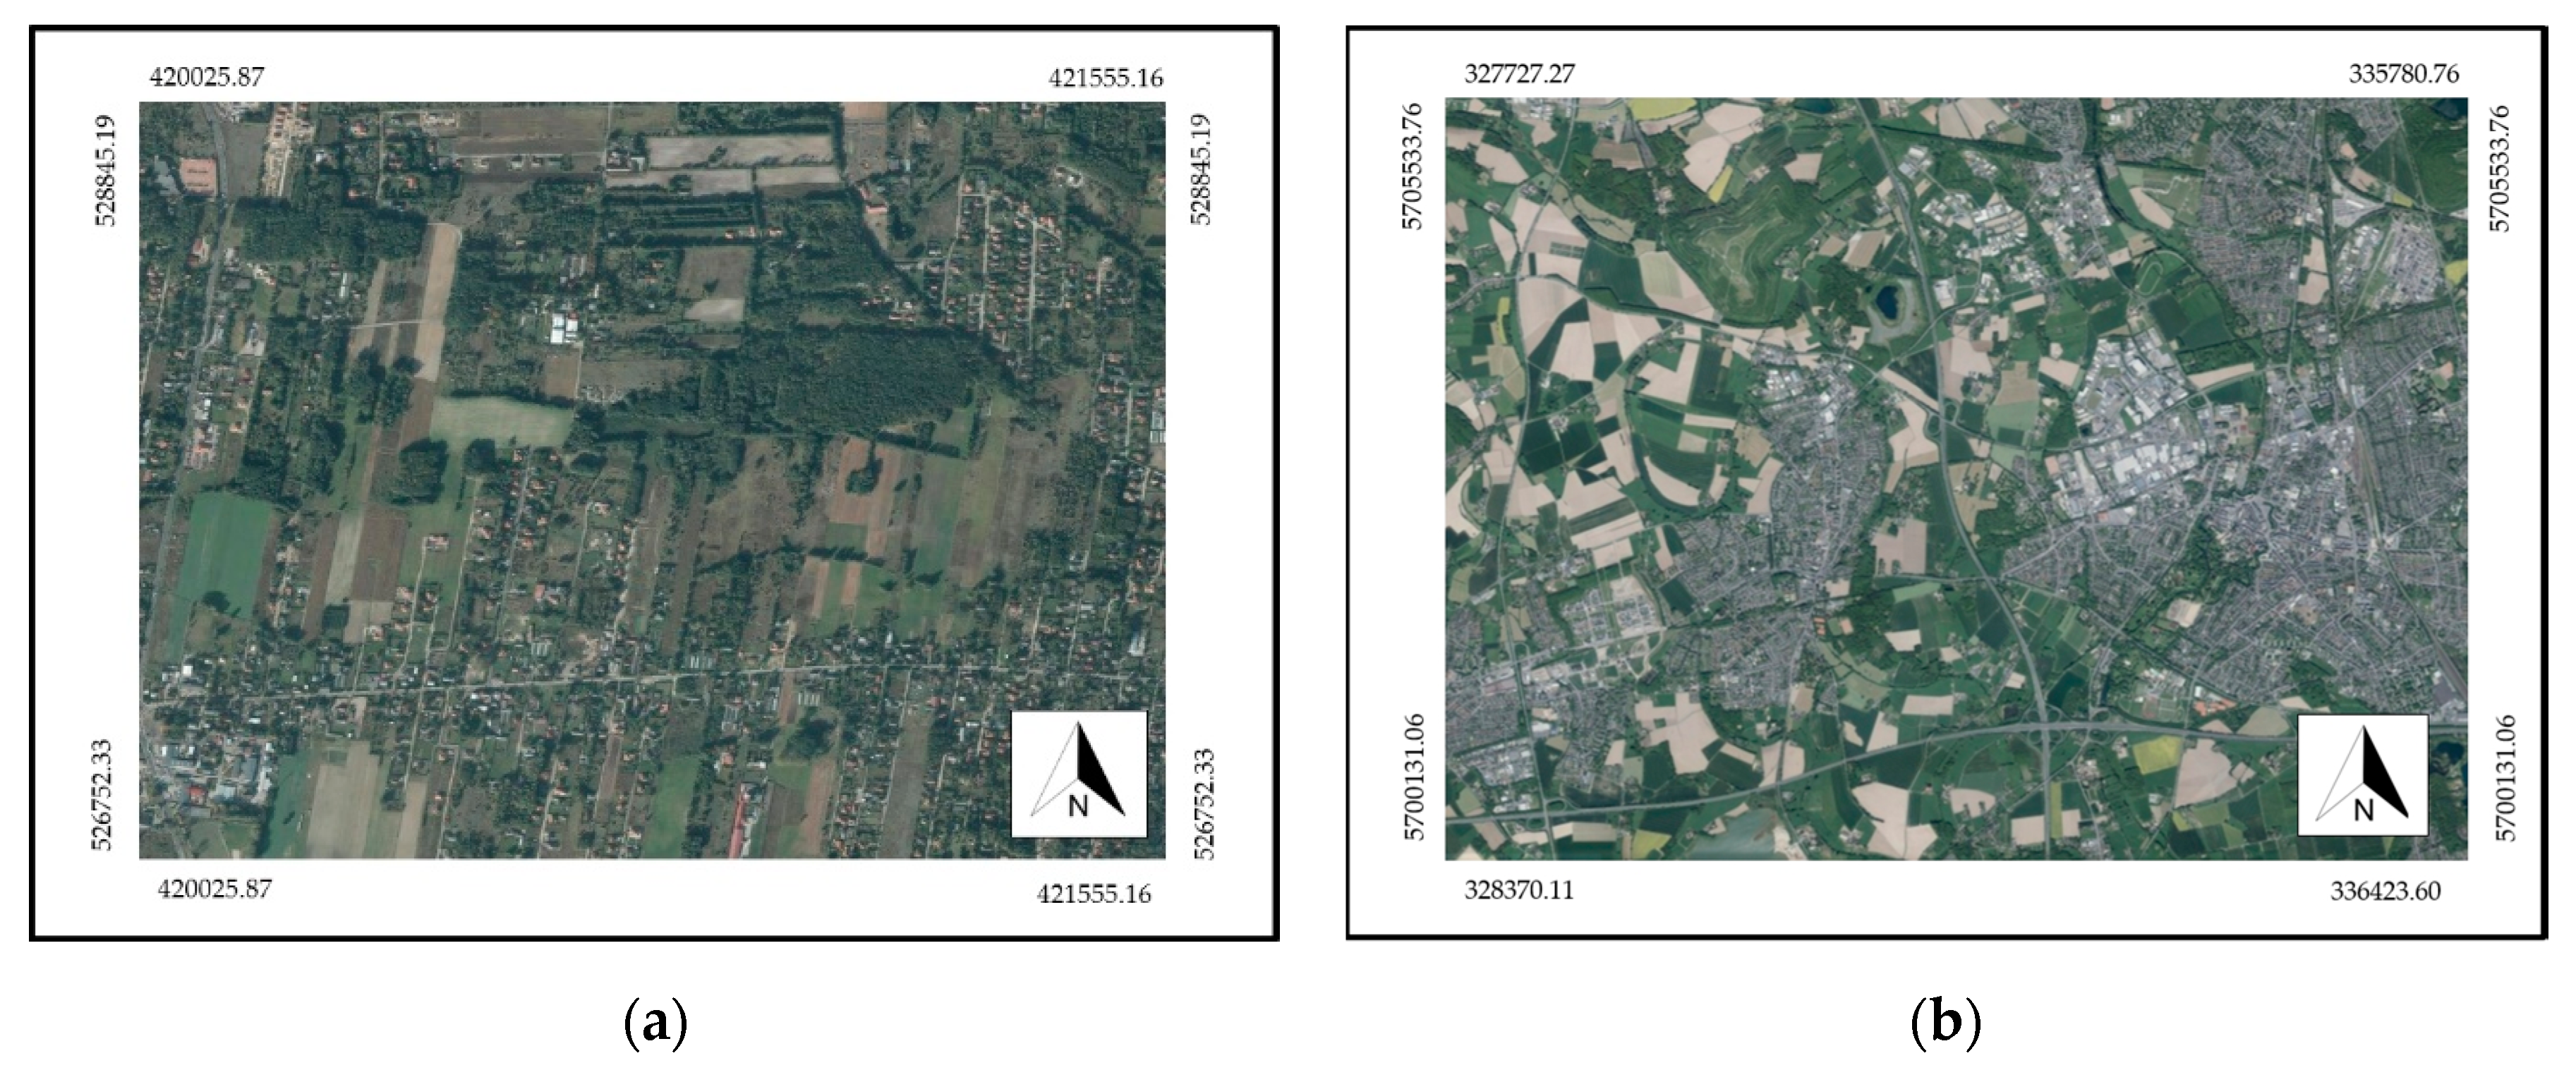
- (a)
- the use of currently available CLC, geoportal and MSIPMO data for various time intervals and GIS tools allow for the analysis of agricultural land conversion in the direction of development use;
- (b)
- the analysis of statistical models confirms that the conversion of land from agricultural to development use is economically viable for property owners (about 10%);
- (c)
- current legal conditions in the studied area are conducive to the conversion process, which consequently creates urban chaos.
Author Contributions
Funding
Conflicts of Interest
References
- Jiang, G.; Ma, W.; Qu, Y.; Zhang, R.; Zhou, D. How does sprawl differ across urban built-up land types in China? A spatial-temporal analysis of the Beijing metropolitan area using granted land parcel data. Cities 2016, 58, 1–9. [Google Scholar] [CrossRef]
- Gibas, P.; Heffner, K. Społeczne i Ekonomiczne Koszty Bezładu Przestrzeni—Osadnictwo Obszarów Wiejskich; Komitet Przestrzennego Zagospodarowania Kraju PAN: Warszawa, Poland, 2018; pp. 163–197. [Google Scholar]
- Mrakuszewska, I. Conflicts between legal policy and rural area management in Poland. Acta Geogr. Slov. 2018, 58, 59–67. [Google Scholar] [CrossRef] [Green Version]
- Śleszyński, P.; Markowski, T.; Kowalewski, A. Synteza: Uwarunkowania, Skutki i Propozycje Naprawy Chaosu Przestrzennego; KPZP: Warszawa, Poland, 2018. [Google Scholar]
- Markowski, T. Ekonomiczny Wymiar Urbanizacji; KPZK: Warszawa, Poland, 2014; pp. 19–29. [Google Scholar]
- Jankava, A.; Parsova, V.; Berzina, M.; Palabinska, A. Role of brownfields regeneration in sustainable use of natural resources. Balt. Surv. 2019, 2, 31–39. [Google Scholar] [CrossRef]
- Jensen, J.R. Introductory Digital Image Processing: A Remote Sensing Perspective, 3rd ed.; Prentice Hall: Upper Saddle River, NJ, USA, 2005. [Google Scholar]
- Kanianska, R.; Kizeková, M.; Nováček, J.; Zeman, M. Land-use and land-cover changes in rural areas during different political systems: A case study of Slovakia from 1782 to 2006. Land Use Policy 2014, 36, 554–566. [Google Scholar] [CrossRef]
- Cegielska, K.; Noszczyk, T.; Kukulska, A.; Szylar, M.; Hernik, J.; Dixon-Gough, R.; Jombach, S.; Valanszki, I.; Filepne Kovacs, K. Land use and land cover changes in post-socialist coutries; some obserwations from Hungary and Poland. Land Use Policy 2018, 78, 1–18. [Google Scholar] [CrossRef]
- Organisation for Economic Co-operation and Development. Available online: http:/OECD.stat (accessed on 4 April 2020).
- Prus, B. Koncepcja badania pokrycia terenu w Polsce i określenie prognozy jego zmian. Zesz. Nauk. 2019, 422, 205. [Google Scholar]
- Repaska, G.; Vilinova, K.; Solcova, L. Trends in development residential areas in suburban zone of the city of Nitra (Slovakia). Eur. Countrys. 2017, 9, 287–301. [Google Scholar] [CrossRef] [Green Version]
- Shcharbach, Y.S.; Potaev, G.A. Specific features in building and development of residential areas in suburbs of largest Bielarusian cities. Sci. Tech. 2017, 16, 275–281. [Google Scholar]
- Kowalczyk, A.M. Valuation and Valorisation of Urban Landscape in Olsztyn. Studia Reg. 2012, 34, 77–94. [Google Scholar]
- Grochowska, A. Konflikty przestrzenne w procesie planowania na przykładzie gmin powiatu trzebnickiego. Studia Miejskie 2015, 20, 179–187. [Google Scholar]
- Kowalewski, A.; Mordasewicz, J.; Osiatyński, J.; Regulski, J.; Stępień, J.; Śleszyński, P. Raport o Ekonomicznych Stratach i Społecznych Kosztach Niekontrolowanej Urbanizacji w Polsce (Report on the Economic and Social Costs of Uncontrolled Urbanization in Poland); Fundation in Support of Local Democracy and Institute of Geography and Spatial Organization, Polish Academy of Sciences: Warsaw, Poland, 2013; Available online: http://www.frdl.org.pl/pliki/frdl/document/zalaczniki_artykuly/Raport%20Ekonomiczny%2029.10.2013%20calosc.pdf (accessed on 10 March 2020).
- Ziobrowski, Z. Polityka Przestrzenna a Decyzje o Warunkach Zabudowy; KPZK: Warszawa, Poland, 2010. [Google Scholar]
- Borkowski, P.; Brunewicz, J.; Koźlak, A.; Pawłowska, B.; Ważna, A. Transport a organizacja przestrzeni w życiu społeczno-gospodarczym. In Studia Nad Chaosem Przestrzennym, Cz.2, Koszty Chaosu Przestrzennego; Kowalewski, A., Markowski, T., Śleszyński, P., Eds.; Komitet Przestrzennego Zagospodarowania Kraju PAN: Warszawa, Poland, 2018; pp. 81–113. [Google Scholar]
- Śleszyński, P. Wydatki Związane z Infrastrukturą Techniczną; Komitet Przestrzennego Zagospodarowania Kraju: Warszawa, Poland, 2018; pp. 196–228. [Google Scholar]
- Zathey, M. Zanieczyszczenie Powietrza i Nieefektywność Energetyczna Struktur Osadniczych w Kontekście Bezładu Przestrzennego w Polsce; KPZK: Warszawa, Poland, 2018; pp. 229–238. [Google Scholar]
- Thompson, D. Suburban sprawl: Exposing hidden costs, identifying, innovations. In Sustainable Prosperity; University of Ottawa: Ottawa, ON, Canada, 2013. [Google Scholar]
- Williams, T. Blighted Cities Prefer: Razing to Rebuilding. New York Times. Available online: https://www.nytimes.com/2013/11/12/us/blighted-cities-prefer-razing-to-rebuilding.html (accessed on 15 March 2020).
- Anderson, M.W. Dissolving cities. Yale Law J. 2012, 121, 1364–1446. [Google Scholar]
- Silva, C. The rural lands of urban sprawl: Institutional changes and suburban rurality in Santiago de Chile. Asian Geogr. 2019, 1–28. Available online: https://www.tandfonline.com/doi/abs/10.1080/10225706.2019.1701505 (accessed on 15 March 2020). [CrossRef]
- Ekers, M.; Hamel, P.; Keil, R. Governing suburbia: Modalities and mechanisms of suburban governance. Reg. Stud. 2012, 46, 405–422. [Google Scholar] [CrossRef]
- Mattingly, K.; Morrissey, J. Housing, and transport expenditure: Socio-spatial indicators of affordability in Auckland. Cities 2014, 38, 69–83. [Google Scholar] [CrossRef]
- Kassa, F. Conurbation and Urban Sprawl in Africa: The case of the City of Addis Ababa. Ghana J. Geogr. 2013, 5, 73–89. [Google Scholar]
- Zhang, R.; Pu, L.; Zhu, M. Impacts of transportation arteries on land use patterns in urban-rural fringe: A comparative gradient analysis of Qixia District, Nanjing City, China. Chin. Geogr. Sci. 2013, 23, 378–388. [Google Scholar] [CrossRef]
- Firlej, C.; Firlej, K.A. Porównanie Systemów Opodatkowania Nieruchomosci w Unii Europejskiej (Comparison of Property Taxation Systems in the EU); Institute of World Economics: Krakow, Poland, 2014; Available online: https://depot.ceon.pl/handle/123456789/7545?show=full (accessed on 15 May 2020).
- Marona, B. System opodatkowania nieruchomości w Polsce na tle rozwiązań w wybranych krajach europejskich. Zeszyty Naukowe Akademii Ekonomicznej w Krakowie 2006, 703, 115–128. [Google Scholar]
- Kocur-Bera, K. Data compatibility between the Land and Building Cadaster (LBC) and the Land Parcel Identification System (LPIS) in the context of area-based payments: A case study in the Polish Region of Warmia and Mazury. Land Use Policy 2019, 80, 370–379. [Google Scholar] [CrossRef]
- Kocur-Bera, K.; Dawidowicz, A. Land use versus land cover: Geo-analysis of national roads and synchronization algorithms. Remote Sens. 2019, 11, 3053. [Google Scholar] [CrossRef] [Green Version]
- Silva, C. Auckland’s Urban Sprawl, Policy Ambiguities and the Peri-Urbanisation to Pukekohe. Urban Sci. 2019, 3, 1. [Google Scholar] [CrossRef] [Green Version]
- Fulton, W.; Pendall, R.; Nguyen, M.; Henderson, A. Who Sprawls Most? Brookings Institution: Washington, DC, USA, 2001. [Google Scholar]
- Jaret, C.; Ghadge, R.; Reid, L.W.; Adelman, R.M. The measurement of suburban sprawl: An evaluation. City Community 2009, 8, 65–84. [Google Scholar] [CrossRef]
- Angel, S.; Parent, J.; Civco, D.L.; Blei, A.M. Atlas of Urban Expansion; Lincoln Institute of Land Policy: Cambridge, MA, USA, 2012. [Google Scholar]
- Szold, T.S. Introduction and overviews: And then there was smart growth. In Smart Growth: Form and Consequences; Szold, T.S., Carbonell, A., Eds.; Lincoln Institute of Land Policy: Cambridge, MA, USA, 2002; pp. 2–15. [Google Scholar]
- Abbott, C.; Margheim, J. Imagining Portland’s urban growth boundary: Planning regulation as a cultural icon. J. Am. Plan. Assoc. 2008, 74, 196–208. [Google Scholar] [CrossRef]
- Schmid, A.A. Converting Land from Rural to Urban Uses; Resources for the Future, Inc.: Washington, DC, USA, 1968. [Google Scholar]
- Liu, P. Smart Plot Division—A Plot-based Rehabilitation Strategy for Historic Urban Areas. Urban Plan. Forum 2018, 5, 16. [Google Scholar]
- Jędrak, J. Legal and Economic Aspects of Real Estate Property. Secur. Econ. Law 2018, 1, 30–73. [Google Scholar]
- Felcenloben, D. Wydzielenie działki budowlanej zabudowanej budynkiem mieszkalnym w trybie art. 95 ust. 7 ustawy o gospodarce nieruchomościami. Przegląd Geodezyjny 2019, 91, 15–18. [Google Scholar] [CrossRef]
- LDCQ. Land division control guide. In Planning Guide Number 1, Wisconsin, 2nd ed.; Southeastern Wisconsin Regional Planning Commission: Waukesha, WI, USA, 2001; Available online: https://www.sewrpc.org/SEWRPCFiles/Publications/pg/pg-01_land_division_control_guide.pdf (accessed on 20 April 2020).
- Booba, T.N.; Rao, Y.R.M. Zoning within Plot–An Approach to Land Sub-Division to Control Violation of Development Control Rules. Int. J. Multidiscip. Curr. Res. 2014, 2, 48–59. Available online: http://ijmcr.com (accessed on 20 March 2020).
- Balawejder, M.; Noga, K. The influence of the highway route on the development of a patchwork of plots. J. Water Land Dev. 2016, 30, 3–11. [Google Scholar] [CrossRef] [Green Version]
- Porzucek, W.; Rybicki, R.; Czernyszewicz, E. Wpływ podziałów i połączeń nieruchomości na jakość rolniczej przestrzeni produkcyjnej na przykładzie obiektu w gminie Wólka. In Jakość i Zarządzanie w Agrobiznesie Wybrane Aspekty; University of Life Science in Lublin: Lublin, Poland, 2018; pp. 108–124. [Google Scholar]
- Malina, R.; Kowalczyk, M. Geodezja Katastralna; Wydawnictwo Gall: Katowice, Poland, 2011. [Google Scholar]
- Act of 27 of August 1997 on Land Management (Journal of Lows 115, Item 147). Available online: http://www.isap.gov.pl (accessed on 13 March 2020).
- Act of 23 of April 1964 on Civil Code (Journal of Laws 16, Item 93). Available online: http://www.isap.gov.pl (accessed on 16 April 2020).
- Wolanin, M. Podziały, Scalenia i Rozgraniczenia Nieruchomości, Wydanie 2; Wydawnictwo, C.H. Beck: Warszawa, Poland, 2013. [Google Scholar]
- Act of 17 of May 1989 on Geodetic and Cartographic Low (Journal of Laws 30, Item 163). Available online: http://www.isap.gov.pl (accessed on 12 April 2020).
- Wszołkowska–Szewczyk, A. The current spatial structure of rural landscape and consequences of building single family houses. Tech. Issues 2017, 2, 48–58. [Google Scholar] [CrossRef]
- Główny Urząd Statystyczny. Available online: https://stat.gov.pl/ (accessed on 10 April 2020).
- Geoportal. Available online: https://mapy.geoportal.gov.pl/imap/Imgp_2.html (accessed on 15 January 2020).
- Corine Land Cover. Available online: http://clc.gios.gov.pl/index.php/o-clc/definicje-klas (accessed on 11 April 2020).
- CLC. Available online: http://land.copernicus.eu (accessed on 17 June 2020).
- Portal Mapowy Systemu Informacji Przestrzennej Miasta Olsztyna. Available online: https://msipmo.olsztyn.eu/imap/ (accessed on 11 April 2020).
- Dyrektywa 2007/2/WE Parlamentu Europejskiego i Rady z Dnia 14 Marca 2007 r. Ustanawiająca Infrastrukturę Informacji Przestrzennej We Wspólnocie Europejskiej (INSPIRE) (Dz.U. L 108 z 25.4.2007). Available online: https://eur-lex.europa.eu/legal-content (accessed on 20 April 2020).
- Rozporządzenie Komisji (UE) nr 268/2010 z Dnia 29 Marca 2010 r. wykonujące Dyrektywę 2007/2/WE Parlamentu Europejskiego i Rady w Odniesieniu do Dostępu Instytucji i Organów Wspólnoty do Zbiorów i Usług Danych Przestrzennych Państw Członkowskich Zgodnie ze Zharmonizowanymi Warunkami (Dz.U. L 83 z 30.3.2010). Available online: https://eur-lex.europa.eu/legal-content (accessed on 20 April 2020).
- Bitner, A. Construction of the multiple regression model in real estate valuation. Acta Scientiarum Polonorum Administratio Locorum 2007, 4, 59–66. Available online: https://www.ceeol.com/search/article-detail?id=800732 (accessed on 20 March 2020).
- Bitner, A. Zależność cena—pole powierzchni dla nieruchomości gruntowych niezabudowanych. Acta Scientarum Polonorum Administratio Locorum 2008, 7, 41–53. [Google Scholar]
- Wang, J.; Xu, Q. The Influence of Floating Population on Real Estate Prices: An Empirical Study of Beijing. In Proceedings of the 2nd International Conference on Education, E-learning and Management Technology. Available online: http://www.dpi-proceedings.com/index.php/dtssehs/article/view/14418 (accessed on 20 March 2020).
- Czaja, J.; Prewda, E. Analiza ilościowa różnych współczynników korelacji na przykładzie sześciowymiarowej zmiennej losowej. Geodezja 2000, 6, 147–154. [Google Scholar]
- Ostasiewicz, W. Badania Statystyczne; Warszawa Wolters Kluwer Bussines, 2011; p. 268. Available online: http://www.books.google.pl/books (accessed on 20 April 2020).
- Zydroń, A.; Walkowiak, R. Analysis of Factors Affecting Value of Undeveloped Plots Allocated for Building Development in Mosina Municipality. Annu. Set Environ. Prot. 2013, 15, 2911–2924. [Google Scholar]
- Dzieciuchowicz, J.; Dmochowska-Dudek, K. The size and the shape of ground plots in Łódź. Acta Universitati Slodziensis Folia Geographica Socio-Oeconomica 2014, 16, 149–167. [Google Scholar]
- Kocur-Bera, K.; Stachelek, M. Geo-Analysis of Compatibility Determinants for Data in the Land and Property Register (LPR). Geosciences 2019, 9, 303. [Google Scholar] [CrossRef] [Green Version]
- Kocur-Bera, K. Understanding information about agricultural land. An evaluation of the extent of data modification in the Land Parcel Identification System for the needs of area-based payments—A case study. Land Use Policy 2020, 94, 104527. [Google Scholar] [CrossRef]
- Act of 7 July 1994 on Building Low (Journal of Laws, Item 1186). Available online: http://www.isap.gov.pl (accessed on 6 October 2019).
- Regulation of the Minister of Infrastructure and Development on 12 April 2002 on the Technical Conditions to be Met by Buildings and Their Location (Journal of Lows, Item 1422). Available online: http://www.isap.gov.pl (accessed on 3 March 2019).
- Leszek, D. The Commune of Mielno as a Case Study of the Increase of Real Estate Value due to Divisions of Real Estate and Construction of the Infrastructure; Motrol. Commission of Motorization and Energetics in Agriculture, Koszalin University of Technology: Koszalin, Poland, 2014; pp. 19–24. [Google Scholar]
- Jiang, G.; Ma, W.; Wang, D.; Zhou, D.; Zhang, R.; Zhou, T. Identifying the internal structure evolution of urban built-up land sprawl (UBLS) from a composite structure perspective: A case study of the Beijing metropolitan area, China. Land Use Policy 2017, 62, 258–267. [Google Scholar] [CrossRef]
- Brueckner, J.K. Urban Spraw: Diagnosis and Remedies. Int. Reg. Sci. Rev. 2000, 23, 160–171. [Google Scholar] [CrossRef]
- Cobbinah, P.B.; Aboagye, H.N. A Ghanaian twist to urban sprawl. Land Use Policy 2017, 61, 231–241. [Google Scholar] [CrossRef]
- Frumkin, H. Urban Sprawl and Public Health. Public Health Rep. 2002, 117, 201–217. [Google Scholar] [CrossRef]
- Cieślak, I.; Biłozor, A.; Szuniewicz, K. The Use of the CORINE Land Cover (CLC) Database for Analyzing Urban Sprawl. Remote Sens. 2020, 12, 282. [Google Scholar] [CrossRef] [Green Version]
- Mosammam, H.M.; Nia, J.T.; Khani, H.; Teymouri, A.; Kazemi, M. Monitoring land use change and measuring urban sprawl based on its spatial forms: The case of Qom city. Egypt. J. Remote Sens. Space Sci. 2017, 20, 103–116. [Google Scholar] [CrossRef] [Green Version]
- Cechcini, M.; Zambon, I.; Pontrandolfi, A.; Turco, R.; Colantoni, A.; Mavrakis, A.; Salvati, L. Urban sprawl and the ‘olive’ landscape: Sustainable land management for ‘crisis’ cities. GeoJournal 2019, 84, 237–255. [Google Scholar] [CrossRef]
- Dupras, J.; Marull, J.; Parcerisas, L.; Coll, F.; Gonzalez, A.; Girard, M.; Tello, E. The impacts of urban sprawl on ecological connectivity in the Montreal Metropolitan Region. Environ. Sci. Policy 2016, 58, 61–73. [Google Scholar] [CrossRef] [Green Version]


| Attribute | Description | Aver. | Min. | Max. |
|---|---|---|---|---|
| Xarea | Surface area of the “ex ante” plot [m2] [1—above 10,000 m2; 2—4500 m2 to 9 999 m2; 3—2500 m2 to 4499 m2; 4—up to 2499 m2] | 1.9948 | 0.0237 | 31.6709 |
| Xaccess | Access to the plot [1—no access (ground easement); 2—direct access to a public road, unpaved (ground) road; 3—direct access to a public road, paved road (destruct, other types of paving, but not tarmac); 4—direct access to a public road, paved road, tarmac in good condition] | 2.00 | 1.00 | 4.00 |
| Xutilities | Provision of utilities [1—no utilities provided; 2—electricity, water supply within reach; 3—electricity, water supply, sewerage system; 4—all utilities, electricity, water supply, sewerage, gas, etc.] | 2.00 | 1.00 | 4.00 |
| Xshape | Number of border points/plot shape [1—irregular arrangement of the plot boundaries, more than 11 border points; 2—irregular or significantly elongated shape, max. 11 border points; 3—regular arrangement of the borders, max. 7 border points; 4—regular arrangement of the borders, max. 5 border points] | 10.13 | 4.00 | 22.00 |
| Xnumber | Number of “ex post” plots [1–2 plots “ex post”; 2–3 to 4 plots “ex post”; 3–5 to 10 plots “ex post”; 4–above 10 plots “ex post”] | 5.24 | 2.00 | 45.00 |
| Characteristic | Description |
|---|---|
| Number of analyzed decisions | 74 |
| Period | 2015–2018 |
| Number of analyzed “ex ante” plots | 75 |
| Number of analyzed “ex post” plots | 393 |
| Maximum area of “ex ante” plots | 31.6709 ha |
| Minimum area of “ex ante” plots | 0.0237 ha |
| Minimum area of “ex post” plots | 0.0007 ha |
| Maximum area of “ex post” plots | 9.8056 ha |
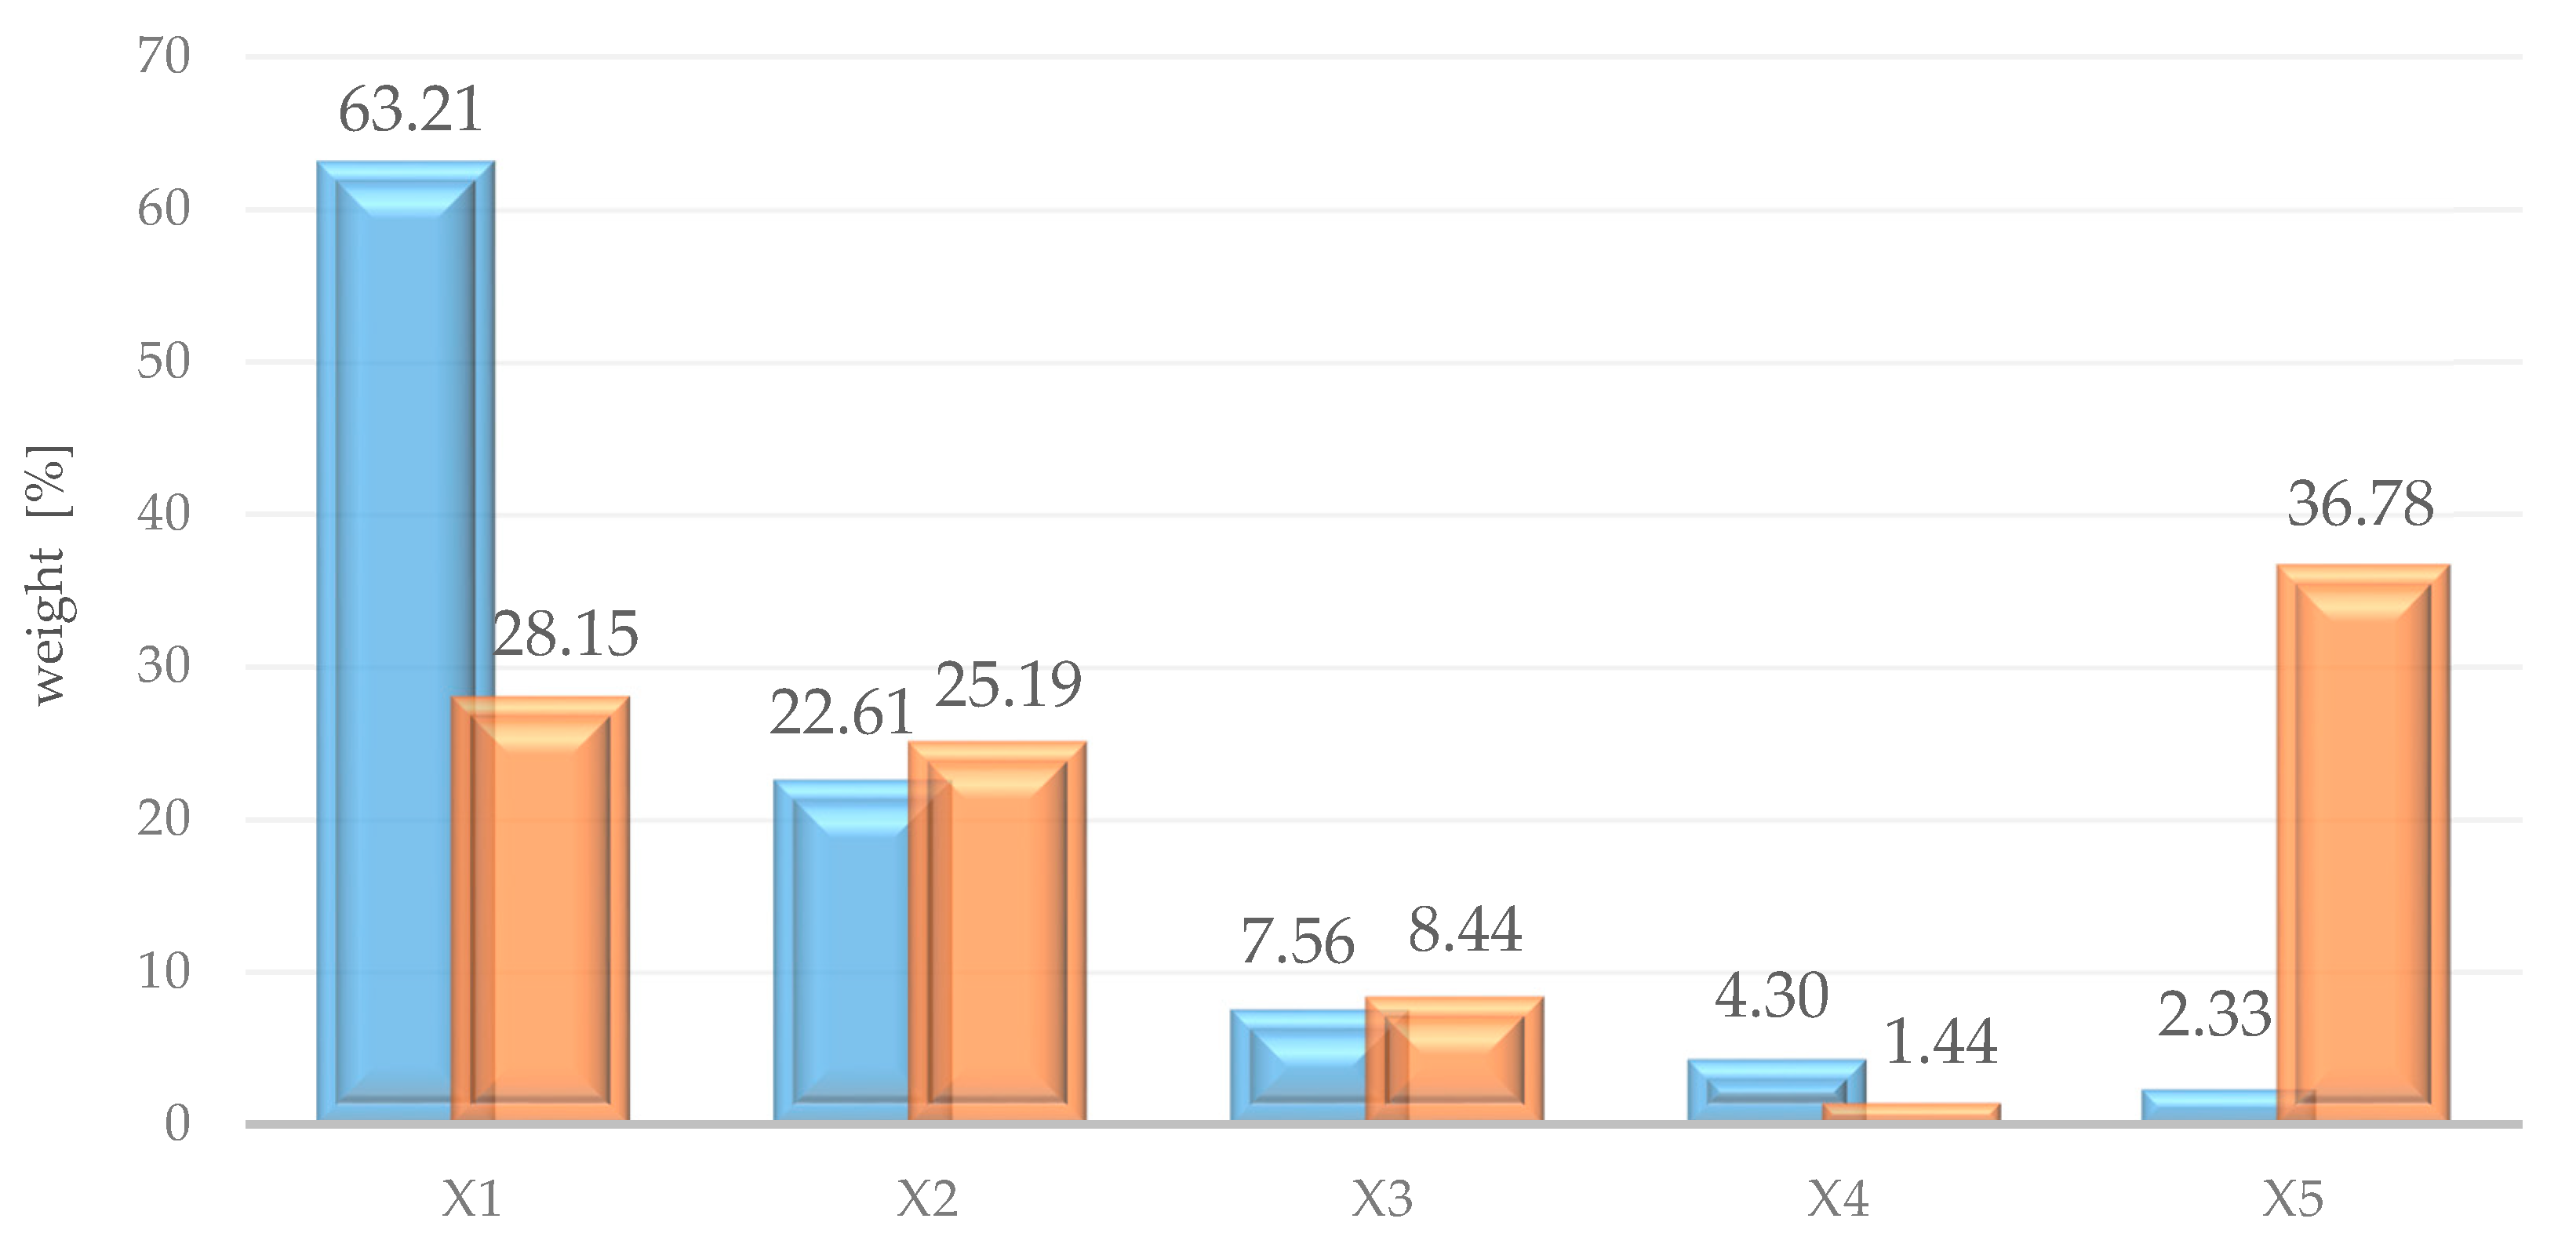
| Independent Variable | Coefficient b | Sdev. | t-Student | P | Beta | Weight [%] |
|---|---|---|---|---|---|---|
| Const. | 44.6056 | 24.4938 | 1.8211 | 0.0900 | ||
| Xarea | 14.5846 | 4.1933 | 3.4781 | 0.0037 | 0.5620 | 63.21 |
| Xaccess | 9.9540 | 5.1916 | 1.9173 | 0.0758 | 0.2010 | 22.61 |
| Xutilities | −3.8256 | 2.8933 | −1.3222 | 0.2072 | 0.0672 | 7.56 |
| Xshape | −4.2461 | 4.4158 | −0.9616 | 0.3526 | 0.0382 | 4.30 |
| Xnumber | −12.5049 | 18.7966 | −0.6653 | 0.5166 | 0.0207 | 2.33 |
| R | 0.7017 | |||||
| Adjusted R2 | 0.4924 |
| Independent Variable | Coefficient b | Sdev. | t-Student | P | Beta | Weight [%] |
|---|---|---|---|---|---|---|
| Const. | −1.3821 | 48.8204 | −0.0283 | 0.9778 | ||
| X’area | 26.6204 | 10.0904 | 2.6382 | 0.0194 | 0.2623 | 28.15 |
| X’access | 10.3894 | 4.7656 | 2.1800 | 0.0468 | 0.2347 | 25.19 |
| X’utilities | −5.1383 | 3.7042 | −1.3871 | 0.1871 | 0.0786 | 8.44 |
| X’shape | 3.1433 | 5.3739 | 0.5849 | 0.5679 | 0.0134 | 1.44 |
| X’number | −21.2665 | 7.8755 | −2.7003 | 0.0172 | 0.3443 | 36.78 |
| R | 0.7148 | |||||
| Adjusted R2 | 0.5110 |
| Non-Linear Model | ||||||
|---|---|---|---|---|---|---|
| Independent Variable | Coefficient | Sdev. | t-Student | P | Upper Confidence Interval | Lower Confidence Interval |
| Xarea | −0.0576 | 0.0234 | −2.4553 | 0.0437 | −0.1128 | −0.0021 |
| Xaccess | −0.0538 | 0.0123 | −4.3487 | 0.0033 | −0.0831 | −0.0245 |
| Xutilities | −0.0146 | 0.0082 | −1.7698 | 0.1200 | −0.0341 | 0.0049 |
| Xshape | 0.0461 | 0.0193 | 2.3911 | 0.0480 | 0.0005 | 0.0916 |
| Xnumber | 0.1111 | 0.0282 | 3.9337 | 0.0056 | 0.0443 | 0.1779 |
| R | 0.9861 | |||||
| Alpha | 0.050 | |||||
© 2020 by the authors. Licensee MDPI, Basel, Switzerland. This article is an open access article distributed under the terms and conditions of the Creative Commons Attribution (CC BY) license (http://creativecommons.org/licenses/by/4.0/).
Share and Cite
Kocur-Bera, K.; Pszenny, A. Conversion of Agricultural Land for Urbanization Purposes: A Case Study of the Suburbs of the Capital of Warmia and Mazury, Poland. Remote Sens. 2020, 12, 2325. https://doi.org/10.3390/rs12142325
Kocur-Bera K, Pszenny A. Conversion of Agricultural Land for Urbanization Purposes: A Case Study of the Suburbs of the Capital of Warmia and Mazury, Poland. Remote Sensing. 2020; 12(14):2325. https://doi.org/10.3390/rs12142325
Chicago/Turabian StyleKocur-Bera, Katarzyna, and Adrian Pszenny. 2020. "Conversion of Agricultural Land for Urbanization Purposes: A Case Study of the Suburbs of the Capital of Warmia and Mazury, Poland" Remote Sensing 12, no. 14: 2325. https://doi.org/10.3390/rs12142325