Article

Is Radar Phase Information Useful for Sea Ice Detection in the Marginal Ice Zone?

1
School of Marine Sciences, Nanjing University of Information Science and Technology, Nanjing 210044, China
2
Bedford Institute of Oceanography, Dartmouth, NS B2Y 4A2, Canada
*
Author to whom correspondence should be addressed.
Remote Sens. 2020, 12(11), 1847; https://doi.org/10.3390/rs12111847
Submission received: 23 March 2020 / Revised: 1 June 2020 / Accepted: 2 June 2020 / Published: 8 June 2020
(This article belongs to the Special Issue Polar Sea Ice: Detection, Monitoring and Modeling)

Abstract

:
With continuing sea ice reductions in the Arctic, dynamic physical and ecological processes have more active roles compared to the ice-locked, isolated Arctic Ocean of previous decades. To better understand these changes, observations of high-resolution sea ice conditions are needed. Remote sensing is a useful tool for observations in the harsh Arctic environment. For unsupervised ice detection, we demonstrate the promising value of radar phase difference from polarimetric radar measurements in this study, based on full polarimetric complex RADARSAT-2 SAR images in the marginal ice zone. It is demonstrated that the phase difference from co-polarized and cross-polarized synthetic aperture radar (SAR) images show promising capability for high resolution sea ice discrimination from open water. In particular, the phase difference shows superior potential for the detection of frazil ice compared to the traditional methodology based on the radar intensity ratio. The relationship between phase difference and radar incidence angle is also analyzed, as well as the potential influence of high sea state. The new methodology provides an additional tool for ice detection. In order to make the best use of this tool, directions for further studies are discussed for operational ice detection and possible ice classification.

Graphical Abstract

1. Introduction

In the Arctic, dramatic ice reductions have taken place during the last few decades as a consequence of global climate change [1]. Motivated by the observed summer sea ice minimum in 2007, one study has projected that Arctic summers might be largely ice-free by the 2030s [2]. Out of the entire 40-year satellite record, the 13 lowest sea ice extents in September have all occurred in the last 13 years (2007–2019), according to the National Snow and Ice Data Centre (NSIDC). This has strong impacts on local and global ocean systems, as well as associated hydrological, climatic, biological systems, and the cultural and economic structures of society [3].
Besides the general trend in reductions, the sea ice extent in the Arctic also features multi-scale variations, with temporal scales ranging from multi-decadal to seasonal and synoptic scales, and spatial scales ranging from macro to meso- and sub-mesoscales. Some physical and ecological processes can develop almost instantly in response of rapid changes in ice conditions; for example, the penetration of ocean waves into the marginal ice zone [4], plankton blooms in ice leads [5], etc.
With the rapid advance of satellite remote sensing technologies, it is now possible to perform observations with very high spatial resolution, in different frequencies and full polarizations. Compared to optical satellite remote sensing, microwave remote sensing has the capability to penetrate through cloud and rain in both day and night, making it unique for operational applications. Thus, SAR is widely used for ice charting purposes [6].
Retrieval of remotely sensed sea ice information includes (a) forward modeling of the electromagnetic scattering properties of various ice categories, as well as (b) inverse scattering algorithms to reconstruct the physical properties of sea ice from the scattered electromagnetic field data (see reviews [7,8], respectively). Multi-polarization SAR imagery has been found especially useful for enhanced ice classification.
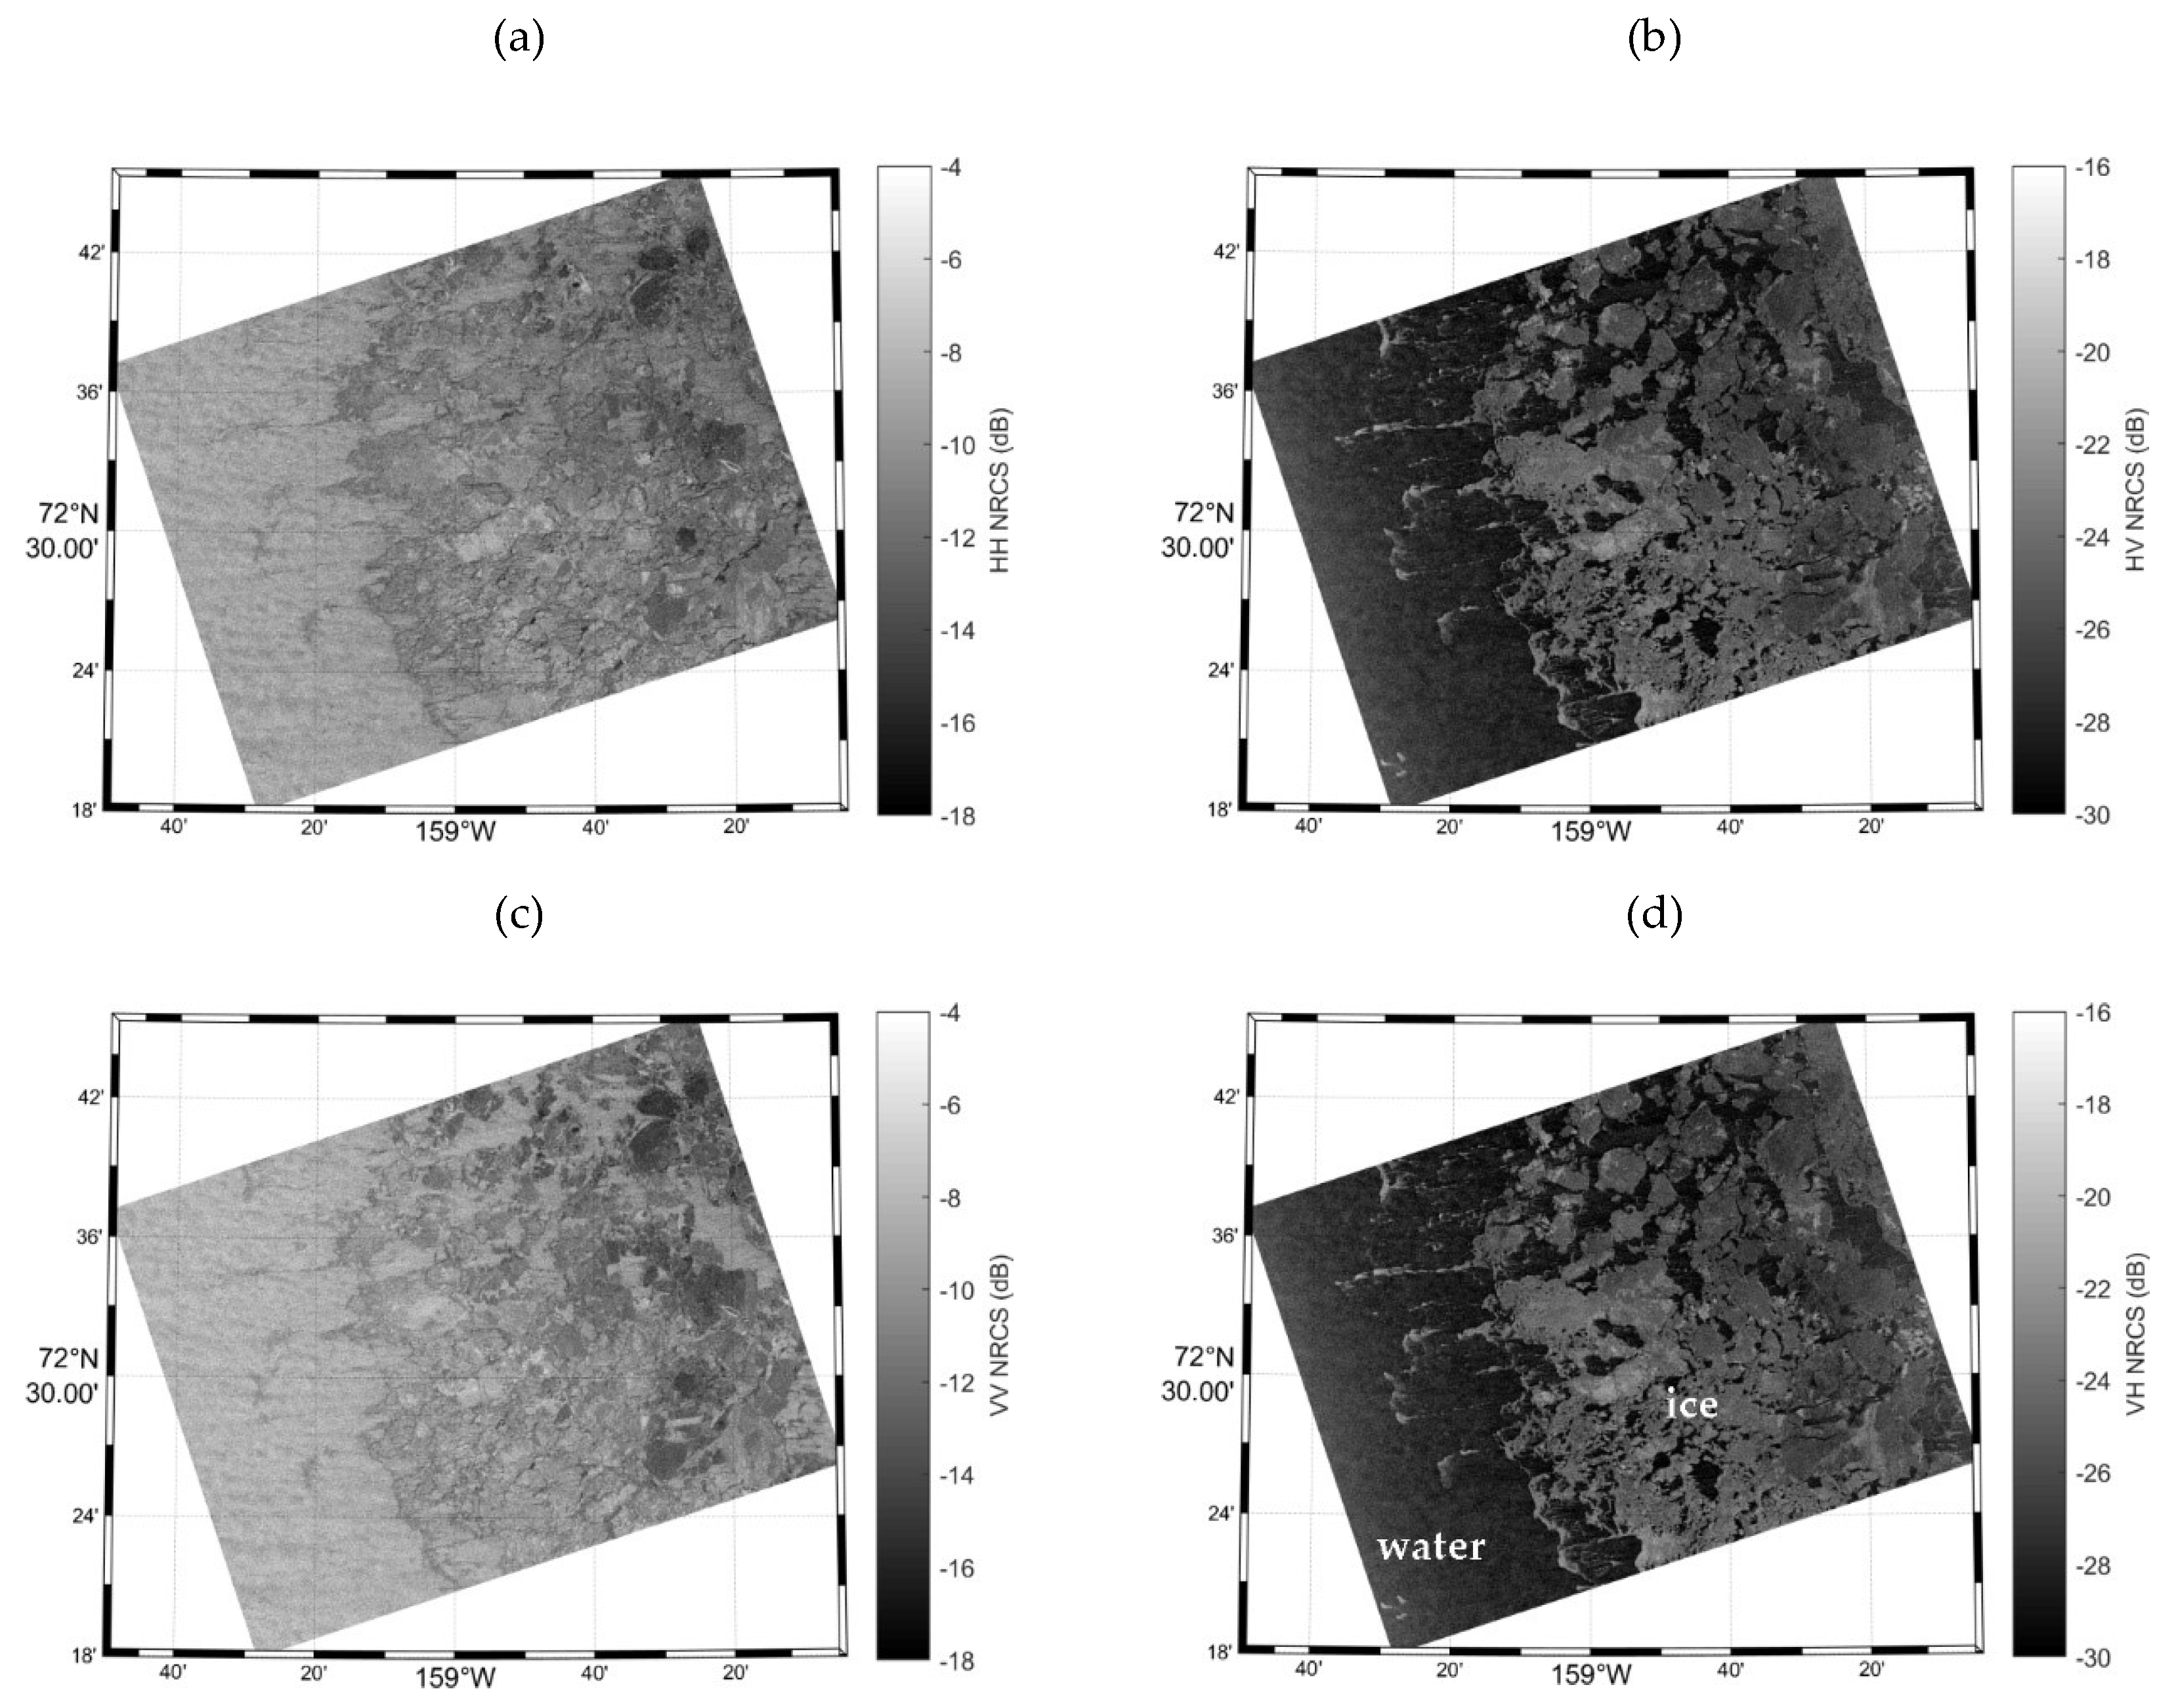
Over water, co-pol and cross-pol have different radar imaging mechanisms, with the Bragg scattering mechanism dominant for co-pol and volume scattering dominant for cross-pol radar backscattered signals from rough sea states. However, over sea ice, the surface scattering and volume scattering mechanisms often contribute significantly to the radar intensities due to the rough shape of ice surface and brine pockets within the ice, resulting in different radar backscattered signals. However, it is still a challenge to assign a universal threshold to segment ice from water based on only a single polarization radar intensity; this is because the radar intensities vary under different instrumental and environmental parameters, for example, ice properties, sea state conditions (wind, waves, etc.), and radar geometry etc. Thus, as has been previously suggested, a manual input consisting of so-called expert knowledge is generally needed for operational applications.
Moreover, a method based on the ratio of co-pol radar intensity is widely used (e.g., Geldsetzer and Yackel (2009) [9]) for enhanced visual discrimination of ice–water separation and ice classification. Note that areas of new ice or nilas have very smooth surfaces resulting in suppressed radar returns; this is a challenging area for ice detection using traditional methods, based on radar intensity [10,11]. While there are many studies on ice–water discrimination using SAR based on radar intensity, no method has been developed based on phase difference.
RADARSAT-2 SAR quad-pol imagery measures full-polarization radar returns (HH, HV, VH, and VV, with the first letter defining radar transmission polarity and the scond, for the receipt polarization, H for Horizontal, V for vertical) of both amplitude and phase. In the past few years, the phase information has gained increased attention in science communities. The phase return has proven useful for target detection—for example, for macroalgae bloom patches [12], icebergs [13], wind farms [14], etc. A concise overview of the potential applications of phase information to enhance ice detection is given by Dierking (2013) [11], where it is suggested that for practical applications, the phase differences between signals of different polarizations are of interest. The early application of radar phase difference information for ice detection dates back to 1991, based on full polarization airborne SAR measurements [15]. However, the concept was not well followed in later studies. A practical reason for this lack of progress is that the SAR instruments onboard the earlier generation of space borne satellites did not record the phase information (e.g., ERS SAR, ENVISAT ASAR, RADARSAT-1, etc.). Moreover, the limited number of previous studies on radar phase information for ice detection have focused on the difference between the HH- and VV-polarized channels only (e.g., references [11,15]).
However, with more satellite missions acquiring radar phase information, like RADARSAT-2, Sentinel-1, and the recent RADARSAT Constellation Mission, it is now important to revisit and investigate the potential value of this variable. With global climate change, large areas of the Arctic may become the effective marginal ice zone for extended periods of the annual cycle, making discrimination of ice and water more complicated. The need may become more urgent with the opening of Arctic navigation routes. In this paper, we further investigate the polarimetric characteristics of sea ice based on modern full polarization satellite SAR data. In particular, our focus is on the potential value of the phase information for ice–water recognition. Our main objective is to draw attention to the usefulness of phase information for scientific investigation and operational applications.
A brief introduction to the data is provided in Section 2. The polarimetric characteristics of sea ice, in the intensity and phase domains, are investigated in Section 3. The application of radar phase information for sea ice detection, together with its dependence on radar incidence angles and possible sea state influence are introduced in Section 4. Discussion and conclusions follow in Section 5 and Section 6.

2. Data

Quad-pol SAR observations from the C band (5.4 GHz) RADARSAT-2 satellite are used as a main data source for this study. The single look complex (SLC) format is required as it preserves the phase information in the processing of the image data, which is the focus of the present study. Overall, there are six swaths or 30 frames of SAR data that were obtained in the marginal ice zone of the Arctic Beaufort Sea and off the east coast of Greenland. The incidence angle of the data ranges from 30° to 50° and the sea states include calm and rough windy conditions. Detailed information regarding the time, location, and incidence angle and wind conditions is given in Table 1.
For RADARSAT-2 SAR quad-pol data, the spatial resolution of the fine mode data is 5.2 m in the radar range direction and 7.6 m in the azimuth (pixel spacing 4.6 m×5.1 m [16]). Each swath is about 25 km wide for fine mode and 50 km for wide fine mode. The fine quad-pol mode RADARSAT-2 SAR data are known for their high radiometric accuracy, which are unique for monitoring low intensity targets and dynamical processes on the ocean surface.
RADARSAT-2 intensity and phase information is processed according to the data manual, with necessary radiometric calibrations [17]. The original pixel resolution data is given a 10 × 10 windows smoothing to suppress speckle noise, for both intensity (normalized radar backscattered cross sections) and phase difference.
The ground truth data for ice conditions were collected during the field cruise of the R/V Sikuliaq during her voyage in the “Sea State and Boundary Layer Physics in the Emerging Arctic Ocean” experiment in the fall of 2015 [18]. Although a huge dataset of SAR images was assembled during the two months cruise from September to November, most data are in ScanSAR mode because of its wide coverage (500 km) in order to provide timely information regarding ice conditions to the R/V Sikuliaq during the cruise. However, phase information is not retained in the ScanSAR data products. On 3 November 2015, two swaths of wide quad-pol images were acquired with the objective of studying the wave-ice conditions and their interactions in the marginal ice zone. During this period, from 2–4 November, the R/V Sikuliaq was mostly cruising within the footprints of the RADARSAT-2 SAR images, making detailed in situ observations of ice conditions and other atmospheric and oceanographic parameters. 
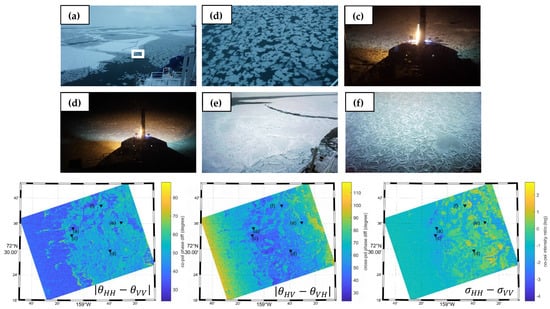
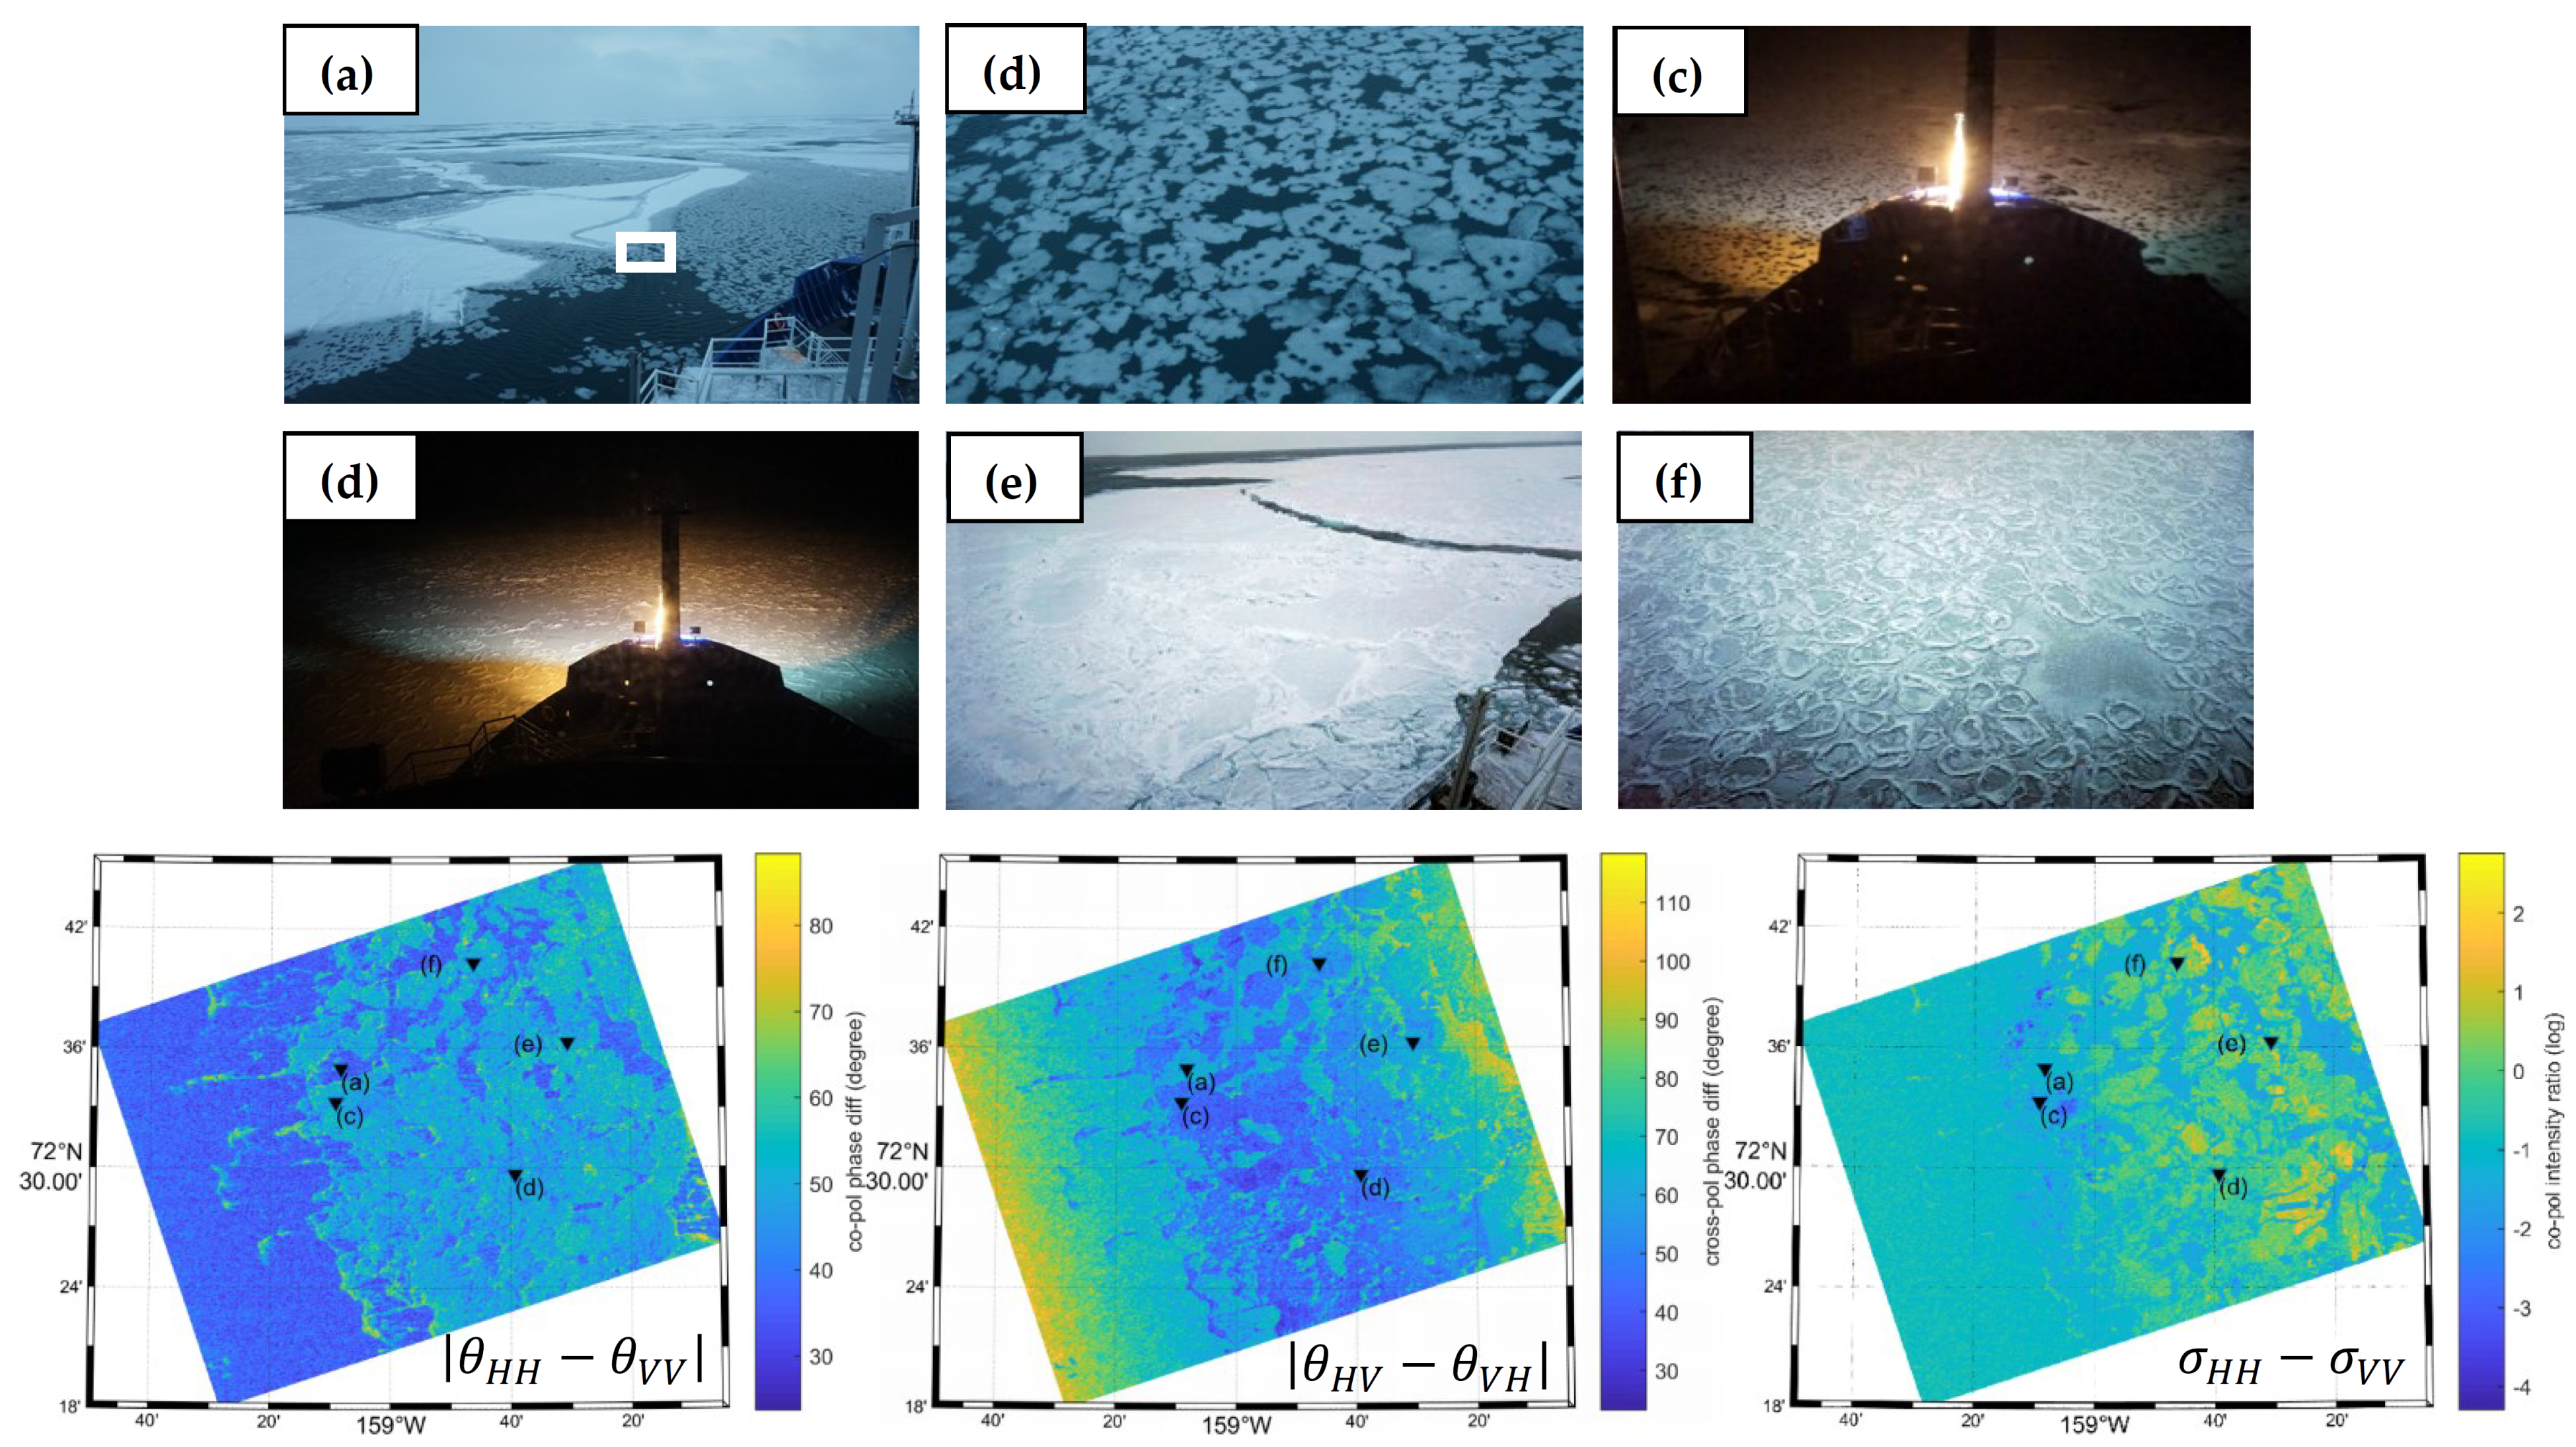
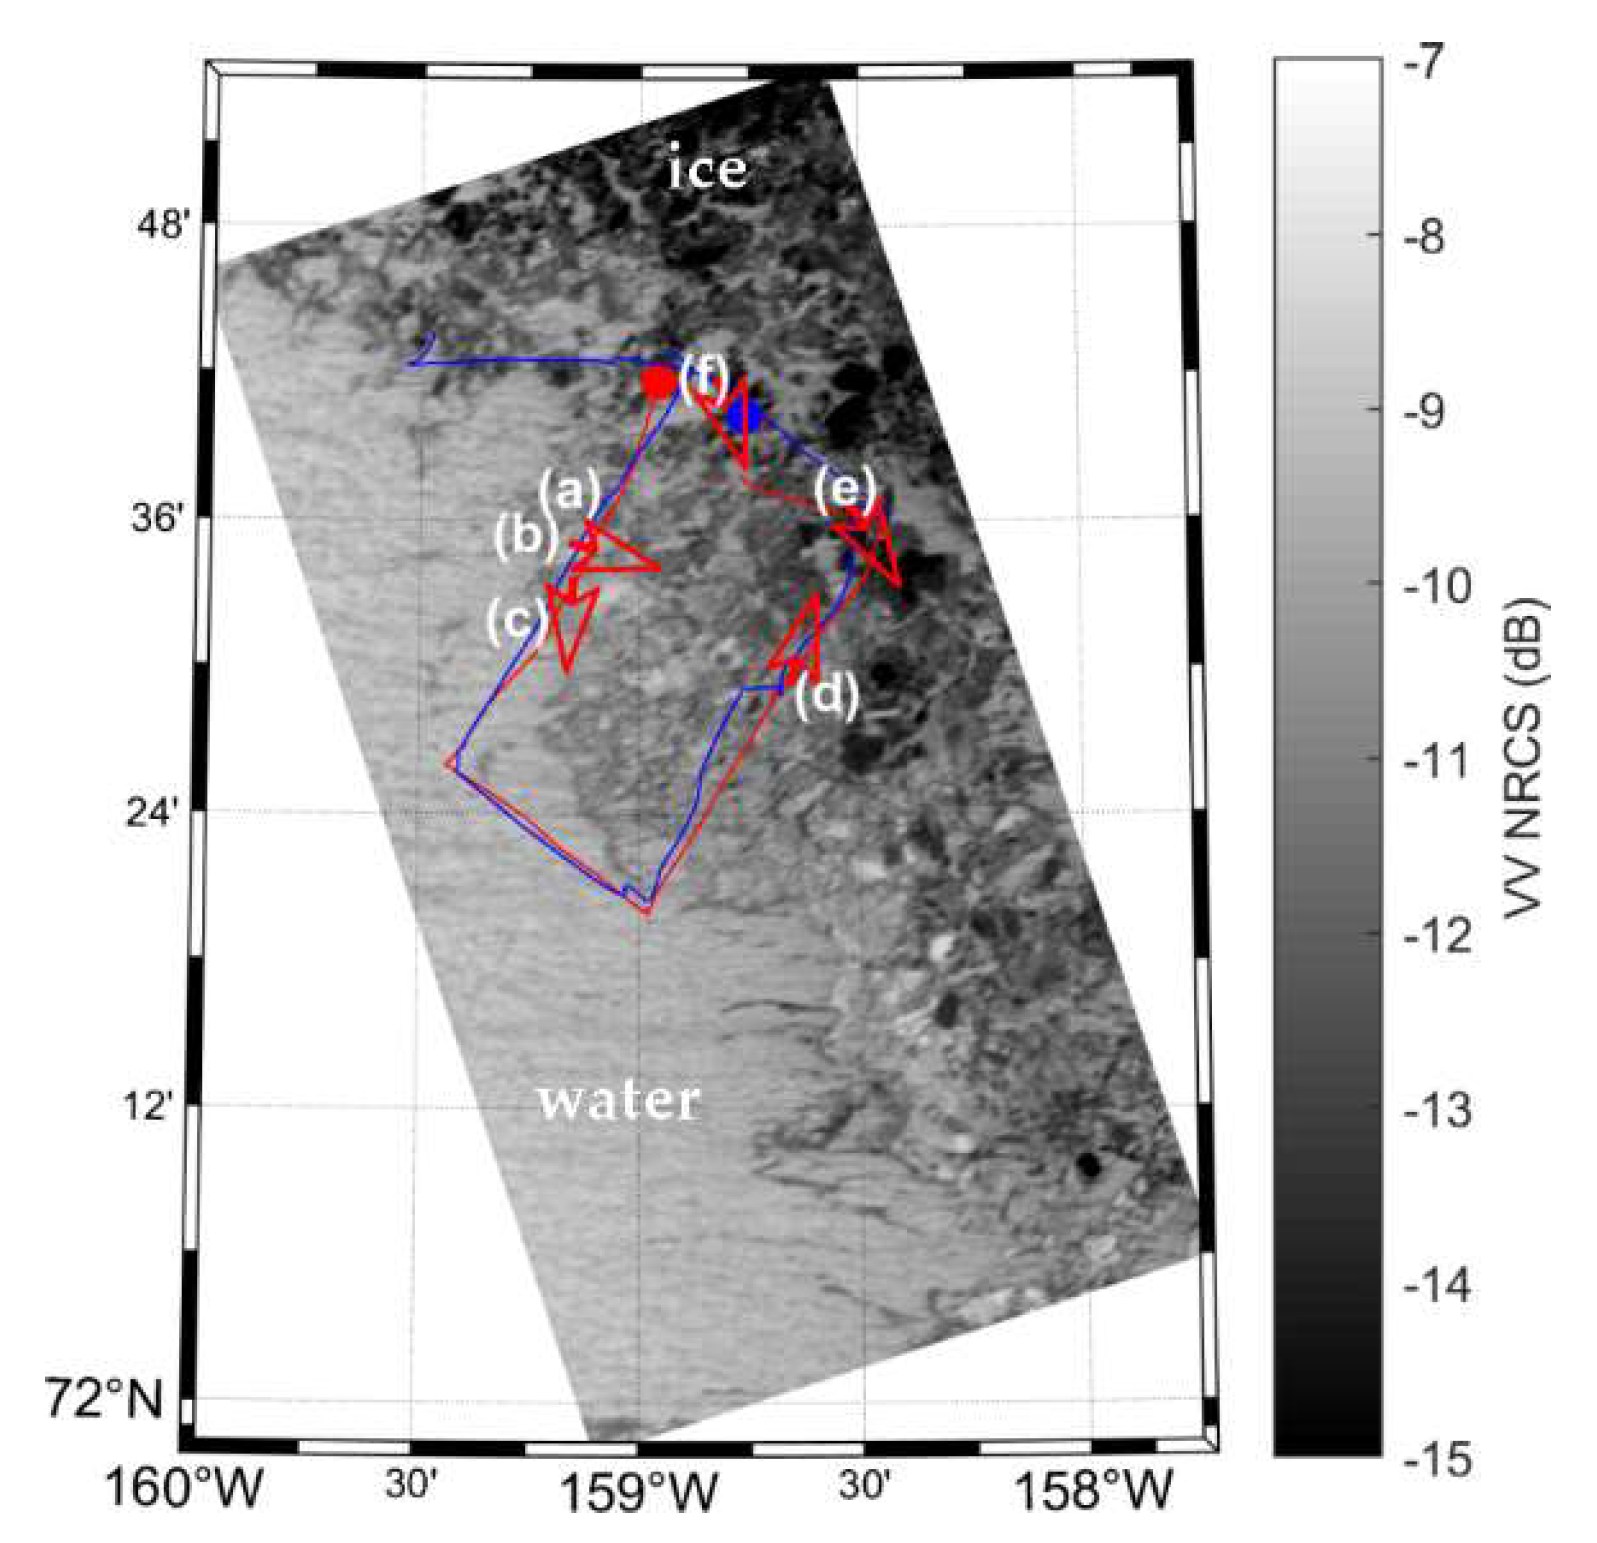
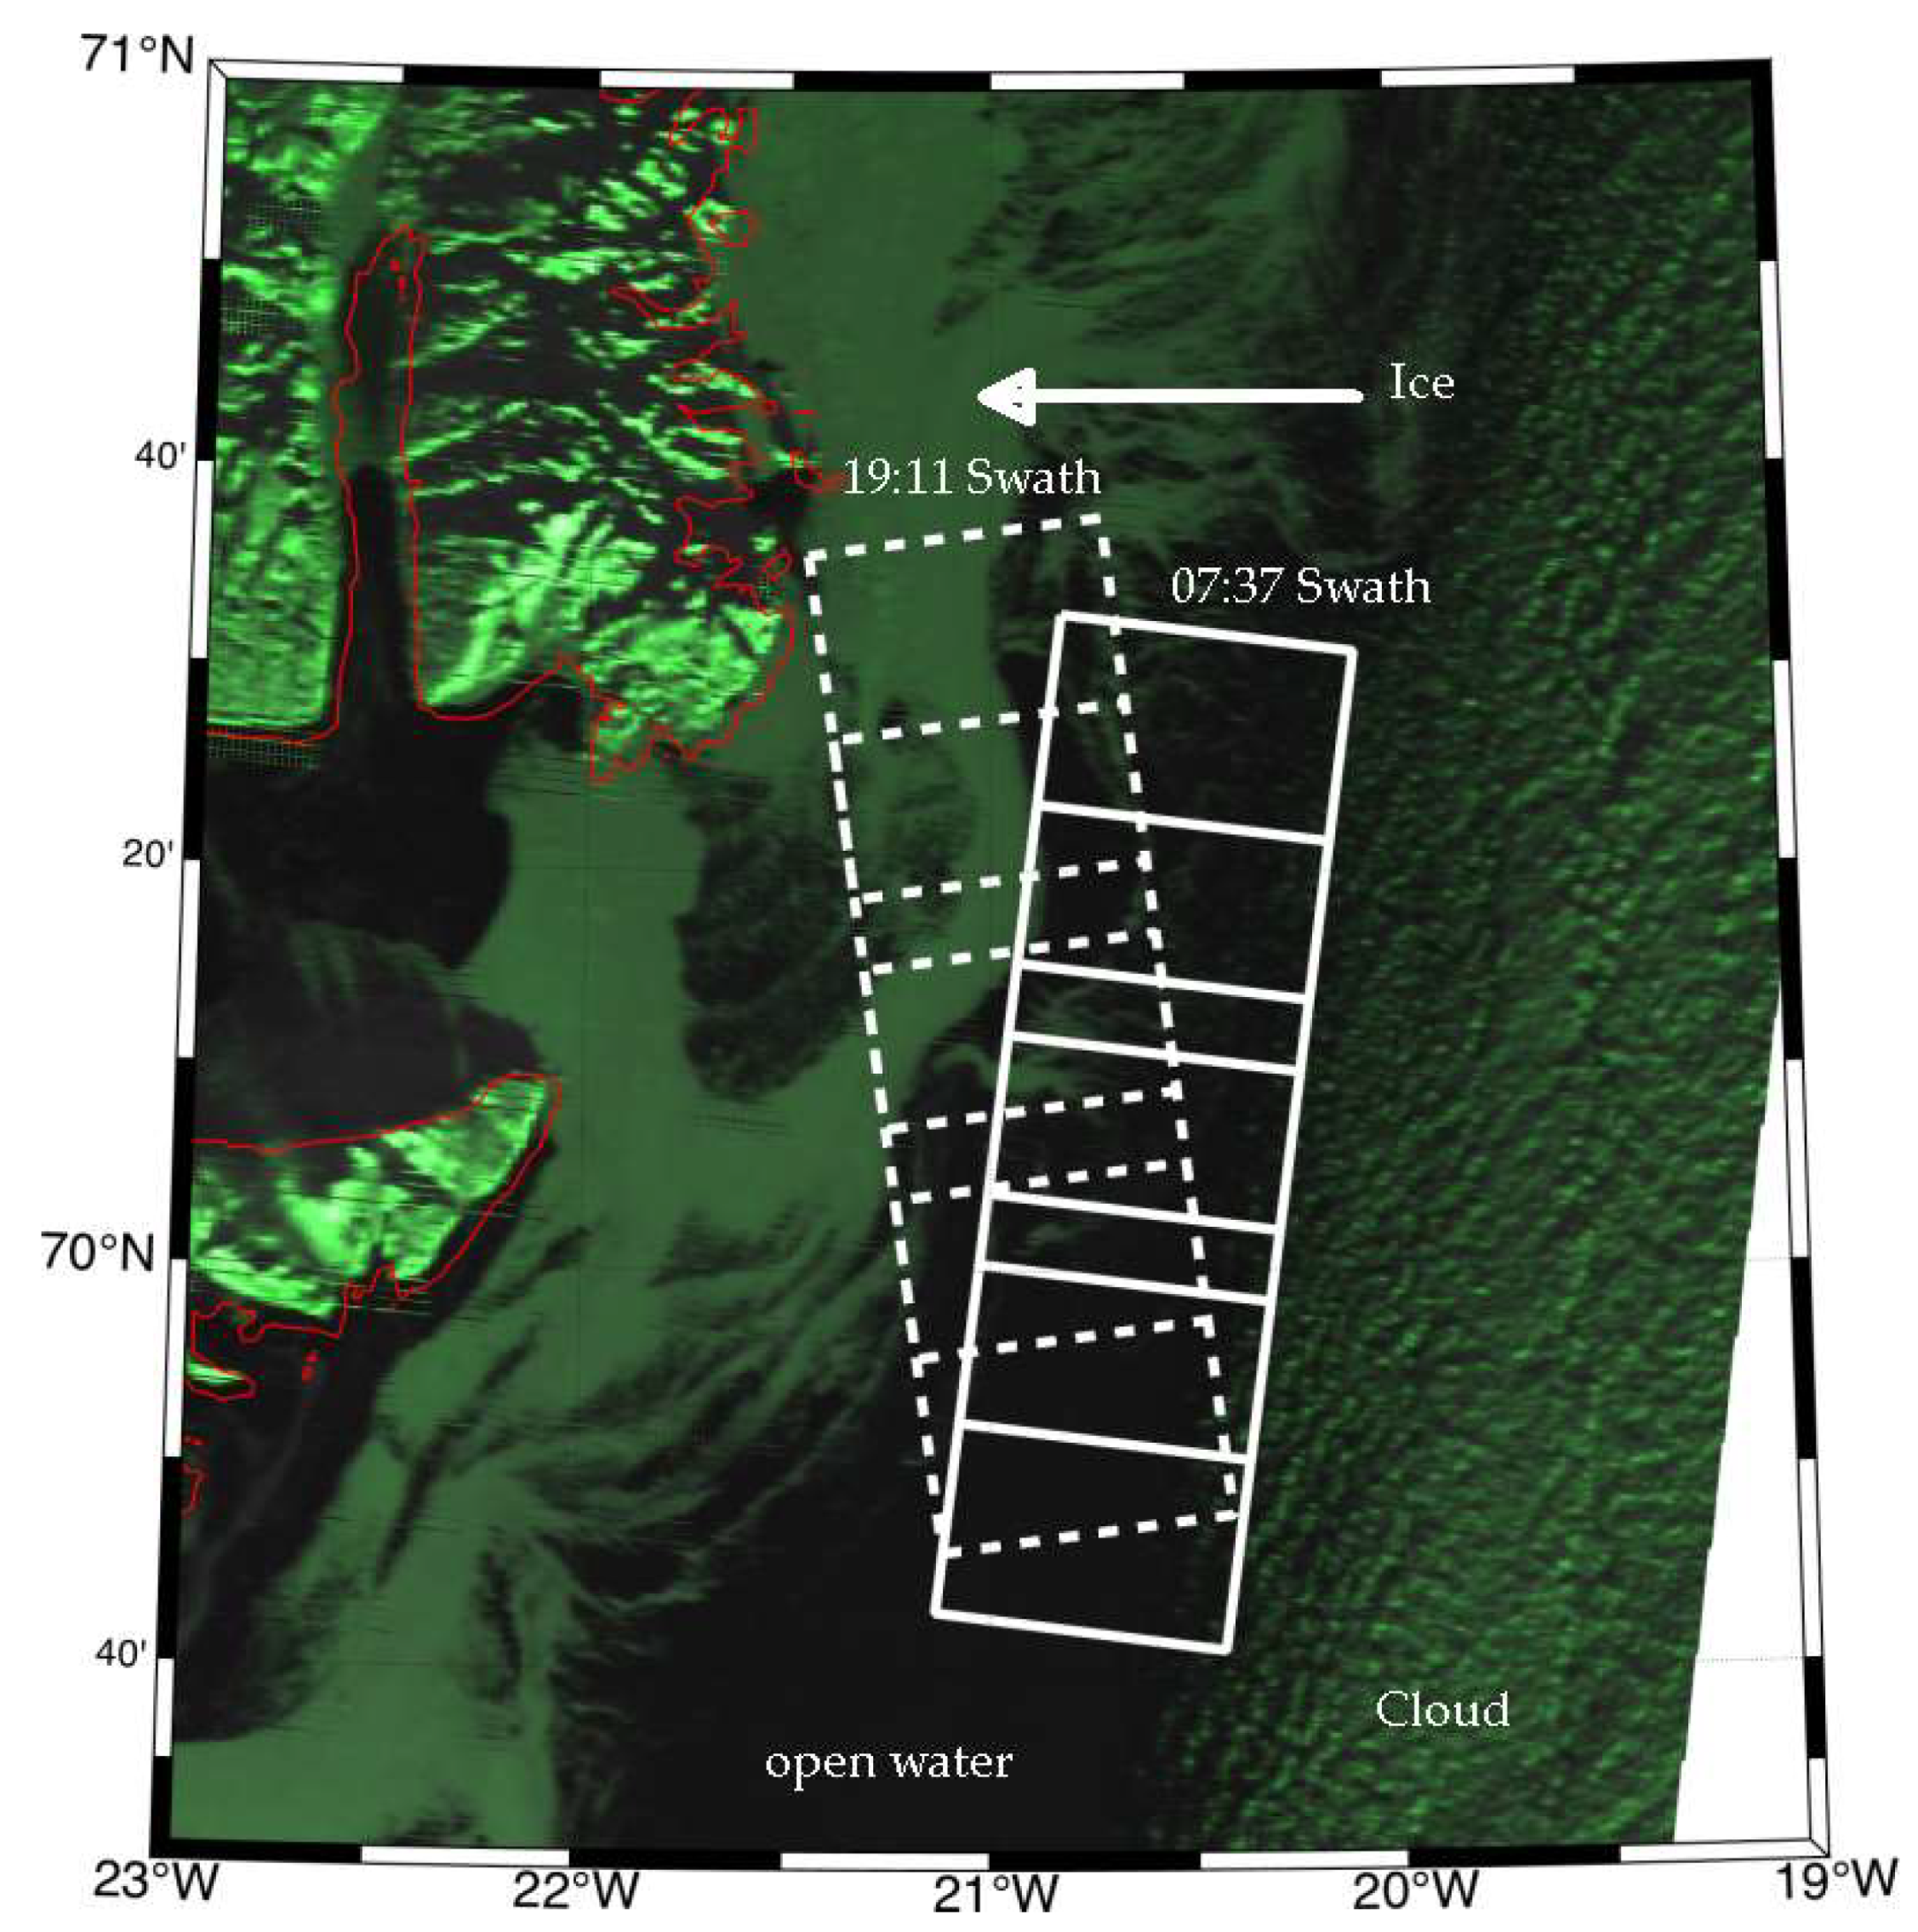
Figure 1 shows a RADARSAT-2 SAR swath obtained at 03:35 Z on 3 November, 2015, overlaid by the R/V Sikuliaq cruise tracks during 2–3 November. Photos taken by scientists onboard the ship clearly recorded the ice conditions along the route. Six photos displayed in Figure 2 show ice categories, including brash/frazil ice and pancake ice, which are the common main ice categories in the marginal ice zone.
When in situ data are not available, for swaths 5 and 6 shown in Table 1, acquired off the east coast of Greenland, moderate-resolution optical imaging spectrometer (MODIS) images at 250 m resolution were used to confirm that the SAR observations are within the marginal ice zone. The cloud-free MODIS images were processed in false color using two channels of 250 m resolution for enhanced visual interpretation of the sea ice. In the wintertime, the east coast of Greenland is enclosed by ice, extending into the surrounding ocean for several hundreds of kilometers. Although MODIS images have coarser spatial resolution than SAR observations, they are superior in the sense that the multi-frequency radiometric resolutions can give a clear view of the sea ice extent along the east coast of Greenland.
Wind speeds during SAR observation times are from in situ measurements for swaths 1 and 2; winds from ASCAT scatterometer in the vicinity of ice edge are used for all the other swaths.

3. Polarimetric Characteristics of Sea Ice

Full-polarization mode observations include data of the four polarizations, each containing paired information of both intensity and phase. Thus, the complex scatter matrix consists of eight parameters ( S VV ,   S VH ,   S HV ,   S HH , θ VV ,   θ VH ,   θ HV ,   θ HH ), which may be written as
S = [ S HH S HV S VH S VV ]
Various algorithms have been developed to analyze the polarization properties captured by Equation (1) for measuring different ocean surface features, including the well-known radar scattering mechanism decomposition methodologies, such as those of the Pauli, or H-alpha [19].
Each element in the polarimetric scattering matrix (1) can be expressed as
S I J = | S I J | e i θ I J , I = H , V ; J = H , V
where || denotes the modulus of the complex number; S I J and θ I J represent the amplitude and the phase of the complex radar scattered returns, respectively.
The intensity of radar backscattered signals is then defined by Equation (3) as
σ I J = S I J S I J *
where 〈〉 indicates averaging over a neighbourhood of certain pixels. Averaging is often used to suppress speckle noise in SAR observations. In this study, the averaging window is 10 × 10 pixels.

3.1. Intensity Domain

As an example, radar intensities from a RADARSAT-2 SAR quad-pol SAR image at 03:35:50Z on 3 November 2015 are shown in Figure 3. This SAR frame collocates with all the in situ measurements shown in Figure 2. As can be seen from Figure 2, the SAR observation coverage is in the marginal ice zone, with frazil/brash ice (photos a,b,c) extending toward the open water, and pancake ice (photos d,e,f) extending deeper into the ice zone. The pancake ice are packed together forming an ice sheet with some open water intervals. Overall, in the radar intensity figures (Figure 3), in co-pol, most ice patches stand out as darker grayscale features, and in cross-pol images, brighter features show up in ice covered areas. Over ice, the intensity of radar backscattered signals from co-pol SAR is much stronger than that of cross-pol SAR. However, cross-pol SAR intensity data more clearly shows ice-water differences as compared to co-pol SAR measurements (Figure 3c,d), due mostly to the suppressed radar intensities over the water.
An intensity ratio index is widely used to aid ice classification and ice thickness estimation [e.g., [9,20] and references therein]. This index is based on the co-pol SAR backscattered signals over ice and can be quantified by the difference in intensity returns from HH and VV polarizations in logarithmic scale, e.g.,   σ H H σ V V   σ H H σ V V , which equals the intensity ratio σHH/σVV in linear scale. As shown in Figure 3, over the water, VV radar returns are generally higher than HH returns. However, over ice, HH is often stronger. Therefore, in the logarithmic scale, the co-pol intensity difference   σ H H σ V V is generally positive over ice and negative over the water. These characteristics have been widely used to develop automatic ice–water recognition methods [21].
Figure 4a shows the co-pol intensity ratio for ice-water discrimination. Generally, it is clear that the index returns positive values over ice and negative values over water. For this case, the packed pancake ice areas (indicated by labels e,d,f) are shown by positive index values. However, ice in areas indicated by (a,c) returns strongly negative index values, indicating open water conditions with strong Bragg scattering. This suggests the failure of the co-pol intensity ratio index in frazil/brash ice, which has long been known [e.g., [11] ]. A histogram of the co-pol intensity ratio index (Figure 4b) confirms the overlapping distributions of the index values, with only one peak that is identifiable. The influence of such overlapping distributions on the performance of ice segmentation will be further discussed in Section 5.

3.2. Phase Domain

By itself, the phase information for a given pixel does not have meaning related to the target, as it is simply a phase difference of the transmitting and receiving radar waves. However, the phase difference between different polarization channels can contain valuable information to reveal the characteristics of the targets. In terms of ice or ocean features, Figure 4c,e shows the absolute phase differences between co-pol images ( | θ H H θ V V | ), and between cross-pol images ( | θ H V θ V H | ), which both clearly exhibit the features of sea ice. The extent of the ice, from phase difference values, is visually consistent to that from the intensity data shown in Figure 3. This is the first study that has reported the application of the phase differences between cross-pol radar measurements as containing useful information for ice detection. We have also investigated the phase differences between co-pol and cross-pol images, including ( θ H V and θ H H ) and ( θ V V and θ V H ), but they do not show meaningful features that can be related to sea ice in the SAR images; this result is consistent with previous studies described in the literature (e.g., Dierking (2013) [11], figures not shown).
The co-pol phase differences shown in Figure 4c suggest stronger phase differences over ice and smaller differences over water. The histogram of the co-pol phase difference distribution is a bimodal Gaussian distribution, with peak values (Gaussian mean) at 36.45° and 49.95° respectively. The ~14° phase difference makes the ice-water interface stand out clearly. The ice areas observed from in situ observations are all recognizable in Figure 4c.
Similar to the co-pol phase differences, the cross-pol phase difference values shown in Figure 4e also clearly suggest the difference between ice and water, but with smaller phase differences over ice and larger differences over water. The histogram of the cross-pol phase difference distribution is also clearly a bimodal Gaussian distribution, with peak values (Gaussian mean) at 46.3° and 66.9°, respectively. The ~20° phase difference makes the ice-water interface stand out clearly. The ice areas seen from in situ observations are all recognizable as well in Figure 3e. Note that at the edge of the swath, the cross-pol phase difference suffers contamination, which is likely from thermal noise within the radar instrument. The influence of thermal noise from cross-pol radar intensity at the edge of the swath is known and may be removed, based on the radar noise reference value [22]. However, this is the first time that it is reported that such thermal noise can also influence the phase information of the radar signal. A designated noise removal scheme is needed to use the full swath of the cross-pol data. For this study, we simply discard measurements within 12.5 km of the both edges of the swath and keep the remaining 25 km data within the center of the swath.

4. Ice–Water Discrimination

4.1. The Case with In Situ Observations

Based on the different behaviors of phase differences over ice, as compared to over water, it is feasible to apply this information to ice-water discrimination. Figure 4d,f shows bi-modal distributions of radar phase differences. We use the phase difference value where the two Gaussian-like distributions meet as the threshold value to separate ice and water. Figure 5 shows the ice recognition results from co-pol and cross-pol phase difference values. In situ observations along the track of the R/V Sikuliaq confirm that the ice and water covered areas are captured very well from both the co-pol phase differences and the cross-pol phase differences. Different ice areas covered by the thin frazil/brash ice (indicated by labels a,c) and pancake ice (labels d,e,f) are all revealed successfully. It is promising that a simple application of phase difference values can reveal the ice areas clearly.
For comparison, the results for ice recognition using the conventional ice-water recognition methodology, based on the intensity ratio (   σ H H σ V V ,   l o g a r i t h m i c   s c a l e ) are also shown in Figure 5c. For this case, the intensity ratio approach can successfully reveal the ice areas for pancake ice (labels d,e,f). However, ice in areas (a,c) is not shown. The detection of thin ice has been a known challenge for methodologies based on intensity. However, the performance of phase difference data to identify these types of ice is encouraging.

4.2. Ice Detection under Different Incidence Angles

The results shown in Section 4.1 suggest that application of phase difference information has promising capability for ice-water discrimination. The example corresponds to a radar incidence angle of 30 degrees. Figure 6 shows an analysis of the relationships between radar incidence angles and phase difference over ice and water. A threshold value is assigned when the histogram of the radar images exhibits a clearly bimodal distribution (six cases for co-pol, nine cases for cross-pol phase differences, and 16 cases for intensity ratio), as shown in Figure 4d,f. The phase difference exhibits an overall increasing trend with incidence angle, both over water and over ice. Therefore, the threshold to distinguish ice from water also increases with incidence angle. However, the capability for ice-water discrimination remains fairly steady, which suggests the possible capability of using phase differences over the full range of incidence angles for SAR measurements. The difference between ice and water is about 10–20 degrees, and this difference remains almost consistently the same, within the data used in this study.
The relationship between incidence angle and co-pol intensity ratio is also shown in Figure 6c. The data suggests more complex, not yet revealed, characteristics in terms of the relationship between the co-pol intensity ratio index and the radar incidence angle. There are also variations in the ice-water differences of the intensity ratio. Despite of these variations, the polarization ratio does show a clear difference between water and ice, confirming its applicability for ice-water discrimination in co-pol intensity images.
The data collected on 7 November 2014 off the east coast of Greenland have a very different behavior as compared to other cases, where the intensity ratio abruptly drops. Similar rapid reduction features also exist in the cross-pol phase difference data. The co-pol phase difference does not show a bi-modal histogram distribution pattern, and thus no corresponding data points appear in Figure 6b. The reason for this behavior is not clear. These data correspond to high incidence angles of about ~49°. Detailed analysis indicates that strong waves have propagated into this marginal ice zone during this period [4]. A detailed analysis regarding the potential effect of high sea state conditions on the applicability of the phase difference methodology for ice-water discrimination will be provided in the next section.

4.3. Sea State Influence on Ice–Water Discrimination

During 6–8 November 2014, an intense winter storm passed along the east coast of Greenland, with peak wind speeds of over 40 m/s. The storm generated a strong wave system propagating into the marginal ice zone. Two swaths of RADARSAT-2 SAR were acquired in the early and late hours of 7 November 2014. At the time of the SAR images, the storm center was located to the southeast of the ice edge. A MODIS image on the same day at 12:05 shows the overall sea ice extent (Figure 7). Detailed visual analysis of the high resolution RADARSAT-2 SAR images suggest high waves penetrating deep into the ice. These data provide an unique dataset to investigate the possible influence of sea state on the capability for ice-water discrimination.
According to the wind speed estimates from ASCAT scatterometer data, the local wind over the ice was from northeast to southwest with a speed over 25 m/s during the morning RADARSAT-2 transect at 07:37Z and 15m/s at 19:11Z. Based on the MODIS image, the sea ice coverage in the SAR images varies from being less than 5% in the southern frame, to being about 50% in the northern frame. In SAR images of the morning transect, the apparent footprint features of atmospheric convective rolls are visible (see Figure 8d), caused by the strong winds.
We first compute the phase differences for the two transects, then we assign areas for the ice using the threshold values obtained from the bimodal histogram distribution functions. When a histogram of the SAR frame does not exhibit the bi-modal distribution pattern, which is the case for co-pol phase difference here, the threshold values obtained from the analysis of the incidence angle dependence in Figure 6 are used. By comparison with the MODIS images in Figure 7, the co-pol phase differences show larger values than the threshold values in ice-covered areas, and smaller values over water. To better classify ice from water, we use a binary mask, with 1 representing sea ice and 0 representing water. The results of the segmentation are shown in Figure 8.
The ice-water segmentation results are shown in Figure 8 for the morning transect at 07:37Z, when local wind was about 25 m/s, and the evening transect at 19:11Z, with wind speed of 15 m/s. The co-pol ice index clearly demonstrates ice patterns in both transects, regardless of the different wind conditions. The same procedure was performed to obtain the cross-pol ice index. Although the ice patches are still visually recognizable, the index gives a false ice indication in some of the water areas. The false ice indication is more obvious for the morning swath, when the wind was much stronger than in the evening swath.
Since the wind conditions at the times of the two swaths are different, they provide good opportunities to study the potential effects of environmental conditions (winds, waves) on ice detectability by the proposed indexes. For the evening swath, the wind speed is around 15m/s, and the cross-pol index presents good overall ability for the classification of sea ice from water (Figure 8e,f). The morning swath (07:37) occurred with higher wind speeds of around 25 m/s, and the cross-pol ice index fails to clearly identify ice signatures from the sea ice, because it suffers from contamination due to the strong wind-induced ocean features (Figure 8d,f). The fact that the cross-pol data suffers from contamination in the morning swath likely originates from the higher sensitivity of cross-pol SAR to wave-breaking events. The dominant imaging mechanism for cross-pol radar measurements is volume scattering. Under high wind conditions, higher volume scattering returns result from wave breaking, which reduces the difference between ice and water and generates contamination in the cross-pol ice index due to high sea states. The wave stripes within the ice are visible from RADARSAT-2 SAR images, indicating strong waves (mostly swell) penetrating into the marginal ice zone. The associated processes such as breaking ice, and surface wave splashing, may introduce additional foam and sea spray which can contaminate radar measurements via cross polarizations. In comparison, co-pol is less affected, benefiting from its high signal to noise level and already suppressed Bragg waves in the ice zone.

5. Discussion

Various satellite-based platforms have been introduced for ice monitoring during the past several decades, including altimeters, radiometers, scatterometers, and synthetic aperture radars (SARs) etc. Because of its fine spatial resolution, SAR is an optimal tool for regional- and local-scale ice state measurements [11].
In this paper, we present the polarimetric characteristics of sea ice, with a focus particularly on the value of phase information, based on quad-pol RADARSAT-2 SAR measurements. As suggested in an earlier study [13], the combination of phase information from co-polarization radar measurements improves the performance of sea ice algorithms. Here, we have demonstrated that the combination of cross-polarization phase information can also provide useful information leading to the discrimination of sea ice from the surrounding open water.
It is generally difficult to obtain simultaneous in situ measurements to collocate with remote sensing observations over the ocean. In a field experiment, it takes the ship a long time to cruise across the footprint of the satellite image, and the changing ice conditions tend to complicate the data comparison even more. For the present study, the cruise plan of the ship was carefully designed to continuously navigate within the SAR footprint to make the best collocated measurements. However, as shown by Lund et al. (2018) [23], in their Figures 6d and 12c, the ice drifted along the northwest direction during 1–3 November. In this case, the drifting direction was parallel to the ice edge. Therefore, the ice drift per se does not change the general ice category in the SAR footprint. Quantitatively, for the three locations (a), (b), and (c) where frazil ice was observed, the time differences were, respectively, 3 h 18 min and 6 h 36 min. However, applying the ice drift speed of 0.6 m/s suggested by Lund et al. (2018) [23], the drift would be about 7 km and 14 km along the northwest direction, respectively. Thus, the effect of drift would still be less than one quarter of one frame of the SAR footprint (50 × 50 km), as shown in Figure 4. The ice conditions before and after acquisition of the SAR images on 1–4 November also confirm that the ice conditions are relatively stable during the period of this study in the marginal ice zone (photos not shown). Therefore, the drift displacement of the ice does not change the results or the applicability of the in-situ photos, in terms of comparisons and validation of the study.
In this study, we focus on newly formed ice. The in situ data in the Arctic Beaufort Sea confirms the identity of the ice type in the marginal ice zone. Unfortunately, off the east coast of Greenland, the detailed in situ ice conditions are not available to the authors. First year ice and older ice can drift down along the east coast from Fram Strait from the north. To keep our focus on newly formed ice, we select images along the ice edge for analysis, especially targeting ice that extends from the ice edge into the open ocean water. In the future, we will study the characteristics of phase difference from older ice types, when in situ observations are available.
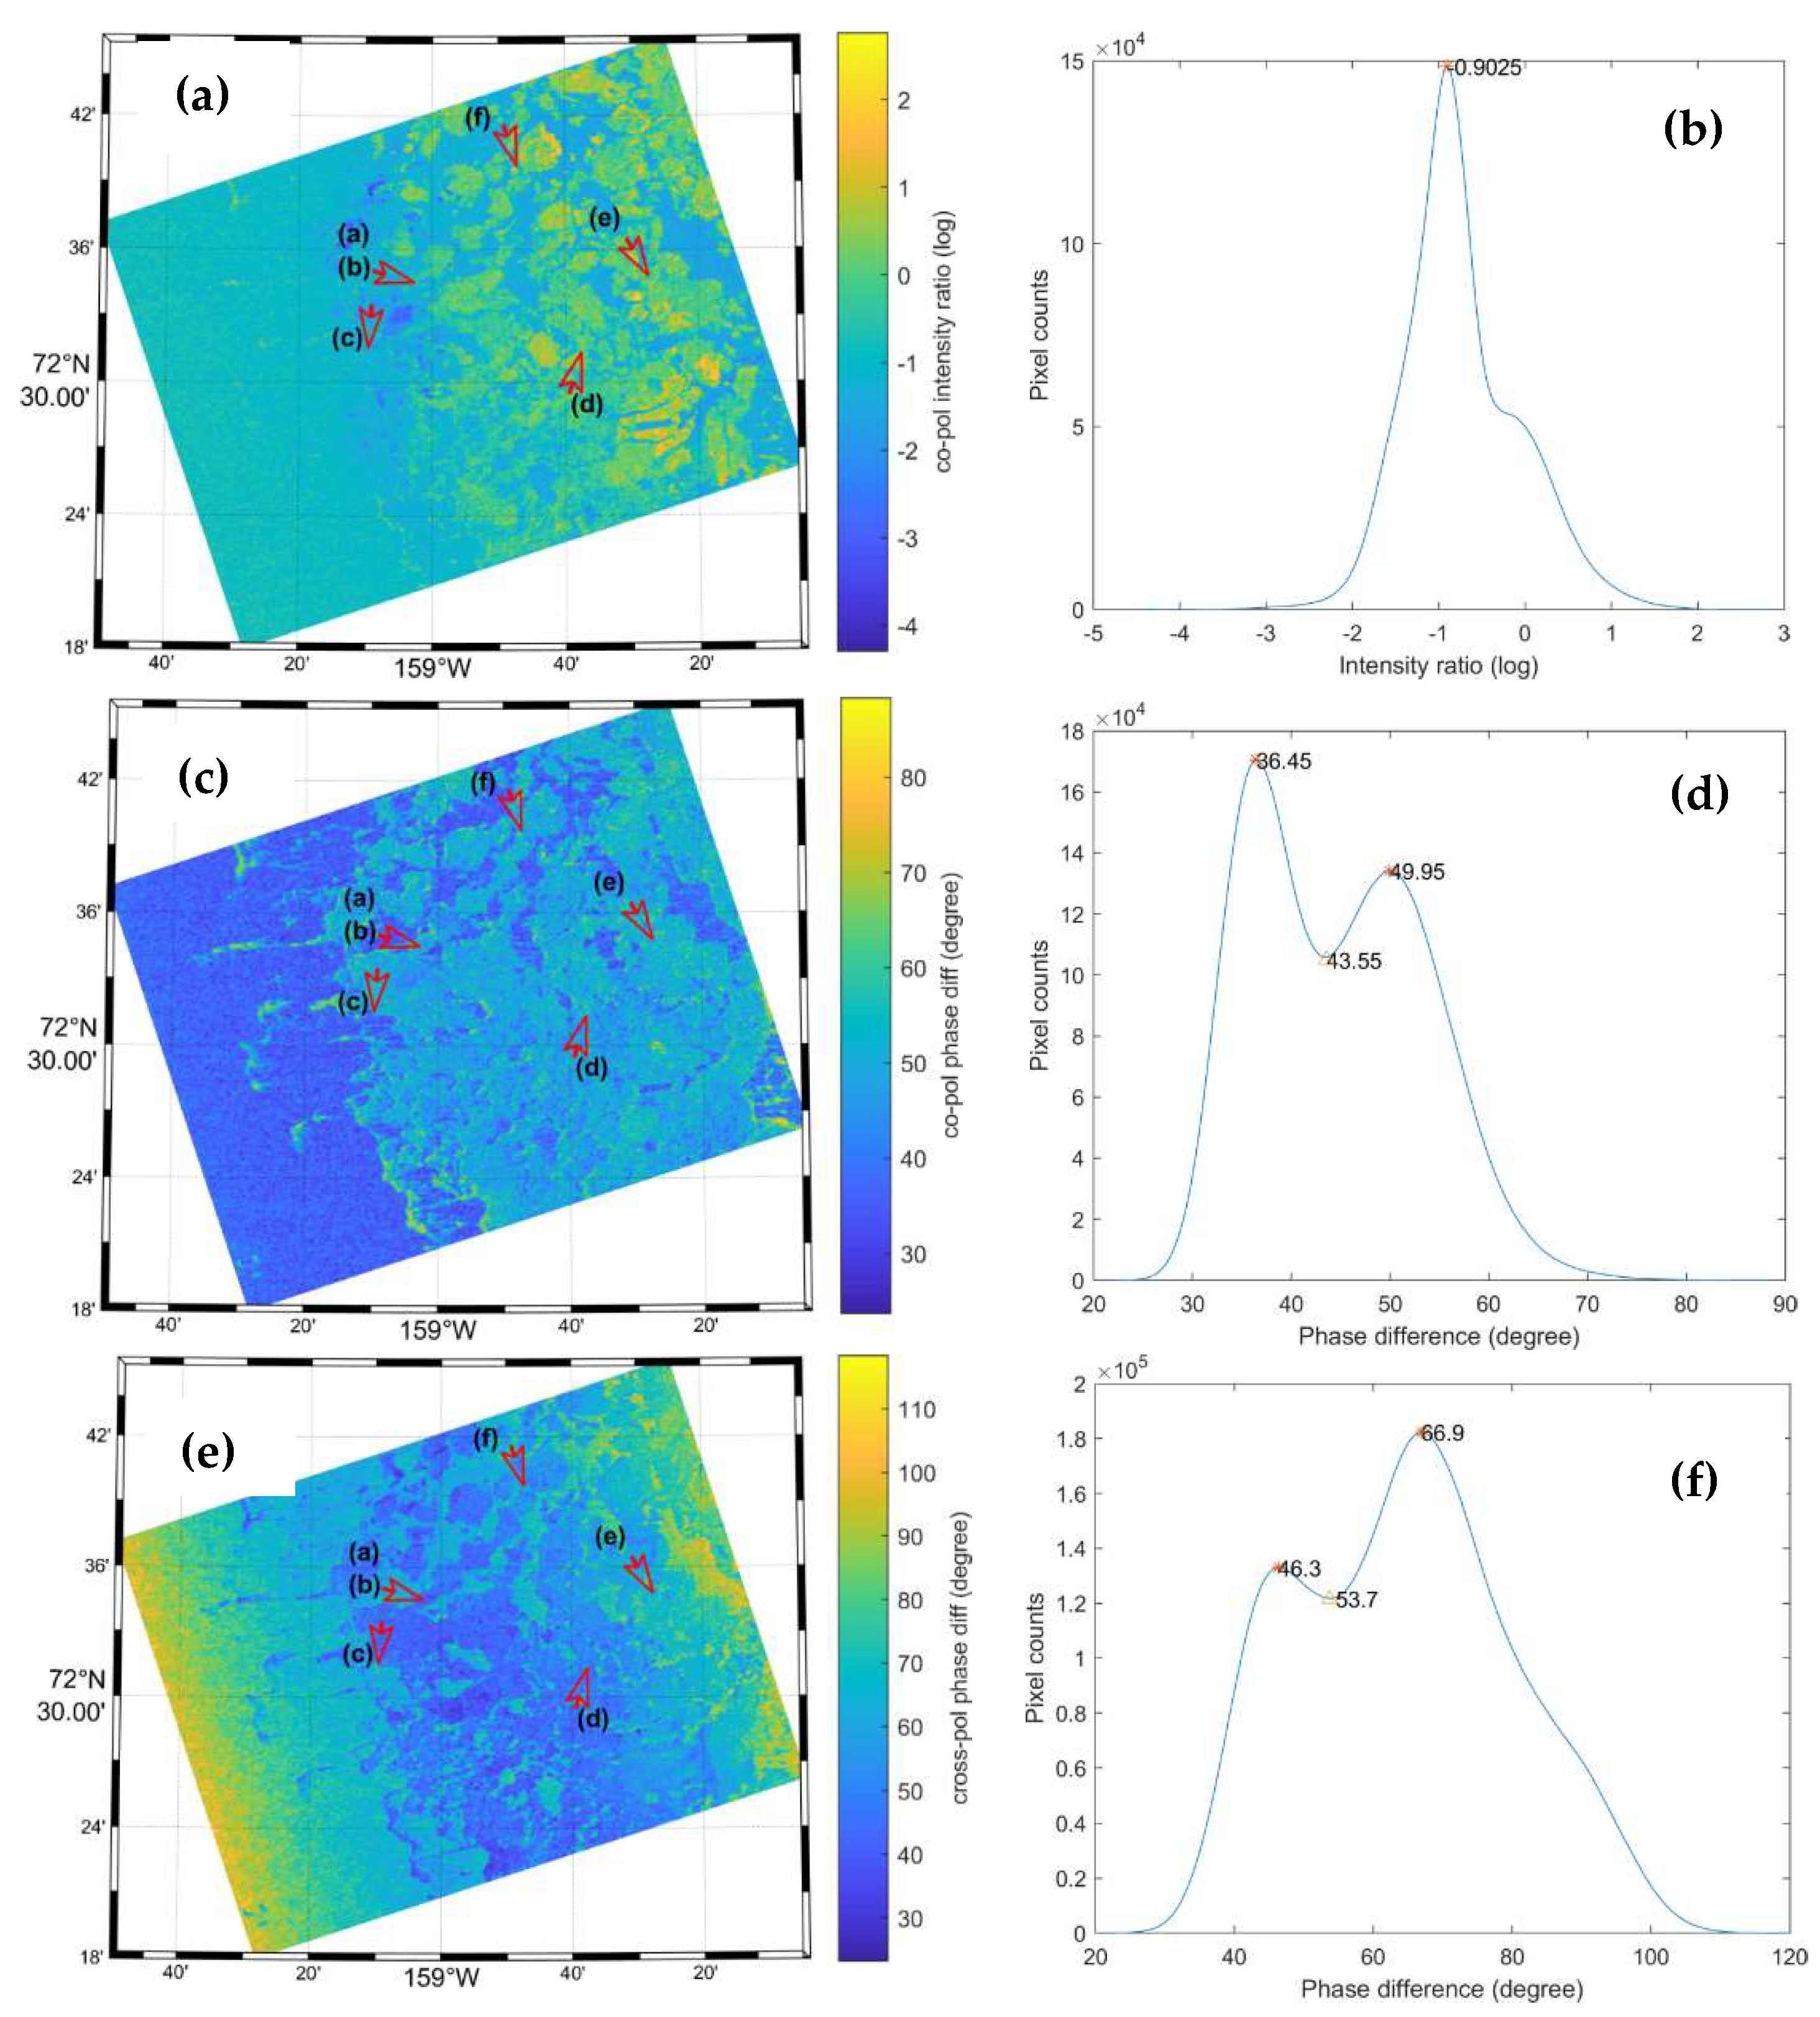
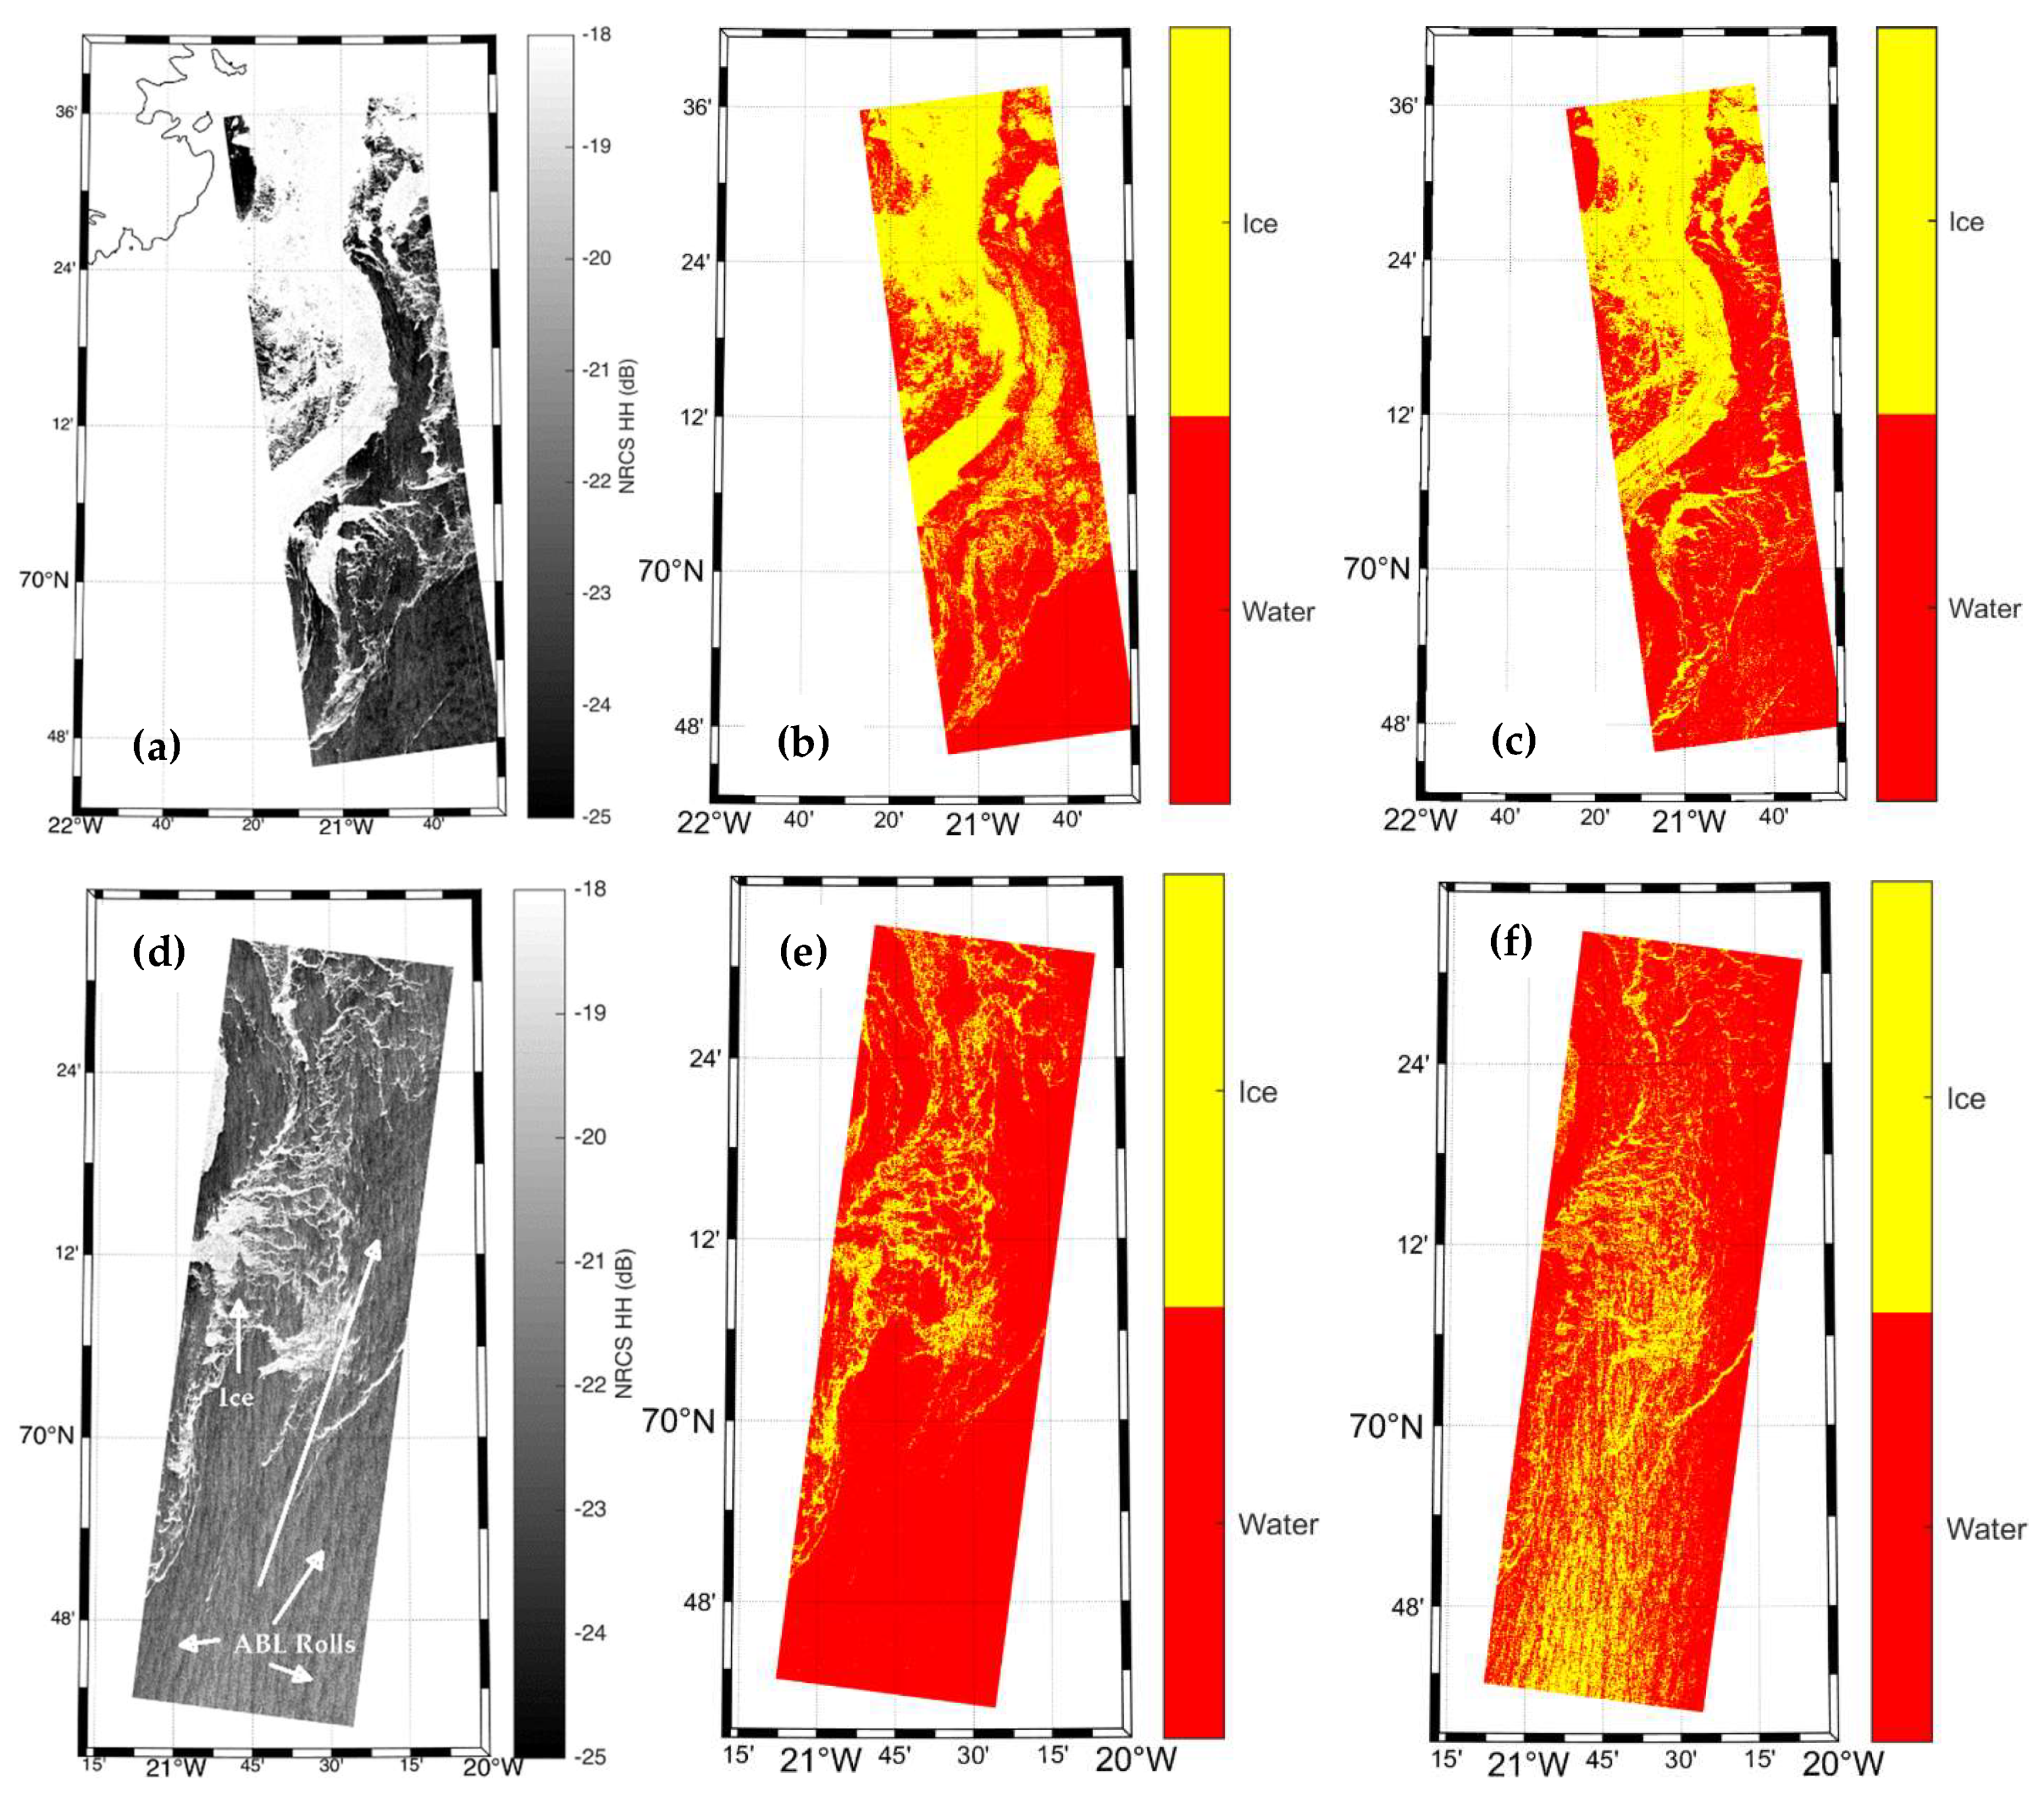
The different distributions of phase difference over sea ice and water suggest the possibility of performing a segmentation from each of these. Such variation in behavior for the phase difference for the ice covered area, as compared to the open water area, suggests that phase difference can be a useful parameter for sea ice detection, as compared to the open water surface. However, the two distributions do overlap, as also suggested in Figure 3. Overlap comes from various factors, for example, ice type, sea state, and noise, all play a role. For ice type, more studies are needed to study the phase difference characteristics under different ice types. For sea state, our preliminary analysis suggests cross-pol phase difference suffers more contamination by high sea state (~25 m/s). In regard to noise, we suggest that this may be resolved by advanced image processing techniques—for example, multi-texture based image processing methods, etc.
The phase differences in radar backscatter from ice originate from the different travel speeds for radar waves with different polarizations; these result from the uniaxial anisotropic distributions of the dielectric constants within the ice. For example, these are associated with needle- or ellipse- shaped brine inclusions in young ice [24]. Such anisotropic ice properties may be related to ice types; newly formed nilas or young ice are more likely to be anisotropic than other types of ice [11]. For first-year ice and multi-year ice, the literature suggests similar phase difference properties [15]. More studies are needed to reveal the characteristics of phase differences over different ice types.
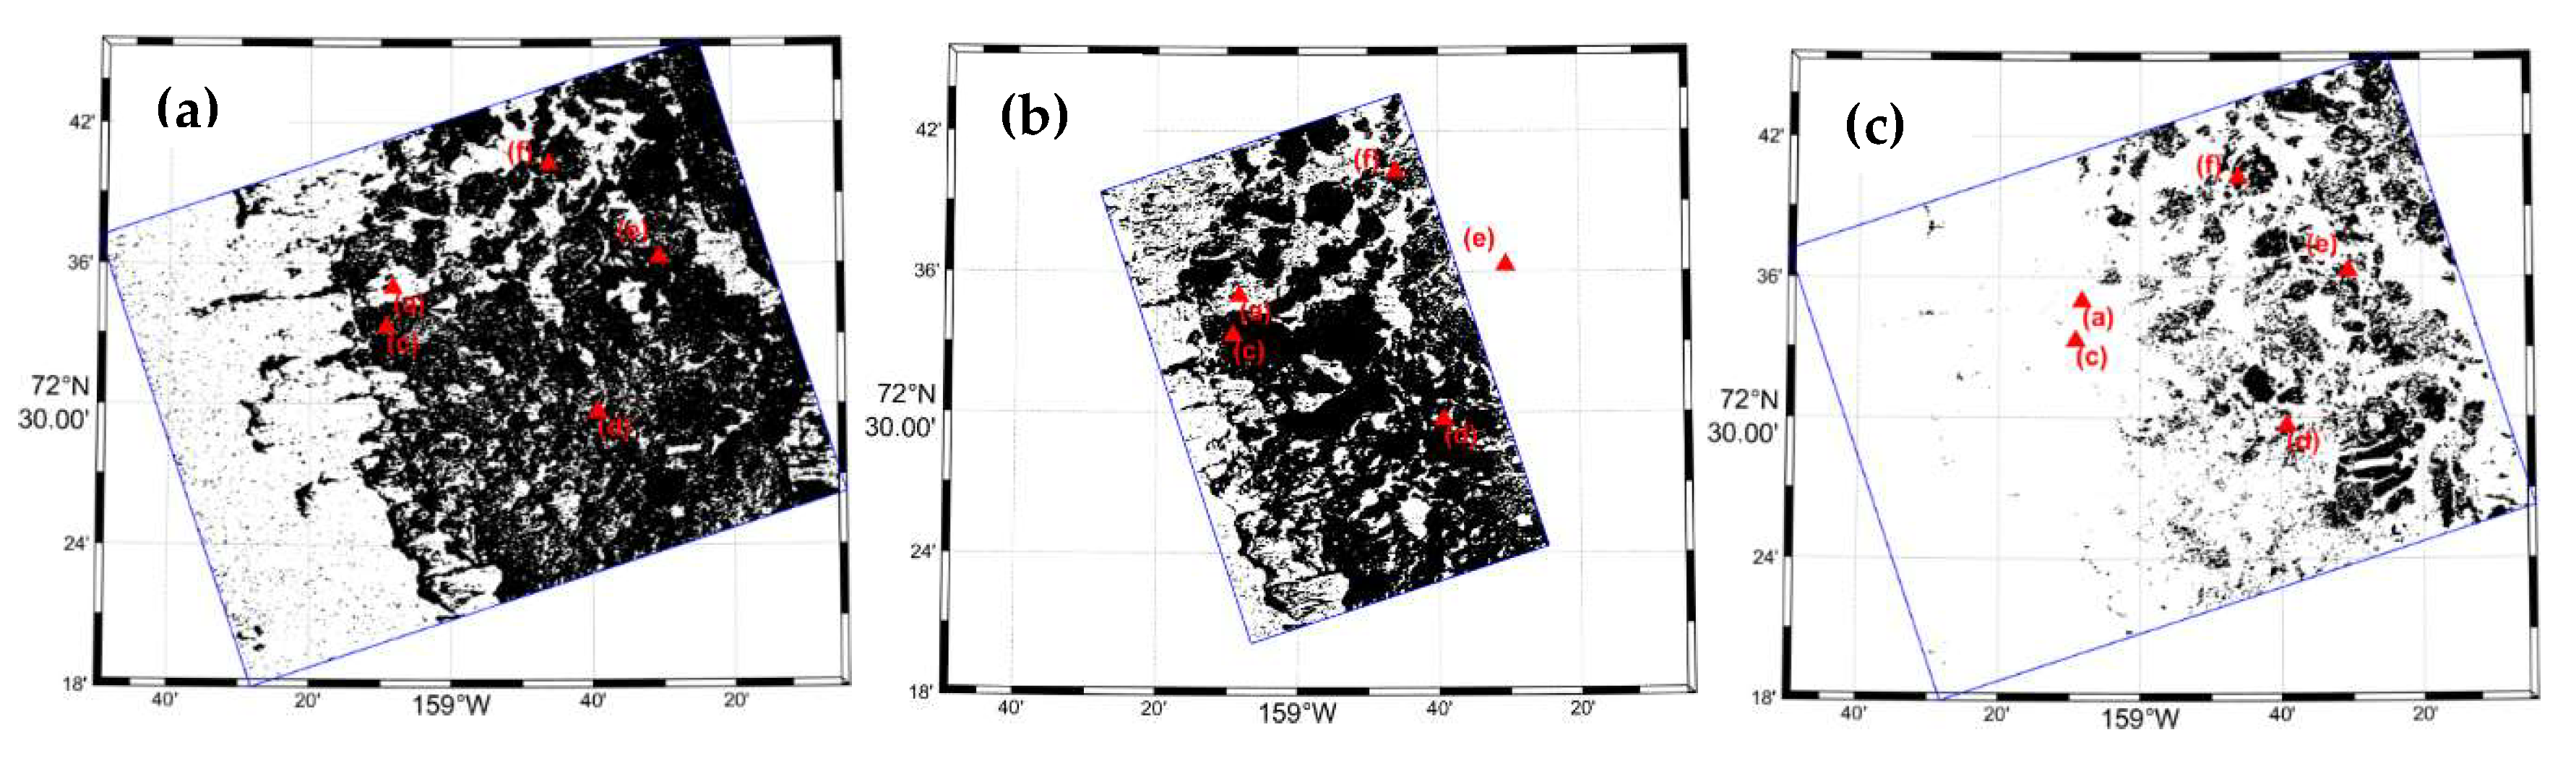
The result that phase differences contain different ice information as compared to the radar intensity ratio suggests a potential contribution for phase difference methodology for ice classification. Compared to the radar intensity ratio, the superior ability of radar phase difference information to detect new frazil/brash ice in the marginal ice zone may be combined with the traditional radar intensity ratio method to classify frazil ice from pancake ice, as demonstrated in 
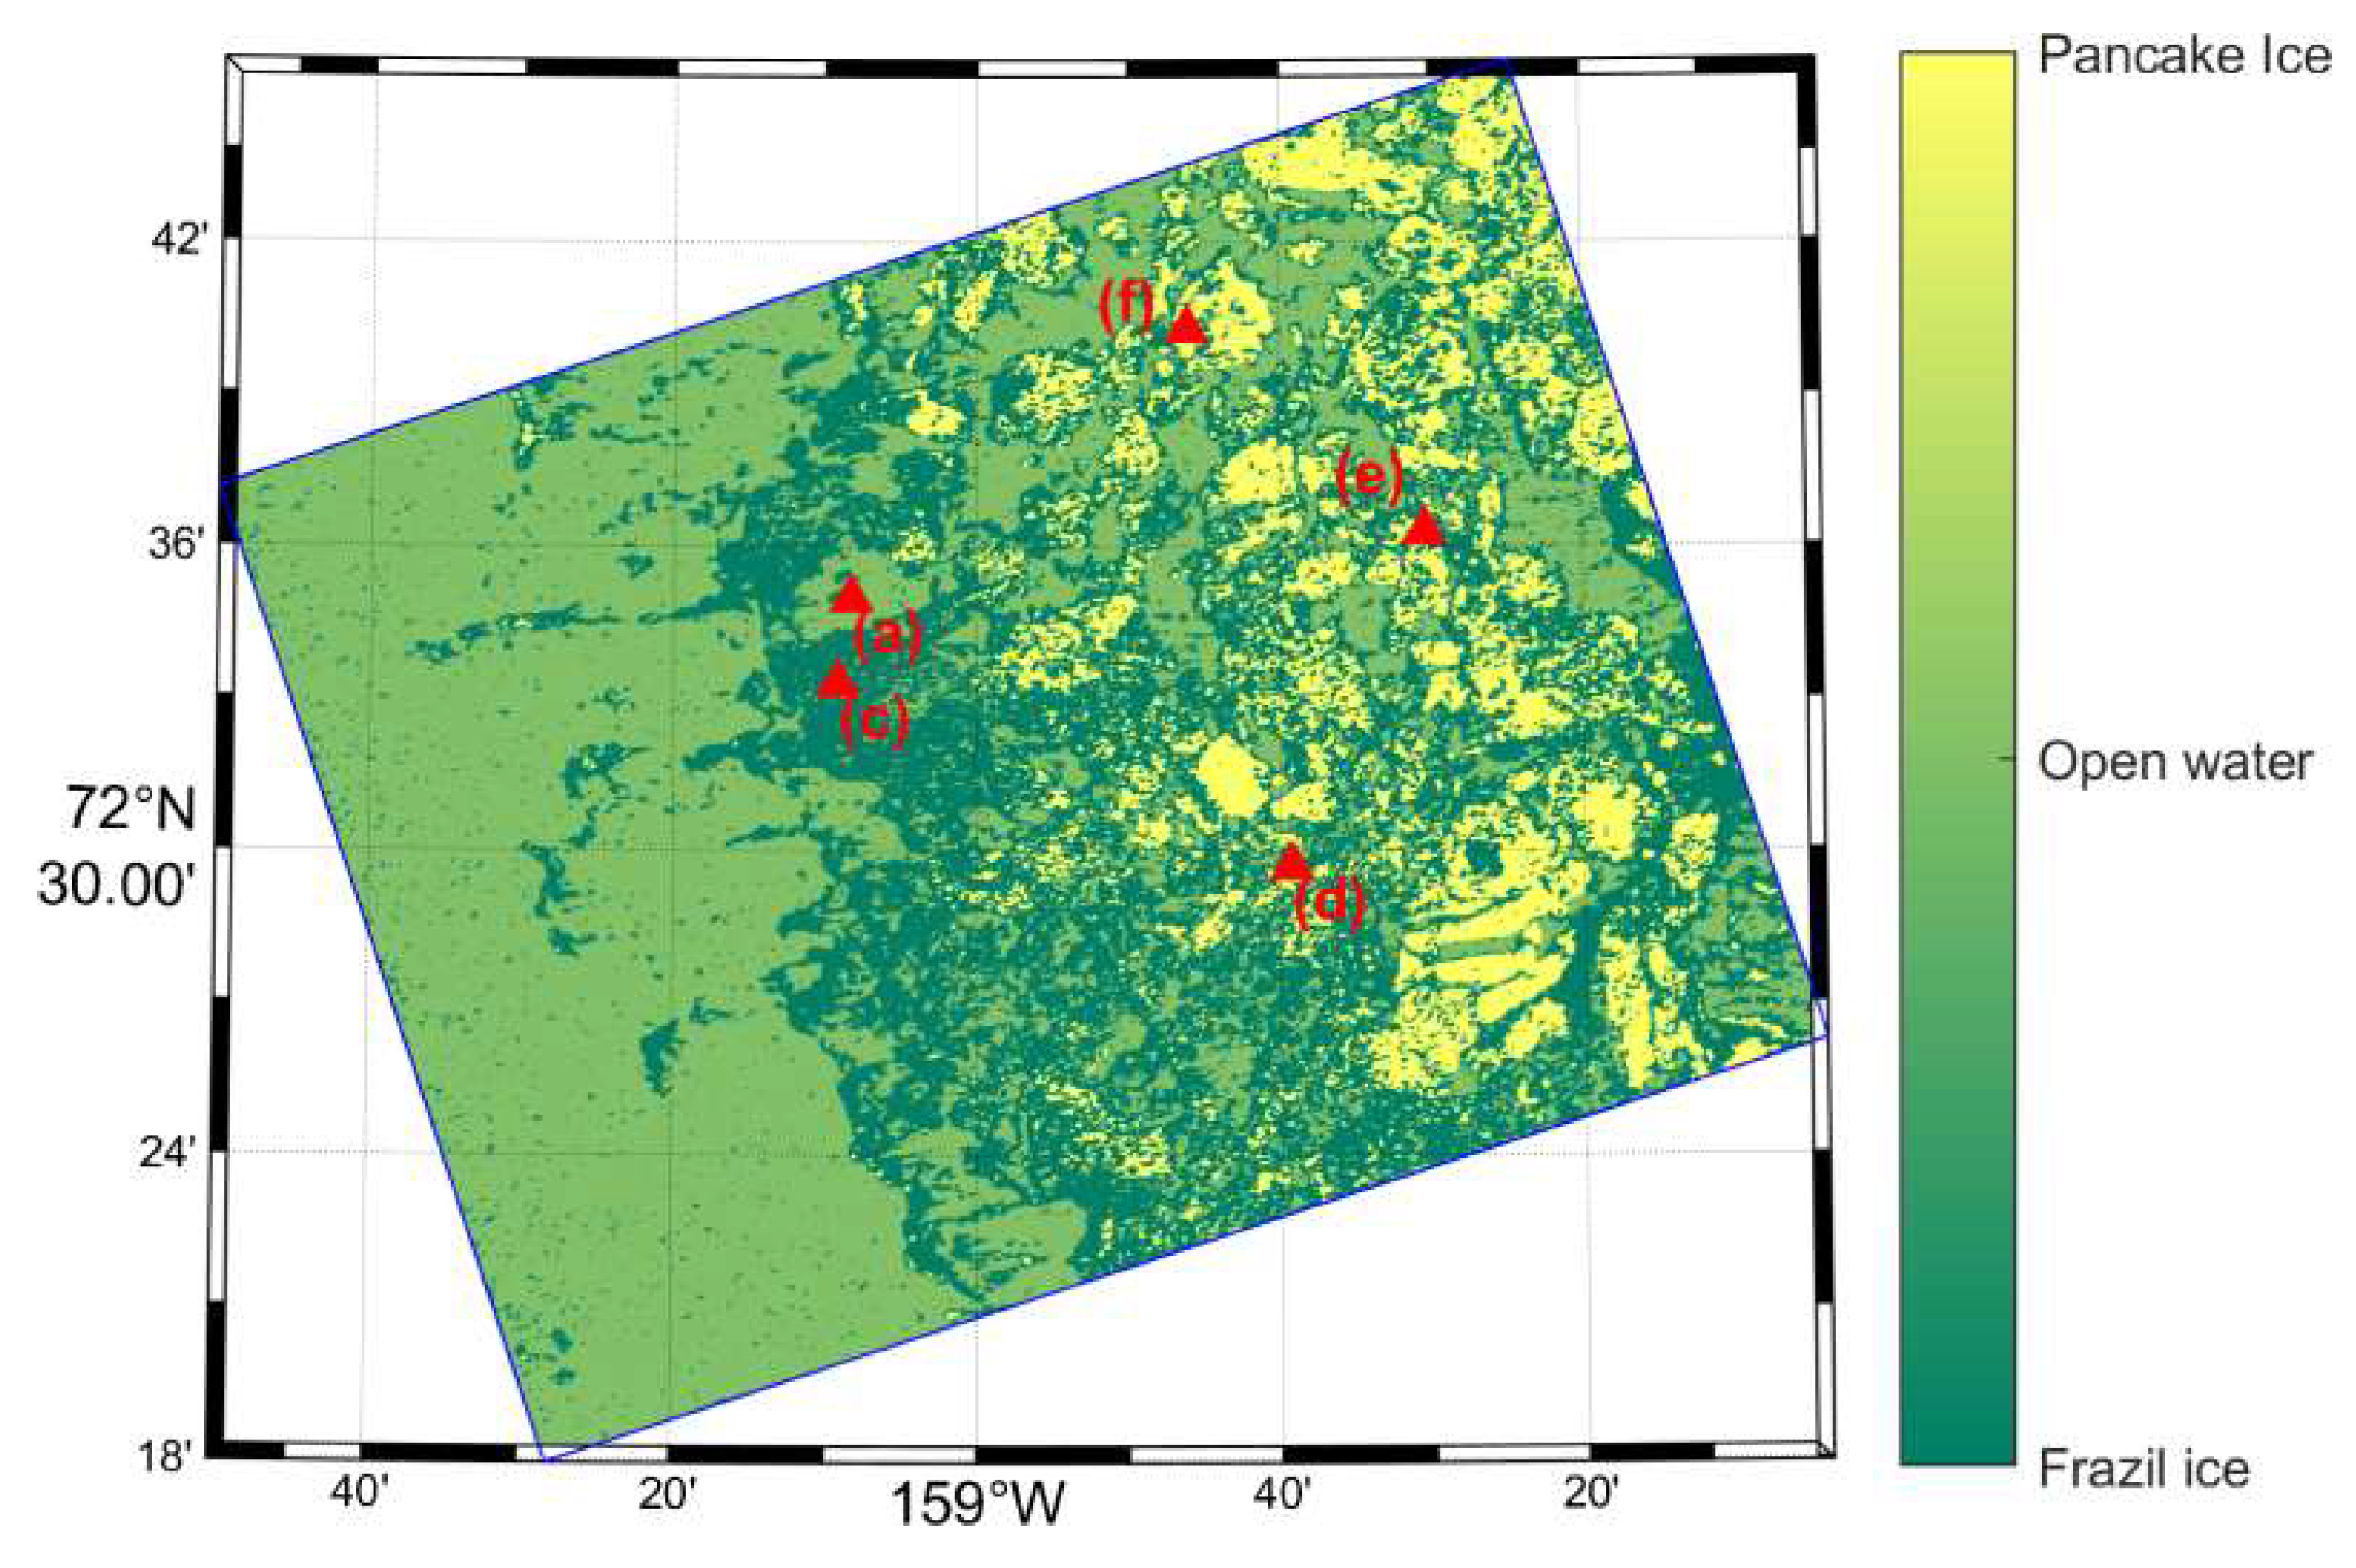
Figure 4. The radar intensity ratio shows much stronger texture in the pancake covered areas but fails in the detection of frazil ice. The phase difference method has the potential to provide a complementary method for ice classification in this challenging but rather important zone. As a demonstration example, we assign different colors for the ice detection results from difference methods, where ice identification results from the co-pol intensity ratio method are given the color yellow, ice from the co-pol phase difference method is dark green, and water from the co-pol phase difference is light green. Figure 9 shows the composite result for overlapping ice detection from the co-pol intensity ratio method, on top of ice detection from the co-pol phase difference method. The open water areas, frazil ice areas, and pancake ice areas are able to be identified and classified using this combination. As stated in Section 3.1, in situ data confirms this classification. More study is needed in order to further investigate the value of phase difference for ice detection and classification.
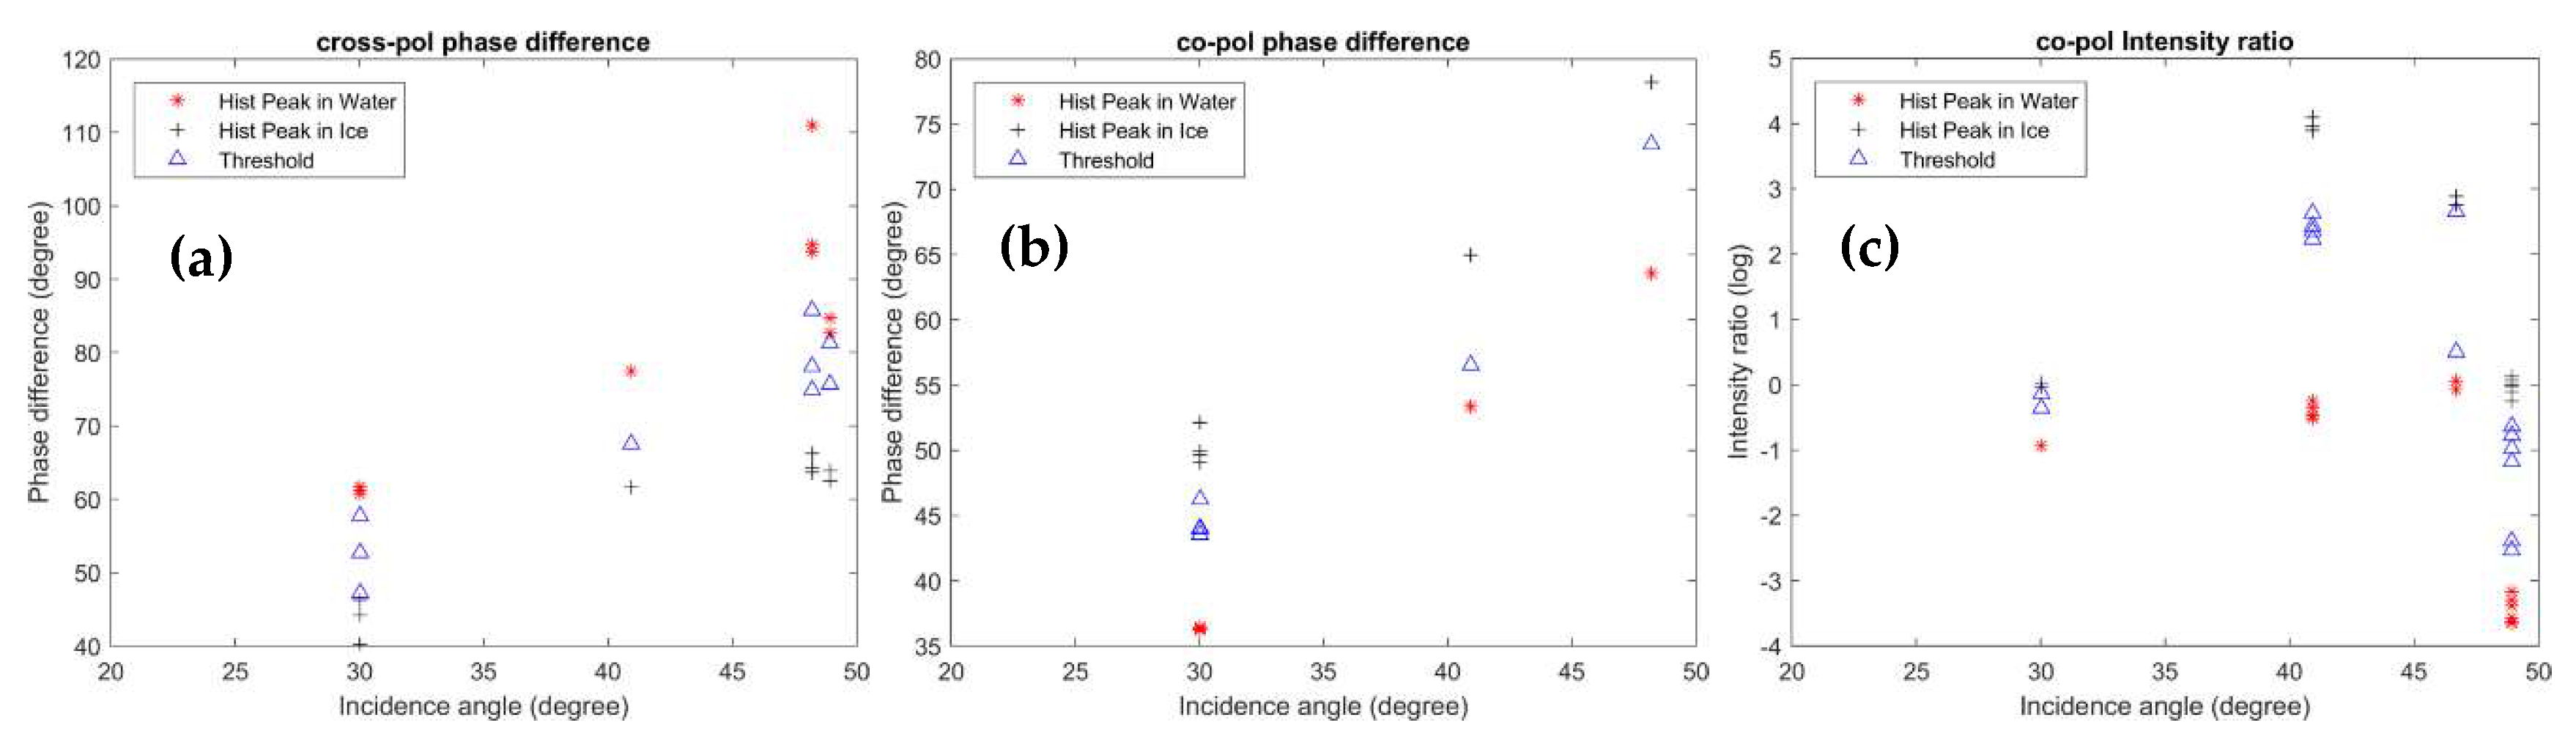
Future study should also consider evaluating the value of the phase difference for identification of other ice types in the marginal ice zone, e.g., multi-year ice, pack ice, etc. Combinations of multi-frequency (e.g., X-, C-, L- band) SAR may also be useful since other frequency bands contain different information associated with ice types and ocean surface structure due to their differing abilities for depth penetration [20]. Evaluation should also consider differing radar incidence angles. Preliminary analysis of this topic from this present study suggests that phase difference values have a consistent performance for ice-water discrimination over the full range of possible radar incidence angles. Previous studies on newly formed ice has suggested that low radar incidence angles are beneficial for ice-water separation [25], but higher incidence angles are helpful for ice type classification [26]. Meanwhile, it is generally known that environmental conditions, e.g., wind speed, sea state etc. have direct impact on the capability of ice-water discrimination from SAR. Under packed ice conditions, the sea surface is isolated from surface wind forcing. Thus, wind conditions and sea state do not play a vital role. However, with ongoing global warming and ice melting in the Arctic, stronger waves are able to penetrate into an increasingly large marginal ice zone, which not only break the ice, but also increase the surface roughness. The latter effect reduces the backscatter difference between ice and water, making ice–water discrimination more complicated. However, there is no designated quantitative analysis in the literature on the applicability of SAR with respect to the ice-water discrimination under various environmental conditions. Our data and analysis suggest that under high sea states, the problem of ice-water discrimination suffers more contamination in cross-pol measurements than those of co-pol, due likely to the higher sensitivity of cross-pol radar to wave breaking. Further study should also quantitively address the applicability of ice detection from SAR under different ocean environmental conditions.
For future satellite missions, both co-pol (HH and VV) and cross-pol (HV and VH) are recommended in order to provide enhanced sea ice monitoring. Many factors, such as different dielectric parameters, and microwave permittivity between ice and water, etc., may also contribute to variations in radar backscattered signals, especially with different ice types (e.g., Hallikainen and Winebrenner (1992) [27]). More studies are needed in order to investigate the details regarding the impact of these factors on our progress to work towards improved ability for ice classification.
The present study suggests that the phase information from co-pol and cross-pol polarimetric measurements is valuable for sea ice detection. With more satellites measuring radar phase information, in present and future satellite missions, the application of phase difference information as suggested in this study has the potential to contribute to the unsupervised detection and segmentation of sea ice, discriminating from open water.
It should be noted that the phase difference method is tested and found to contain useful information for ice–water discrimination between the two co-pol measurements or the two cross-pol measurements, but not between one co-pol and one cross-pol measurement. However, this type of dual-pol configuration mode is not common in modern satellite SARs. In former times, the legacy ASAR instrument onboard the early generation ENVISAT satellite (2002–2012) could operate in HH and VV polarimetric modes. Modern dual-pol SAR systems normally combine acquisitions from one co-pol and one cross-pol mode, as is the case for RADARSAT-2 SAR and Sentinel-1 SAR. However, so far, the phase difference between these dual-pol measurements does not show apparent information for ice detection. The quad-pol mode onboard RADARSAT-2 can provide all measurements needed for the proposed methodology. However, the limited spatial coverage of presently available quad-pol mode imagery, which is 25 km for fine mode and 50 km for wide fine mode for RADARSAT-2, hinders the potential large-scale application of this technique. By comparison, the innovative compact polarization (CP) mode data from the new generation of SAR satellite missions (e.g., RADARSAT Constellation Mission––RCM) preserves most polarimetric properties with wide ScanSAR swath, including phase information, and thus will enable a wider application of the proposed methodology for operational applications.

6. Conclusions

The phase parameter from polarimetric SAR measurements contains valuable information of the radar backscatter from targets. By exploiting the phase differences between co-pol measurements and between cross-pol measurements, we demonstrate the value of the phase information for ice segmentation from open water. Validation against in situ ice observations shows that the phase difference has a unique capability for new frazil ice detection in the marginal ice zone, as compared to the traditional radar intensity ratio method. Both co-pol and cross-pol phase differences work well in moderate wind conditions, with the co-pol phase difference more applicable in high wind conditions. The proposed method has the potential to facilitate and enhance the operational implementation of automatic unsupervised methodologies for sea ice detection and classification in the marginal ice zone.

Author Contributions

F.D. and H.S. contributed to conceptualization, methodology, formal analysis, data curation and visualization; W.P. and Y.H. contributed to resources, supervision, project administration, and funding acquisition. All authors contributed to validation, investigation, and writing—review and editing. All authors have read and agreed to the published version of the manuscript.

Funding

This research was funded in part by the international cooperation project of the National Natural Science Foundation of China (no. 41620104003), by the Office of Naval Research (ONR) initiative on Sea State and Boundary Layer Physics of the Emerging Arctic Ocean (N00014-15-1-2611), by the CSA’s Government Research Initiatives Program (GRIP), the SWOT (Surface Water and Ocean Topography) program, and by the Panel on Energy Research and Development (PERD) Northern Research and Regulation.

Acknowledgments

We thank editor Vladimir Maksimovic, the academic editor Mohammed Shokr, and three anonymous reviewers for the very detailed, valuable comments, which has greatly improved the quality of the manuscript. Haiyan Li and Bash Toulany in Bedford Institute of Oceanography read an early version of the manuscript. The RASARSAT-2 SAR data is provided by Canadian Space Agency (CSA), MODIS data is from NOAA via https://ladsweb.modaps.eosdis.nasa.gov, and ASCAT wind data is from Remote Sensing Systems (www.remss.com).

Conflicts of Interest

The authors declare no conflict of interest. The funders had no role in the design of the study; in the collection, analyses, or interpretation of data; in the writing of the manuscript, or in the decision to publish the results.

References

  1. Polyak, L.; Alley, R.B.; Andrews, J.T.; Brigham-Grette, J.; Cronin, T.M.; Darby, D.A.; Dyke, A.S.; Fitzpatrick, J.J.; Funder, S.; Holland, M.; et al. History of sea ice in the Arctic. Quat. Sci. Rev. 2010, 29, 1757–1778. [Google Scholar] [CrossRef]
  2. Wang, M.; Overland, J.E. A sea ice free summer Arctic within 30 years? Geophys. Res. Lett. 2009, 36. [Google Scholar] [CrossRef] [Green Version]
  3. Khon, V.; Mokhov, I.; Pogarskiy, F.; Babanin, A.; Dethloff, K.; Rinke, A.; Matthes, H. Wave heights in the 21st century Arctic Ocean simulated with a regional climate model. Geophys. Res. Lett. 2014, 41, 2956–2961. [Google Scholar] [CrossRef] [Green Version]
  4. Shen, H.; Perrie, W.; Hu, Y.; He, Y. Remote sensing of waves propagating in the marginal ice zone by SAR. J. Geophys. Res. Oceans 2018, 123, 189–200. [Google Scholar] [CrossRef]
  5. Assmy, P.; Fernández-Méndez, M.; Duarte, P.; Meyer, A.; Randelhoff, A.; Mundy, C.J.; Olsen, L.M.; Kauko, H.M.; Bailey, A.; Chierici, M.; et al. Leads in Arctic pack ice enable early phytoplankton blooms below snow-covered sea ice. Sci. Rep. 2017, 7, 40850. [Google Scholar] [CrossRef] [PubMed]
  6. Moen, M.-A.N.; Doulgeris, A.P.; Anfinsen, S.N.; Renner, A.H.H.; Hughes, N.; Gerland, S.; Eltoft, T. Comparison of feature based segmentation of full polarimetric SAR satellite sea ice images with manually drawn ice charts. The Cryosphere 2013, 7, 1693–1705. [Google Scholar] [CrossRef] [Green Version]
  7. Golden, K.M.; Borup, D.; Cheney, M.; Cherkaeva, E.; Dawson, M.S.; Ding, K.-H.; Fung, A.K.; Isaacson, D.; Johnson, S.; Jordan, A.K.; et al. Inverse electromagnetic scattering models for sea ice. IEEE Trans. Geosci. Remote Sens. 1998, 36, 1675–1704. [Google Scholar] [CrossRef]
  8. Golden, K.M.; Cheney, M.; Ding, K.-H.; Fung, A.K.; Grenfell, T.C.; Isaacson, D.; Kong, J.A.; Nghiem, S.V.; Sylvester, J.; Winebrenner, P. Forward electromagnetic scattering models for sea ice. IEEE Trans. Geosci. Remote Sens. 1998, 36, 1655–1674. [Google Scholar] [CrossRef]
  9. Geldsetzer, T.; Yackel, J.J. Sea ice type and open water discrimination using dual co-polarized C-band SAR. Can. J. Remote Sens. 2009, 35, 73–84. [Google Scholar] [CrossRef]
  10. Johansson, A.M.; Malnes, E.; Gerland, S.; Cristea, A.; Doulgeris, A.P.; Divine, D.V.; Pavlova, O.; Lauknes, T.R. Consistent ice and open water classification combining historical synthetic aperture radar satellite images from ERS-1/2, Envisat ASAR, RADARSAT-2 and Sentinel-1A/B. Ann. Glaciol. 2020, 1–11. [Google Scholar] [CrossRef] [Green Version]
  11. Dierking, W. Sea Ice Monitoring by Synthetic Aperture Radar. Oceanography 2013, 26, 100–111. [Google Scholar] [CrossRef]
  12. Shen, H.; Perrie, W.; Liu, Q.; He, Y. Detection of macroalgae blooms by complex SAR imagery. Mar. Pollut. Bull. 2014, 78, 190–195. [Google Scholar] [CrossRef] [PubMed]
  13. Dierking, W.; Wesche, C. C-band radar polarimetry—Useful for detection of icebergs in sea ice? IEEE Trans. Geosci. Remote Sens. 2013, 52, 25–37. [Google Scholar] [CrossRef]
  14. Li, H.; Perrie, W.; He, Y.; Lehner, S.; Brusch, S. Target detection on the ocean with the relative phase of compact polarimetry SAR. IEEE Trans. Geosci. Remote Sens. 2012, 51, 3299–3305. [Google Scholar] [CrossRef]
  15. Drinkwater, M.R.; Kwok, R.; Winebrenner, D.P.; Rignot, E. Multifrequency polarimetric synthetic aperture radar observations of sea ice. J. Geophys. Res. Oceans 1991, 96, 20679–20698. [Google Scholar] [CrossRef] [Green Version]
  16. MacDonald Dettwiler & Associates RADARSAT-2 Product Description—MDA 2016. Available online: https://mdacorporation.com/docs/default-source/technical-documents/geospatial-services/52-1238_rs2_product_description.pdf (accessed on 4 June 2020).
  17. MacDonald Dettwiler & Associates RADARSAT-2 Product Format Definition—MDA 2016. Available online: https://mdacorporation.com/docs/default-source/technical-documents/geospatial-services/radarsat-2-product-format-definition.pdf?sfvrsn=4 (accessed on 4 June 2020).
  18. Thomson, J.; Ackley, S.; Girard-Ardhuin, F.; Ardhuin, F.; Babanin, A.; Boutin, G.; Brozena, J.; Cheng, S.; Collins, C.; Doble, M.; et al. Overview of the Arctic Sea State and Boundary Layer Physics Program. J. Geophys. Res. Oceans 2018, 123, 8674–8687. [Google Scholar] [CrossRef]
  19. Boerner, W.-M.; Yan, W.-L.; Xi, A.-Q.; Yamaguchi, Y. Basic concepts of radar polarimetry. In Direct and Inverse Methods in Radar Polarimetry; Springer: New York, NY, USA, 1992; pp. 155–245. [Google Scholar]
  20. Johansson, A.M.; Brekke, C.; Spreen, G.; King, J.A. X-, C-, and L-band SAR signatures of newly formed sea ice in Arctic leads during winter and spring. Remote Sens. Environ. 2018, 204, 162–180. [Google Scholar] [CrossRef]
  21. Scharien, R.K.; Hochheim, K.; Landy, J.; Barber, D.G. First-year sea ice melt pond fraction estimation from dual-polarisation C-band SAR – Part 2: Scaling in situ to RADARSAT-2. Cryosphere 2014, 8, 2163–2176. [Google Scholar] [CrossRef] [Green Version]
  22. Shen, H.; Perrie, W.; He, Y.; Liu, G. Wind Speed Retrieval from VH Dual-Polarization RADARSAT-2 SAR Images. IEEE Trans. Geosci. Remote Sens. 2014, 52, 5820–5826. [Google Scholar] [CrossRef]
  23. Lund, B.; Graber, H.C.; Persson, P.O.G.; Smith, M.; Doble, M.; Thomson, J.; Wadhams, P. Arctic Sea Ice Drift Measured by Shipboard Marine Radar. J. Geophys. Res. Oceans 2018, 123, 4298–4321. [Google Scholar] [CrossRef]
  24. Nghiem, S.; Kwok, R.; Yueh, S.; Drinkwater, M. Polarimetric signatures of sea ice: 1. Theoretical model. J. Geophys. Res. Oceans 1995, 100, 13665–13679. [Google Scholar] [CrossRef] [Green Version]
  25. Partington, K.C.; Flach, J.D.; Barber, D.; Isleifson, D.; Meadows, P.J.; Verlaan, P. Dual-polarization C-band radar observations of sea ice in the Amundsen Gulf. IEEE Trans. Geosci. Remote Sens. 2010, 48, 2685–2691. [Google Scholar] [CrossRef]
  26. Wakabayashi, H.; Matsuoka, T.; Nakamura, K.; Nishio, F. Polarimetric characteristics of sea ice in the Sea of Okhotsk observed by airborne L-band SAR. IEEE Trans. Geosci. Remote Sens. 2004, 42, 2412–2425. [Google Scholar] [CrossRef]
  27. Hallikainen, M.; Winebrenner, D.P. The physical basis for sea ice remote sensing. Microw. Remote Sens. Sea Ice 1992, 68, 29–46. [Google Scholar]
Figure 1. Track of Sikuliaq cruise on 2 November (blue) and 3 November (red) 2015 overlaid on a Quad-pol RADARSAT-2 SAR image acquired on 3 November at 03:35Z. The red dot denotes the ship position at the SAR (Synthetic Aperture Radar) observation time. Labels (a–f) denote the location where photos of ice conditions are shown in Figure 2. The orientations of the arrows represent the look direction of the camera.
Remotesensing 12 01847 g001
Figure 2. In situ ice conditions along the R/V Sikuliaq cruise track within the RADARSAT-2 SAR image at 03:35Z on 3 November, 2015. (Photo credit: Hayley Shen). Please refer to Figure 1 for the locations where the photos were taken. Photo time: (a) 2 November at 20:59Z, (b) zoom in the white square in (a), (c) 3 November at 06:53Z, (d) 3 November at 16:40Z, (e) 3 November at 19:52Z, and (f) 3 November at 00:54Z. Frazil ice is identified in (ac) and pancake ice in (df).
Remotesensing 12 01847 g002
Figure 3. Polarimetric characteristics of sea ice in open water (RADARSAT-2 SAR on 3 November 2015 at 03:35:50 UTC): (ad) normalized radar backscattered intensity signals for HH, VV, HV, VH (the first letter defines radar transmission polarity and the second, for the receipt polarization, H for Horizontal, V for vertical) polarization respectively. The RADARSAT-2 data are products of MacDonald, Dettwiler, and Associates, Ltd. (Westminster, CO, USA)
Remotesensing 12 01847 g003
Figure 4. Comparison of ice-water discrimination feasibility based on intensity and phase information. (a) Co-pol intensity ratio (log), (b) histogram for (a); (c) absolute co-pol phase difference (degree) (d) histogram for (c); (e) absolute cross-pol phase difference (degree) (f) histogram for (e).
Remotesensing 12 01847 g004
Figure 5. Results for ice detection from absolute co-pol phase difference in (a), absolute cross-pol phase difference in (b), and co-pol intensity ratio in (c). Note: black color represents ice, white represents water.
Remotesensing 12 01847 g005
Figure 6. Relationship between: radar incidence angle and (a) cross-pol phase difference, (b) co-pol phase difference, (c) co-pol intensity ratio. Labels: * denotes peak of histograms in ice, + denotes the peak of the histograms in water, and ∆ denotes the location where the bimodal distribution functions meet.
Remotesensing 12 01847 g006
Figure 7. False color composite from MODIS 250 m radiation data (7 November 2014 at 12:05Z). White solid squares show the coverage of quad-pol RADARSAT-2 SAR images at 07:37Z and white dash squares at 19:11Z on 7 November 2014. The red coastline is based on ETOPO1 data from NOAA (National Oceanic and Atmospheric Administration).
Remotesensing 12 01847 g007
Figure 8. Ice-water discrimination based on co-pol (b,e) and cross-pol (c,f) phase differences for RADARSAT-2 SAR image with different wind speeds of 15 m/s at 19:11Z (ac) and 25 m/s at 07:37Z (df). Note: (a,d) show HH radar intensities where clear atmospheric boundary layer (ABL) rolls are visible throughout the swath of 7:37Z.
Remotesensing 12 01847 g008
Figure 9. Preliminary combination of ice detection from co-pol phase difference and co-pol intensity ratio methods to demonstrate the potential value of applying radar phase differences for ice classification in the marginal ice zone.
Remotesensing 12 01847 g009
Table 1. Information on the synthetic aperture radar (SAR) images.
Swath IDTime StartTime EndImage Mode *Number of FramesLocationIncidence AngleWind Speed
103-11-2015
03:35:44Z
03-11-2015
03:35:53Z
FQW4Arctic Beaufort Sea28.44°–31.60°14 m/s
211-03-2015
17:11:30Z
11-03-2015
17:11:39Z
FQW4Arctic Beaufort Sea39.65°–42.21°14 m/s
302-06-2013
08:15:56Z
02-06-2013
08:16:15Z
FQ7East Greenland47.61°–48.80°8 m/s
402-06-2013
19:48:19Z
02-06-2013
19:48:35Z
FQ6East Greenland46.08°–47.30°10 m/s
511-07-2014
07:37:18Z
11-07-2014
07:37:41Z
FQ5East Greenland48.35°–49.50°25 m/s
611-07- 2014
19:10:53Z
11-07- 2014
19:11:27Z
FQ4East Greenland48.35°–49.50°15 m/s
* FQ: Fine Quad-polarization; FQW: Fine Wide Quad-polarization.

