Article

Water Balance Standardization Approach for Reconstructing Runoff Using GPS at the Basin Upstream

1
School of Geodesy and Geomatics, Wuhan University, Wuhan 430079, China
2
Key Laboratory of Geophysical Geodesy, Ministry of Natural Resources, Wuhan 430079, China
3
School of Earth and Space Sciences, Peking University, Beijing 100871, China
4
Department of Land Surveying and Geo-informatics, The Hong Kong Polytechnic University, Hong Kong, China
*
Author to whom correspondence should be addressed.
Remote Sens. 2020, 12(11), 1767; https://doi.org/10.3390/rs12111767
Submission received: 19 April 2020 / Revised: 27 May 2020 / Accepted: 27 May 2020 / Published: 30 May 2020

Abstract

:
While in-situ estuarine discharge has been correlated and reconstructed well with localized remotely-sensed data and hydraulic variables since the 1990s, its correlation and reconstruction using averaged GPS-inferred water storage from satellite gravimetry (i.e., GRACE) at the basin upstream based on the water balance standardization (WBS) approach remains unexplored. This study aims to illustrate the WBS approach for reconstructing monthly estuarine discharge (in the form of runoff (R)) at Mekong River Delta, by correlating the averaged GPS-inferred water storage from GRACE of the upstream Mekong Basin with the in-situ R at the Mekong River Delta estuary. The resulting R based on GPS-inferred water storage is comparable to that inferred from GRACE, regardless of in-situ stations within Mekong River Delta being used for the R reconstruction. The resulting R from the WBS approach with GPS water storage converted by GRACE mascon solution attains the lowest normalized root-mean-square error of 0.066, and the highest Pearson correlation coefficient of 0.974 and Nash-Sutcliffe efficiency of 0.950. Regardless of using either GPS-inferred or GRACE-inferred water storage, the WBS approach shows an increase of 1–4% in accuracy when compared to those reconstructed from remotely-sensed water balance variables. An external assessment also exhibits similar accuracies when examining the R estimated at another station location. By comparing the reconstructed and estimated Rs between the entrance and the estuary mouth, a relative error of 1–4% is found, which accounts for the remaining effect of tidal backwater on the estimated R. Additional errors might be caused by the accumulated errors from the proposed approach, the unknown signals in the remotely-sensed water balance variables, and the variable time shift across different years between the Mekong Basin at the upstream and the estuary at the downstream.

Graphical Abstract

1. Introduction

River freshwater discharge, being expressed in the form of runoff (R) near estuary mouths, is a significant water balance variable of a river basin [1,2]. It is essential to capture floods and droughts in river deltas, and to prepare for potential economic losses [3,4,5,6]. However, insufficient funding for facility operation [7] has resulted in a decreasing number of in-situ gauges around the world [8]. Therefore, an approach for estimating river freshwater discharge in an ungauged basin is sought.
This problem was addressed by using passive remotely-sensed quantities. These quantities, including hydraulic parameters [9], floodplain [10], vegetation index (e.g., NDVI) [11], and land surface temperature (LST) [12], have been used immediately to reconstruct the water level or river freshwater discharge since the 1990s, notwithstanding indirect relations to river freshwater discharge. Besides the above passive remotely-sensed quantities, active remotely-sensed quantities from satellite altimetry and gravimetry, have currently been used to reconstruct the water level [13] or river freshwater discharge [14,15].
Satellite altimetry (e.g., TOPEX/Jason/Envisat) actively records water level variations of lakes, rivers, and reservoirs [16]. In this way, the observed water level is directly correlated with nearby in-situ river freshwater discharge time series [14,17]. Its accuracy is, however, significantly lower when land surface is partly contained in a radar reflected signal [18]. Satellite gravimetry (e.g., Gravity Recovery and Climate Experiment (GRACE)) infers monthly water storage variations by actively measuring time-variable gravity changes through distance ranging [19,20]. In fact, water storage presents a direct functional relationship with river freshwater discharge [21]. More recently, GRACE-inferred water storage has been correlated very well with the water level [13] and estuarine discharge (in the form of R) [15]. Its standardized form, it can further improve the correlation and accuracy of the water level and R reconstruction. This is possible because standardization can minimize certain biases through the subtraction process, and, hence, sharpens the regional anomalies [22,23].
The global positioning system (GPS) is another space geodetic technique that actively observes vertical crustal displacement (VCD). Since 2000, GPS VCD has been used to monitor seasonal water storage variations [24]. More recently, it has also been employed to infer water storage [25,26]. Conversely, the GRACE-inferred water storage can also be converted into vertical surface deformations (in terms of VCD), being comparable to that measured from GPS [27,28,29] as verified in South America [30], Himalayas [31], and the Tibetan Plateau [32]. Given the geophysical interchangeability between water storage and VCD [26,27], GPS VCD can potentially be regarded as water storage in terms of water balance context, when a sufficiently dense GPS network exists.
Precipitation (P), evapotranspiration (ET), water storage (S), and R are the four water balance variables within a hydrological cycle. P, ET, and S can be obtained from Tropical Rainfall Measuring Mission (TRMM), Moderate Resolution Imaging Spectrometer (MODIS), and GRACE (or indirectly from GPS), respectively, whereas R can only be indirectly inferred based on the water balance equation (i.e., R = P E T Δ S ) [33]. Through the subtraction among the water balance variables, the inferred R from the water balance equation could be expected to outperform the correlative relationship between each individual water balance variable and in-situ R, let alone the inferred R from water balance standardization (WBS). This WBS approach and its corresponding results are the objectives of this paper.
Mekong Basin, being our study region with a catchment area of ~795,000 km2, is the most important river basin in Southeast Asia [34] (Figure 1). Freshwater transports from the Northeastern Tibetan Plateau to Southeast Asian countries and the Mekong River Delta, where it is affected by both freshwater discharge and ocean tidal backwater seasonally [35,36] in addition to the R adjustment due to the Tonle Sap Lake prior to transporting to the open ocean [37,38]. Along the main stream, Lancang River, located in Yunnan, China, is a significant upstream portion of the Mekong Basin that is climatically driven by an Indian monsoon [39]. Any changes of hydrological conditions upstream would pose an adverse effect on human beings, particularly involving agricultural and economic losses downstream [40]. This reason calls for research studies using upstream remotely-sensed observations for downstream river freshwater discharge estimation [41].
On the other hand, the Mekong Basin is substantially modified by human activities. Dam construction and operation at the upstream have been issues since the 1990s [42], which alters the R at the downstream in different seasons [43]. Subsequently, water security becomes a significant issue among different Southeast Asian nations, especially for the Mekong River Delta where it is important for the fish supply [44] and water security [45] of Southeast Asia. However, the influence of dams is not large enough as to alter the flow consistency [46]. Previous studies also indicated that the influence on the annual change of R of the Mekong River Delta is insignificant [42]. The accumulated effect of dam operations in the estuary area is almost systematic for a specified month every year [47]. Therefore, the subtraction and standardization process should be able to mitigate the accumulated bias. Previously mentioned reasons justify a potential use of the WBS approach in the upstream to reconstruct the downstream R time series located in the estuary.
This study explores the applicability of the GPS VCD at the upstream Mekong Basin employing the WBS approach for reconstructing the R time series of a gauge station at the Mekong River Delta on a monthly temporal scale. Based on the reconstructed relationship, the R time series estimated at another location in the river delta are then compared with an independent in-situ R for an external assessment. Other remotely-sensed hydrometeorological variables (RSHMVs) from TRMM and MODIS are used as baselines for direct comparison to show the applicability of the GPS VCD.

2. Data and Processing Strategies

2.1. Time Series of In-Situ Estuarine Discharge Gauges

The in-situ estuarine discharge data are requested at http://www.mrcmekong.org. To be consistent with GPS time span, the estuarine discharge time span was extracted for a period between 2012 and 2014. Given the above geographic description, the in-situ estuarine discharge gauge stations should be chosen to be representative for the whole Mekong Basin, while minimizing the backwater effect due to ocean tides and the total discharge adjustment effect attributed to Tonle Sap Lake [38].
Tan Chau and Chau Doc stations, ~220 km away from the estuary mouth and located at the Mekong River Delta entrance, were chosen for reconstructing R in this study (Figure 1). Can Tho and My Thuan stations, which are the nearest stations before the coastlines, were also employed for assessing the effect due to backwater on the estimated R time series. To reduce the backwater effect due to short-period (i.e., half-daily period and daily period) ocean tides, the discharge time series of Tan Chau and Chau Doc stations (hereafter called the TC-CD station) were summed up. The same process was conducted for Can Tho and My Thuan stations (hereafter called CT-MT station).
To convert daily estuarine discharge (m3 per sec) into R (mm per month), the daily estuarine discharge data were added up each month, which was followed by dividing the catchment area of the basin. No matter which pair of stations (either CT-MT station or TC-CD station), both resulting time series shared the same fluctuation pattern, despite differences in R peaks and troughs (Figure 2).

2.2. Remotely-Sensed Water Balance Variables

Except for the indirectly determined runoff R, other water balance variables (P, ET, and S) can be determined, respectively, from TRMM, MODIS, and GRACE, as mentioned above. To be consistent with the GPS time span, these water balance variables from 2012 to 2014 were used.
TRMM measured P (hereinafter called TRMM-P) with a global coverage bounded between 50° N to 50° S [48]. We used monthly gridded P data (TRMM 3B43 version 7) with a 0.25° × 0.25° spatial resolution available at https://disc.gsfc.nasa.gov/datasets/TRMM_3B43_V7/summary. These TRMM data were generated from calibration using all precipitation gauges around the world [49].
MODIS measured and inferred a wide variety of environmental variables, including E T (hereinafter called MODIS-ET). We used the gridded ET data (MOD16A2) that covers an area from 80° N to 60° S with a 0.5° × 0.5° spatial resolution. This dataset, calculated by an improved algorithm using Penman–Monteith equation [50], is made available by the Numerical Terradynamic Simulation Group in the University of Montana (http://www.ntsg.umt.edu/project/modis/). TRMM-P and MODIS-ET are generalized as remotely-sensed hydrometeorological variables (RSHMV) in this study.
GRACE measured time-variable gravity, and, thereby, inferred global S (hereinafter called GRACE-S). The Center for Space Research (CSR) Release-06 (RL06) and its RL06-mascon solution were employed because the above two solutions were developed by two different data pre-processing techniques for their consistency to be validated from the resulting R reconstruction. Because the monthly mascon solution was developed via Tikhonov regularization on regular spatial grids [51], the monthly RL06-mascon solution can directly be used (http://www2.csr.utexas.edu/grace/RL06_mascons.html). However, the monthly RL06 solution are expanded to 60° (equivalent to a spatial resolution of 3°) in the form of spherical harmonic coefficients representing the mass changes (http://www2.csr.utexas.edu/grace/RL06.html). Therefore, post-processing steps are required for the monthly RL06 solution prior to their use. These steps include adding degree-1 term with measured geocenter time series generated from Satellite Laser Ranging [52], and replacing C20 term in the spherical harmonic coefficient to improve the second zonal coefficient, respectively [53]. De-striping and 350-km radius Gaussian filtering (hereinafter called RL06-G350) are then applied to attenuate spatially correlated errors [54]. The monthly S time series (in terms of Equivalent Water Height at a regular grid) are calculated using Equation (14) in Reference [55], which is divided by the water density.

2.3. Data Processing for GPS-Determined VCD and its Conversion into Water Storage (S)

We used GAMIT version 10.4 [56] to preprocess 33 GPS stations’ raw observations in the upstream Mekong Basin to determine daily VCD time series from 2012 to 2014, provided by Crustal Movement Observation Network of China. We employed a network solution that is stochastically constrained to 24 IGS stations surrounding China (i.e., posing 5-cm standard error in 3D positioning) in which the IGS stations are in ITRF2008 coordinate reference frame.
Standard procedures were applied during the GPS pre-processing steps. For instance, the antenna offsets were corrected by the IGS provided antenna correction data files and the non-tidal atmospheric loading was removed by using the MIT correction data files. The orbits were constrained to the final precise ephemeris of IGS. The ionospheric delay was corrected up to the third-order term by choosing options in GAMIT. The tropospheric delay was corrected by the combination of the Vienna mapping function 1 and the global pressure and temperature model [57]. Earth Orientation Parameters were set to a priori values, and the solid Earth tide and pole tide were corrected, according to the International Earth and Rotation Service (IERS) Bulletin B standard [58]. The ocean tide loading was removed by choosing the FES2004 model option in GAMIT. Lastly, the daily GPS VCD time series, being a time series of relative height positions, were determined by subtracting the height from its average.
During the post-processing steps, the non-tidal ocean loading in the GPS VCD time series was corrected externally by the modeled non-tidal ocean loading displacement from a Global Geophysical Fluid Center (http://geophy.uni.lu/). Gross errors exceeding twice the standard deviation were removed. To suppress the signal aliasing and draconitic errors (e.g., ~351 days [59,60]) in the seasonal signal, we applied a spectral filtering in the frequency domain via Fast Fourier Transform technique. Apparently, the first peak (i.e., 1 cycle per year) was recovered (Figure 3). We also observed that the peaks and troughs of the GPS time series were reduced after inversely transforming the filtered GPS spectra back into their respective time series. To be consistent with other monthly data, the daily GPS VCD time series were averaged to form the VCD on a monthly scale.
In principle, the time-varying VCD of each GPS station location is due to all neighboring S contributions [61]. Therefore, the gridded GRACE-S data near the single GPS station location should be acquired to conduct a spatially-weighted averaging process with respect to that single GPS station location. In this study, we set a search area within 3° for a number of i gridded GRACE-S data with respect to each GPS station location g. This spatially-weighted averaging for N number of gridded GRACE-S at the GPS station g, denoted as S g , is achieved by the following equation.
S g = i = 1 N w i S i i = 1 N w i
where
w i = exp ( d i D )
serves as a weighting factor according to each distance d i , with respect to the station g, with a spatial scale D set to 3° due to the previously mentioned spatial resolution of GRACE data and allowance for including the hydrological loading effect farther than 3°.
In essence, GPS VCD is related to S elastically in a linear fashion [62], which can be expressed as
( S g ) t = α V C D t + β
Therefore, by a simple linear fitting with a slope α , and an offset β at the same time epoch t, the parameters α and β can be determined via least-squares solution in order to convert VCD into S. Note that α should be a negative value because S loads (unloads) the crust that yields the VCD downward (upward).
Only averaged GRACE-S fitted at the GPS station g with a Pearson correlation coefficient (i.e., Equation (7)) higher than 0.8 were used to calculate the mean α ¯ and β ¯ (Table 1). Given the criterion, GRACE CSR RL06-mascon fitted at five GPS stations (i.e., KMIN, SCMB, YNGM, YNWS, and YNYL) are excluded to calculate the mean α ¯ and β ¯ . Meanwhile, GRACE CSR RL06-G350 fitted at nine GPS stations (i.e., GZSC, KMIN, SCMB, SCYX, YNGM, YNLA, YNWS, YNXP, and YNYL) were excluded. We then used respective values α ¯ and β ¯ to convert all VCD into averaged S time series for the entire preset square bounding Yunnan Province (Figure 1).

3. Methodology

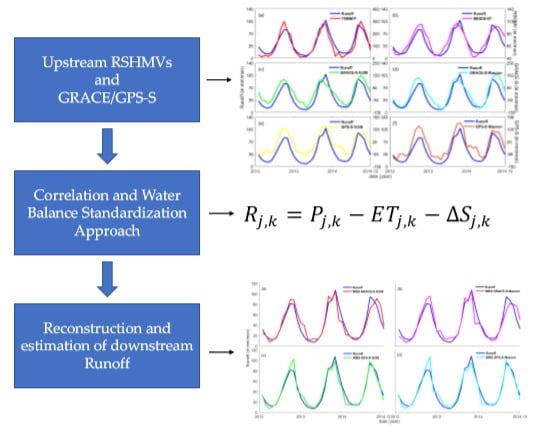
3.1. Reconstruction Based on Correlation and Water Balance Standardization

Each of the previously mentioned time series of remotely-sensed water balance variables within a preset square bounding Yunnan Province were averaged and smoothed before the correlation analysis. Employing the traditional practice in remote sensing, the R reconstruction is conducted by directly correlating the remotely-sensed water balance variables with the in-situ R via a simple linear model (i.e., an offset c and a slope d), which is expressed as:
y t = c + d x t
where y t and x t are, respectively, the in-situ R and individual remotely-sensed water balance variable at month t. Note that a forward two-month shift for TRMM-P and MODIS-ET data was applied because this procedure yielded the highest correlation, which is attributable to hysteretic properties of the hydrological process [21]. The parameters, c and d, are empirically determined via a least-squares solution in which the determined parameters are then employed to reconstruct R using individual time series of the remotely-sensed water balance variables.
Figure 4 visualizes all the time series, including GPS-derived S (hereinafter called GPS-S) from CSR RL06 with 350-km Gaussian filtering and its mascon solution from 2012 to 2014. Similar temporal fluctuations with the in-situ R are observed. However, variable time shift across different years is detected for the upstream averaged GRACE-S when compared to the in-situ R (Figure 4). We speculate that the climatic variability across different geographic zones of the entire Mekong Basin causes the spatial differences in the water storage every year [63,64]. The water storage from GRACE RL06 solution displays a slightly smaller amplitude than that of mascon solution. This is because 350-km radius Gaussian filtering was applied to RL06 solution that attenuated regional signals, while the time-variable regularization matrix was employed to solve for the mascon solution via Tikhonov regularization, which would not attenuate the regional signals [51]. The GPS-S exhibits a slower downward trend against the in-situ R from January to April 2014. This might be because GPS is a ground-observed technique that is more sensitive to local events or changes in water storage [26]. Overall, all individual time series of the remotely-sensed water balance variables, including GPS-S with 350-km Gaussian filtering and its mascon solution, exhibit similar temporal patterns allowing the direct use of Equation (4) for the R reconstruction, referred to as “reconstructed Rs”.
For the correlation procedures of the WBS approach in this study, the in-situ R are standardized and correlated with the WBS of R. The standardization of the in-situ R, s R j , k , is calculated as
s R j , k = R j , k m e d ( R k ) s k ,
where R j , k is the in-situ R, m e d ( R k ) is the median of the in-situ R, and s k is the standard error of the in-situ R for month k and year j. Equation (5) is also applied to the WBS of R, where R is derived by subtracting ET and S from P as
R j , k = P j , k E T j , k Δ S j , k   ,
when calculating corresponding standardization. Note that Δ S j , k is the difference between month k + 1 and k of year j of GRACE-S (or GPS-S). Equation (4) was further employed to empirically determine the corresponding c and d between the standardization of the in-situ R and the R from the WBS. This procedure allows the determination of the reconstructed Rs based on the WBS approach.
Note that the reconstructed Rs that are directly used to compare against the utilized in-situ R time series using performance indicators illustrated in the next sub-section refers to the internal performance. The subsequent usage of the determined parameters for the Rs estimated at another locations with independent in-situ R time series in the river delta refers to estimated Rs. The estimated Rs are then compared against the independent in-situ R time series that refers to external performance. Both performance assessments examine the feasibility of our presented methodology.

3.2. Performance Indicators

The reconstructed and estimated Rs are assessed based on the utilized and independent in-situ R, respectively, by using the following three performance indicators.
Pearson correlation coefficient (PCC), being a measure between two variables ranging from negative one to positive one, is defined by the equation below.
P C C = 1 N i = 1 N ( R 0 ( i ) R 0 ¯ ) ( R m ( i ) R m ¯ ) 1 N i = 1 N ( R 0 ( i ) R 0 ¯ ) 2 1 N i = 1 N ( R m ( i ) R m ¯ ) 2
Normalized root-mean-square error (NRMSE), being a measure of RMSE normalized by the maximum ranges of observations, is a relative accuracy indicator defined by the formula below.
N R M S E = 1 N i = 1 N ( R m ( i ) R 0 ( i ) ) 2 max ( R 0 ) min ( R 0 )
The Nash-Sutcliffe efficiency (NSE) model coefficient [65], being an indicator to evaluate the efficiency gain of the estimated R against the in-situ R time series, ranges from negative infinity to one. The closer the NSE value to one, the better the efficiency of the estimated R. It is defined by the equation below.
N S E = 1 i = 1 N ( R m ( i ) R 0 ( i ) ) 2 i = 1 N ( R m ( i ) R 0 ¯ ) 2
where R 0 ( i ) and R m ( i ) represent the in-situ and (estimated or reconstructed) Rs for each month i, R 0 ¯ and R m ¯ are the average values of R 0 and R m , and max ( R 0 ) and min ( R 0 ) are the in-situ maximum and minimum of R 0 , respectively.

4. Results and Evaluation

In this section, we examined internal and external performances of the reconstructed and estimated Rs generated from TRMM-P, MODIS-ET, GRACE-S, GPS-S, and the WBS approach using GRACE-S and GPS-S. Note that the CT-MT station is 120–150 km closer to the estuary mouth than the TC-CD station. The combined internal and external performance assessments of both station pairs could help quantify the remaining portion of a systematic ocean tidal backwater effect on both the reconstructed and estimated Rs because the time series of R of each station pair have been summed up to mitigate the ocean tidal effect.
The reconstructed Rs from the TRMM-P, MODIS-ET, GRACE-S, and GPS-S display similar temporal pattern of in-situ R, despite slight discrepancies observed in peaks and troughs (Figure 5). The reconstructed R from TRMM-P appears to be the best because the in-situ R should be highly dependent on precipitation, as displayed in the performance indicators (Table 2).
Compared with the above reconstructed Rs from the TRMM-P, MODIS-ET, GRACE-S, and GPS-S, the reconstructed Rs based on the WBS approach using the GRACE-S and GPS-S achieve better results (Figure 6). In particular, the discrepancy in peaks and troughs are reduced regardless of reconstruction based on GRACE-S and GPS-S (Figure 6). The WBS approach is based on the principle of water balance (i.e., Equation (6)). The systematic errors in the remotely-sensed water balance variables cancel each other through subtraction among themselves, let alone in the standardization in Equation (5). Hence, the reconstructed R from the WBS approach yields the best performance among all reconstructions in the study region. In general, all the estimated Rs are slightly less accurate than the reconstructed Rs (Table 2 and Table 3), whereas the relative ranking of their performances also remains the same, no matter whether reconstructed at either CT-MT or TC-CD station.
By examining the differences between the estimated Rs at CT-MT and TC-CD stations in terms of the performance indicators shown in Table 2 and Table 3, the usage of TC-CD station accounts for a 1–4% decrease in the relative error (in terms of NRMSE) when compared to that at the CT-MT station. This should be a percentage of the remaining ocean tidal backwater effect at the CT-MT station in the estuary because the summation process of the R time series (as mentioned in Section 2) has already reduced the ocean tidal effect. In addition, the WBS approach yields a 1–4% decrease in a relative error (in terms of NRMSE) for the CT-MT station, while yielding an average of a 1.65% decrease for the TC-CD station when compared to the remotely-sensed water balance variables. This represents a substantial improvement because the peaks and troughs are better captured in which accurate peaks and troughs are particularly essential for a comprehensive economic loss assessment during flooding and drought events. The R estimated from the GPS-S using the WBS approach results in the highest PCC (i.e., 0.959) and NSE (i.e., 0.907), and the lowest NRMSE (i.e., 0.089). Overall, the proposed WBS approach using the upstream averaged GPS-S is empirically shown to be competitive among the estimated Rs from the remotely-sensed water balance variables in the study region.
Nonetheless, remaining errors might still exist. These include the deficiency in our methodology, unknown signals in the remotely-sensed water balance variables, and variable time shift across different years between the Mekong Basin upstream and the estuary downstream. Moreover, in-situ discharge time series in the river delta is needed for reconstruction. The chosen GPS stations should be better located on the bedrock surface so that the seasonal elastic deformations can be clearly detected. The previously mentioned considerations represent limitations of this study.

5. Conclusions

We have investigated the applicability of the water balance standardization (WBS) approach based on using the GPS-inferred water storage (GPS-S) from satellite gravimetry (i.e., GRACE) averaged from the upstream of Mekong Basin for reconstructing the runoff (R) on a monthly scale at the Mekong River Delta estuary mouth. We acquired that the reconstructed R based on the WBS approach using GPS-S reaches at least a PCC of 0.97 and an NSE of 0.93 at both the Can Tho–My Thuan station as well as the Tan Chau–Chau Doc station pairs, which are comparable to those obtained based on the gravimetrically-inferred water storage (GRACE-S). This finding indicates that the GPS-S could be considered as an alternative to the GRACE-S within the water balance context under the WBS approach, even though this method still relies on GRACE-S. In contrast to those R reconstructed from the remotely-sensed water balance variables, the WBS approach shows a 1–4% increase in the accuracy.
We conducted the external assessment of the estimated R using an independent in-situ R. We found out that the estimated and reconstructed Rs presented similar accuracy. By comparing the reconstructed and estimated Rs at the Can Tho–My Thuan and Tan Chau–Chau Doc stations, we found out that the remaining ocean tidal backwater effect on the estimated Rs accounted for a relative error of 1–4%, even though the in-situ time series have been summed up to mitigate the ocean tidal backwater effect.
The R reconstructed based on the WBS approach from the GPS-S attains the lowest NRMSE value (i.e., < 9%) in which the remaining errors are the limitations of this approach. This might include the internal error in our methodology, the unknown signals in the remotely-sensed water balance variables, and the variable time shift across different years between the Mekong Basin upstream and its estuary downstream.
The proposed WBS approach using upstream-averaged GPS-S could be further expected to estimate the discharge at a sub-basin scale in addition to achieving at a higher temporal scale since the GPS VCD also offer relatively good precision at a daily temporal scale.

Author Contributions

H.S.F. designed the research, gathered data, conducted experiment, obtained funding, supervised the formal analysis, and wrote the manuscript, including review and editing. L.Z. conducted the entire formal data analysis. Y.L. performed GPS data post-processing and visualization. Z.M. conducted GRACE data post-processing and visualization. R.T. and F.Z. gave valuable advice, review, and editing. All authors have read and agreed to the published version of the manuscript.

Funding

The National Natural Science Foundation of China (NSFC) (Grant No.: 41974003 and Grant No.: 41674007) funded this research.

Acknowledgments

We acknowledge the GPS raw observations provided by the Crustal Movement Observation Network of China. The estuarine discharge data were provided and purchased from the Mekong River Commission (MRC), using NSFC Grant No.: 41374010.

Conflicts of Interest

The authors declare no conflict of interest.

References

  1. Sichangi, A.; Wang, L.; Yang, K.; Chen, D.; Wang, Z.; Li, X.; Zhou, J.; Liu, W.; Kuria, D. Estimating continental river basin discharges using multiple remote sensing data sets. Remote Sens. Environ. 2016, 179, 36–53. [Google Scholar] [CrossRef] [Green Version]
  2. Dai, A.; Qian, T.; Trenberth, K.E.; Milliman, J.D. Changes in Continental Freshwater Discharge from 1948 to 2004. J. Clim. 2009, 22, 2773–2792. [Google Scholar] [CrossRef]
  3. Adamson, P.; Bird, J. The Mekong: A Drought-prone Tropical Environment? Int. J. Water Resour. Dev. 2010, 26, 579–594. [Google Scholar] [CrossRef]
  4. Kreins, P.; Henseler, M.; Anter, J.; Herrmann, F.; Wendland, F. Quantification of Climate Change Impact on Regional Agricultural Irrigation and Groundwater Demand. Water Resour. Manag. 2015, 29, 3585–3600. [Google Scholar] [CrossRef]
  5. Pavelic, P.; Srisuk, K.; Saraphirom, P.; Nadee, S.; Pholkern, K.; Chusanathas, S.; Munyou, S.; Tangsutthinon, T.; Intarasut, T.; Smakhtin, V. Balancing-out floods and droughts: Opportunities to utilize floodwater harvesting and groundwater storage for agricultural development in Thailand. J. Hydrol. 2012, 470, 55–64. [Google Scholar] [CrossRef]
  6. Thilakarathne, M.; Sridhar, V. Characterization of future drought conditions in the Lower Mekong River Basin. Weather Clim. Extrem. 2017, 17, 47–58. [Google Scholar] [CrossRef]
  7. Fekete, B.M.; Robarts, R.D.; Kumagai, M.; Nachtnebel, H.-P.; Odada, E.; Zhulidov, A.V. Time for in situ renaissance. Science 2015, 349, 685–686. [Google Scholar] [CrossRef]
  8. Dai, A.; Trenberth, K.E. Estimates of freshwater discharge from continents: Latitudinal and seasonal variations. J. Hydrometeorol. 2002, 3, 660–687. [Google Scholar] [CrossRef] [Green Version]
  9. Gleason, C.J.; Smith, L.C. Toward global mapping of river discharge using satellite images and at-many-stations hydraulic geometry. Proc. Natl. Acad. Sci. USA 2014, 111, 4788–4791. [Google Scholar] [CrossRef] [Green Version]
  10. Overton, I. Modelling floodplain inundation on a regulated river: Integrating GIS, remote sensing and hydrological models. River Res. Appl. 2005, 21, 991–1001. [Google Scholar] [CrossRef]
  11. Tucker, C.J. Red and photographic infrared linear combinations for monitoring vegetation. Remote Sens. Environ. 1979, 8, 127–150. [Google Scholar] [CrossRef] [Green Version]
  12. Sobrino, J.A.; Jimenez, J.C.; Paolini, L. Land surface temperature retrieval from LANDSAT TM 5. Remote Sens. Environ. 2004, 90, 434–440. [Google Scholar] [CrossRef]
  13. Fok, H.S.; He, Q. Water Level Reconstruction Based on Satellite Gravimetry in the Yangtze River Basin. ISPRS Int. J. Geo Inf. 2018, 7, 286. [Google Scholar] [CrossRef] [Green Version]
  14. Birkinshaw, S.J.; Moore, P.; Kilsby, C.; O’Donnell, G.M.; Hardy, A.; Berry, P.A.M. Daily discharge estimation at ungauged river sites using remote sensing. Hydrol. Process. 2012, 28, 1043–1054. [Google Scholar] [CrossRef]
  15. Zhou, L.; Fok, H.S.; Ma, Z.; Chen, Q. Upstream Remotely-Sensed Hydrological Variables and Their Standardization for Surface Runoff Reconstruction and Estimation of the Entire Mekong River Basin. Remote Sens. 2019, 11, 1064. [Google Scholar] [CrossRef] [Green Version]
  16. Brakenridge, G.R.; Cohen, S.; Kettner, A.J.; De Groeve, T.; Nghiem, S.; Syvitski, J.P.; Fekete, B.M. Calibration of satellite measurements of river discharge using a global hydrology model. J. Hydrol. 2012, 475, 123–136. [Google Scholar] [CrossRef]
  17. Papa, F.; Prigent, C.; Rossow, W.B. Monitoring Flood and Discharge Variations in the Large Siberian Rivers From a Multi-Satellite Technique. Surv. Geophys. 2008, 29, 297–317. [Google Scholar] [CrossRef]
  18. Biancamaria, S.; Frappart, F.; Leleu, A.-S.; Marieu, V.; Blumstein, D.; Desjonquères, J.-D.; Boy, F.; Sottolichio, A.; Valle-Levinson, A. Satellite radar altimetry water elevations performance over a 200 m wide river: Evaluation over the Garonne River. Adv. Space Res. 2017, 59, 128–146. [Google Scholar] [CrossRef] [Green Version]
  19. Tapley, B.D.; Bettadpur, S.; Ries, J.C.; Thompson, P.F.; Watkins, M.M. GRACE Measurements of Mass Variability in the Earth System. Science 2004, 305, 503–505. [Google Scholar] [CrossRef] [Green Version]
  20. Han, S.-C.; Kim, H.; Yeo, I.-Y.; Yeh, P.J.-F.; Oki, T.; Seo, K.-W.; Alsdorf, D.; Luthcke, S.B. Dynamics of surface water storage in the Amazon inferred from measurements of inter-satellite distance change. Geophys. Res. Lett. 2009, 36, 09403. [Google Scholar] [CrossRef] [Green Version]
  21. Sproles, E.; Leibowitz, S.G.; Reager, J.T.; Wigington, P.J.; Famiglietti, J.; Patil, S. GRACE storage-runoff hystereses reveal the dynamics of regional watersheds. Hydrol. Earth Syst. Sci. 2015, 19, 3253–3272. [Google Scholar] [CrossRef] [Green Version]
  22. Jones, P.D.; Hulme, M. Calculating regional climatic time series for temperature and precipitation: Methods and illustrations. Int. J. Clim. 1996, 16, 361–377. [Google Scholar] [CrossRef]
  23. Fok, H.S.; He, Q.; Chun, K.P.; Zhou, Z.; Chu, T. Application of ENSO and Drought Indices for Water Level Reconstruction and Prediction: A Case Study in the Lower Mekong River Estuary. Water 2018, 10, 58. [Google Scholar] [CrossRef] [Green Version]
  24. Wu, X.; Heflin, M.B.; Ivins, E.R.; Argus, D.F.; Webb, F.H. Large-scale global surface mass variations inferred from GPS measurements of load-induced deformation. Geophys. Res. Lett. 2003, 30. [Google Scholar] [CrossRef] [Green Version]
  25. Fu, Y.; Argus, D.F.; Landerer, F. GPS as an independent measurement to estimate terrestrial water storage variations in Washington and Oregon. J. Geophys. Res. Solid Earth 2015, 120, 552–566. [Google Scholar] [CrossRef]
  26. Fok, H.S.; Liu, Y. An Improved GPS-Inferred Seasonal Terrestrial Water Storage Using Terrain-Corrected Vertical Crustal Displacements Constrained by GRACE. Remote Sens. 2019, 11, 1433. [Google Scholar] [CrossRef] [Green Version]
  27. Tregoning, P.; Watson, C.S.; Ramillien, G.; McQueen, H.; Zhang, J. Detecting hydrologic deformation using GRACE and GPS. Geophys. Res. Lett. 2009, 36. [Google Scholar] [CrossRef] [Green Version]
  28. Fu, Y.; Freymueller, J.; Jensen, T.E. Seasonal hydrological loading in southern Alaska observed by GPS and GRACE. Geophys. Res. Lett. 2012, 39. [Google Scholar] [CrossRef] [Green Version]
  29. Zhan, W.; Li, F.; Hao, W.; Yan, J. Regional characteristics and influencing factors of seasonal vertical crustal motions in Yunnan, China. Geophys. J. Int. 2017, 210, 1295–1304. [Google Scholar] [CrossRef]
  30. Ferreira, V.; Montecino, H.; Ndehedehe, C.E.; Del Rio, R.A.; Cuevas, A.; De Freitas, S.R.C. Determining seasonal displacements of Earth’s crust in South America using observations from space-borne geodetic sensors and surface-loading models. Earth Planets Space 2019, 71, 84. [Google Scholar] [CrossRef] [Green Version]
  31. Chanard, K.; Avouac, J.-P.; Ramillien, G.; Genrich, J. Modeling deformation induced by seasonal variations of continental water in the Himalaya region: Sensitivity to Earth elastic structure. J. Geophys. Res. Solid Earth 2014, 119, 5097–5113. [Google Scholar] [CrossRef] [Green Version]
  32. Pan, Y.; Shen, W.; Shum, C.; Pan, Y. Spatially varying surface seasonal oscillations and 3-D crustal deformation of the Tibetan Plateau derived from GPS and GRACE data. Earth Planet. Sci. Lett. 2018, 502, 12–22. [Google Scholar] [CrossRef]
  33. Peixoto, J.P.; Oort, A.H.; Covey, C.; Taylor, K. Physics of Climate. Phys. Today 1992, 45, 67. [Google Scholar] [CrossRef]
  34. MRC (Mekong River Commission). Overview of the Hydrology of the Mekong Basin; Mekong River Commission: Vientiane, Laos, 2005; Volume 82. [Google Scholar]
  35. Manh, N.V.; Dung, N.V.; Hung, N.N.; Merz, B.; Apel, H. Large-scale suspended sediment transport and sediment deposition in the Mekong Delta. Hydrol. Earth Syst. Sci. 2014, 18, 3033–3053. [Google Scholar] [CrossRef] [Green Version]
  36. Nowacki, D.J.; Ogston, A.S.; Nittrouer, C.A.; Fricke, A.; Van, P.D.T.; Tri, V.P.D. Sediment dynamics in the lower M ekong R iver: Transition from tidal river to estuary. J. Geophys. Res. Oceans 2015, 120, 6363–6383. [Google Scholar] [CrossRef] [Green Version]
  37. Dang, T.D.; Cochrane, T.A.; Arias, M.E.; Tri, V.P.D. Future hydrological alterations in the Mekong Delta under the impact of water resources development, land subsidence and sea level rise. J. Hydrol. Reg. Stud. 2018, 15, 119–133. [Google Scholar] [CrossRef]
  38. Arias, M.E.; Cochrane, T.A.; Piman, T.; Kummu, M.; Caruso, B.S.; Killeen, T.J. Quantifying changes in flooding and habitats in the Tonle Sap Lake (Cambodia) caused by water infrastructure development and climate change in the Mekong Basin. J. Environ. Manag. 2012, 112, 53–66. [Google Scholar] [CrossRef]
  39. Yang, R.; Zhang, W.-K.; Gui, S.; Tao, Y.; Cao, J. Rainy season precipitation variation in the Mekong River basin and its relationship to the Indian and East Asian summer monsoons. Clim. Dyn. 2018, 52, 5691–5708. [Google Scholar] [CrossRef] [Green Version]
  40. Pokhrel, Y.; Shin, S.; Lin, Z.; Yamazaki, D.; Qi, J. Potential Disruption of Flood Dynamics in the Lower Mekong River Basin Due to Upstream Flow Regulation. Sci. Rep. 2018, 8, 17767. [Google Scholar] [CrossRef]
  41. Tarpanelli, A.; Amarnath, G.; Brocca, L.; Massari, C.; Moramarco, T. Discharge estimation and forecasting by MODIS and altimetry data in Niger-Benue River. Remote Sens. Environ. 2017, 195, 96–106. [Google Scholar] [CrossRef]
  42. Li, D.; Long, D.; Zhao, J.; Lu, H.; Hong, Y. Observed changes in flow regimes in the Mekong River basin. J. Hydrol. 2017, 551, 217–232. [Google Scholar] [CrossRef]
  43. Li, X.; Liu, J.P.; Saito, Y.; Nguyen, V.L. Recent evolution of the Mekong Delta and the impacts of dams. Earth Sci. Rev. 2017, 175, 1–17. [Google Scholar] [CrossRef]
  44. Ferguson, J.W.; Healey, M.; Dugan, P.; Barlow, C. Potential Effects of Dams on Migratory Fish in the Mekong River: Lessons from Salmon in the Fraser and Columbia Rivers. Environ. Manag. 2010, 47, 141–159. [Google Scholar] [CrossRef] [PubMed]
  45. Onishi, K. Reassessing Water Security in the Mekong: The Chinese Rapprochement with Southeast Asia. J. Nat. Resour. Policy Res. 2011, 3, 393–412. [Google Scholar] [CrossRef]
  46. Adamson, P.T.; Rutherfurd, I.D.; Peel, M.C.; Conlan, I.A. The Hydrology of the Mekong River. In The Mekong; Elsevier BV: Amsterdam, The Netherlands, 2009; pp. 53–76. [Google Scholar]
  47. Hecht, J.S.; Lacombe, G.; Arias, M.E.; Dang, T.D.; Piman, T. Hydropower dams of the Mekong River basin: A review of their hydrological impacts. J. Hydrol. 2019, 568, 285–300. [Google Scholar] [CrossRef]
  48. Liu, Z.; Ostrenga, D.; Teng, W.; Kempler, S. Tropical Rainfall Measuring Mission (TRMM) Precipitation Data and Services for Research and Applications. Bull. Am. Meteorol. Soc. 2012, 93, 1317–1325. [Google Scholar] [CrossRef] [Green Version]
  49. Huffman, G.J.; Adler, R.F.; Bolvin, D.T.; Gu, G.; Nelkin, E.J.; Bowman, K.P.; Hong, Y.; Stocker, E.F.; Wolff, D.B. The TRMM Multi-satellite Precipitation Analysis: Quasi-Global, Multi-Year, Combined-Sensor Precipitation Estimates at Fine Scale. J. Hydrometeorol. 2007, 8, 38–55. [Google Scholar] [CrossRef]
  50. Mu, Q.; Zhao, M.; Running, S.W. Improvements to a MODIS global terrestrial evapotranspiration algorithm. Remote. Sens. Environ. 2011, 115, 1781–1800. [Google Scholar] [CrossRef]
  51. Save, H.; Bettadpur, S.; Tapley, B.D. High-resolution CSR GRACE RL05 mascons. J. Geophys. Res. Solid Earth 2016, 121, 7547–7569. [Google Scholar] [CrossRef]
  52. Wu, X.; Ray, J.; Van Dam, T. Geocenter motion and its geodetic and geophysical implications. J. Geodyn. 2012, 58, 44–61. [Google Scholar] [CrossRef]
  53. Cheng, M.; Ries, J. The unexpected signal in GRACE estimates of C20. J. Geod. 2017, 91, 897–914. [Google Scholar] [CrossRef]
  54. Swenson, S.; Wahr, J. Post-processing removal of correlated errors in GRACE data. Geophys. Res. Lett. 2006, 33. [Google Scholar] [CrossRef]
  55. Wahr, J.; Molenaar, M.; Bryan, F. Time variability of the Earth’s gravity field: Hydrological and oceanic effects and their possible detection using GRACE. J. Geophys. Res. Solid Earth 1998, 103, 30205–30229. [Google Scholar] [CrossRef]
  56. Herring, T.; King, R.; McClusky, S. GAMIT Reference Manual, Release 10.4; Massachusetts Institute Technology Cambridge: Cambridge, MA, USA, 2010; Available online: http://www-gpsg.mit.edu/~simon/gtgk/GAMIT_Ref.pdf (accessed on 10 July 2016).
  57. Böhm, J.; Moeller, G.; Schindelegger, M.; Pain, G.; Weber, R. Development of an improved empirical model for slant delays in the troposphere (GPT2w). GPS Solut. 2014, 19, 433–441. [Google Scholar] [CrossRef] [Green Version]
  58. Petit, G.; Luzum, B. IERS Conventions (2010); Bureau International Des Poids et Mesures Sevres (France). 2010. Available online: https://www.iers.org (accessed on 12 May 2019).
  59. Zhu, Z.; Zhou, X.; Deng, L.; Wang, K.; Zhou, B. Quantitative analysis of geophysical sources of common mode component in CMONOC GPS coordinate time series. Adv. Space Res. 2017, 60, 2896–2909. [Google Scholar] [CrossRef]
  60. Haines, B.J.; Bertiger, W.I.; Desai, S.D.; Harvey, N.; Sibois, A.; Weiss, J.P.; Bar-Sever, Y.E. Realizing a terrestrial reference frame using the Global Positioning System. J. Geophys. Res. Solid Earth 2015, 120, 5911–5939. [Google Scholar] [CrossRef] [Green Version]
  61. Wahr, J.; Khan, S.A.; Van Dam, T.; Liu, L.; Van Angelen, J.H.; Broeke, M.R.V.D.; Meertens, C. The use of GPS horizontals for loading studies, with applications to northern California and southeast Greenland. J. Geophys. Res. Solid Earth 2013, 118, 1795–1806. [Google Scholar] [CrossRef] [Green Version]
  62. Bevis, M.; Kendrick, E.; Cser, A.; Smalley, R., Jr. Geodetic measurement of the local elastic response to the changing mass of water in Lago Laja, Chile. Phys. Earth Planet. Inter. 2004, 141, 71–78. [Google Scholar] [CrossRef]
  63. Pokhrel, Y.; Burbano, M.; Roush, J.; Kang, H.; Sridhar, V.; Hyndman, D.W. A Review of the Integrated Effects of Changing Climate, Land Use, and Dams on Mekong River Hydrology. Water 2018, 10, 266. [Google Scholar] [CrossRef] [Green Version]
  64. Veldkamp, T.I.; Eisner, S.; Wada, Y.; Aerts, J.C.J.H.; Ward, P.J. Sensitivity of water scarcity events to ENSO-driven climate variability at the global scale. Hydrol. Earth Syst. Sci. 2015, 19, 4081–4098. [Google Scholar] [CrossRef] [Green Version]
  65. Gupta, H.V.; Kling, H.; Yilmaz, K.K.; Martinez, G.F. Decomposition of the mean squared error and NSE performance criteria: Implications for improving hydrological modelling. J. Hydrol. 2009, 377, 80–91. [Google Scholar] [CrossRef] [Green Version]
Figure 1. Indochina Peninsula including Yunnan Province (China) (bounded in grey) covered with GPS stations (purple triangle) and Mekong Basin (bounded in blue) with in-situ hydrologic stations (red dot) situated in the basin estuary.
Remotesensing 12 01767 g001
Figure 2. Runoff generated from the sum of My Thuan and Can Tho stations, and the sum of Tan Chau and Chau Doc stations.
Remotesensing 12 01767 g002
Figure 3. The filtered (in red) and unfiltered (in blue) time series of vertical crustal displacement (left) and their corresponding spectra (right) for YNSD and YNJD GPS stations.
Remotesensing 12 01767 g003
Figure 4. In-situ runoff time series compared to averaged (a,b) remotely-sensed precipitation (TRMM-P) and evapotranspiration (MODIS-ET), (c,d) GRACE water storage (GRACE-S) from CSR RL06 with a 350-km Gaussian Filtering (G350) and its mascon solution, and (e,f) GPS-inferred water storage (GPS-S) from CSR RL06 with a 350-km Gaussian Filtering (G350) and its mascon solution at Can Tho and My Thuan (CT-MT) station.
Remotesensing 12 01767 g004
Figure 5. Reconstructed runoff based on remotely-sensed (a) precipitation (TRMM-P), (b) evapotranspiration (MODIS-ET), (c) water storage (GRACE-S), and (d) GPS-inferred water storage (GPS-S) with a 350-km Gaussian Filtering (G350) from CSR RL06 solution, and (e) water storage (GRACE-S) and (f) GPS-inferred water storage (GPS-S) from CSR RL06 mascon solution (Mascon) at Can Tho and My Thuan (CT-MT) station.
Remotesensing 12 01767 g005
Figure 6. Reconstructed runoff based on the water balance standardization (WBS) approach for (a,b) GRACE water storage (GRACE-S) from CSR RL06 with a 350-km Gaussian filtering (G350) and its mascon solution, and (c,d) GPS-inferred water storage (GPS-S) from CSR RL06 with a 350-km Gaussian filtering (G350) and its mascon solution at Can Tho and My Thuan (CT-MT) station.
Remotesensing 12 01767 g006
Table 1. Determined average slope α ¯ and offset β ¯ along with their respective uncertainties for converting GPS VCD into water storage.
GPS S α ¯ (/mon) β ¯ (mm/mon)
RL06-G350−8.4453 ± 0.739414.6906 ± 5.6426
RL06-mascon−10.6587 ± 0.83926.4034 ± 6.2864
Table 2. Internal assessment for reconstructed runoff at Can Tho–My Thuan (CT-MT), and external assessment for estimated runoff at Tan Chau–Chau Doc (TC-CD) using the determined parameters during runoff reconstruction at Can Tho–My Thuan (CT-MT).
StationVariablesPCCNRMSENSE
CT-MT station reconstructionRSHMVsTRMM-P0.9450.0960.893
MODIS-ET0.9200.1140.847
GRACE-SRL06-G3500.9330.1050.871
RL06-mascon0.9380.1010.879
GPS-SRL06-G3500.9450.0960.892
RL06-mascon0.9420.0970.888
WBS-GRACERL06-G3500.9650.0760.932
RL06-mascon0.9650.0760.932
WBS-GPSRL06-G3500.9740.0670.948
RL06-mascon0.9740.0660.950
CT-MT station estimates TC-CD stationRSHMVsTRMM-P0.9210.1350.824
MODIS-ET0.9350.1200.860
GRACE-SRL06-G3500.9320.1240.851
RL06-mascon0.9270.1290.839
GPS-SRL06-G3500.9150.1400.810
RL06-mascon0.9100.1440.800
WBS-GRACERL06-G3500.9540.1080.888
RL06-mascon0.9540.1070.889
WBS-GPSRL06-G3500.9610.1010.900
RL06-mascon0.9610.1010.900
Table 3. Internal assessment for reconstructed runoff at Tan Chau–Chau Doc (TC-CD), and external assessment for estimated runoff at Can Tho–My Thuan (CT-MT) using the determined parameters during runoff reconstruction at Tan Chau–Chau Doc (TC-CD).
StationVariablesPCCNRMSENSE
TC-CD station reconstructionRSHMVsTRMM-P0.9210.1250.849
MODIS-ET0.9350.1140.874
GRACE-SRL06-G3500.9320.1160.869
RL06-mascon0.9270.1200.860
GPS-SRL06-G3500.9150.1300.837
RL06-mascon0.9100.1330.828
WBS-GRACERL06-G3500.9660.0830.933
RL06-mascon0.9640.0850.929
WBS-GPSRL06-G3500.9670.0820.935
RL06-mascon0.9660.0820.934
TC-CD station estimates CT-MT stationRSHMVsTRMM-P0.9450.1040.874
MODIS-ET0.9200.1180.837
GRACE-SRL06-G3500.9330.1100.857
RL06-mascon0.9380.1080.863
GPS-SRL06-G3500.9450.1040.872
RL06-mascon0.9420.1060.867
WBS-GRACERL06-G3500.9560.0920.901
RL06-mascon0.9550.0920.900
WBS-GPSRL06-G3500.9590.0890.907
RL06-mascon0.9590.0890.907

